Figure 4.
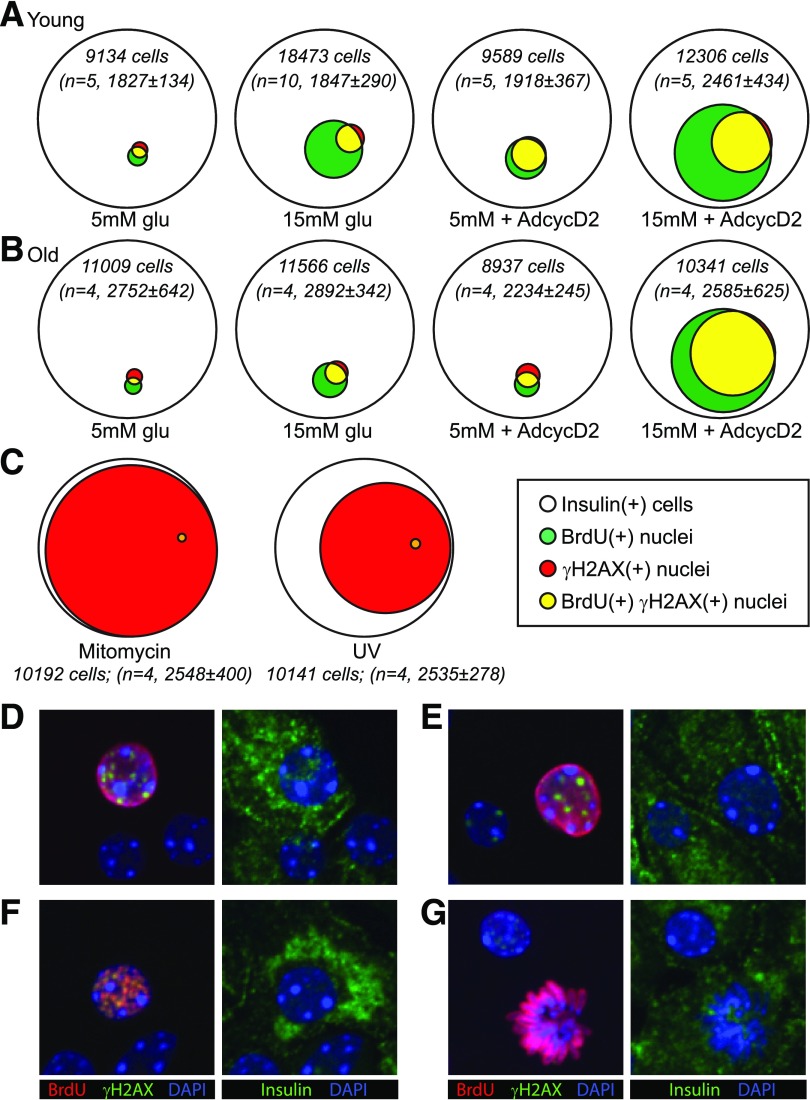
γH2AX mostly labels a subset of BrdU-labeled cells. Quantitative Venn diagrams were used to generate a visual representation of the data shown in Figs. 2 and 3. Diagrams represent the total number (sum of all replicates) of insulin(+) cells (white circles) that labeled with BrdU (green), γH2AX (red), and both labels (yellow) under different culture conditions. The total number of insulin(+) cells counted and the number of biological replicates for each condition are included for each diagram (in italics). A: In young islet cells, 15 mmol/L glucose and Ad-cyclin D2 increased both the BrdU(+) and γH2AX fractions. Insulin(+) nuclei labeled for γH2AX were mostly a subset of the BrdU-labeled nuclei, in both basal and stimulated conditions. B: β-Cells from older mice behaved similarly to young β-cells, except that a higher fraction of BrdU(+) cells were also γH2AX(+) under 15 mmol/L glucose stimulation both with and without Ad-cyclin D2, and older β-cells required both glucose and Ad-cyclin D2 to meaningfully increase the fraction of BrdU-labeled cells. C: Venn depiction of the data in Fig. 3 demonstrates visually that DNA damage exposure did not increase, and in fact decreased, the frequency of BrdU(+) and colabeled nuclei. Confocal microscopy of cultures (15 mmol/L glucose) showed many examples of smoothly labeled BrdU(+) nuclei that also had γH2AX puncta (D and E) and some examples of nuclei with punctate labeling of both BrdU and γH2AX (F). Active mitoses generally had no γH2AX label (G). AdcycD2, Ad-cyclin D2; glu, glucose.

