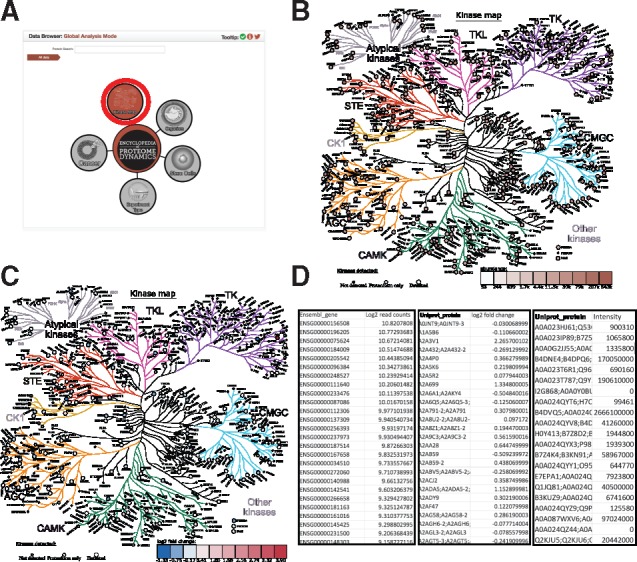
Fig. 1.

The Kinoviewer. (A) The graphical navigation: The KinoViewer access point from the EPD navigation (B) The KinoViewer – Copy numbers: Example of the KinoViewer visualization based on Copy number input. (C) The KinoViewer – log2 fold change: Example of the KinoViewer visualization based on log2 transformed ratios. (D) Example Data: Input data for the KinoViewer showing 3 different examples: transcript data mapped Ensembl Gene with log2 read counts, Protein data with fold change and protein data with intensity values
