

Abstract
Background
Tobacco use is the largest single preventable cause of death and disease worldwide. Standardised tobacco packaging is an intervention intended to reduce the promotional appeal of packs and can be defined as packaging with a uniform colour (and in some cases shape and size) with no logos or branding, apart from health warnings and other government‐mandated information, and the brand name in a prescribed uniform font, colour and size. Australia was the first country to implement standardised tobacco packaging between October and December 2012, France implemented standardised tobacco packaging on 1 January 2017 and several other countries are implementing, or intending to implement, standardised tobacco packaging.
Objectives
To assess the effect of standardised tobacco packaging on tobacco use uptake, cessation and reduction.
Search methods
We searched MEDLINE, Embase, PsycINFO and six other databases from 1980 to January 2016. We checked bibliographies and contacted study authors to identify additional peer‐reviewed studies.
Selection criteria
Primary outcomes included changes in tobacco use prevalence incorporating tobacco use uptake, cessation, consumption and relapse prevention. Secondary outcomes covered intermediate outcomes that can be measured and are relevant to tobacco use uptake, cessation or reduction. We considered multiple study designs: randomised controlled trials, quasi‐experimental and experimental studies, observational cross‐sectional and cohort studies. The review focused on all populations and people of any age; to be included, studies had to be published in peer‐reviewed journals. We examined studies that assessed the impact of changes in tobacco packaging such as colour, design, size and type of health warnings on the packs in relation to branded packaging. In experiments, the control condition was branded tobacco packaging but could include variations of standardised packaging.
Data collection and analysis
Screening and data extraction followed standard Cochrane methods. We used different 'Risk of bias' domains for different study types. We have summarised findings narratively.
Main results
Fifty‐one studies met our inclusion criteria, involving approximately 800,000 participants. The studies included were diverse, including observational studies, between‐ and within‐participant experimental studies, cohort and cross‐sectional studies, and time‐series analyses. Few studies assessed behavioural outcomes in youth and non‐smokers. Five studies assessed the primary outcomes: one observational study assessed smoking prevalence among 700,000 participants until one year after standardised packaging in Australia; four studies assessed consumption in 9394 participants, including a series of Australian national cross‐sectional surveys of 8811 current smokers, in addition to three smaller studies. No studies assessed uptake, cessation, or relapse prevention. Two studies assessed quit attempts. Twenty studies examined other behavioural outcomes and 45 studies examined non‐behavioural outcomes (e.g. appeal, perceptions of harm). In line with the challenges inherent in evaluating standardised tobacco packaging, a number of methodological imitations were apparent in the included studies and overall we judged most studies to be at high or unclear risk of bias in at least one domain. The one included study assessing the impact of standardised tobacco packaging on smoking prevalence in Australia found a 3.7% reduction in odds when comparing before to after the packaging change, or a 0.5 percentage point drop in smoking prevalence, when adjusting for confounders. Confidence in this finding is limited, due to the nature of the evidence available, and is therefore rated low by GRADE standards. Findings were mixed amongst the four studies assessing consumption, with some studies finding no difference and some studies finding evidence of a decrease; certainty in this outcome was rated very low by GRADE standards due to the limitations in study design. One national study of Australian adult smoker cohorts (5441 participants) found that quit attempts increased from 20.2% prior to the introduction of standardised packaging to 26.6% one year post‐implementation. A second study of calls to quitlines provides indirect support for this finding, with a 78% increase observed in the number of calls after the implementation of standardised packaging. Here again, certainty is low. Studies of other behavioural outcomes found evidence of increased avoidance behaviours when using standardised packs, reduced demand for standardised packs and reduced craving. Evidence from studies measuring eye‐tracking showed increased visual attention to health warnings on standardised compared to branded packs. Corroborative evidence for the latter finding came from studies assessing non‐behavioural outcomes, which in general found greater warning salience when viewing standardised, than branded packs. There was mixed evidence for quitting cognitions, whereas findings with youth generally pointed towards standardised packs being less likely to motivate smoking initiation than branded packs. We found the most consistent evidence for appeal, with standardised packs rating lower than branded packs. Tobacco in standardised packs was also generally perceived as worse‐tasting and lower quality than tobacco in branded packs. Standardised packaging also appeared to reduce misperceptions that some cigarettes are less harmful than others, but only when dark colours were used for the uniform colour of the pack.
Authors' conclusions
The available evidence suggests that standardised packaging may reduce smoking prevalence. Only one country had implemented standardised packaging at the time of this review, so evidence comes from one large observational study that provides evidence for this effect. A reduction in smoking behaviour is supported by routinely collected data by the Australian government. Data on the effects of standardised packaging on non‐behavioural outcomes (e.g. appeal) are clearer and provide plausible mechanisms of effect consistent with the observed decline in prevalence. As standardised packaging is implemented in different countries, research programmes should be initiated to capture long term effects on tobacco use prevalence, behaviour, and uptake. We did not find any evidence suggesting standardised packaging may increase tobacco use.
Keywords: Humans, Prevalence, Product Labeling, Product Labeling/methods, Product Labeling/standards, Product Packaging, Product Packaging/methods, Product Packaging/standards, Smoking, Smoking/epidemiology, Smoking Cessation, Smoking Cessation/statistics & numerical data, , Tobacco Use, Tobacco Use/epidemiology, Tobacco Use/prevention & control
Plain language summary
Can the use of standardised packaging for tobacco products reduce the use of tobacco?
Background
Tobacco use kills more people worldwide than any other preventable cause of death. The best way to reduce tobacco use is by stopping people from starting to use tobacco and encouraging and helping existing users to stop. This can be done by introducing policies that can reach a wide number of people in a country, together with offering individual treatment and support to individuals who are already using tobacco to help them to stop. Many countries have introduced bans on tobacco advertising but have not controlled the look of the tobacco pack itself. Tobacco packs can be colourful and attractive, with exciting new shapes and sizes. Standardised tobacco packaging is a government policy which removes these bright designs by, for example, only allowing tobacco packs to be in one colour, shape or size. Standardised packaging generally involves the use of the same uniform colour on all tobacco packs, with no brand imagery, and the brand name written in a specified font, colour and size. Health warnings and other information that governments wish to put on the packs can remain. Australia was the first country to introduce standardised tobacco packaging by December 2012. France was the second by January 2017. Several other countries are introducing standardised packaging or planning to do so. We examined whether standardised packaging reduces tobacco use.
Study characteristics
We searched nine databases for articles evaluating standardised packaging that had been already reviewed by academics and published before January 2016. We also checked references in those papers to other studies and contacted the authors where necessary.
Key results
We found 51 studies involving approximately 800,000 participants. These studies varied considerably. Some studies focused on the effect of standardised packaging in Australia, and included looking at overall smoking levels, whether smokers altered their behaviour such as by cutting down the number of cigarettes they smoked, and whether smokers were making more quit attempts. We also included experiments in which people used or viewed standardised tobacco packs and examined their responses, compared to when they were viewing branded packs. We also included studies that assessed people’s eye movements when they looked at different packs and how willing people were to buy, and how much they were willing to pay for, standardised compared to branded packs.
Only five studies looked at our key outcomes. One study in Australia looked at data from 700,000 people before and after standardised packaging was introduced. This study found that there was a half a percentage point drop in the proportion of people who used tobacco after the introduction of standardised packaging, compared to before, when adjusting for other factors which could affect this. Four other studies looked at whether current smokers changed the number of cigarettes they smoked. Two studies from Australia looked at this, one using surveys which included 8811 current smokers, and found no change in the number of cigarettes smoked. The three smaller studies found mixed results. Two further studies looked at quit attempts and observed increases in these in Australia after standardised packaging was introduced. The remainder of the studies looked at other outcomes, and the most consistent finding was that standardised packaging reduced how appealing people found the packs compared with branded packs. No studies reported the number of people who quit using tobacco, the number of people who started using tobacco, or the number of people who returned to using tobacco after quitting.
Quality of the evidence
Certainty in these findings is limited for several reasons, including the difficulties involved in studying national policies like standardised packaging. However, findings suggesting standardised packaging may decrease tobacco use are supported by routine data from the Australian government and studies looking at other outcomes. For example, in our included studies people consistently found standardised packs less appealing than branded packs. We did not find any evidence suggesting standardised packaging may increase tobacco use.
Summary of findings
Summary of findings for the main comparison. Effects of plain tobacco packaging design on smoking behaviour.
| Effects of standardised tobacco packaging design on smoking behaviour | |||
|
Patient or population: General population for prevalence outcomes. Adult smokers for tobacco consumption outcomes. Setting: Community, cross‐sectional and controlled experimental settings Intervention: Standardised tobacco packaging Comparison: Regular branded tobacco packaging | |||
| Outcomes | Impact | № of participants (studies) | Quality of the evidence (GRADE) |
| Prevalence of tobacco use assessed with: Self‐report up to 1 year post‐policy introduction | 1 study found a 3.66% (P = 0.0061) reduction in odds of smoking prevalence when comparing before to after the implementation of standardised packaging in Australia, when adjusting for confounders (β = ‐0.0372, 95% CI ‐0.0638 to 0.0106). This is equivalent to a drop of 0.5 of a percentage point in smoking prevalence around the time of the change | 700,000 (1 observational study) 2 | ⊕⊕⊝⊝ LOW 1 |
| Change in tobacco consumption among smokers assessed with: Self‐report and volume of smoke inhaled | 1 study using a series of national cross‐sectional surveys of 8811 current smokers evaluated consumption at the pre‐standardised packaging phase in Australia and 2 subsequent time periods: the transition phase during which standardised packages were being introduced and 1 year post‐standardised packaging phase. The number of cigarettes consumed remained stable at all time points (approximately 15 among daily smokers). 3 further studies with smaller samples also evaluated consumption. A cross‐sectional survey presented only descriptives for a sample of cigar and cigarillo smokers in Australia. 2 experimental studies in the UK evaluated branded or standardised packs and reported small reductions in the mean number of cigarettes smoked per day: 1 found that cigarette consumption did not differ significantly during the 24‐hour period between those smoking from the branded pack (and similarly found no significant difference in volume of smoke inhaled), and another found that participants reported that cigarette consumption was significantly lower when using the standardised compared with participants' own branded pack | 9394 (4 observational studies) | ⊕⊝⊝⊝ VERY LOW 3, 4 |
| Attempts to quit smoking assessed with: self‐report | 1 national study of Australian adult smoker cohorts found that quit attempts increased from 20.2% prior to the introduction of standardised packaging to 26.6% 1 year post‐implementation. A second study of calls to quitlines in Australia provides indirect support for this finding; a 78% increase was observed in the number of calls 4 weeks after the implementation of standardised packaging | 5441 (2 observational studies) 5 | ⊕⊕⊝⊝ LOW 1 |
| Uptake ‐ not measured | ‐ | ‐ | ‐ |
| Relapse ‐ not measured | ‐ | ‐ | ‐ |
| Cessation ‐ not measured | ‐ | ‐ | ‐ |
| *The risk in the intervention group (and its 95% confidence interval) is based on the assumed risk in the comparison group and the relative effect of the intervention (and its 95% CI) CI: Confidence interval; RR: Risk ratio; OR: Odds ratio; | |||
| GRADE Working Group grades of evidence High quality: We are very confident that the true effect lies close to that of the estimate of the effect Moderate quality: We are moderately confident in the effect estimate: The true effect is likely to be close to the estimate of the effect, but there is a possibility that it is substantially different Low quality: Our confidence in the effect estimate is limited: The true effect may be substantially different from the estimate of the effect Very low quality: We have very little confidence in the effect estimate: The true effect is likely to be substantially different from the estimate of effect | |||
1Based on observational evidence only. Though enhanced pictorial health warnings were implemented at the same time as standardised packaging, making it difficult to separate the effects, we have not downgraded further for two reasons: 1) the low GRADE already reflects the challenges in inferring causality from observational data; and 2) data on non‐behavioural outcomes provides plausible mechanisms of effect consistent with the observed decline in prevalence.
2Sample size estimated over the period of the study.
3No downgrade for risk of bias: the studies did not show meaningful change in tobacco use and so confounding is unlikely to have influenced the result.
4Downgraded one level for indirectness: large cross‐sectional survey study only included smokers at each survey wave so changes in consumption would exclude people smoking at baseline who subsequently quit.
5Sample size for national survey study.
Background
Tobacco use is the largest single preventable cause of disease and premature death worldwide, being a key causal factor in heart disease, stroke, chronic lung disease and cancers, among many other diseases. Increasing the number of tobacco users who stop is therefore a critically important health goal.
A variety of interventions have been shown to reduce adult tobacco use, including prohibitions on tobacco promotion (World Bank 1999; World Health Organization 2015). Tobacco promotion has been defined as direct advertising (broadcast and print media, billboards/outdoor and point of sale) and indirect advertising in the form of cigarette‐branded merchandise, free tobacco products and sponsorship (Henriksen 2012). Tobacco promotion has been demonstrated to increase tobacco consumption, discourage quitting and encourage relapse (National Cancer Institute 2008).
Several countries have introduced comprehensive tobacco advertising and marketing bans (World Health Organization 2015). One channel of promotion remains, however, in all countries except Australia and very recently France. This is marketing through the tobacco pack itself. There is evidence that the tobacco industry has adapted to closure of other promotional channels by increasing their focus on tobacco packaging through design aspects, price‐marketing and other innovations to promote tobacco use and discourage cessation (Freeman 2008; Wakefield 2002). Australia was the first country to introduce standardised (plain) packaging for all tobacco products doing so by December 2012. France recently (January 2017) implemented standardised packaging for cigarettes and roll‐your‐own tobacco, and the UK will fully implement standardised packaging by May 2017. Hungary, Norway, Ireland and New Zealand are in the process of adopting or implementing standardised packaging and several other countries are in the process of developing legislation to introduce this packaging change.
This review examines whether the introduction of standardised tobacco packaging can prevent tobacco uptake in children and young people and increase tobacco cessation and reduce tobacco consumption in tobacco users.
Description of the intervention
Standardised packaging is an intervention intended to reduce the promotional appeal of the pack. The exact description of standardised packaging can vary, but the World Health Organization’s Framework Convention on Tobacco Control (FCTC) Article 13 guidelines (World Health Organization 2008) have suggested a uniform colour and "nothing other than a brand name, a product name and/or manufacturer’s name, contact details and the quantity of product in the packaging, without any logos or other features apart from health warnings, tax stamps and other government‐mandated information or markings; prescribed font style and size; and standardized shape, size and materials. There should be no advertising or promotion inside or attached to the package or on individual cigarettes or other tobacco products" (WHO FCTC Article 13 guidelines). The only distinguishing feature of packs would then be the brand and product variant names, and as stated above these would be in a uniform style, colour and position (Freeman 2008).
How the intervention might work
Standardised packaging could work by removing imagery/livery on the tobacco packs which is misleading, attractive or acting as a cue to tobacco use. Standardised packaging could also serve to increase the salience of health warnings. In all these cases standardised packing could alter knowledge, attitudes and beliefs towards tobacco use, which could reduce tobacco uptake in children and young people and lead to reduction or cessation or both of tobacco use in current tobacco users.
Why it is important to do this review
The introduction of standardised packaging was recommended within the FCTC Article 11 and Article 13 guidelines (World Health Organization 2008), based on evidence around tobacco promotion in general and studies which have examined the impact of changes in packaging on knowledge, attitudes, beliefs and behaviour. A systematic review of the evidence of the literature (available up until August 2011) was published by some of the co‐authors of this review (Stead 2013). Standardised packaging was introduced across Australia by December 2012 and France by January 2017, and several other countries are now in the process of implementing standardised packaging, have indicated that they are interested in introducing a similar policy or are in the process of introducing a similar policy. The evidence base has increased markedly since the publication of the FCTC guidelines and the systematic review, and is expanding further as more studies of the impact of Australia’s introduction of standardised packaging become available.
Objectives
To assess the effect of standardised tobacco packaging on tobacco use uptake, reduction and cessation.
Methods
Criteria for considering studies for this review
Types of studies
We consider three types of study design in this review, restricted to peer‐reviewed published studies. These include randomised controlled trials (RCTs) and quasi‐experimental studies (quasi‐RCTs), observational cross‐sectional and cohort studies, and physiological studies (such as eye‐tracking and neuroimaging). Some of these study designs (e.g. eye‐tracking) were included to provide information on secondary outcomes, to provide insight into the potential mechanisms of standardised packaging.
Types of participants
This review focuses on people of any age where a study directly measures smoking uptake, cessation, or reduction behaviour or attitudes/knowledge/beliefs directly linked to uptake, quitting or reduction. We include all populations in this review, regardless of nationality, gender, socioeconomic status and ethnic group. For measures of cessation or reduction, we include all tobacco users, regardless of frequency/dependence/consumption and also recent ex‐tobacco users (quit for one year or less).
Types of interventions
We examine any studies that assess the impact of changes in tobacco packaging, such as on colour, design, and size and type of health warnings on the packs, in relation to branded packaging. The control is likely to be branded tobacco packaging but can also include variations of standardised packaging.
For this review, ‘tobacco products’ include cigarettes, loose tobacco for hand‐rolled cigarettes, cigars, cigarillos, pipe tobacco, kreteks, bidis (beedis), and also smokeless tobacco, covering snuff and chewing tobacco. ‘Packaging’ refers to the container (packet, pouch, tin) in which tobacco products are stored, but excludes the paper or leaves or other means of wrapping loose tobacco.
Types of outcome measures
To be included in the review, studies had to measure at least one of our primary or secondary outcomes, which are listed below.
Primary outcomes
The primary outcome is changes in tobacco use prevalence incorporating tobacco use uptake, tobacco use cessation, reduction in consumption and relapse prevention.
Prevalence measures include the number of people classified as current smokers (defined differently in different studies). We intended to measure cessation as people who were tobacco users at baseline who were quit at follow‐up; no studies reported on this outcome, nor did any report on relapse prevention, defined as going back to smoking after a period of abstinence. We measured consumption according to the methods reported in individual papers, most commonly cigarettes per day but also including packs per day. We planned to evaluate the impact on uptake through the proportion of children and young people reporting current tobacco use, but again no papers reported on this outcome. It should be noted that the primary outcomes considered here are not typically the primary objectives of country regulations, which instead focus on our secondary outcomes below.
Secondary outcomes
We anticipated very few studies assessing the impacts on primary outcomes for inclusion in the first version of this review. Our list of secondary outcomes therefore aims to cover potential intermediate outcomes that can be measured and are relevant to tobacco use uptake, cessation or reduction. These include two broad groups of outcome, which are described below. The potential relationships between these outcomes is illustrated in Figure 1, which is based on a model developed by the World Health Organization's International Agency for Research on Cancer (IARC 2008).
1.

Mediation model for package labelling policies (adapted from IARC 2008)
Other behavioural outcomes:
quit attempts;
forgoing cigarettes/stubbing out cigarettes;
covering the pack (avoidance/display);
eye‐tracking;
actual purchase or selection of tobacco that participants believed that they would receive.
Non‐behavioural outcomes: attitudes, perceptions and beliefs about tobacco products and their use, including:
motivation and plans to quit (including thinking about quitting);
intentions/susceptibility to use tobacco (among young people);
craving;
packaging appeal (including measures of attractiveness, taste, product quality, satisfaction, enjoyment and value);
recall, salience and/or believability of health warnings;
perceptions of harm.
We measured these outcomes according to the methods used in individual papers. We assessed outcomes over any measured time periods, given that standardised packaging for tobacco packs has only recently been introduced.
Search methods for identification of studies
We compiled the search strategy by combining tobacco‐related terms with packaging‐related terms. We adapted the terms used in the search in accordance with each database’s search terminology. The MEDLINE search strategy is contained in Appendix 1. We included studies regardless of language. We only included published, peer‐reviewed articles (see Discussion). Our searches started from 1980, as the concept of standardised packaging was introduced in 1986 and the first study published in 1987.
Electronic searches
The search strategy included searches for studies in the academic literature from generic and topic‐specific electronic databases from the fields of health and addiction, public policy, business and marketing, social sciences and psychology.The most recent search was conducted in January 2016. Databases and their respective search dates are listed below:
MEDLINE (via OVID) 1980 to Jan week 1 2016
MEDLINE In Process & Other (via OVID) 14 Jan 2016
Embase (via OVID) 1980 to week 2 2016
PsycINFO (via OVID) 1980 to Jan week 2 2016
ASSIA , ABI Inform, EconLit, IBSS, Sociological Abstracts (via Proquest) 1980 to update 20160114
SSCI (via Web of Science) 1980 to 15 January 2016
Searching other resources
Handsearching
We checked the bibliographies from included studies for further studies and citation trails, which check which papers have cited an included study. We followed citation trails using Google Scholar and the Web of Knowledge cited reference search.
Personal contact/'grey' literature
We also contacted key individuals and organisations, identified through the search process above, to identify further publications not retrieved in the searches.
Data collection and analysis
Selection of studies
To be included in the review, the studies had to be:
from or after 1980 (the concept of plain packaging was introduced in 1986 and the first study published in 1987);
about human populations;
about tobacco;
about packaging;
primary research published in a peer‐reviewed journal.
There were three phases of study selection. In the first phase, one review author sifted through the citations retrieved and excluded obviously irrelevant material (e.g. studies that are not about tobacco and packaging, and do not include human participants). In the second stage of study selection, two review authors independently screened the titles and abstracts of the studies against the inclusion criteria to identify potentially relevant studies. We obtained potentially relevant studies identified at this stage in full text. A minimum of two review authors (content specialist and methodologist) then independently screened the full‐text studies for relevance, and eliminated any that did not meet the inclusion criteria. We included studies remaining after the second screening stage in the review, and linked together reports or articles for the same studies. We resolved any discrepancies in studies selected for inclusion by discussion among the review team.
Data extraction and management
We developed a data extraction form and piloted and amended it as necessary. At least two review authors independently extracted data for each included study, resolving any disagreements, errors or inconsistencies by discussion, or by recourse to a third review author. One review author entered the data into Review Manager 5 (RevMan 2014), with another review author checking the accuracy of the data entry.
We kept records of amendments and corrections to the data extraction forms, and noted details of discussions on inconsistencies.
Data extracted
Title/unique identifier;
Lead author;
Date of report/publication;
Version number of data extraction form;
ID of data extractor;
ID of study;
Aims, objectives;
Theoretical basis;
Study design (triggering appropriate sub‐fields, e.g. if randomised controlled trial);
Setting;
Participant details;
Sample size, attrition and follow‐up;
Interventions;
Outcomes measured and when;
Results;
Assessment of risks of bias;
Source of funding;
Potential conflicts of interest, declared or not.
We noted the source of each piece of data extracted and made space for comments on the data extraction form throughout.
Assessment of risk of bias in included studies
We used different 'Risk of bias' domains for different study types. Where available and relevant, we used the most recent Cochrane methodology. For randomised controlled trials, we assessed the risk of selection bias (random sequence generation and allocation concealment), detection bias (blinding of outcome measurement), and attrition bias. Depending on study type, we also assessed the risk of selective reporting (reporting bias), sampling method, measurement of independent variables, measurement of dependent variables, control for confounding, and statistical methods, where relevant. These additional non‐standard domains were adopted from a previous review of standardised packaging conducted by some members of the author team (Moodie 2012c). For each study, at least two review authors independently assessed risks of bias, with disagreements resolved by discussion or referral to a third review author. To ensure transparency in our judgements, we report relevant study quotes and comment on reasons for our judgements in each domain (see Characteristics of included studies).
As well as considering the presence of possible bias, we also considered possible direction of bias. This particularly informed our quality judgements in the 'Summary of findings' table (see footnotes in 'Summary of findings' table). Our 'Risk of bias' judgements for individual studies on the domains listed above focus on internal validity, in line with standard Cochrane methods. However, also as in standard Cochrane methods, we use the GRADE approach to assess the certainty of evidence for our primary outcomes and for change in quit attempts (presented in the 'Summary of findings' table). As well as assessing internal validity, this approach also judges external validity. In particular, the GRADE approach entails assessments of risk of bias, inconsistency, imprecision, indirectness, and publication bias.
Measures of treatment effect
Due to limitations in the data currently available, we describe all data narratively using the methods from original study reports.
Had sufficient data been available (and should sufficient data become available in subsequent versions of this review), we would have employed the following measures:
Where dichotomous data were presented in study reports, we would summarise trial outcomes as risk ratios (RRs) with 95% confidence intervals (CIs), where appropriate.
At the population level, we would use changes in prevalence of tobacco use over time as an outcome measure. At the individual level, we would extract tobacco use cessation rates from the reports at all available follow‐up points. Where possible, we would use a dichotomous approach for change in cigarette consumption, where changes are categorised as reduction by 50% or more, or no change/reduction of less than 50%.
We would analyse continuous data by comparing the difference between the mean change from baseline to follow‐up point in the intervention and control groups, where appropriate.
Dealing with missing data
We contacted investigators in order to verify key study characteristics and to obtain missing numerical outcome data where needed. Had we synthesised the data numerically, and had missing data been thought to introduce serious bias, we had planned to explore the impact of including such studies in the overall assessment of results by a sensitivity analysis.
We planned to use a conservative approach for missing data for the primary tobacco use outcomes, considering missing data to be for continuing tobacco users for cessation outcomes and missing data to be no reduction for reduction outcomes, but this was not relevant for the data in the current set of included studies.
Data synthesis
Due to considerable heterogeneity in terms of study design, context, participants, and other study characteristics, it was not appropriate to combine study findings statistically in a meta‐analysis We synthesised our results by outcome and summarise them narratively (and in tabular form in some instances).
If we do conduct meta‐analyses of primary outcomes in future iterations of this review, we will pool risk ratios using a Mantel‐Haenszel fixed‐effect model ((number of events in intervention condition/intervention denominator) / (number of events in control condition/control denominator)) with a 95% CI. Where the event is defined as smoking cessation, an RR greater than one would indicate that more people successfully quit in the treatment group than in the control group.
We have produced a 'Summary of findings' table for all primary outcomes and for change in quit attempts.
Results
Description of studies
Results of the search
We identified 9085 records in database searches and 20 through handsearching. After duplicates were removed, this left 8383 studies (see Figure 2). After the first screening round (removing clearly irrelevant studies), this left 1011 titles and abstracts which were screened by two review authors. We assessed 311 full‐text articles for eligibility.
2.
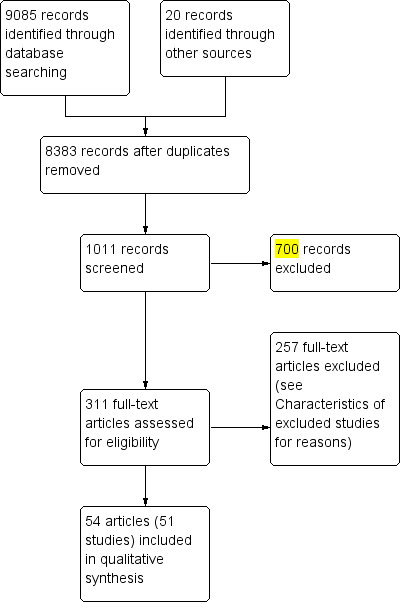
Study flow diagram
Included studies
We include 57 articles (54 from our search, 3 further identified relating to included studies), representing 51 studies. Overall, the included studies represent approximately 800,000 participants (an exact number is not possible, given that some studies do not report the total number of participants). We briefly summarise studies by outcome below; full details for each included study can be found in Characteristics of included studies tables. We include one randomised controlled trial and 19 observational studies (including cohort studies and cross‐sectional surveys). The remainder of the included studies were experimental and employed between‐ and/or within‐ subjects designs; four of these used eye tracking.
Primary outcomes: changes in tobacco use
We found five published studies which examined changes in tobacco use. Three were from Australia, assessing the impact of standardised packaging legislation implemented in 2012 (Diethelm 2015; Miller 2015; Scollo 2015). Two were experimental studies from the UK (Maynard 2015; Moodie 2013). One study examined changes in prevalence (Diethelm 2015) and four studies examined changes in tobacco consumption among smokers (Maynard 2015; Miller 2015; Moodie 2013; Scollo 2015). No studies examined changes in relapse and tobacco uptake.
Changes in tobacco use prevalence
Diethelm 2015 assessed the effect of standardised packaging on smoking prevalence among 700,000 adults (aged 18+) in Australia, with the aim of investigating the findings of a tobacco industry‐funded paper which was not published in the peer‐reviewed literature (Kaul 2014). Kaul 2014 concluded that standardised packaging had no effect on reducing smoking prevalence. The study used serial cross‐country weekly surveys with a random sampling design and were nationally representative of Australia. For the period from January 2001 to December 2013 (one year after mandatory full implementation of standardised packaging), prevalence figures were extracted and computed from data presented within Kaul and Wolff’s working paper, adjusted for the following policies introduced over the 13‐year period: graphic health warnings (but not the enhancement of health warnings introduced alongside standardised packaging in 2012), smoke‐free policies, and tax increases on tobacco products. A separate unpublished report from the Australian Government (Chipty 2016) also uses the same data as Diethelm 2015 and Kaul 2014. Given that they rely on the same data set, we have incorporated findings from Chipty 2016 and Kaul 2014 in our analysis of Diethelm 2015.
Changes in tobacco consumption
Four studies assessed changes in self‐reported tobacco consumption (total of 9394 participants). Two studies were from Australia and assessed changes in consumption after standardised packaging was implemented in 2012 (Miller 2015; Scollo 2015): Scollo 2015 assessed changes in cigarette consumption among current factory‐made or roll‐your‐own cigarette smokers using a continuous cross‐sectional national survey (The National Plain Packaging Tracking Survey) from April 2012 to March 2014; Miller 2015 assessed retrospective reports of consumption changes in cigar and cigarillo smokers in a March 2014 cross‐sectional survey.
Two experimental studies were from the UK (Maynard 2015; Moodie 2013); Maynard 2015 deployed a randomised controlled trial comparing effects of branded and standardised packaging on smoking behaviour among young adult daily smokers (men and women) when using these packs over a 24‐hour period, including volume of smoke inhaled using hand‐held smoking topography machines; Moodie 2013 used a non‐randomised controlled study, and assessed changes in smoking behaviour of young adult female smokers who used standardised packs for one week and their branded packs for one week in a counterbalanced design.
Secondary outcomes
Other behavioural outcomes
We found 21 studies (representing over 27,000 participants) which examined other behavioural changes. Nine were observational studies from Australia assessing the impact of standardised packaging legislation implemented in 2012 (Durkin 2015; Miller 2015; Nicholson 2015; Wakefield 2015; White 2015a; Yong 2015; Young 2014; Zacher 2014; Zacher 2015); 12 were experimental studies: nine from the UK (Hammond 2013; Hogarth 2015; Munafò 2011; Maynard 2013; Maynard 2014; Maynard 2015; Moodie 2011; Moodie 2013; Shankleman 2015), two from the USA (Hammond 2011; Rousu 2013) and one from Brazil (White 2012).
Of the observational studies, two used pre‐post observational methods in café strips before, during and after standardised packaging implementation (Zacher 2014; Zacher 2015). Nicholson 2015 used a cross‐sectional national survey of Aboriginal and Torres Strait Islander smokers carried out pre‐ and post‐standardised packaging implementation. Wakefield 2015 used a continuous cross‐sectional national survey (The National Plain Packaging Tracking Survey) from April 2012 to March 2014 (from before to 15 months after standardised packaging implementation). Yong 2015 used adult cohort surveys (International Tobacco Control Policy Evaluation Project) to assess the impact of standardised packaging (1525 participants). Durkin 2015 used a series of four adult smoker cohorts, also using the The National Plain Packaging Tracking Survey. Young 2014 used an interrupted time series design of routine data before and after standardised packaging. Miller 2015 assessed retrospective reports in cigar and cigarillo smokers in a March 2014 cross‐sectional survey. White 2015a examined two cross‐sectional school‐based surveys before and after standardised packaging to assess changes.
Of the experimental studies, nine were based in the UK. Maynard 2015 deployed a randomised controlled trial comparing branded and standardised packaging on smoking behaviour among young adult daily smokers (men and women) when using these packs over a 24‐hour period; Moodie 2011 used a non‐randomised controlled study, and assessed changes in smoking behaviour of young adult smokers who used standardised packs for two weeks and branded packs for two weeks in a counterbalanced design; similarly Moodie 2013 used a non‐randomised controlled study, and assessed changes in smoking behaviour of young adult female smokers who used standardised packs for one week and branded packs for one week in a counterbalanced design. Four UK experimental studies measured eye fixations for different pack designs (Maynard 2013; Maynard 2014; Munafò 2011; Shankleman 2015). Hogarth 2015 used a nominal Pavlovian to instrumental transfer (PIT) procedure to assess tobacco‐seeking with different pack designs. In Hammond 2013 participants were asked to select a pack which they would be sent (although they were subsequently advised this would not happen). A further two experimental studies were based in the USA: Hammond 2011 (similar pack selection task to Hammond 2013), and Rousu 2013 conducted an experimental auction to purchase cigarettes in USA grocery stores with adult smokers face‐to‐face. A final experimental study was conducted in Brazil (White 2012), with a similar pack selection task to Hammond 2013.
(a) Changes in quit attempts
One Australian study (Durkin 2015) assessed quit attempts in four cohorts of adult smokers of factory‐made or roll‐your‐own cigarettes before and after standardised packaging. A second Australian study (Young 2014) assessed calls to quitlines as an indirect measure of quit attempts before and after standardised packaging implementation.
(b) Smoking behaviour changes such as stubbing out a cigarette early, forgoing cigarettes, smoking less around others
One Australian study (Durkin 2015) assessed stubbed‐out cigarettes in the past month and stopping oneself from smoking several or many times in the past month, in four cohorts of adult smokers of factory‐made or roll‐your‐own cigarettes before and after standardised packaging. Two Australian studies (White 2015a; Yong 2015) examined the impact of standardised packaging with a specific focus on the impact of enhanced graphic warnings on forgoing cigarettes. White 2015a assessed Australian adolescent smokers and Yong 2015 adult smokers.Two Australian studies (Zacher 2014; Zacher 2015) assessed the extent to which smokers in café strips smoked less before, during and after standardised packaging implementation. Nicholson 2015 assessed whether those noticing warning labels in the past month were more likely to say these labels led them to forgo at least one cigarette before and after standardised packaging and enhanced health warnings implementation in Australia.
Three experimental studies in the UK (Maynard 2015; Moodie 2011; Moodie 2013) assessed the impact of standardised packaging on forgoing cigarettes, stubbing out cigarettes early, and smoking less around others.
(c) Changes in avoidance behaviours
Two Australian studies (Wakefield 2015; Yong 2015) examined the impact of standardised packaging of cigarettes with enhanced graphic warnings on pack concealment in cross‐sectional surveys (Wakefield 2015) and a cohort survey (Yong 2015). Two further Australian studies (Zacher 2014; Zacher 2015) assessed the extent to which smokers in café strips concealed their tobacco packs before, during and after standardised packaging implementation. Miller 2015 assessed retrospective reports of concealing or decanting their products in cigar and cigarillo smokers in a March 2014 cross‐sectional survey.
Three experimental studies in the UK (Maynard 2015; Moodie 2011; Moodie 2013) assessed the impact of standardised packaging on keeping the pack out of sight and covering the pack.
(d) Eye‐tracking
Four UK experimental studies measured eye fixations for different pack designs using Eyelink II technology (Maynard 2013; Maynard 2014; Munafò 2011) or model TX300 video eye tracker (Shankleman 2015).
(e) Pack selection
Hogarth 2015 used two within‐participant experiments to test whether standardised versus branded cigarette pack stimuli would differentially elicit instrumental tobacco‐seeking in a nominal Pavlovian to instrumental transfer (PIT) procedure with regular smokers. At the end of three online between‐participants experimental studies in the USA, UK and Brazil (Hammond 2011; Hammond 2013; White 2012) participants were asked to select a pack they believed that they were going to be sent; one USA study (Rousu 2013) involved an experimental design in which participants actually purchased the pack they were bidding for.
Non‐behavioural outcomes
Overall, 45 studies assessed the association or impact of standardised packaging on non‐behavioural outcomes (61,437 participants). We summarise these very briefly below, due to the number of studies and outcomes; further detail on each can be found in the Characteristics of included studies tables.
(a) Quit cognitions
Overall, 16 studies assessed quit cognitions and of these, six studies assessed changes in quit cognitions before and after standardised packaging implementation in Australia (Brennan 2015; Durkin 2015; Wakefield 2013; Wakefield 2015; White 2015a; Yong 2015).
Five studies from Australia assessed quit intentions/plans to quit (Brennan 2015; Durkin 2015; Wakefield 2012; Wakefield 2013; Yong 2015), although one of these (Wakefield 2012) was an experimental study carried out before standardised packaging implementation in Australia. Eleven studies (four from Australia, four from the UK, two from France and one from the USA) assessed motivation to quit smoking (Brose 2014; Gallopel‐Morvan 2011; Gallopel‐Morvan 2015b; Maynard 2015; Mays 2015; Moodie 2011; Moodie 2013; Nicholson 2015; Wakefield 2013; Wakefield 2015; Yong 2015).Ten studies (six from Australia, three from the UK and one from France) assessed thinking about quitting (Brennan 2015; Durkin 2015; Gallopel‐Morvan 2015a; Maynard 2015; Moodie 2011; Moodie 2013; Wakefield 2012; Wakefield 2013; White 2015a; Yong 2015).
(b) Intention to try smoking
Seven studies from Australia, China, Canada, France and the UK (three studies) assessed intention to try smoking (Chow 2015; Ford 2013; Gallopel‐Morvan 2011; Hammond 2009; Hammond 2014; Kotnowski 2015; White 2015a). All included a measure of intention to, or susceptibility to, initiate smoking among adolescents/youth, and the one study in Australia which examined changes before and after standardised packaging implementation also included an indirect measure of susceptibility (White 2015a).
(c) Craving
Only one UK experimental study assessed craving: Brose 2014 carried out a between‐participants experiment to assess craving cued by seeing a branded or standardised pack.
(d) Positive pack attributes
30 studies assessed pack appeal; 21 studies assessed perceived taste of tobacco in packs; 22 studies assessed quality (defined in various ways including perceived quality, pack preference tasks in which they were asked to choose a pack or which pack they preferred, which pack was perceived to be most effective in motivating people to buy cigarettes, expensive, satisfying, pleasurable, embarrassment, image, more natural tobacco, lower class, prestige) (see Table 2, Table 3, and Table 4 for a list of studies and key characteristics).
1. Appeal.
| Study ID | Country | Design | Age | Gender | Smoking status | Pack characteristics | Health Warnings | Summary of key results |
| Adkison 2014 | USA | Online within‐participants experiment | Adult | Male & female | Smokers & non‐smokers | Most appealing pack (to participant) vs standardised brown pack |
30% text warning | 1) attracting their attention (62.4%, 6.6%, 31% for branded, standardised and no difference respectively); 2) appealing to people their age (61.7%, 3.9%, 34.4% respectively); 3) want to be seen using (55.2%, 3.0%, 41.8% respectively); 4) least attractive to smoker (8.9%, 51.4%, 39.7% respectively) all P < 0.001 |
| Babineau 2015 | Ireland | School‐based (pen and paper) within‐participant cross‐sectional survey |
16 ‐ 17 years | Male & female |
Smokers & non‐smokers |
Branded (conforming to EU regulations) vs standardised (brown‐matte) |
65% text & pictorial health warnings | Branded packs were significantly more likely to be selected as more attractive than the standardised packs for 2 of the 3 brands included Marlboro (Chi2 = 158.88, P < 0.001), and Benson and Hedges (Chi2 = 163.47, P < 0.001). However, there was no significant effect for attractiveness for Silk Cut brand (Chi2 = 2.82, P = 0.08). Branded packs were also significantly more likely to be selected as being smoked by someone who was popular and well‐liked compared to the standardised packs Silk Cut (Chi2 = 19.24, P < 0.001), Marlboro (Chi2 = 158.58, P < 0.001) and Benson and Hedges (Chi2 = 166.37, P < 0.001) |
| Balmford 2015 | Australia | Pre‐post cohort surveys (baseline & 2 follow‐up waves) |
Adult | Male & female | Smokers | Branded vs standardised (as implemented in Australia) | 75% pictorial warning on front, 90% on back | There was an increase in the proportion that stated brands do not differ in prestige (or do not know). Adjusted OR for at least a little vs other: Wave 2 0.49 (0.40 to 0.61) P < 0.001 and Wave 3 0.5 (0.39 to 0.66) P < 0.001 (compared to Wave 1, the pre‐standardised packaging wave). There was an increase in the proportion that did not like the look of their own pack (Adjusted OR for not at all vs other: Wave 1: Pre‐PP (Ref) vs Wave 2: 3.83 (2.97 to 4.95), P < 0.001 and Wave 3: 3.91 (3.02 to 5.07), P < 0.001. All these pre‐ to post‐ changes were sustained to wave 3 but did not further change from wave 2 to wave 3 |
| Bansal‐Travers 2011 | USA | Cross‐sectional mall intercept study | Adult | Male & female | Smokers & non‐smokers | Branded vs standardised (white) | Standardised pack no warning label. Branded no warning label (for this comparison) | Participants perceived the branded pack as significantly more attractive: Branded vs standardised pack: branded = 97% vs standardised = 3%, P < 0.001. Participants perceived branded pack as significantly more likely to appeal to youth aged 18 years, compared with standardised pack: Branded = 91% vs standardised = 9%, P < 0.001 |
| Borland 2013 | Australia (prior to standardised packaging) | Within‐participants component of a mixed design experiment | 18‐29 | Male & female | Ever‐smokers (80% current) | All standardised packs (beige) 5 pack shapes, 5 pack openings |
30% front and back 70% front and back but only image of front shown | Among 5 standardised packs which differed by pack shape and opening, the shape of the standardised pack significantly affected attractiveness. Repeated measures analysis of variance of pack shape x warning size x branding showed main effects between the pack shapes on attractiveness (F (3.7) = 17.49, P < 0.001). Rounded and bevelled packs rated as the most attractive; there was no effect of the different openings included on attractiveness of the standardised packs (F (3.5) = 0.94, P = 0.431) |
| Brose 2014 | UK | Between‐participants experiment recruited from an online pool | Young adult | Male & female | Smokers | Branded vs standardised (mirrored Australia, green/brown) |
Branded: 30% text on front; 40% pictorial on back standardised: 75% pictorial warning on front, 90% on back |
Brand Appeal: Standardised pack significantly lower rating than preferred and non‐preferred branded pack: Preferred pack: 3.80; Not preferred pack mean: 2.99; Standardised mean: 2.09, F = 22.68, P < 0.001. Popular: Standardised pack significantly lower rating than preferred and non‐preferred branded pack: Preferred pack: 3.23; Not preferred pack mean: 3.19; Standardised mean: 2.63 F = 8.50, P < 0.001. Standardised packs were also rated significantly less stylish than their preferred branded pack, but not non‐preferred branded packs Stylish: Standardised pack significantly lower rating than preferred pack: Preferred pack: 3.21; Not preferred pack mean: 3.04; standardised mean:2.62, F = 3.22, P = 0.044. No other differences |
| Chow 2015 | China | Laboratory between‐participants experiment | Adult | Male & female | Non‐smokers | Branded vs standardised (green colour) | 50% health warning graphic and text | Overall borderline significant finding for higher brand likeability for branded packs vs standardised packs (4.42 vs 3.56 (on a scale from 1 to 9)) (M (existing) = 4.42, M (standardised) = 3.56, t‐value = 1.938, P = 0.055).The 2‐way ANOVA for the interaction between label types and brand familiarity was borderline significant for brand likeability (mean square = 20.534, F‐value = 3.627, P = 0.059). The mean of brand likeability for the familiar brand in the existing packaging cell is 4.94, and the mean for that in cells is 3.90 and 3.84, respectively, a non‐significant difference (M (unfamiliar/existing) = 3.90, M (unfamiliar/standardised) = 3.84, t‐value = 0.115, P = 0.909) |
| Doxey 2011 | Canada | Online between‐participants experiment | Adult | Female | Smokers & non‐smokers | Female‐branded with descriptors; female‐branded with no descriptors; male‐branded packs standardised (white) |
Health warning (pictorial with text) covering 50% of the principal display surface | Perceptions of brand appeal: Standardised packages were rated as significantly less appealing than female‐oriented packs for all brands, with the exception of the Camel, XS and Silk Cut variants. A linear regression was conducted using an index score for brand appeal across all 8 packs. A significant main effect of condition was found (F = 10.55, P < 0.001), such that packs in the branded condition (mean = 4.2) were rated significantly more appealing than packs in the no descriptors condition (mean = 3.7, β = ‐0.58, P = 0.02), white standardised pack condition (mean = 2.0, β = ‐2.29, P < 0.001) and male‐branded pack condition (mean = 2.4, β = ‐1.78, P < 0.001). The branded no‐descriptors packs were also given higher appeal ratings than packs in the white standardised pack condition (β = ‐1.71, P < 0.001) and male‐branded pack condition (β = ‐1.2, P < 0.001), and packs in the white standardised pack condition were given lower appeal ratings than packs in the male‐branded pack condition (β = ‐0.51, P = 0.04) |
| Dunlop 2015 | NSW, Australia | Observational continuous cross‐sectional | Adult | Male & female | Smokers | As per Australian standards (see Characteristics of included studies) | As per Australian standards (see Characteristics of included studies) | Pack perceptions: The results of the interrupted time series analysis show that 3 months after the introduction of the new packs, there was a significant increase in the proportion of smokers strongly disagreeing that thelook of their cigarette pack is attractive (from 26% in September 2012 to 80% in January 2013, +57.5% (38.0 to 77.1) P < 0.001; Says something good about them (from 27% to 76%, +54.5% (36.9 to 72.1) P < 0.001); influences the brand they buy (from 27% to 77%), 40.6% (23.2 to 58.0) P < 0.001; makes their brand stand out (from 22% to 78%), 55.6 (35.0 to 76.2) P < 0.001; is fashionable (from 27% to 80%), 44.7 (28.1 to 61.2) P < 0.001; andmatches their style (from 31% to 77%), 48.1 (32.2 to 64.0) P < 0.001. This effect was independent of any influence of long‐term background trends, cigarette price or anti‐smoking advertising activity. Overall, ‘Negative pack perceptions’ increased in the mean score by 0.21 (0.02 to 0.40) P = 0.03, 3 months after, not attributable to background trends, seasonality, anti‐smoking advertising activity or cigarette price. For the comparison period, there were no significant differences in scores on this scale. The multiple linear regression model predicting Negative pack perception scores over the pp‐periods showed that scores on this scale were significantly higher in each of the post‐pp periods than in the pre‐pp period (from 3.95 (Aug/Sep), 3.96 (Oct/Nov) to 4.50 (Dec/Jan; β = 0.27) 4.58 (Feb/Mar β = 0.37), 4.64 (Apr/May; β = 0.40, all P < 0.001). For the comparison period, there were no significant differences in scores on this scale |
| Ford 2013 | UK | Repeat cross‐sectional study | 11 ‐ 16 | Male & female | Non‐smokers | Novelty (branded packs designed with a distinctive shape, opening style or bright colour), traditional regular (branded pack with no special design features) vs standardised (brown pack with a standard shape and opening and all branding removed, aside from brand name) | Text message ‘Smoking seriously harms you and others around you’ 30% UK text warning on front on all packs. | A composite pack appraisal (appeal) score was significantly lower for a standardised pack compared with a traditional flip‐top branded pack (Adjusted OR = 0.54, 95% CI 0.43 to 0.67, P < 0.001). The 2 novelty structural design packs (superslims (AOR = 1.94, 95% CI 1.63 to 2.32, P < 0.001) and pack with innovative opening (AOR = 1.56, 95% CI 1.29 to 1.88, P < 0.001)) scored significantly higher than the traditional pack |
| Gallopel‐Morvan 2011 | France | Observational cross‐sectional | Adult | Male & female | Smokers and non‐smokers | Marlboro standardised pack vs Marlboro branded pack | Text warnings on both plain and branded packs are white with black text, 30% on front and 40% on back | Perceptions of standardised grey packs among the whole sample:
Grab attention: 31% Won't grab attention: 60%
Attractive: 17% Repulsive: 49% P < 0.01;
Original: 23%
Not original/boring: 70% P < 0.01; Fashionable: 21% Not fashionable: 58% P < 0.01;
Beautiful/appealing: 17% Ugly: 63% P < 0.01;
Shiny/Bright/vibrant: 11% Dull: 77% P < 0.01; Looks like it was designed for adolescents ‐ Respondents more likely to say that the branded pack was more designed for adolescents, P < 0.01 |
| Gallopel‐Morvan 2012 | France | Between‐participants experiment | Adolescents & young people | Male & female | Smokers and non‐smokers | Popular branded pack Vs 3 standardised packs (white, grey, brown) |
All packs had the (black and white) text warning ‘Fumer Tue’ (Smoking Kills) covering 30% of the front panel of the pack. Only picture of front of pack shown | There were no differences across branded or standardised packs in ratings of ‘original’ (as opposed to dull). Attention‐grabbing: The branded pack was rated significantly higher than the 3 standardised packs for attention grabbing (F = 20.25, P < 0.001). No differences between the standardised packs (F = 2.44, P = 0.088). Flashy: The branded pack was rated significantly higher than the 3 standardised packs for flashy (F = 75.48, P < 0.001). Brown pack was rated as more flashy than white pack (P = 0.001). Attractive: The branded pack was rated significantly higher than the 3 standardised packs for attractive, (F = 10.92, P < 0.001). There were no differences for the 3 standardised packs, P = 0.062. Nice: The branded pack was rated significantly higher than the 3 standardised packs for nice, (F = 26.42, P < 0.001). There were no differences for the 3 standardised packs, P = 0.10. Trendy: The branded pack was rated significantly higher than the 3 standardised packs for trendy, (F = 14.35, P < 0.001). There were no differences for the 3 standardised packs, P = 0.18 |
| Gallopel‐Morvan 2015b | France | Experimental study in which they transferred their tobacco into standardised packs and used them for 10 days | 25 ‐ 40 years | Female | Smokers | As in Australia, brown | 75% pictorial HW on both sides | B = branded pack (pre‐test) PP = Standardised pack (10‐day post‐test). Means from l Likert scale (1 ‐ 5); 5 is higher/better rating. The respondents rated their own branded packs as more appealing than standardised packs on all of the appeal measures. Appealing Branded = 3.46 (1.04) PP = 1.92 (1.61) t = 11.39 (P < 0.001) Eye‐catching/Attention‐grabbing: Branded = 3.43 (1.12) PP = 1.86 (1.09) t = 11.39 (P < 0.001) Stylish Branded = 3.49 (1.18) PP = 2.01 (1.16) t = 9.8 (P < 0.001) Fashionable/Trendy: Branded = 3.27 (1.12) PP = 2.13 (1.16) t = 8.06 (P < 0.001) Elegant: Branded = 3.42 (1.15) PP = 2.04 (1.24) t = 9,84 (P < 0.001) |
| Gallopel‐Morvan 2015a | France | Experimental study in which they transferred their tobacco into standardised packs and used them for 10 days | Young adult | Male & female | RYO smokers | Branded: own brand Standardised: As in Australia (brown) |
Branded: text warnings covering 40% of pack surface Standardised: 75% pictorial warning on front and 90% back |
On average, participants rated the standardised pack negatively on all pack perception items (desirable, attractive, stylish, fashionable, cool): Pack perceptions (range 1 = low perceptions to 5 = high perceptions): Desirable: Branded = 3.44, Standardised = 1.89, t = 12.03 (P < 0.001); Attractiveness: Branded = 3.29, Standardised = 1.96, t = 9.84 (P < 0.001); Stylish: Branded = 3.25, Standardised = 2.03, t = −8.71 (P < 0.001); Fashionable: Branded = 3.06, Standardised: 2.05, t = 7.57 (P < 0.001); and Cool: Branded = 3.29, Standardised = 1.98, t = 9.30 (P < 0.001). Liking of the pack (pack attitude) was also significantly lower for the standardised pack: Pack attitude: dislike this pack: branded = 3.60, standardised = 2.13, t = −10.82 (P < 0.001). Brand attitude: Liking of the brand (brand attitude) was also significantly lower for the standardised pack compared to their own pack: ‘I like this brand’: branded = 4.41, standardised = 4.02, t = 4.94 (P < 0.001). Overall brand attachment score (composite score): Participants had significantly less attachment toward their brand for the standardised pack compared to their own fully‐branded pack, with the mean overall brand attachment score 3.61 for their own pack and 3.40 for the standardised pack (t = 2.38 (P = 0.019)); lower scores indicate a lower brand attachment. Of the 5 brand attachment items, 2 were significantly lower for the standardised pack compared to their own pack: ‘Purchasing this brand gives me a lot of pleasure’ (3.36 vs 3.76; t = 3.59 (P < 0.001)) and ‘I am very attracted to this brand’ (3.55 vs 3.74; t = −1.95 (P = 0.05). Not significant: ‘I am bound to this brand’, ‘Buying or owning this brand gives me a lot of comfort’, and ‘I have great affection for this brand’ |
| Germain 2010 | Australia (prior to standardised packaging) | Online between‐participants experiment | Adolescents | Male & female | Smokers and non‐smokers | 5 levels of packaging and 3 brands in which branding was progressively removed from the pack | Varied by condition (see Characteristics of included studies) | As branding decreased, ‘positive pack characteristics’ and ‘positive smoker attributes’ significantly decreased. The plainest pack with the largest health warning (covering 80% of the pack face) was rated significantly lower on ‘positive pack characteristics’ but not ‘positive smoker attributes’ compared with ratings on the plainest pack with a 30% health warning. Positive pack characteristics are ‘‘popular brand’’; ‘‘attractive pack’’; ‘‘value for money’’; ‘‘exclusive’’; ‘‘brand would try/smoke; Positive smoker attributes ‘‘trendy’’; ‘‘young’’; ‘‘masculine’’; ‘‘sociable’’; ‘‘confident.’’: 1. Analysis of variance tests were conducted to explore mean differences in ratings of plain packs 1, 2, and 3 as compared with original branded packs. Standardised pack 1 was rated more negatively in terms of ‘‘positive pack characteristics’’ (P < 0.01) and ‘‘positive smoker attributes’’ (P < 0.01) as compared with ratings of the original pack. For standardised pack 2, ‘‘positive pack characteristics’’ (P < 0.001) and ‘‘positive smoker attributes’’ (P < 0.001) were also rated more negatively than the original pack. Finally, in comparison with the original pack, standardised pack 3 was rated more negatively in terms of ‘‘positive pack characteristics’’ (P < 0.001), ‘‘positive smoker attributes’’ (P < 0.001). Comparing SP 3and SP 4: Analysis of variance indicated that those who were exposed to standardised pack 4 rated their pack lower on ‘‘positive pack characteristics’’ (mean = 1.6, SD = .7; F (1,425) = 13.87, P < 0.001) than did those who saw standardised pack 3 (mean = 1.9, SD = .8). Positive pack characteristics: branded/original: 2.31 (0.8) standardised pack 1: 2.07 (0.7) standardised pack 2: 2.00 (0.9) standardised pack 3: 1.90 (0.8) F = 10.54, P < 0.001 (all 3 standardised packs rated significantly lower than the branded original pack). Positive smoker attributes: branded/original: 2.65 (0.8) standardised pack 1: 2.42 (0.8) standardised pack 2: 2.39 (0.9) standardised pack 3: 2.23 (0.8) F = 9.71, P < 0.001 (all 3 standardised packs rated significantly lower than the branded original pack). 2. Analyses of variance was also conducted to compare SP3 with SP4, to examine the effect on pack ratings of adding a large graphic health warning to 80% of the front of the pack. Analysis of variance indicated that those who were exposed to standardised pack 4 rated their pack lower on ‘‘positive pack characteristics’’ (mean = 1.6, SD = .7; F (1,425) = 13.87, P < 0.001) than did those who saw standardised pack 3 (mean = 1.9, SD = 0.8). Ratings of all other outcome variables (i.e. ‘‘positive smoker attributes’’; ‘‘positive taste characteristics’’; ‘‘cheap tasting’’; ‘‘light tasting; and ‘‘lower class’’ did not differ between these 2 packs |
| Guillaumier 2014 | Australia (prior to standardised packaging) | Between‐participants experiment | Socially disadvantaged adults | Male & female | Smokers | 4 conditions involving 2 brands with branded & standardised (drab brown) versions | As per Australian standards (see Characteristics of included studies) | The positive pack characteristics scale (e.g. popular, attractive) varied significantly across the pack conditions (P < 0.001), with pairwise comparisons revealing that branded packaging images were rated significantly more positively than standardised packaging images in the Winfield condition (P < 0.001); however, there was no difference in the B&H condition (P = 0.102). Positive smoker characteristic ratings were significantly different across the 4 pack conditions (P = 0.003); branded packaging images were rated more positively than standardised packaging images within the Winfield condition (P = 0.001), but not the B&H brand name condition (P = 0.197). There was no difference in thenegative smoker characteristic (boring) ratings across the 4 pack conditions (P = 0.427) |
| Hammond 2009 | UK | Online within‐participants experiment | Adult smokers & youth | Male & female | Smokers & non‐smokers | 2 brands branded vs standardised (brown & white) | All of the packs shown to participants displayed the same pictorial health warning covering 30% of the ‘front’ of the pack |
Adult smokers perceived the standardised packs as significantly less attractive. White standardised pack with Mayfair Kingsize vs Branded Mayfair Kingsize. White standardised pack perceived as less attractive than its branded pair, P < 0.0001, with 13% selecting white standardised pack, 40% branded, and 47% no differences. Brown standardised pack with Mayfair Kingsize vs Mayfair Kingsize Branded. Brown plain perceived as less attractive than branded, P < 0.0001, with 12% selecting brown standardised pack, 39% branded, and 49% no differences. White standardised pack with Lambert and Bulter Kingsize vs Branded Lamber and Butler Kingsize: White standardised perceived as less attractive than its branded counterpart, P < 0.001, with 39% choosing branded, 13% choosing white standardised pack, and 48% no differences. Brown standardised pack with Lambert and Butler Kingsize vs Branded Lambert and Butler Kingsize. Brown standardised was perceived as less attractive, P < 0.001, than its branded counterpart, with 42% choosing branded as attractive, 9% choosing brown standardised, and 49% no difference. Within standardised pack comparisons, packs with descriptors (such as smooth, gold) were perceived as significantly more attractive than those without descriptors. Comparisons between different types of standardised packs: Standardised white Mayfair smooth vs standardised white Mayfair Kingsize. Mayfair standardised white pack with smooth rated as more attractive than Mayfair standardised white pack with Kingsize, P < 0.001, with 15% rating Mayfair Smooth as more attractive, 6% Mayfair Kingsize, and 79% no difference. Brown standardised pack with Lambert and Butler gold vs Brown standardised pack with Lambert and Butler Kingsize. Lambert and Butler Gold rated as significantly more attractive, P = 0.003, with 11% rating Lambert gold more attractive, 6% rating Lambert and Butler Kingsize as more attractive, and 83% no difference. However, when comparing these standardised (with and without descriptors) comparisons with the same branded comparisons (with and without descriptors), significantly fewer adult smokers perceived the standardised packs as having differences in attractiveness, compared to the branded packs. Comparing size of differences between (Mayfair Smooth White Standardised vs Mayfair Kingsize White Standardised) vs (Mayfair Smooth Branded vs Mayfair Kingsize Branded). Fewer adults perceived the standardised packs as having differences in attractiveness compared to the branded packs, P < 0.001. Comparing size of differences between (Lambert and Butler Gold Kingsize Brown Standardised vs Lambert and Butler Kingsize Brown Standardised) vs (Lambert and Butler Gold Kingsize Branded vs Lambert and Butler Kingsize Branded) Comparing size of differences between (Lambert and Butler Gold Kingsize Brown Standardised vs Lambert and Butler Kingsize Brown Standardised) vs (Lambert and Butler Gold Kingsize Branded vs Lambert and Butler Kingsize Branded) Fewer adults perceived the standardised packs as having differences in attractiveness compared to the branded packs, P < 0.001. YOUTH ‐ very similar findings to adult smokers. Standardised vs branded Mayfair Kingsize standardised white pack vs Mayfair Kingsize branded. Standardised rated as less attractive, P < 0.001, with 6% standardised white more attractive, 51% branded more attractive, and 43% no difference. Mayfair Kingsize standardised brown pack vs Mayfair Kingsize branded. Standardised rated as less attractive, P < 0.001, with 8% standardised brown more attractive, 49% branded more attractive, and 43% no difference. Lambert and Butler Kingsize white pack vs Lambert and Butler Kingsize branded, P < 0.001, with 52% rating branded as more attractive, 8% standardised white, and 40% no difference. Lambert and Butler Kingsize brown pack vs Lambert and Butler Kingsize branded pack, P < 0.001, with 52% rated branded more attractive, 7% standardised brown, and 41% no difference. Different types of standardised pack: Mayfair Smooth White Standardised Pack vs Mayfair Kingsize White Standardised Pack. Mayfair smooth rated as more attractive, P < 0.001, with 18% rating smooth more attractive, 5% Kingsize, and 77% no difference. Lambert and Butler Gold Brown Standardise Pack vs Lambert and Butler Kingsize Brown Standardised Pack. Lambert and Butler Gold rated as more attractive, P < 0.001, with 15% selecting gold, 6 selecting Kingsize, and 79% no difference. Comparing size of differences between (Mayfair Smooth White Standardised vs Mayfair Kingsize White Standardised vs (Mayfair Smooth Branded vs Mayfair Kingsize Branded) Fewer youth perceived the standardised packs as having differences in attractiveness compared to the branded packs, P = 0.008. Comparing size of differences between (Lambert and Butler Gold Kingsize Brown Plain vs Lambert and Butler Kingsize Brown Plain) vs (Lambert and Butler Gold Kingsize Branded vs Lambert and Butler Kingsize Branded) Fewer adults perceived the standardised packs as having differences in attractiveness compared to the branded packs, P = 0.008 |
| Hammond 2011 | USA | Online between‐participants experiment | 18 ‐ 19‐year‐olds | Female | Smokers & non‐smokers | 8 cigarette packs in 4 experimental conditions: 1) Fully‐branded female packs 2) Fully‐branded female packs without descriptors (e.g. slims) 3) Same packs without brand imagery or descriptors (brown) 4) Non‐female‐ (male‐) branded packs |
No health warnings |
Appeal: Among 1) branded+descriptor packs, highest appeal ratings were given for the white and pink Capri Cherry pack and the Vogue Bleue pack. Compared with 1) branded+descriptor packs, 3) standardised packs were rated as significantly less appealing for all 8 packs, whereas 7 of the 8 standardised packs were rated as significantly less appealing compared with no‐descriptor packs.
A linear regression was conducted using an index score for brand appeal across all 8 packs to examine overall differences between experimental conditions, as well as sociodemographic predictors of brand appeal. A significant main effect of condition was found (F = 36.8, P < 0.001), such that packs in the 1) branded + descriptor condition (M = 4.2) were rated significantly more appealing than packs in the standardised (M = 2.0, β = −0.40, P < 0.001) and male conditions (M = 3.3, β = −0.18, P < 0.001). The standardised packs were also given significantly lower appeal ratings than the no‐descriptor (M = 4.1, β = −0.41, P < 0.001) and male conditions (β = −0.24, P < 0.001), and male packs were given lower appeal ratings than the no‐descriptor packs ( β = −0.16, P < 0.001). Smoker Image/Trait Standardised packages received significantly fewer positive ratings for every smoker trait. In a linear regression in which all the different smoker traits across all packs were combined in a single index where higher scores indicated more positive smoker traits, a main effect of condition was significant (F = 27.8, P < 0.001), such that the packs in the standard condition (M = 2.7) were given higher positive trait scores than those in the standardised (M = 1.9 , β = −0.22, P < 0.001) and male (M = 1.4 , β = −0.39, P < 0.001) conditions. Packs in the male condition were given lower positive trait scores than the no‐descriptors (M = 2.5, β = 0.34, P < 0.001) and standardised conditions ( β = 0.15, P = 0.001). In addition, standardised packs were given lower positive trait scores than packs in the no‐descriptors condition (β = 0.17, P < 0.001) |
| Hammond 2013 | UK | Online between‐participants experiment | Youth | Female | Smoking and non‐smoking | 1) branded female‐oriented packs 2) female‐oriented branded packs, no descriptors (e.g. “slims”) 3) standardised: female‐oriented packs, no branding or descriptors, cardboard‐coloured 4) control: popular UK brands but non–female‐oriented packs |
30% text‐only black & white | The highest appeal ratings were given for the white and pink Vogue Arome pack and the Capri Cherry pack. A significant effect of condition was found (F (3,740) = 61.3, P < 0.001). All branded packs were rated as less appealing than the standardised packs (significant effect of condition, F = 61.3, P < 0.001). Packs in the branded condition (mean = 4.9) were rated more appealing than packs in the standardised (mean = 2.3, β = ‐2.67, P < 0.001) and male/popular branded conditions (mean = 2.9, β = ‐2.07, P < 0.001). The standardised packs were also given lower appeal ratings than packs in the branded no‐descriptor (mean = 4.7, β = 2.40, P < 0.001) and branded male/popular conditions (β = ‐0.60, P = 0.013), and branded male/popular packs were given lower appeal ratings than the branded no‐descriptor packs (β = ‐1.80, P < 0.001) |
| Hammond 2014 | UK | Online within‐participants experiment | Youth | Male & female | Smokers and non‐smokers | Pairs of packs with 3 health warning sizes (40% text, 40% pictorial or 80% pictorial), 2 standardised pack colours (white vs brown) |
Different types and sizes (see Characteristics of included studies) |
Attractiveness: The type of health warning (text vs pictorial) had a significant effect on perceptions of pack attractiveness (Chi2 = 78.52, P < 0.001). Compared with standardised packs with text warnings, standardised packs with 40% and 80% pictorial health warnings were perceived as less attractive (β = ‐1.06, P < 0.001 and β =‐1.50, P < 0.001, respectively). Furthermore, the standardised pack with the 80% pictorial health warning was perceived as less attractive than the pack with the 40% warning (β = 0.45, P = 0.001). Smokers were significantly more likely to rate packs as more attractive than non‐smokers (β = 0.72, P = 0.003). Specific Comparisons: *Compared with the branded packs, the standardised pack was significantly less likely to be perceived as being more attractive across all 6 pairs of comparisons. Pair 1: Benson and Hedges Branded vs White Plain pack (PP) BH with 30% text warning: PP less likely to be perceived as attractive, P < 0.001, (branded = 42.4% vs standardised = 13.8% vs no diff = 43.8%) Pair 2: Benson and Hedges Branded vs White PP BH with 40% picture warning: PP less likely to be perceived as attractive, P < 0.001, (branded = 56.3% vs standardised = 4.7% vs no diff = 39.0%) Pair 3: Benson and Hedges Branded vs White PP BH with 80% picture warning: PP less likely to be perceived as attractive, P < 0.001, (branded = 58.0% vs standardised = 3.0% vs no diff = 39.0%) Pair 4: Benson and Hedges Branded vs Brown PP BH with 30% text warning: PP less likely to be perceived as attractive, P < 0.001, (branded = 43.3% vs standardised = 11.9% vs no diff = 44.8%) Pair 5: Benson and Hedges Branded vs Brown PP BH with 40% picture warning: PP less likely to be perceived as attractive, P < 0.001, (branded = 57.9% vs standardised = 5.1% vs no diff = 37.0%) Pair 6: Benson and Hedges Branded vs Brown PP BH with 80% picture warning: PP less likely to be perceived as attractive, P < 0.001. (branded = 58.7% vs standardised = 3.4% vs no diff = 37.9%) Pair 7: Silk Cut Superslims vs Regular Silk Cut: Compared with the regular Silk Cut pack, the Superslims pack was significantly more likely to be rated as attractive, P < 0.001, (branded = 60.0% vs standardised = 8.3% vs no diff = 31.8%) |
| Maynard 2015 | UK | Experimental between‐participants study wherein participants used branded or standardised packs for 24 hours | Young people | Male & female | Smokers | Usual UK brand or a standardised Australian pack (but matched their UK brand name) | Different types and sizes (see Characteristics of included studies) | Appealing: Standardised less likely than branded to be rated appealing, P < 0.001, β = ‐2.32, 95% CI ‐2.56 to ‐2.08. Stylish: Standardised less likely than branded to be rated stylish, P < 0.001, β = ‐2.12, 95% CI ‐2.44 to ‐1.81. Fashionable: Standardised less likely than branded to be rated fashionable, P < 0.001, β = ‐1.61, 95% CI ‐1.92 to ‐1.30. Coolness: Standardised less likely than branded to be rated cool, P < 0.001, β = ‐1.00, 95% CI ‐1.30 to ‐0.70. Attractiveness: Standardised less likely than branded to be rated attractive, P < 0.001, β = ‐1.55, 95% CI ‐1.89 to ‐1.22. OVERALL, Smokers randomised to the standardised cigarette pack condition, compared with those randomised to the branded cigarette pack condition, reported more negative experiences of using the pack (−0.52, 95% CI −0.82 to −0.22, P = 0.001), more negative ratings of the pack attributes (−1.59, 95% CI −1.80 to −1.39, P < 0.001). Attitudes to plain packs: no differences: β = −0.39, 95% CI −1.22 to 0.44, P = 0.350 |
| Miller 2015 | Australia | Cross‐sectional national online survey | Adult | Male & female | Cigar and/or cigarillo smokers | Standardised packaging vs branded packaging (cigar and cigarillo) | Brand from 2 years ago compared to 75% pictorial HW on both sides | 53% of participants reported that the appeal of the packaging of the product they currently smoked compared with "two years ago" (a period including the introduction of standardised packaging) was lower, 35% the same, and 12% higher; when assessing appeal of the product, 60% said the same, 28% lower, 12% higher |
| Moodie 2011 | UK | Counterbalanced repeated measures (within‐participants) experiment | Adult | Male & female | Smokers | Their own branded packs vs standardised packs | Average‐size HW for both types of packs: 30% on front and 40% on back. | Standardised packs were rated as significantly lower across a range of appeal measures (appeal, attractive, stylish, fashionable, cool) and composite appeal measures, than their own branded packs, at all measurement points. Appealing: standardised packs were rated significantly less appealing than branded packs on all 4 measures. Measure 1: standardised = 1.76 vs branded = 3.07, P < 0.001; Measure 2: standardised = 1.84 vs branded = 3.07, P < 0.001; Measure 3: standardised = 1.76 vs branded = 3.02, P < 0.001; Measure 4: standardised = 1.71 vs branded = 2.93, P < 0.001. Attractive: standardised packs were rated significantly less attractive than branded packs on all 4 measures. Measure 1: standardised = 1.59 vs branded = 3.05, P < 0.001; Measure 2: standardised = 1.43 vs branded = 2.87, P < 0.001; Measure 3: standardised = 1.54 vs branded = 2.87, P < 0.001; Measure 4: standardised = 1.67 vs branded = 2.84, P < 0.001: Style: standardised packs were rated significantly less stylish than branded packs on all 4 measures. Measure 1: standardised = 1.43 vs branded = 3.09, P < 0.001; Measure 2: standardised = 1.36 vs branded = 3.07, P < 0.001; Measure 3: standardised = 1.35 vs branded = 2.87; P < 0.001; Measure 4: standardised = 1.42 vs branded = 2.91, P < 0.001: Fashion: standardised packs were rated significantly less fashionable than branded packs on all 4 measures. Measure 1: standardised = 2.05 vs branded = 3.00, P < 0.01; Measure 2: standardised = 1.84 vs branded = 2.77, P < 0.01; Measure 3: standardised = 1.89 vs branded = 2.80, P < 0.01; Measure 4: standardised = 2.04 vs branded = 2.80, P < 0.001: OVERALL PACK PERCEPTIONS Rating Scale (stylish, fashionable, cheap, cool, attractive, quality, appealing: Measure 1: standardised = 1.72 vs branded = 3.05, P < 0.001; Measure 2: standardised = 1.84 vs branded = 3.03, P < 0.001; Measure 3: standardised = 1.63 vs branded = 3.00, P < 0.001; Measure 4: standardised = 1.73 vs branded = 3.01, P < 0.001 |
| Moodie 2013 | UK | Counterbalanced repeated measures (within‐participants) experiment | Adult | Female | Smokers | Their own branded packs vs standardised packs | Average‐size HW for both types of packs: 30% on front and 40% on back | Appeal Measures: All appeal measure were rated as less positive for standardised packs than branded packs at both the midweek and weekend surveys: Stylish, fashionable, cheap, cool, attractive, appealing all P < 0.001 for plain vs own brand, midweek and weekend. Note: there are so many means reported (as study above) ‐‐ 1 measure for midweek survey and 1 for weekend survey |
| Wakefield 2008 | Australia (prior to standardised packaging) | Online between‐participants experiment | Adult | Male & female | Smokers | 12 conditions (3 brand and 4 degrees of standardised packaging (cardboard brown)) | All conditions had the same graphic warning visible on the top of the face of the pack |
Branded (Original) is the reference: Bivariate logistic regression analyses comparing percentage of smokers who agreed with rated attributes, by pack condition.
Attractive‐looking pack measure: Standardised pack 1 (0.53, P < 0.01), standardised pack 2 (OR 0.45, P < 0.001) and standardised pack 3 (OR 0.47, P < 0.001) were all rated significantly less attractive‐looking compared to branded pack. OR linear trend = 0.79 (P < 0.001). Popular brand among smokers: Branded: 83.5%; REF SP1: 78.1%, OR 0.70, n.s. SP2: 75.9%, OR 0.62, n.s. SP3: 67.1%, OR 0.40, P < 0.001 Linear Trend: 0.75, P < 0.01 Trendy/stylish: Branded: 47.2% SP1: 38.4%, OR 0.70, n.s. SP2: 34.2% OR 0.58, P < 0.05 SP3: 32.0% OR 0.53, P < 0.01 Linear trend: OR 0.81, P < 0.01 |
| Wakefield 2012 | Australia (prior to standardised packaging) | Between‐participants experiment | Adult | Male & female | Smokers | 2 branded packs that differed by health warning size (30% vs 70% vs 100%) And 2 standardised (cardboard‐brown) |
Health warnings were pictorial. 100% health warnings had side pack information still branded in the branded condition |
1. Positive pack characteristics ('popular among smokers’; ‘attractive’; ‘sophisticated’; and ‘a brand you might try/smoke’)
Means of pack type and health warning size Branded 30%: 4.7 (1.7) Branded 70%: 4.0 (1.6) Branded 100%: 4.1 (1.7) SP 30%: 3.6 (1.6) SP: 70%: 3.6 (1.8) SP: 100%: 3.4 (1.7) Main effect for plainness: P < 0.001 2. Positive smoker characteristics (typical smoker of this pack of cigarettes is . . .’: ‘trendy’; ‘successful’): Branded 30%: 4.5 (1.9) Branded 70%: 4.0 (1.9) Branded 100%: 3.9 (2.1) SP 30%: 3.4 (1.9) SP 70%: 3.4 (2.1) SP 100%: 3.4 (2.1) Main effect: P < 0.001 3. Negative smoker characteristic: boring: Branded 30%: 4.2 (1.7) Branded 70%: 4.3 (1.8) Branded 100%: 4.0 (1.9) SP 30%: 4.9 (2.1) SP 70%: 4.5 (2.3) SP 100%: 4.4 (2.2) Main effect for plainness: P = 0.001 Note: By contrast, increasing size of PHW above 30% only reduced ratings of ‘positive pack characteristics’ (P = 0.001), but also decreased ratings of smokers as being ‘boring’ (P = 0.027). Plainness and size of PHW interacted in predicting ratings of ‘positive pack characteristics (P = 0.008), so that when packs were standardised, increasing the size of PHW above 30% did not further reduce ratings |
| Wakefield 2015 | Australia | Serial cross‐sectional surveys before, during and after standardised packaging | Adult | Male & female | Smokers | Own brand vs standardised packaging before, during and after standardised packaging implementation | 75% pictorial HW on both sides | Compared to Pre‐PP (before):Dislikes pack: transition (during): OR 1.32 (95% CI 1.08 to 1.62) P = 0.007; 1‐year (after): 4.06 (95% CI 3.52 to 4.69) P < 0.001; Proportion dislikes pack (n = 6728): Pre‐PP: 59.1%; Transition: 65.0%; PP year 1: 84.9% Lower pack appeal than a year ago: Transition: OR 2.59 (95% CI 1.99 to 3.37) P < 0.001; 1‐year: 9.29 (95% CI 7.79 to 11.09) P < 0.001 (adjusted) Proportions lower pack appeal than a year ago(n = 6179): Pre‐PP: 12.7%; Transition: 26.0%;PP year 1: 55.8% |
| White 2012 | Brazil | Online between‐participants experiment | 16 ‐ 26 years | Female | Smokers and non‐smokers | Branded vs standardised with and without descriptors | Not visible | A linear regression was conducted using an index score for brand appeal that combined all 10 packs to examine overall differences in appeal between the experimental conditions, adjusting for age, education, ethnicity, and smoking status. A significant main effect of condition was found (F = 43.1, P < 0.001), where packs in the branded condition (mean = 6.0) were rated as significantly more appealing than packs in the standardised condition (mean = 4.3, β = 1.64, P < 0.001), and standardised no‐descriptors condition (mean = 3.4, β = 2.53, P < 0.001). The standardised packs were also given significantly higher appeal ratings than the standardised no‐descriptor packs (β = 0.89, P = 0.002) |
| White 2015a | Australia | Pre‐post cross‐sectional school‐based surveys | Adolescent | Male & female | Those who had seen a cigarette pack in the last 6 months | Branded vs standardised in Australia | 75% pictorial HW on both sides |
Attraction of cigarette packs Among students who had seen a cigarette pack in the previous 6 months, negative pack image ratings increased (F (1,184) = 28.80, P < 0.001), while positive image ratings decreased between 2011 and 2013 (F (1,184) = 40.26, P < 0.001). The largest change was found for the statement‘Some brands have better looking packs than other brands’ with fewer students agreeing with this statement in the post‐survey (25%) than the pre‐survey (43%) |
2. Taste.
| Study ID | Country | Design | Age | Gender | Smoking status | Pack characteristics | Health Warnings | Summary of key results |
| Adkison 2014 | USA | Online within‐participants experiment | Adult | Men & women | Smokers & non‐smokers | Most appealing pack (to participant) vs standardised brown pack |
30% text warning | Standardised (3.7%); branded (52.5%); no difference (43.8%) (P < 0.001) |
| Bansal‐Travers 2011 | USA | Cross‐sectional mall intercept study | Adult | Men & women | Smokers & non‐smokers | Branded vs standardised (white); Warning label 0%, 30%, 50%, 100% |
Standardised pack, no warning label. Branded 30% vs 50% vs 100% warning | No warning label: 69% branded vs 25% standardised, P < 0.001 Warning label (branded 30% or 50% vs plain = 100%): 55% for the 30% warning label, 16% for the 50%, and 12% for the 100% warning label (equivalent to standardised packaging) ‐ participants perceived the 30% warning as having the smoothest taste, P < 0.001, no difference between 50% and 100% |
| Brose 2014 | UK | Between‐participants experiment recruited from an online pool | Young adult | Men & women | Smokers | Branded vs standardised (mirrored Australia, green/brown) | Branded: 30% text on front; 40% pictorial on back standardised: 75% pictorial warning on front, 90% on back |
Standardised pack significantly lower rating than preferred pack: Preferred: 3.81 (0.14) Not Preferred: 2.95 (0.14) Standardised: 2.59 (0.18) F = 19.45, P < 0.001; The non‐preferred pack received a significantly lower rating than preferred pack. No differences between standardised and non‐preferred packs |
| Doxey 2011 | Canada | Online between‐participants experiment | Young adult | Females | Smokers & non‐smokers | 1. female‐branded with descriptors 2. female‐branded with no descriptors 3. male‐branded packs 4. standardised (white) |
50% health warning (pictorial with text) | A significant main effect of condition was found (F = 6.04, P = 0.001), such that the branded female packs (mean = 2.4) were given higher taste ratings than the branded female packs with no descriptors (mean = 1.9; β = ‐0.54, P = 0.01), standardised white packs (mean = 1.1; β = ‐1.32, P < 0.001) and male‐branded packs (mean = 1.9; β = ‐0.43, P = 0.004). In addition, packs in the male‐branded pack condition and packs in female‐branded no‐descriptors condition were given higher taste ratings than the standardised white pack condition (β = ‐0.9, P = 0.01; β = ‐0.79, P < 0.001, respectively) |
| Gallopel‐Morvan 2012 | France | Between‐participants experiment | Adolescents & young people | Male & female | Smokers & non‐smokers | Popular branded pack vs 3 standardised packs (white, grey, brown) |
All packs text warning ‘Fumer Tue’ (Smoking Kills) covering 30% of the front panel of the pack. Only picture of front of pack shown | Grey & white standardised packs were rated as containing significantly more lighter‐tasting cigarettes than the branded pack, (F = 22.22, P < 0.001). Compared to the brown pack, both the white and grey standardised packs were considered to contain lighter cigarettes (F = 10.56, P < 0.001) |
| Gallopel‐Morvan 2015b | France | Experimental study in which they transferred their tobacco into standardised packs and used them for 10 days | 25 ‐ 40 years | Female | Smokers | As in Australia, brown | 75% pictorial HW on both sides | Taste: (bad to good): branded pack β = 4.32 (0.73) standardised pack = 3.87 (0.90) t = 5.05 (P < 0.001) Taste lighter: branded pack β = 3.56 (1.13) standardised pack = 3.11 (0.95) t = 4.12 (P < 0.001) |
| Gallopel‐Morvan 2015a | France | Experimental study in which they transferred their tobacco into standardised packs and used them for 10 days | Young adult | Female | RYO smokers | Branded: own brand Standardised: As in Australia (brown) |
Branded: text warnings covering 40% of pack surface Standardised: 75% pictorial warning on front and 90% back |
The tobacco tastes good: branded = 4.26, standardised = 3.93, −4.13 (P < 0.001); The tobacco tastes light: branded = 3.29, standardised = 3.04, 2.08 (0.04). In relation to whether the taste of tobacco was the same when in the standardised pack, asked only at the end of the study, 25.6% agreed (completely or slightly) that they did not feel that the tobacco tasted the same as usual, 35.4% disagreed (completely or slightly) and 39.1% had no opinion |
| Germain 2010 | Australia (prior to standardised packaging) | Online between‐participants experiment | Adolescents | Male & female | Smokers & non‐smokers | 5 levels of packaging and 3 brands in which branding was progressively removed from the pack | Varied by condition (see Characteristics of included studies) |
Positive taste characteristics: Branded: 2.71 (0.9) Standardised 1: 2.52 (0.9) Standardised 2: 2.62 (0.9) Standardised 3: 2.38 (0.9) F = 5.88 P = 0.001 (only standardised pack 3 rated significantly lower than branded pack condition) Cheap tasting: Branded: 3.27 (0.9) Standardised 1: 3.42 |
| Guillaumier 2014 | Australia (prior to standardised packaging) | Between‐participants experiment | Socially disadvantaged adults |
Men & women | Smokers | 4 conditions involving 2 brands with branded & standardised (drab brown) versions | As per Australian standards (see Characteristics of included studies) |
The 4 pack conditions were rated significantly differently when assessing positive taste characteristics (P = 0.033): Pairwise comparisons revealed that standardised packaging images were less appealing on taste attributes than branded packaging images for the Winfield condition (P = 0.004) but not B+H (P = 0.804) |
| Hammond 2009 | UK | Online within‐participants experiment | Adult smokers & youth | Male & female | Smokers and non‐smokers | 2 brands branded vs standardised (brown & white) | All of the packs shown to participants displayed the same pictorial health warning covering 30% of the ‘front’ of the pack | Fewer adults perceived the plain packs as having differences in smooth taste compared to the branded packs, P < 0.001. Fewer youth perceived the plain packs as having differences in smooth taste compared to the branded packs, P < 0.001 |
| Hammond 2011 | USA | Online between‐participants experiment | 18 ‐ 19‐year‐olds | Female | Smokers & non‐smokers | 8 cigarette packs in 4 experimental conditions: 1) Fully‐branded female packs 2) Fully‐branded female packs without descriptors (e.g. slims) 3) Standardised (same packs without brand imagery or descriptors, brown‐coloured) 4) non‐female‐ (male‐) branded packs |
No health warnings | A linear regression model using the taste index variable across all 8 packs found a significant main effect of condition (F = 15.1, P < 0.001), such that the branded+descriptor packs (M = 3.4) were given higher taste ratings than the no‐descriptor packs (M = 2.7 , β = −0.12, P = 0.004) and the standardised packs (M = 1.9 , β = −0.30, P < 0.001). Packs in the standardised condition were given lower taste ratings than packs in the male ( M = 3.0, β = −0.23, P < 0.001) and no‐descriptor conditions (β = 0.18, P < .001) |
| Hammond 2013 | UK | Online between‐participants experiment | Youth | Female | Smoking and non‐smoking | 1) branded female‐oriented packs 2) female‐oriented branded packs, no descriptors (e.g. slims) 3) standardised: female‐oriented packs, no branding or descriptors, cardboard‐coloured 4) control: popular UK brands but non–female‐oriented packs |
30% text‐only black & white | A significant effect of condition was found (F = 13.8, P < 0.001): branded packs (mean = 3.4) were given higher taste ratings than the standardised packs (mean = 1.8; β = ‐1.56, P < 0.001) and the branded popular/male packs (mean = 2.5, β = ‐1.00, P < 0.001). Packs in the standardised condition were given lower taste ratings than packs in the branded popular/male (β = ‐0.55, P = 0.027) and branded no‐descriptor conditions (mean = 2.5, β = ‐0.62, P = 0.013) |
| Hammond 2014 | UK | Online within‐participants experiment | Youth | Male & female | Smoking and non‐smoking | Pairs of packs with 3 health warning sizes (40% text, 40% pictorial or 80% pictorial), 2 standardised pack colours (white vs brown) | Different types and sizes (see Characteristics of included studies) |
The standardised packs with the 40% and 80% pictorial health warnings were less likely to be perceived as having a smoother taste than the standardised pack with the text warnings (β = ‐0.97, P < 0.001 and β = ‐1.63, P < 0.001 respectively). Furthermore, the standardised pack with the 80% pictorial health warning was less likely to be perceived as having a smoother taste than the pack with the 40% warning (β = ‐0.66, P < 0.001). The colour of the plain packaging also had a significant effect on perceptions of product smoothness (Chi2 = 4.99, P = 0.025). The brown standardised packs were less likely to be perceived as having a smoother taste than the white standardised packs (β = ‐0.25, P = 0.025) |
| Kotnowski 2015 | Canada | Online survey | 16 ‐ 24 | Female | Smokers & non‐smokers | Different packaging attributes (structure, brand, branding, warning label size and price) | 50% or 70% depending on condition | Regular (ref) vs Lipstick: taste better: β = 0.41, P < 0.01
Regular (ref) vs Slim: taste better: β = −0.14, P < 0.05
Regular (ref) vs Booklet: taste better: β = 0.08, n.s. Branding (standardised vs branded): Branded packs were preferred over standardised packs, β = 0.17, P < 0.01 |
| Maynard 2015 | UK | Experimental between‐participants study wherein participants used branded or standardised packs for 24 hours | Adult | Men & women | Smokers | Usual UK brand or a standardised Australian pack (but matched their UK brand name) | Different types and sizes (see Characteristics of included studies) |
Branded M = 3.22, standardised Mean = 3.51, β = 0.2 (95% CI ‐0.08 to 0.48), P = 0.154 |
| Miller 2015 | Australia | Cross‐sectional national online survey | Adult | Men & women | Cigar and/or cigarillo smokers | Standardised packaging vs branded packaging (cigar and cigarillo) | Brand from 2 years ago compared to 75% pictorial HW on both sides |
Changes in taste & enjoyment: 19% lower (± 5% CI) (15% higher; 66% same): 19% lower (± 5% CI) (15% higher; 66% same) |
| Moodie 2012 | UK | Online within‐participants discrete choice experiment | 10 ‐ 17 | Male & female | Smokers & non‐smokers | All standardised packs: different structural designs and colours | Shown in all images “Smoking kills” on the front, 30% text warning | The red pack tended to be associated with stronger taste, with 29% considering red to be the strongest‐tasting cigarettes. The lighter colours were generally associated with weaker taste. The light‐blue pack was generally associated with weak taste (15%), while the white pack was most clearly associated with weak taste (27%) |
| Wakefield 2008 | Australia (prior to standardised packaging) | Online between‐participants experiment | Adult | Men & women | Smokers | 12 conditions (3 brand and 4 degrees of standardised packaging (cardboard brown)) | All conditions had the same graphic warning visible on the top of the face of the pack | Tastes like cheap tobacco: Not significant for any of the 3 standardised packs compared to branded packaging; Linear Trend: not significant: 0.97 (P > 0.05); Original: 54.5% S1: 47.0, n.s. S2: 50.3%, n.s. S3: 50.7%, n.s. Trend: n.s. Rich in tobacco: Standardised pack 2 (OR 0.58, P < 0.05) and 3 (OR 0.64, P < 0.05) were rated as significantly lower in richness of tobacco flavouring compared to branded pack. Original = 76.1% S1: 70.8%, n.s. S2: 64.8%, OR 0.58, P < 0.05 S3: 67.1%, OR 0.64, P < 0.05 Trend: OR 0.86, P < 0.05 |
| Wakefield 2012 | Australia (prior to standardised packaging) | Between‐participants experiment | Adults | Men & women | Smokers | 2 branded packs that differed by health warning size (30% vs 70% vs 100%) And 2 standardised (cardboard‐brown) |
Health warnings were pictorial. 100% health warnings had side pack information still branded in the branded condition |
Positive taste characteristics: 'enjoyable to smoke’; and ‘satisfying in taste’ Branded 30%: 5.1 (1.9) Branded 70%: 4.8 (1.9) Branded 100%: 4.9 (2.1) Standardised 30%: 4.6 (2.0) Standardised 70%: 4.8 (2.2) Standardised 100%: 4.8 (2.2) Main effect for plainness: P = 0.039 |
| Wakefield 2015 | Australia | Serial cross‐sectional surveys before, during and after standardised packaging | Adults | Men & women | Smokers | Own brand vs standardised packaging before, during and after standardised packaging implementation | After implementation, 75% pictorial HW on both sides. | Believes brands do not differ in taste: no differences compared to pre‐standardised packaging: Transition: OR 1.27 (95% CI 0.90 to 1.80) P = 0.174; 1‐year: OR 1.17 (95% CI 0.93 to 1.47) P = 0.189 Proportions: Believes brands do not differ in taste (n = 6840) Pre‐standardised: 6.7% Transition: 8.1% Post‐standardised year 1: 7.7% |
| White 2012 | Brazil | Online between‐participants experiment | 16 ‐ 26 years | Female | Smokers and non‐smokers | Branded vs standardised with and without descriptors | Not visible | A significant main effect of condition was found (F = 45.7, P < 0.001), such that the branded packs (mean = 4.9) were given higher taste ratings than the standardised packs (mean = 3.9, β = 1.01, P < 0.001), and the standardised, no‐descriptor packs (mean = 2.3, β = 2.62, P < 0.001). In addition, packs in the standardised condition were given significantly higher taste ratings than the packs in the standardised no‐descriptors condition (β = 1.60, P < 0.001) |
3. Quality/value/demand.
| Study ID | Country | Design | Age | Gender | Smoking status | Pack characteristics | Health Warnings | Summary of key results |
| Adkison 2014 | USA | Online within‐participants experiment | Adult | Men & women | Smokers & non‐smokers | Most appealing pack (to participant) vs standardised brown pack |
30% text warning | Branded pack was reported to contain smokeless tobacco of better quality (Chi2 (n = 1000) = 388.142 expected = 333, observed = 401) No other stats reported |
| Babineau 2015 | Ireland | School‐based (pen and paper) within‐participant cross‐sectional survey |
16 ‐ 17 years | Male & female |
Smokers & non‐smokers |
branded (conforming to EU regulations) vs standardised (brown‐matte) |
65% text & pictorial health warnings | 52.5% selected branded pack, 34.4% no pack and 13.1% a standardised pack |
| Balmford 2015 | Australia | Pre‐post cohort surveys (baseline & 2 follow‐up waves) |
Adult | Men & women | Smokers | Branded vs standardised (as implemented in Australia) | 75% pictorial warning on front, 90% on back | An increase in the proportion that stated brands do not differ in prestige (or did not know): Wave 2: 0.49 (0.40 to 0.61) P < 0.001, and at 0.51 (0.39 to 0.66) P < 0.001 at Wave 3 (compared to Wave 1). How much do brands differ in prestige: Not at all: Pre‐PP: 19.1%, Post‐PP‐Y1: 25.3%, Post‐PP‐Y2: 22.4% A little/somewhat/very different: Pre‐PP: 74.9%, Post‐PP‐Y1: 60.1%, Post‐PP‐Y2: 61.0% There was a significant reduction from pre‐ to post‐SP in the proportion that perceived their brand to be of high or very high quality: Wave 2: 0.76 (0.63 to 0.92), P < 0.01 and Wave 3: 0.64 (0.51 to 0.81), P < 0.001 (compared to Wave 1). Proportions believe their brand to be of high or very high quality: Wave 1 (Pre‐PP): 47.4% Wave 2 Post‐PP year 1 (2013): 42.7% Wave 3 Post‐PP year 2 (2014): 39.3% |
| Bansal‐Travers 2011 | USA | Cross‐sectional mall intercept study | Adult | Men & women | Smokers & non‐smokers | Branded vs standardised (white) | Standardised pack no warning label. Branded 30% vs 50% vs. 100% warning | Branded vs standardised pack (no warning label): branded = 81% vs. standardised = 18% Participants stated they would buy the branded pack, P < 0.001. Size of warning label (branded 30% or 50% vs standardised = 100%): Participants stated they would buy the pack with the 30% warning, P < 0.001, with no difference between 50% and 100%. Perception of better quality: branded = 92% vs standardised = 6%. Standardised vs branded with no warning, Participants perceived the cigarettes in the branded pack to be of better quality, P < 0.001 |
| Borland 2013 | Australia (prior to standardised packaging) | Within‐participants component of a mixed design experiment | 18 ‐ 29 | Men & women | Ever‐smokers (80% current) | All standardised packs (beige), 5 pack shapes, 5 pack openings |
30% front and back, 70% front and back, but only image of front shown |
Repeated measures analysis of variance of pack shape x warning size x branding showed main effects between the pack shapes on quality (F (3.6) = 9.80, P < 0.001), with no significant interactions.
There were main effects for pack openings for quality of cigarette (F (3.4) = 2.74, P = 0.036). There were main effects for quality of cigarette (F (3.4) = 2.74, P = 0.036). The rounded pack was rated as having the highest quality cigarettes (P < 0.001). The most preferred packs were the bevelled and rounded packs. No P‐values or stats. Post hoc tests showed that the standard flip‐top was rated lower in perceived quality compared with the slide opening style (P = 0.044) |
| Brose 2014 | UK | Between‐participants experiment recruited from an online pool | Youth | Male & female |
Smokers | Branded vs standardised (mirrored Australia, green/brown) |
Branded: 30% text on front; 40% pictorial on back standardised: 75% pictorial warning on front, 90% on back |
Pairwise comparisons indicated that the standardised pack received lower ratings than both of the branded packs (preferred and non‐preferred) for effectiveness of motivation to buy: Means: Motivation to Buy: Preferred: 2.97 (0.17) Not preferred: 2.79 (0.17) Plain: 2.09 (0.17) F = 7.63, P = 0.001 |
| Ford 2013 | UK | Cross‐sectional survey | 11 ‐ 16‐year‐olds | Male & female |
Never smoking | 4 branded (3 were novelty) vs 1 standardised (brown) |
30% front, 40% back black text |
There was no significant difference between the standardised pack and regular Mayfair pack in terms of the likelihood of being receptive (AOR = 0.85, 95% CI 0.68 to 1.07, P = 0.172). Participants were significantly more likely to be receptive to the 3 ‘novelty’ packs compared to the ‘regular’ branded Mayfair pack |
| Gallopel‐Morvan 2011 | France | Cross‐sectional household survey | Adults | Male & female |
Smokers and non‐smokers | 3 popular brands: regular branded, limited edition branded vs standardised (grey) | 30% text | Appears to be the most expensive – branded: 78% vs standardised: 7%. Respondents more likely to say that the branded pack appeared to be most expensive, P < 0.01. Gives the impression that the cigarettes inside are good quality ‐ branded: 66.5% vs standardised: 8.1%. Respondents more likely to say that the branded pack gave the impression that the cigarettes inside were good quality, P < 0.01 |
| Gallopel‐Morvan 2012 | France | Between‐participants experiment | Adolescents & young people | Male & female |
Smokers and non‐smokers | Popular branded pack vs 3 standardised packs (white, grey, brown) |
30% text | Good Quality: The branded pack was rated significantly higher than the 3 standardised packs for good‐quality cigarettes (59.13, P < 0.001). There were no differences for the 3 standardised packs, P = 0.097. Motivates Purchase: The branded pack was rated significantly higher than the 3 standardised packs for motivating purchase, F = 20.96, P < 0.001. The grey pack was found to motivate purchase significantly more than the brown and white packs (F = 3.52, P = 0.03), main effect, but post hoc testing showed no significant difference |
| Gallopel‐Morvan 2015b | France | Experimental study in which they transferred their tobacco into standardised packs and used them for 10 days | 25 ‐ 40 years | Women | Smokers | As in Australia, brown | As in Australia |
Quality (higher score better quality): Branded = 4.29 (0.73) Standardised = 3.79 (0.91) t = 5.53 (P < 0.001) The pack makes you want to buy it (higher = more motivated): Branded = 4.03 vs Standardised = 2.58, t = 11.47 (P < 0.001) Satisfaction: Branded = 3.96 (0.73) Standardised = 2.91 (1.07) t = 10.18 (P < 0.001); Pleasure: Branded = 4.02 (0.76) PP = 2.99 (1.09) t = 9.8 (P < 0.001) |
| Gallopel‐Morvan 2015a | France | Experimental study in which they transferred their tobacco into standardised packs and used them for 10 days | Young adult | Men & women | RYO smokers | Branded: own brand Standardised: As in Australia (brown) |
Branded: text warnings covering 40% of pack surface Standardised: 75% pictorial warning on front and 90% back |
Participants reported less pleasure and less satisfaction when smoking from the standardised pack than from their own pack. Unsatisfying (1) to very satisfying (5): branded = 3.81, standardised = 2.96, 7.75 (P < 0.001); Unpleasant (1) to pleasurable (5): branded = 3.91, standardised = 3.19, t = −6.19 (P < 0.001). (2) Feelings about using the pack in front of others: Participants also indicated that they felt more embarrassed when using the standardised pack than their own pack (branded = 1.35 vs standardised = 2.35; t = −6.98 (P < 0.001), and felt that they were spreading a bad image of themselves when they used the standardised pack (branded = 2.57 vs standardised = 3.09, t = −4.20 (P < 0.001). Product perceptions: Ratings for the items concerning quality were lower for the plain pack: The tobacco is good quality: Branded = 4.20, plain = 3.78, t = 4.92 (P < 0.001). The tobacco is natural: Branded = 3.25 vs standardised = 2.62, t = −4.17 (P < 0.001). Demand: This pack makes me feel like buying it: Branded = 4.04, standardised = 2.80, t = 10.02 (P < 0.001) |
| Germain 2010 | Australia (prior to standardised packaging) | Online between‐participants experiment | Adolescents | Male & female | Smokers and non‐smokers | 5 levels of packaging and 3 brands in which branding was progressively removed from the pack | Varied by condition (see Characteristics of included studies) |
Respondents rated smokers of pack 3 (standardised), also rated smokers of the pack to be more ‘‘lower class’’ than did those who saw the branded pack (P < 0.01). Mean Lower class: branded/original: 2.95 (1.1) Plain Pack 1: 3.16 (1.0) Plain Pack 2: 3.09 (1.1) Plain pack 3: 3.24 (1.2) F = 2.72, P = 0.043 (only plain pack 3 was rated higher in terms of low class ratings compared to branded pack) |
| Guillaumier 2014 | Australia (prior to standardised packaging) | Between‐participants experiment | Socially disadvantaged adults |
Men & women | Smokers | 4 conditions involving 2 brands with branded & standardised (drab brown) versions | As per Australian standards (see Characteristics of included studies) |
|
| Hammond 2014 | UK | Online within‐participants experiment | 11 ‐ 17‐year‐olds | Male & female | Smokers & non‐smokers | Pairs of packs with 3 health warning sizes (40% text, 40% pictorial or 80% pictorial), 2 standardised pack colours (white vs brown) | Different types and sizes (see Characteristics of included studies) |
Pack preference: Overall, 64.2% of respondents selected 1 of the 4 packs. Among the total sample, 60.9% selected either of the 2 branded packs compared with 3.2% who selected either of the 2 standardised packs (P < 0.001). Among respondents who selected a pack, 95.1% selected a branded pack compared with 4.9% who selected a standardised pack. |
| Maynard 2015 | UK | Experimental between‐participants study wherein participants used branded or standardised packs for 24 hours | Young adults | Men & women | Smokers | Usual UK brand or a standardised Australian pack (but matched their UK brand name) | Different types and sizes (see Characteristics of included studies) |
Enjoyment of Smoking: Smokers randomised to the standardised cigarette pack condition, compared with those randomised to the branded cigarette pack condition, reported less enjoyment of smoking, P = 0.037, β = ‐0.36, 95% CI ‐0.69 to ‐0.02;
Satisfaction of Smoking: No significant difference between groups: β = ‐0.18, 95% CI ‐0.54 to 0.18, P = 0.312. Cheap‐Expensive: Standardised more likely than branded to be rated cheap, P < 0.001, β = ‐1.53, 95% CI ‐1.88 to ‐1.19. Quality: Standardised less likely than branded to be rated good quality, P < 0.001, β = ‐1.05, 95% CI ‐1.37 to ‐0.72 |
| Miller 2015 | Australia | Cross‐sectional national online survey | Adult | Men & women | Cigar and/or cigarillo smokers | Standardised packaging vs branded packaging (cigar and cigarillo) | Brand from 2 years ago compared to 75% pictorial HW on both sides |
Perceived quality: 16% lower (± 4% CI) (15% higher; 69% same) Perceived value for money: 41% reported the same, 41% lower, 18% higher |
| Moodie 2011 | UK | Counterbalanced repeated measures (within‐participants) experiment | Adult | Men & women | Smokers | Their own branded packs vs standardised packs | Average‐size HW for both types of packs: 30% on front and 40% on back |
Enjoyment: Standardised packs were rated as less enjoyable
M1: Standardised = 2.53 vs branded = 3.37, P < 0.001;
M2: standardised = 2.73 vs branded = 3.30, P < 0.01;
M3: standardised = 2.78 vs branded = 3.13, P < 0.05;
M4: standardised = 2.62 vs branded = 3.18, P < 0.001
Satisfaction: Standardised packs were rated as less satisfying
M1: Standardised = 2.65 vs branded = 3.35, P < 0.001;
M2: Standardised = 2.58 vs branded = 3.22, P < 0.01;
M3: Standardised = 2.70 vs branded = 3.13, P < 0.05;
M4: Standardised = 2.61 vs branded = 3.20, P < 0.001;
Overall ratings for the standardised pack did not vary across time. However, the average overall feelings about smoking from their usual pack were less positive at the third and fourth measures compared with the first.
Overall feeling about smoking (enjoyment/satisfaction):
M1: Standardised = 2.60 vs branded = 3.36, P < 0.001;
M2: Standardised = 2.67 vs branded = 3.28, P < 0.01;
M3: Standardised = 2.77 vs branded = 3.11, P < 0.05;
M4: Standardised = 2.63 vs branded = 3.17, P < 0.001; Quality: Standardised packs rated as lower quality. M1: Standardsied = 2.05 vs branded = 3.43, P < 0.001; M2: Standardised = 2.07 vs branded = 3.48, P < 0.001; M3: Standardised = 1.91 vs branded = 3.40, P < 0.001; M4: Standardised = 1.89 vs branded = 3.40, P < 0.001; Cheap: Standardised packs rated as cheaper than branded. M1: Standardised = 1.62 vs branded = 3.20, P < 0.001; M2: Standardised = 1.66 vs branded = 3.00, P < 0.001; M3: Standardised = 1.57 vs branded = 3.13, P < 0.001; M4: Standardised = 1.65 vs branded = 3.15, P < 0.001 |
| Moodie 2013 | UK | Counterbalanced repeated measures (within‐participants) experiment | Adult | Women | Smokers | Their own branded packs vs standardised packs | Average‐size HW for both types of packs: 30% on front and 40% on back | Satisfying and enjoyable, all P < 0.001 for standardised vs own branded, midweek and weekend.
Enjoyment: Standardised packs rated as less enjoyable on both measures.
Midweek: standardised mean = 2.90 vs branded mean = 3.40, P < 0.001.
Weekend: standardised = 2.73 vs branded = 3.40, P < 0.001.
Satisfaction: Standardised packs rated as less satisfying on both measures.
Midweek: standardised = 2.99 vs branded = 3.52, P < 0.001.
Weekend: standardised = 2.83 vs branded = 3.41, P < 0.001. Quality: Standardised packs rated as lower in quality on both measures. Midweek: Standardised = 2.37 vs branded = 3.69, P < 0.001. Weekend: standardised = 2.26 vs branded = 3.64, P < 0.001 |
| Wakefield 2013 | Australia | Cross‐sectional survey | Adult | Men & women | Smokers | Their own branded packs vs standardised packs | 30% front of pack vs 75% pictorial HW on both sides. | Brand satisfaction: Lower than a year ago Model 1: Compared with branded pack smokers, those smoking from standardised packs had a tendency to rate their packs as less satisfying compared to a year ago, but this was not significant (AOR 1.70, P = 0.052). Model 2: not significant OR 1.53 (95% CI 0.88 to 2.63) P = 0.13. Note: Model 1 adjusts for significant bivariate variables and model 2 additionally controlled for the proportion of the sample interviewed during each survey week who reported smoking from a standardised pack |
| Wakefield 2008 | Australia (prior to standardised packaging) | Online between‐participants experiment | Adult | Men & women | Smokers | 12 conditions (3 brand and 4 degrees of standardised packaging (cardboard‐brown) | All conditions had the same graphic warning visible on the top of the face of the pack | Satisfying: Original = 72.7% SP1: 65.3%, OR 0.71, n.s. SP 2: 64.8%, OR 0.69, n.s. SP3: 61.2%, OR 0.59, P < 0.05 Linear trend: OR 0.86, P < 0.05 Value for money: not significant Original= 56.8% SP 1= 55.7%, n.s. SP2: 50.8%, n.s. SP3: 49.3%, n.s. Trend = n.s. Exclusive/expensive brand: not significant Original: = 39.8% SP1: 44.7% SP2: 38.2% SP3: 40.2% Trend: n.s. Brand you might try/smoke: not significant Original = 59.1% SP1: 55.7% SP2: 53.3% SP3: 51.6 trend = n.s. Lower class: not significant Original = 52.8% SP1: 54.3% SP2: 50.3% SP3: 53.0% Trend: n.s. Of the highest quality tobacco: significant for SP3 and trend over time Original = 60.8% SP1: 59.8%, n.s. SP2: 51.8%, n.s. SP3: 50.7%, OR 0.66, P < 0.05 Trend: OR 0.85, P < 0.05 |
| Wakefield 2012 | Australia (prior to standardised packaging) | Between‐participants experiment | Adult | Men & women | Smokers | 2 branded packs that differed by health warning size (30% vs 70% vs 100%) And 2 standardised (cardboard‐brown) |
Health warnings were pictorial. 100% health warnings had side pack information still branded in the branded condition |
Overall, 82% of respondents chose one of the packs they had rated. Respondents who saw standardised packs were more likely to indicate that they would not buy any of the packs they had seen (20.3%), compared with those who had seen branded packs (15.3%): OR 1.4, 95% CI 1.04 to 1.89, P = 0.026. The size of PHWs did not influence whether respondents opted not to select any of these packs. There was no interaction between plainness and size of PHW in predicting pack choice |
| Wakefield 2015 | Australia | Serial cross‐sectional surveys before, during and after standardised packaging | Adult | Men & women | Smokers | Own brand vs standardised packaging before, during and after standardised packaging implementation | After implementation 75% pictorial HW on both sides | Compared to pre‐standardised packaging: Lower satisfaction than a year ago: transition: OR 1.15 (95% CI 0.87 to 1.51) P = 0.334; post 1‐year: OR 1.85 (95% CI 1.56 to 2.19) P < 0.001.
Proportions Lower satisfaction than a year ago:
Pre‐ 12.2%
Transition 13.8%
Post‐year 1: 20.7% Compared to Pre‐standardised packaging: Lower quality than a year ago: Transition: OR 1.28 (95% CI 0.99 to 1.65) P = 0.063; post‐year 1: OR 2.24 (95% CI 1.91 to 2.64) P < 0.001. Pre‐ 13.9% Transition 17.2% Post‐year 1: 26.7% Lower value than a year ago: Transition: OR 1.05 (95% CI 0.87 to 1.27) P = 0.622; 1‐year: Post‐ OR 1.30 (95% CI 1.15 to 1.46) P < 0.001. Pre‐ 50.9% Transition 50.7% Post‐year 1: 56.7% Believes brands do not differ in prestige: Transition: OR 0.91 (95% CI 0.75 to 1.11) P = 0.373; 1‐year: OR 1.21 (95% CI 1.07 to 1.37) P = 0.003; Pre‐: 44.7% Transition: 42.1% Post‐year 1: 49.9% |
(e) Health warnings and (f) Perceptions of harm
Nineteen studies measured salience of, recall and responses to health warnings; 27 measured perceptions of harm (see Table 5 and Table 6 for a list of studies and key characteristics).
4. Health warning salience.
| Study ID | Country | Design | Age | Gender | Smoking status | Pack characteristics | Health Warnings | Impact |
| Al Hamdani 2013 | Canada | Between‐participants experiment | Adult University students | Men & women | Smoker & non‐smoker | Branded pack Standardised pack 1 Standardised pack 2 Standardised pack 3 Standardised colour: light green |
HW Type: Text/ graphic HW Size: Front: 30% Back: N/A |
Overall, 76.8% of participants recalled the correct health warning. With respect to pack type, 67.3%, 58.2%, 89.6% and 91.9% of respondents identified the correct health warning for the branded pack, SP1 , SP2, SP3, respectively. The odds of recalling the correct health warning were significantly higher for the 2 plainest packs relative to the branded pack (ref). SP1: OR: 0.738, 95% CI 0.331 to 1.647; P = 0.458; SP2: OR 4.531, 95% CI 1.495 to 13.738; P = 0.008; SP3: OR 5.890, 95% CI 1.469 to 6.418; P = 0.002 |
| Bansal‐Travers 2011 | US | Cross sectional mall intercept study | Adult | Men & women | Smokers & non‐smokers | Branded vs standardised (white) | Standardised pack, no warning label.
Branded 30% vs 50% vs 100% warning HW Type: Text graphic |
Attract attention: Branded vs standardised pack (no warning label): did not assess. Branded 30% vs 50% vs 100% warning: participants perceived the 100% (71%) warning as being more likely to attract their attention, P < 0.001, no difference between 50% (2%) and 30% (2%) |
| Borland 2013 | Australia (prior to standardised packaging) | Within‐participants component of a mixed design experiment | 18 ‐ 29 | Men & women | Ever‐smokers (80% current) | All standardised packs (beige), 5 pack shapes, 5 pack openings |
Text/graphic 30% front and back 70% front and back but only image of front shown |
In the repeated measures analysis, there was a main effect among the pack shapes for distracts most from health warning (F (3.3) = 5.50, P = 0.001). The regular (2x10) pack shape was rated as least distracting from health warnings (mean = 2.54) and was significantly lower in distraction compared with the 4x5 (P = 0.001), bevelled (P < 0.001) and rounded packs (P = 0.030). (F (3.3) = 2.71, P = 0.038), with the 4x5 pack, in particular, more distracting with a smaller rather than larger warning size. The regular pack remained least distracting under both conditions. There was a significant main effect of pack openings for distract most from warnings (F (3.4) = 14.90, P < 0.001). There was a clear difference in ratings on tendency to distract from warnings with the regular flip‐top opening rated as least distracting (mean = 2.23) and significantly lower than all other pack opening styles (all P < 0.001) |
| Dunlop 2015 | NSW, Australia |
Observational continuous cross‐sectional | Young adult | Men & women | Smokers | As in Australia | HW Type: Text graphic HW Size: Front: 75%, Back: 90% |
Results of interrupted time series analyses investigating the impact of new tobacco packaging on smokers’ responses to graphic health warnings and pack attitudes (Increase in % strongly agree)
Warning Salience: 2.5% (−10.1 to 15.1), P = 0.700 (not significant). Adjusting for background trends, seasonality, anti‐smoking advertising activity and cigarette price, results from ARIMA modelling showed that 2 – 3 months after the introduction of the new packs there was a significant increase in the absolute proportion of smokers having strong cognitive (9.8% increase, P = 0.005), emotional (8.6% increase, P = 0.01) and avoidant (9.8% increase, P = 0.0005) responses to on‐pack health warnings. Changes in these outcomes were maintained 6 months post‐intervention |
| Gallopel‐Morvan 2012 | France | Between‐participants experiment | Adolescents & young people | Male & female | Smokers and non‐smokers | Popular branded pack vs 3 standardised packs (white, grey, brown) |
All packs had the (black and white) text warning ‘Fumer Tue’ (Smoking Kills) covering 30% of the front panel of the pack. Only picture of front of pack shown | When comparing the 4 packs, it was found that participants did not pay attention to the same stimuli at first sight, i.e. the brand name or health warning. In the standardised pack conditions, the health warning was significantly more prominent than in the branded pack condition (Chi2 = 20.21, P < 0.001). The colour of the standardised packs had no effect on brand name or health warning prominence; Chi2 = 2.59, P = 0.27) |
| Gallopel‐Morvan 2015b | France | Experimental study in which they transferred their tobacco into standardised packs and used them for 10 days | 25 ‐ 40 years | Women | Smokers | As in Australia, brown | 75% pictorial HW on both sides | No difference between believability/credibility of health warnings between the standardised and their own branded pack Health Warning perceptions: are credible: Branded = 4.05 (0.97), Standardised = 4.10 (0.96), t= ‐0.6 (P = 0.54) |
| Gallopel‐Morvan 2015a | France | Experimental study in which they transferred their tobacco into standardised packs and used them for 10 days | Young adult | Men & women | RYO smokers | Branded: own brand Standardised: As in Australia (brown) |
Branded: text warnings covering 40% of pack surface Standardised: 75% pictorial warning on front and 90% back |
For the health warnings, there was no significant difference between the standardised pack and their own pack for credibility. Health warnings perceptions: They are credible: branded = 3.66 standardised = 3.80, t = 1.20 (P = 0.226) |
| Germain 2010 | Australia (prior to standardised packaging) | Online between‐participants experiment | Adolescents | Male & female | Smokers and non‐smokers | 5 levels of packaging and 3 brands in which branding was progressively removed from the pack | Varied by condition (see Characteristics of included studies) |
Overall, 58% of the sample correctly recalled the graphic health warning and this did not vary by pack condition (P > 0.10) |
| Goldberg 1999 | Canada | Between‐participants experiment; a shopping mall intercept study | Teenagers | Male & female | Smoking or open to smoking in next year | With 3 different health warnings shown on a branded or white standardised pack | 1 of 3 health warnings drawn from the 8 existing mandated ones. Black and white text warnings in place at the time in Canada, 25% excluding borders. | Recall levels for the "Smoking can kill you" warning were 22% for the regular package (95% CI 14% to 34%) and 56% for the standardised package (95% CI 44% to 67%; Chi2 = 15.83; P < 0.001). Recall levels for the "Cigarettes are addictive" warning were 13% for the regular package (95% CI 8% to 23%) and 27% for the standardised package (95% CI 18% to 39%; Chi2 = 3.75; P = 0.06). Recall of the "Tobacco smoke causes fatal lung disease in nonsmokers" warning was not enhanced, however, but was actually adversely affected by the standardised package: recall levels were 15% for the regular package (95% CI 11% to 24%) and 1% for the plain package (95% CI 0% to 6%; Chi2 = 6.34; P < 0.05, by Yates correction).The authors noted this warning was longer/vaguer than the other 2 warnings |
| Hammond 2014 | UK | Online within‐participants experiment | Youth | Male & female | Smoking and non‐smoking | Pairs of packs with 3 health warning sizes (40% text, 40% pictorial or 80% pictorial), 2 standardised pack colours (white vs brown) | Different types and sizes (see Characteristics of included studies) |
Impact of health warning: The type of health warning had a significant effect on perceptions of the impact of the health warning (Chi2 = 605.79, P < 0.001), such that the health warnings on standardised packs with the 40% and 80% pictorial health warnings were perceived as having more impact than the standardised pack with a text warning (β = 2.17, P < 0.001 and β = 2.47, P < 0.001, respectively). In addition, the health warning on the standardised pack with the 80% pictorial health warning was more likely to be perceived as having more impact than the pack with the 40% warning (β = 0.29, P = 0.001). The colour of the standardised packaging also had a significant effect on perceptions of the impact of the health warning (Chi2 = 6.07, P = 0.014). Health warnings on the brown standardised packs were perceived as having more impact than the white standardised packs (β = 0.10, P = 0.014) |
| Maynard 2015 | UK | Experimental between‐participants study wherein participants used branded or standardised packs for 24 hours | Young adult | Men & women | Smokers | Usual UK brand or a standardised Australian pack (but matched their UK brand name) Standardised colour: cream/beige |
Different types and sizes (see Characteristics of included studies) HW Type: text‐only on front and text‐plus‐graphic on the back HW Size: Front 75%, Back 95% |
Noticing: More likely to be very noticeable on standardised vs branded, P < 0.001, β = 1.28, 95% CI = 0.89 to 1.67.
Awareness of health risks: no difference between branded and standardised packs: β = +0.20, 95% CI ‐0.13 to +0.53, P = 0.228. Believability: No difference between standardised and branded, P = 0.698, β = 0.06, 95% CI ‐0.24 to +0.35; Seriousness: Standardised packs rated health warnings as more serious than branded packs: β = +0.51, 95% CI +0.18 to +0.84, P = 0.003 |
| Miller 2015 | Australia | Cross‐sectional national online survey | Adult | Men & women | Cigar and/or cigarillo smokers | Standardised packaging vs branded packaging (cigar and cigarillo) | Brand from 2 years ago compared to 75% pictorial HW on both sides |
Recall of any cigar graphic health warnings: 50%, ±6% 95% CI Notice Warnings: 33% more often than 2 years ago, ± 6% 95% CI; 16% less often, 43% same |
| Moodie 2011 | Uk | Counterbalanced repeated measures (within‐participants) experiment | 18 ‐ 35 | Men & women | Smokers | Their own branded packs vs standardised packs (colour dark brown) | Average‐size HW for both types of packs: 30% on front and 40% on back | Noticing warning labels: 2/4 time points significant where respondents rated the health warning label as significantly more noticeable. M1: Standardised = 4.11 vs branded = 3.39, P < 0.05 M2: Standardised = 4.05 vs branded = 3.61, P <0.05 M3: Standardised = 4.07 vs branded = 3.64 (n.s.); M4: Standardised = 4.05 vs branded 3.77 (n.s) |
| Moodie 2013 | UK | Counterbalanced repeated measures (within‐participants) experiment | Adult | Women | Smokers | Their own branded packs vs standardised packs (colour dark brown) | Average size HW for both types of packs: 30% (text) on front and 40% (graphic) on back | Noticing warning labels: No differences at either midweek or weekend measures (not significant). |
| Nagelhout 2015 | Australia | Longitudinal (pre‐ and 2 post‐ waves) study | Adult | Men & women | Smokers | Pre‐post study of actual standardised packs as implemented in Australia | Original packs versus 75% pictorial health warning on both sides | Attention to warning labels: A significantly higher percentage of participants reported noticing, reading, and talking about HWLs at wave 2 and wave 3 compared to wave 1. Statistically significant differences in the outcomes distribution were observed between those who recalled the campaign and those who did not. At wave 2 and at wave 3, in general, a higher percentage of participants among those who recalled the campaign reported noticing, reading, and talking about HWLs compared to those who did not recall the campaign. GEE models showed that, compared to wave 1,attention to HWLs increased at wave 2 (β = 0.32, SE = 0.06, P < 0.001), but did not at wave 3 (β = 0.10, SE = 0.08, P = 0.198). Talking about HWLs increased at wave 2 (IRR 1.82, 95% CI 1.58 to 2.09, P < 0.001) and wave 3 (IRR 1.25, 95% CI 1.05 to 1.47, P < 0.01) compared to wave 1 |
| Nicholson 2015 | Australia | Serial cross‐sectional surveys before and after standardised packaging | Adult | Men & women | smokers and recent quitters | Branded vs standardised packaging in Australia | Original packs versus 75% pictorial health warning on both sides | More smokers recalled (at least) often noticing warning labels in the past month (65%) than recalled advertising and information (45%) or news stories (24%) in the past 6 months. BUT: Compared with smokers surveyed in the period before plain packaging, those surveyed after its introduction were similarly likely to recall noticing warning labels in the past month (no data reported). Also, recall of warning labels was positively associated with being very worried about future health and wanting to quit (not specific to pre‐post plain packaging) |
| Wakefield 2015 | Australia | Serial cross‐sectional surveys before, during and after standardised packaging | Adults | Men & women | Smokers | Own brand vs standardised packaging before, during and after standardised packaging implementation | Original packs versus 75% pictorial health warning on both sides | Compared to Pre‐PP: Health warning effectiveness outcomes: Notices GHW first when looking at pack:Transition: OR 1.60, 95% CI 1.32 to 1.95, P < 0.001; 1‐Year: OR 4.26, 95% CI 3.74 to 4.85, P < 0.001. Pre‐PP: 34.4% Transition: 44.9 PP year 1: 67.5% |
| White 2015a | Australia | Pre‐post cross‐sectional school‐based surveys | Adolescent | Male & female | Those who had seen a cigarette pack in the last 6 months | Branded vs standardised in Australia | 75% pictorial HW on both sides | Read Warning: There was no significant difference in paying attention to warning in 2011 pre‐ vs 2013 post‐, F (1,183) = 0.03, P = 0.87; Paid close attention: There was no significant difference in paying attention to warning in 2011 pre‐ vs 2013 post‐ (P = 0.40); Talk about warnings: No difference, P = 0.56 |
| Yong 2015 | Australia | Cohort survey pre‐ and post‐standardised packaging | Adult | Men & women | Smokers | Own brand vs standardised brands | Original packs versus 75% pictorial health warning on both sides | Notice: Pre‐SP (2011) = 3.23 vs Post‐2013 = 3.40, β = 0.15 (0.05) P < 0.01. Read: Pre‐SP (2011) = 2.33 vs Post‐2013 = 1.95, β = 0.00 (0.04), n.s. There was a marked increase in Attentional Orientation (AO) towards HWLs (OR 4.19, P < 0.001) Note: Because of the large change in AO, the authors explored the relationship between the patterns of change in AO across waves, and changes in HWL reactions. Pre–post changes in HWL reactions and quit intentions by AO pattern: Shifting from first not focusing to focusing first on the HWLs was associated with an increase in noticing and reading of the warning labels (β = 0.60 and 0.37, respectively, both P < 0.001) as compared with those who first focused on the pack branding at each wave. By contrast, changing the initial focus away from the warnings was significantly associated with a decline in noticing (β = −0.47, P = 0.04), but not in reading (n.s.) |
5. Perceptions of harm.
| Study ID | Country | Design | Age | Gender | Smoking status | Pack characteristics | Health Warnings | Impact |
| Adkison 2014 | USA | Online within‐participants experiment | Adult | Men & women | Smokers & non‐smokers | Most appealing pack (to participant) vs standardised brown pack |
30% text warning | Deliver dangerous chemicals: Significant at P < 0.001, standardised more likely (25.3%) perceived to deliver dangerous chemicals than branded (5.0%), most no difference (69.7%). Most dangerous to health: Significant at P < 0.001, standardised (20.8%), branded (7.3%), and no difference (71.9%). Reduce health risks: Significant at P < 0.001: standardised 4.8% vs branded 17.5%, no difference: 77.7%. Consider health risks: Significant at P < 0.001: standardised: 24.6% vs branded: 7.6%, no difference 67.8% |
| Babineau 2015 | Ireland | School‐based (pen and paper) within‐participant cross‐sectional survey |
16 ‐ 17 years | Male & female |
Smokers & non‐smokers |
Branded (conforming to EU regulations) vs standardised (brown‐matte) |
65% text & pictorial health warnings | Health risk: which, if either, of the cigarettes do you think carriesless of a health risk: Pack A = Branded Pack B = Standardised Silk Cut: branded 56.7%; standardised 25.9%; No pack 17.4% (Chi2 158.58, P < 0.001) Marlboro: branded 54.3%, standardised 28.1%, No pack 17.6% (Chi2 113.65, P < 0.001) B&H: branded 55.3%, standardised 26.7% no pack: 18.0% (Chi2 137.95, P < 0.001) |
| Balmford 2015 | Australia | Pre‐post cohort surveys (baseline & 2 follow‐up waves) |
Adult | Men & women | Smokers | Branded vs standardised (as implemented in Australia) | 75% pictorial warning on front, 90% on back | Compared to Wave 1 (pre‐standardised packaging): Chosen for health (AOR yes versus no/don’t know): There was a significant reduction in the proportion of smokers that said they chose their brand for health reasons at Wave 2: 0.50 (0.38 to 0.67) P < 0.001, and Wave 3: 0.45 (0.32 to 0.63), P < 0.001 (compared to Wave 1). Proportion of those that chose their brand for health reasons (yes): Wave 1: 16.9% Wave 2: 9.1% Wave 3: 8.2% |
| Bansal‐Travers 2011 | USA | Cross‐sectional mall intercept study | Adult | Men & women | Smokers & non‐smokers | Branded vs standardised (white) | Standardised pack no warning label. Branded 30% vs 50% vs 100% warning |
Which one would you buy if you were trying to reduce the risks to your health: Branded versus standardised pack (no warning label): Branded = 46% vs standardised = 48% (ns); Branded 30% vs 50% vs 100% warning: participants perceived the 100% (53%) warning as the pack to buy to reduce risks to health, P < 0.001, no difference between 50% (11%) and 30% (34%) Think about the health risks of smoking: Branded vs standardised pack (no warning label): not assessed Branded 30% vs 50% vs 100% warning: 30% (1%) vs 50% (3%) vs 100% (72%), significantly more respondents said that the 100% pack made them think more about the risks of smoking, P < 0.001) |
| Brose 2014 | UK | Between‐participants experiment recruited from an online pool | Young adult | Men & women | Smokers | Branded vs standardised (mirrored Australia, green/brown) |
Branded: 30% text on front; 40% pictorial on back standardised: 75% pictorial warning on front, 90% on back |
Cigarette harm: Not significant: non‐preferred branded pack = 2.97 (0.12); preferred branded pack = 2.88 (0.12); standardised pack = 2.75 (0.12) F = 0.87 P = 0.43 |
| Doxey 2011 | Canada | Online between‐participants experiment | Young adult | Women | Smokers & non‐smokers | Female‐branded with descriptors female‐branded with no descriptors male‐branded packs standardised (white) |
Health warning covering 50% of the principal display surface (pictorial with text) | In a linear regression model using the index score for perceived health risks compared with other brands (combined across the 8 brands shown) there were no significant differences between the standardised condition and the other conditions |
| Ford 2013 | UK | Repeat cross‐sectional study | Adolescents | Male & female | Non‐smokers | Novelty (branded packs designed with a distinctive shape, opening style or bright colour), regular (branded pack with no special design features) vs standardised (brown pack with a standard shape and opening and all branding removed, aside from brand name) |
Text message 'Smoking seriously harms you and others around you’ 30% UK text warning on front on all packs. | The standardised pack was rated as more harmful than the regular Mayfair pack (lower score means higher harm): Regular mean: 1.62 standardised pack mean = 1.50, P < 0.001. The standardised pack was rated as more harmful than the 3 novelty pack designs (each P < 0.01). Novelty pack (structure) pack mean = 1.72; Novelty pack (opening) pack mean = 1.58; Novelty pack (distinctive & unique colour) pack mean =1.69 |
| Gallopel‐Morvan 2015b | France | Experimental study in which they transferred their tobacco into standardised packs and used them for 10 days | 25 ‐ 40 years | Women | Smokers | As in Australia, brown | 75% pictorial HW on both sides | Perceptions of pack: to become aware of the dangers of tobacco Branded: 3.37 (1.27) vs PP: 3.93 (1.06), t = ‐5,09 (P < 0.001) |
| Gallopel‐Morvan 2015a | France | Experimental study in which they transferred their tobacco into standardised packs and used them for 10 days | Young adult | Men & women | RYO smokers | Branded: own brand Standardised: As in Australia (brown) |
Branded: text warnings covering 40% of pack surface Standardised: 75% pictorial warning on front and 90% back |
Health warnings perceptions: They make me think about the dangers of tobacco: branded = 3.23, standardised = 3.78, t = −4.60 (P < 0.001) was higher for the standardised pack (made them think more about the dangers of tobacco) |
| Gallopel‐Morvan 2011 | France | Observational cross‐sectional | Adults | Men & women | smokers and non‐smokers | Marlboro standardised pack vs Marlboro branded pack | Text warnings on both plain and branded packs are white with black text, 30% on front and 40% on back |
Gives the impression that the cigarettes inside are dangerous: branded: 66.5% vs standardised: 8.1%. Respondents more likely to say that the standardised pack gave the impression that the cigarettes inside were dangerous, P < 0.01. More likely to discuss? |
| Guillaumier 2014 | Australia (prior to standardised packaging) | Between‐participants experiment | Socially disadvantaged Adults |
Men & women | Smokers | 4 conditions involving 2 brands with branded & standardised (drab brown) versions | As per Australian standards (see Characteristics of included studies) |
Negative harm: The 4 pack conditions were rated similarly for negative harm characteristics (P = 0.411) |
| Hammond 2009 | UK | Online within‐participants experiment | Adult smokers & youth | Male & female | Smokers & non‐smokers | 2 brands branded vs standardised (brown & white) | All of the packs shown to participants displayed the same pictorial health warning covering 30% of the front of the pack |
If you were to choose between them, which one would you buy if you were trying to reduce the risk to your health?
ADULT: COMPARISONS Lower health risk: White standardised pack Mayfair Kingsize vs Branded Mayfair Kingsize. White standardised pack perceived as lower health risk than its branded pair P < 0.0001, with 20% selecting white standardised pack, 5% branded, and 75% no differences.
Lower Health Risk: Brown standardised pack with Mayfair Kingsize vs Branded Mayfair Kingsize. Brown standardised perceived as no different than branded, no P‐value, with 11% choosing branded, 11% choosing brown standardised pack, and 78% no difference. Lower health risk: White standardised pack with Lambert and Butler Kingsize vs. Branded Lambert and Butler Kingsize. White standardised perceived as lower health risk, P < 0.001, with 6% choosing branded, 17% choosing white standardised pack, and 77% no difference.
Lower health risk: Brown standardised pack with Lambert and Butler Kingsize vs Branded Lambert and Butler Kingsize, brown standardised perceived as greater health risk than the branded pack, with 15% saying branded, 9% saying brown standardised, and 75% no difference. ADULT: DIFFERENT TYPES OF PLAIN Lower health risk: Mayfair smooth white standardised vs Mayfair Kingsize white standardised, Mayfair smooth standardised white pack perceived as lower health risk, with 42% choosing Mayfair smooth, 3% choosing Mayfair Kingsize, and 55% no difference, P < 0.001. Lower health risk: Lambert and Butler gold brown standardised vs Lambert and Butler Kingsize brown standardised. Lambert and Butler gold perceived as lower health risk, P < 0.001, with 21% selecting Lambert and Butler gold, 5% Lambert and Butler Kingsize and 75% no difference. ADULT – comparing size of differences between the 2 sets of standardised packs and 2 sets of branded packs Comparing size of differences between (Mayfair Smooth White Plain vs. Mayfair Kingsize White standardised) vs. (Mayfair Smooth Branded vs. Mayfair Kingsize Branded) Health Risk: Fewer adults perceived the standardised packs as having differences in health risk compared to the branded packs, P < 0.001. Comparing size of differences between (Lambert and Butler Gold Kingsize Brown standardised vs Lambert and Butler Kingsize Brown standardised) vs (Lambert and Butler Gold Kingsize Branded vs Lambert and Butler Kingsize Branded) Health Risk: Fewer adults perceived the standardised packs as having differences in health risks compared to the branded packs, P < 0.001. YOUTH PLAIN vs BRANDED Lower Health Risk: Mayfair Kingsize standardised white pack vs Mayfair Kingsize branded. White standardised pack rated as lower health risk, P = 0.005, with 17% selecting white standardised, 12% branded, and 71% no difference. Lower Health Risk: Mayfair Kingsize standardised brown pack vs Mayfair Kingsize branded. No differences in health risk were found, with 13% selecting brown standardised, 16% branded, and 71% no difference. Lower Health Risk: Lambert and Butler Kingsize white pack vs Lambert and Butler Kingsize branded. No difference for health risk. With 16% choosing standardised white 15% branded, and 69% no difference. Lower Health Risk: Lambert and Butler Kingsize brown pack vs Lambert and Butler Kingsize branded pack. The plain brown pack was rated as higher health risk, P = 0.001, with 20% selecting branded as lower risk, 13% selecting brown standardised, and 67% no difference. YOUTH DIFFERENT TYPES OF PLAIN Health Risk: Mayfair Smooth White standardised Pack vs Mayfair Kingsize White standardised Pack. Mayfair Smooth perceived as lower health risk, with 42% selecting Mayfair smooth, 3% Mayfair Kingsize, and 55% no difference, P < 0.001. Health Risk: Lambert and Butler Gold Brown Plain Pack vs Lambert and Butler Kingsize Brown standardised Pack. Lambert and Butler Gold perceived as lower health risk with 29% selecting Lambert and Butler gold, 6% Lambert and Butler Kingsize, and 65% no difference, P < 0.001. YOUTH– comparing size of differences between the 2 sets of standardised packs and 2 sets of branded packs: Comparing size of differences between (Mayfair Smooth White standardised vs Mayfair Kingsize White standardised) vs (Mayfair Smooth Branded vs Mayfair Kingsize Branded) Health Risk: Fewer youth perceived the standardised packs as having differences in health risk compared to the branded packs, P < 0.001. Comparing size of differences between (Lambert and Butler Gold Kingsize Brown standardised vs Lambert and Butler Kingsize Brown standardised) vs (Lambert and Butler Gold Kingsize Branded vs Lambert and Butler Kingsize Branded) Health Risk: Fewer youth perceived the standardised packs as having differences in health risks compared to the branded packs, P < 0.001 |
| Hammond 2011 | US | Online between‐participants experiment | 18 ‐ 19‐year‐olds | Female | Smokers & non‐smokers | 8 cigarette packs in 4 experimental conditions: 1) Fully‐branded female packs 2) Fully‐branded female packs without descriptors (e.g. slims) 3) Same packs without brand imagery or descriptors (brown) 4) Non‐female‐ (male‐) branded packs |
No health warnings | Compared with branded packs, standardised packs received significantly lower ratings of harmfulness for 2 of the 8 individual packages. In a linear regression model using the index score across all 8 packs, a significant main effect of condition was observed (F = 4.0, P = 0.007): packs in the branded (M = 1.6) condition were more likely to be rated as lower health risk than male (M = 0.9, β = −0 .17, P < 0.001) and standardised packs (M = 1.3, β = −0 .08, P = 0.08). Packs in the no‐descriptors (M = 1.4) condition were also more likely to be rated as lower health risk than those in the male condition (β = −0 .11, P = 0.03) |
| Hammond 2013 | UK | Online between‐participants experiment | Youth | Female | Smoking and non‐smoking | 1) branded female‐oriented packs 2) female‐oriented branded packs, no descriptors (e.g. slims) 3) standardised: female‐oriented packs, no branding or descriptors, cardboard‐coloured 4) control: popular UK brands but non–female‐oriented packs |
30% text‐only black & white | Overall, 50.7% of respondents reported that at least 1 of 10 brands would be “less harmful” than other brands. In a linear regression model using the health risk index score across all 10 packs, a significant effect of condition was observed after adjusting for covariates (F = 3.4, P = 0.018): packs in the fully branded (mean = 2.0) condition were more likely to be rated as lower health risk than no descriptors (mean = 1.5, β = 0.09, P = 0.007), male mean = 1.4, β = 0.07, P = 0.029), and standardisedpacks (mean = 1.4, β = 0.09, P = 0.006) |
| Hammond 2014 | UK | Online within‐participants experiment | Youth | Male & female | Smoking and non‐smoking | Pairs of packs with 3 health warning sizes (40% text, 40% pictorial or 80% pictorial), 2 standardized pack colours (white vs. brown) | Different types and sizes (see Characteristics of included studies) |
The type of health warning had a significant effect on perceptions of the health risk presented by the product (Chi2 = 21.66, P < 0.001): standardised packs with the 40% and 80% pictorial health warnings were less likely to be perceived as having a lower health risk than the standardised pack with the text warnings (β = ‐0.61, P < 0.001 and β = ‐0.71, P < 0.001 respectively). The colour of the standardised packaging also had a significant effect on perceptions of health risk (Chi2 = 23.28, P < 0.001). The brown standardised packs were less likely to be perceived as having a lower health risk than the white standardized packs (β = ‐0.50, P < 0.001). A significant interaction between health warning type and standardised packaging colour was observed for measures of perceived health risk (Chi2 = 12.51, P = 0.002). Specific Comparisons: Pair 1: Benson and Hedges Branded vs White SP BH with 30% text warning No significant difference in health risk. Pair 2: Benson and Hedges Branded vs White SP BH with 40% picture warning SP less likely to be perceived as less health risk, P < 0.001. Pair 3: Benson and Hedges Branded vs White SP BH with 80% picture warning SP less likely to be perceived as less health risk, P < 0.001. Pair 4: Benson and Hedges Branded vs Brown SP BH with 30% text warning SP less likely to be perceived as less health risk, P < 0.001. Pair 5: Benson and Hedges Branded vs Brown SP BH with 40% picture warning SP less likely to be perceived as less health risk, P < 0.001. Pair 6: Benson and Hedges Branded vs Brown SP BH with 80% picture warning SP less likely to be perceived as less health risk, P < 0.001. Pair 7: Silk Cut Superslims vs Regular Silk Cut Compared with the regular Silk Cut pack, the Superslims pack was significantly more likely to be rated as lower health risk, P < 0.001 |
| Kotnowski 2015 | Canada | Online survey | 16 ‐ 24 | Female | Smokers & non‐smokers | Different packaging attributes (structure, brand, branding, warning label size and price) Standardised packaging as in Australia, brown |
50% or 70% depending on condition | Perceptions of Product Harm Pack structure was the strongest contributor to harm‐related perceptions, accounting for 48% of the judgement on product harm. In addition, warning label size (23%) and brand name (17%) moderately influenced judgements of product harm. Branding and price were not significant predictors of harm‐related perceptions.‐ Pack Structure (traditional, lipstick, slim, booklet): ‐ Traditional vs lipstick, lipstick perceived as less harmful, β = 0.46, P < 0.01. ‐ Traditional vs slim, slim perceived as less harmful, β = 0.20, P < 0.01. ‐ Traditional vs booklet, booklet perceived as less harmful, β = 0.18, P < 0.01 Branding: no significant difference between standardised and branded for less harmful (β = −0.07 0.05, n.s.) |
| Miller 2015 | Australia | Cross‐sectional national online survey | Adult | Men & women | Cigar and/or cigarillo smokers | Standardised packaging vs branded packaging (cigar and cigarillo) | Brand from 2 years ago compared to 75% pictorial HW on both sides |
Perceived harm: 19% higher (± 5% CI) (15% lower; 66% same) |
| Moodie 2011 | UK | Counterbalanced repeated measures (within‐participants) experiment | Adult | Men & women | Smokers | Their own branded packs vs standardised packs (dark brown) | Average size HW for both types of packs: 30% on front and 40% on back. | No difference between standardised and their own branded packs in awareness of health risks (Not at all aware (1) to very aware (5). mean (SD) measure 1: 3.73 (1.25) (SP) 3.82 (1.09) (branded); measure 2: 3.80 91.15) (SP) 3.67 (1.06) (branded); measure 3: 3.82 (1.71) (SP) 3.78 (1.15) (branded); measure 4: 3.98 (0.95) (SP) 3.93 (1.18) (branded) |
| Moodie 2012 | UK | Online within‐participants discrete choice experiment | 10 ‐ 17 | Male & female | Smokers & non‐smokers | All standardised packs: different structural designs and colours | Shown in all images “Smoking Kills” on the front , 30% text warning | *Only done for coloured packs, and not the brown plain packs with different openings. Approximately half made associations between pack colour and strength of taste and just under half made associations between pack colour and level of harm. The red pack tended to be associated with stronger taste and greater harm, with 29% considering red to be the strongest‐tasting cigarettes and 22% the most harmful. For the green pack, no clear pattern emerged in responses, with 12% considering it to contain the most harmful cigarettes and an almost equal proportion (11%) considering it to have the least harmful cigarettes. The lighter colours were generally associated with weaker taste and reduced harm. Thelight‐blue pack was generally associated with weak taste (15%) and least harm (15%), while the white pack was most clearly associated with weak taste (27%) andleast harm (18%) |
| Nicholson 2015 | Australia | Serial cross‐sectional surveys before and after standardised packaging | Adult | Men & women | Smokers and recent quitters | Branded vs standardised packaging in Australia | Original packs versus 75% pictorial health warning on both sides | Believe smoking is dangerous to others: no differences pre‐post plain packaging (P = 0.12) |
| Wakefield 2013 | Australia | Cross‐sectional survey | Adult | Men & women | Smokers | Their own branded packs vs standardised packs | 30% front of pack vs 75% pictorial HW on both sides. |
Thought about the harms of smoking ‘often’ or ‘very often’ in the last week:
Model 1: not significant: OR 1.43 (95% CI 0.92 to 2.22), P = 0.115
Model 2: not significant: OR 1.42 (95% CI 0.90 to 2.24), P = 0.129 Believe the dangers of smoking have been exaggerated Model 1: not significant: OR 1.15 (95% CI 0.75 to 1.78) P = 0.526 Model 2: not significant: OR 1.15 (95% CI 0.73 to 1.80) P = 0.551 |
| Wakefield 2012 | Australia (prior to standardised packaging) | Between‐participants experiment | Adult | Men & women | Smokers | 2 branded packs that differed by health warning size (30% vs 70% vs 100%) And 2 standardised (cardboard‐brown) |
Health warnings were pictorial. 100% health warnings had side pack information still branded in the branded condition |
Negative harm characteristics (high in tar’ and ‘harmful to your health’): Branded 30% 7.7 (1.7) Branded 70% 7.7 (1.9) Branded 100% 7.7 (1.7) Standardised 30% 7.6 (1.6) Standardised 70% 7.4 (2.1) Standardised 100% 7.8 (1.6) Main effect: P = 0.347 (not significant) |
| Wakefield 2015 | Australia | Serial cross‐sectional surveys before, during and after standardised packaging | Adult | Men & women | Smokers | Own brand vs standardised packaging before, during and after standardised packaging implementation | After implementation 75% pictorial HW on both sides. |
Compared to pre‐standardised packaging: Believes brands do not differ in harmfulness: Transition: OR 1.09 (95% CI 0.89 to 1.35) P = 0.405; 1‐year: OR 1.21 (95% CI 1.06 to 1.38) P = 0.004; Proportion: Believes brands do not differ in harmfulness (n = 6924) Pre‐SP 65.8% Transition 67.0% SP year 1: 69.8% Higher harmfulness than a year ago: Transition: OR 0.89 (95% CI 0.70 to 1.13) P = 0.349; 1‐year: OR 0.99 (95% CI 0.86 to 1.14) P = 0.877 (no differences); Proportion: Higher harmfulness than a year ago (n = 6838) Pre‐PP 24.2% Transition 22.1% SP year 1: 23.4% Believes variants do not differ in strength: Transition: OR 1.09 (95% CI 0.72 to 1.64) P = 0.683; SP 1‐year: OR 1.15 (95% CI 0.88 to 1.51) P = 0.303 (no differences) Believes variants do not differ in strength (n = 6894) Pre‐PP: 5.2% Transition: 5.9% SP year 1: 6.1% |
| White 2012 | Brazil | Online between‐participants experiment | 16 ‐ 26 years | Female | Smokers and non‐smokers | Branded vs standardised with and without descriptors | Not visible | Health risk ratings: Overall, 42.6% of respondents reported that at least 1 of the 10 brands would be “less harmful” than other brands. In a linear regression model using the health risk index variable that combined all 10 packs, no significant main effect of condition was observed (F = 1.6, P = 0.207) |
| White 2015a | Australia | Pre‐post cross‐sectional school‐based surveys | Adolescents | Male & female | Smokers and non‐smokers | Branded vs standardised in Australia | 75% pictorial HW on both sides |
Awareness that smoking causes bladder cancer increased between 2011 and 2013 (P = 0.002).
There was high agreement with statements reflecting health effects featured in previous warnings or advertisements with little change over time. Exceptions to this were increases in the proportion agreeing that smoking was a leading cause of death (P < 0.001) and causes blindness (P < 0.001). Brand differences: For the statement ‘some cigarette brands contain more harmful substances than others’, there was a significant decrease in the proportion of students disagreeing between 2011 and 2013 (Chi2 = 10.63, P = 0.005).) Agree: 2011: 37% (35% to 39%) 2013: 38% (36% to 41%) Disagree: 2011: 20% (18% to 22%) 2013: 17% (15% to 18%) Don’t know: 2011: 43% (41% to 45%) 2013: 45% (43% to 47%) More addictive than others There was a decrease in the proportion disagreeing (P = 0.02). Agree: 2011: 33% (32% to 35%) 2013: 34% (32% to 36%) Disagree: 2011: 20% (19% to 22%) 2013: 18% (16% to 19%) Don’t know: 2011: 46% (44% to 49%) 2013: 49% (46% to 51%) Easier to quit than others (among smokers) no significant difference Agree: 2011: 18% (16% to 19%) 2013: 16% (14% to 17%) Disagree: 2011: 32% (30% to 34%) 2013: 31% (29% to 33%) Don’t know: 2011: 51% (48% to 53%) 2013: 54% (51% to 56%) |
| Yong 2015 | Australia | Cohort survey pre‐ and post‐standardised packaging | Adult | Men & women | Smokers | Own brand vs standardised brands | Original packs versus 75% pictorial health warning on both sides | Think risk: Pre‐PP (2011) = 2.13 vs Post‐2013 = 2.30, β = 0.13 (0.03), P < 0.001 |
Excluded studies
As seen in Figure 2, we excluded 257 references at full‐text stage. One hundred and five of these were excluded as the article content was not about standardised packaging, 19 because they did not measure any of our outcomes, 10 as they did not assess the impact of changes in packaging, 18 as they were not peer‐reviewed published studies, 75 because they were not primary, empirical studies (e.g. news stories, opinion pieces), and 24 because they used qualitative methods. The remainder were excluded for other reasons. We list key excluded studies along with their reasons for exclusion in Characteristics of excluded studies. We list studies which we are aware of but that were published after our search date in Characteristics of studies awaiting classification; we will consider these in future updates. We summarise key ongoing studies in Characteristics of ongoing studies.
Risk of bias in included studies
Overall, we judged the vast majority of studies to be at high or unclear risk of bias in at least one domain, reflecting the difficulties intrinsic to studying this topic (and in studies assessing the impact of standardised packaging in Australia, this was predominantly due to confounding due to the simultaneous introduction of enhanced pictorial warnings). As described in Assessment of risk of bias in included studies, we chose which domains to assess based on study type. Given the volume of studies and the range of domains assessed, we only briefly synthesise 'Risk of bias' judgements in the text. Further detail can be found in Figure 3, in Figure 4, and particularly in the Characteristics of included studies, where we provide our reasons for our judgements for each domain in each included study. We used 'Risk of bias' assessments when considering the strengths and limitations of our conclusions, but have also considered them in relation to recommendations for further research in this area.
3.
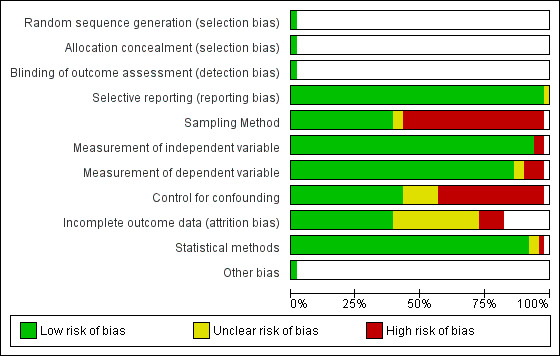
Risk of bias graph: review authors' judgements about each risk of bias item presented as percentages across all included studies.
4.
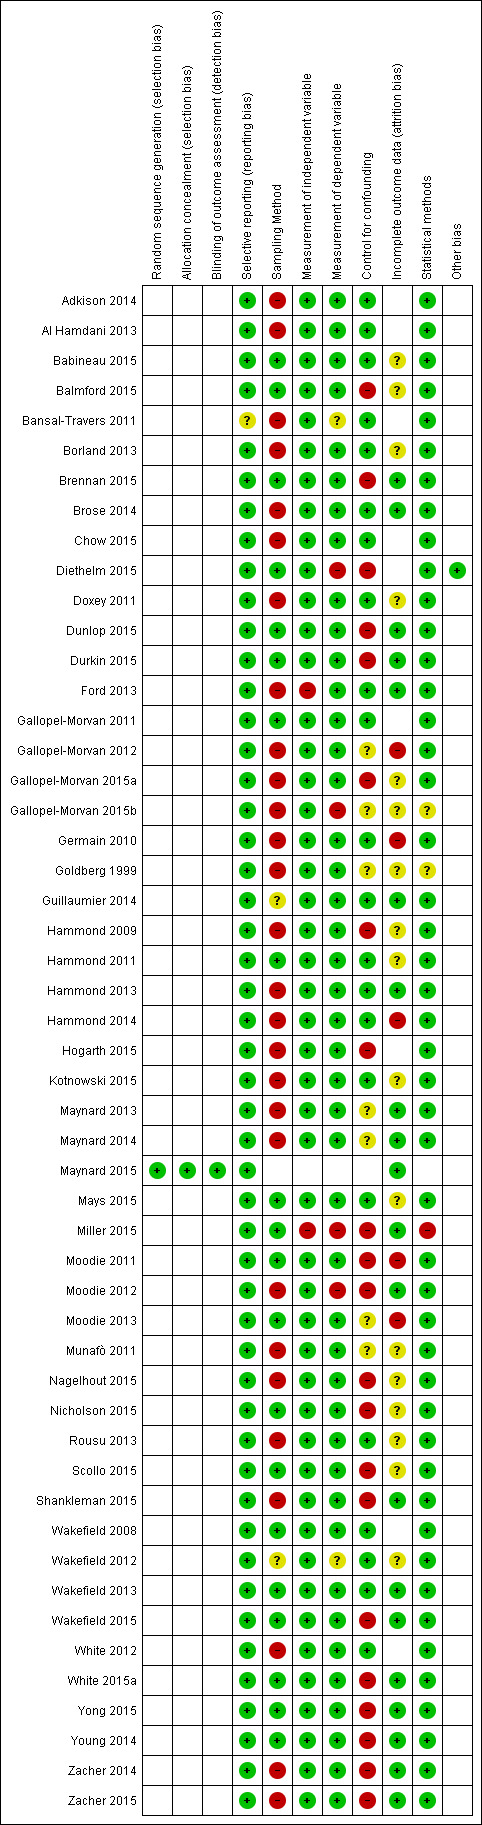
Risk of bias summary: review authors' judgements about each risk of bias item for each included study.
Overall risk of bias across studies
In four studies, 'Risk of bias' assessments were low across all domains assessed (Gallopel‐Morvan 2011; Maynard 2015; Wakefield 2008; Wakefield 2013); none of these were randomised controlled trials and hence we did not assess them for selection or detection bias. A further five studies were at unclear risk of bias (Babineau 2015; Guillaumier 2014; Hammond 2011; Mays 2015; Wakefield 2012). We judged all other studies to be at high risk of bias in at least one of the domains assessed.
Summary of individual domains
Only one study used a traditional RCT design and hence we only assessed selection bias and detection bias for this study (Maynard 2015). We judged it to be at low risk of both.
We assessed the remaining domains over most of the included studies.
We assessed selective reporting for all included studies. This was difficult to assess as protocols were not available for most studies; where all expected outcomes were reported, we judged studies to be at low risk of bias in this domain. We rated three studies as unclear for selective reporting as it was not apparent why some outcomes had been reported and not others; we judged all other studies to be at low risk of bias for this domain (see Figure 3 and Figure 4).
There were few issues raised with measurement of independent or dependent variables, and we judged statistical methods to be appropriate for most of the studies. More detail can be seen in Figure 4 and Characteristics of included studies.
Judgements were mixed across sampling methods, with approximately half of the included studies rated at high risk of bias for this domain, typically due to the use of convenience samples and possible issues with contamination in some studies. Judgements were also mixed for incomplete outcome data, with approximately half of the studies assessed for this domain rated at unclear risk, which was typically the case for observational survey‐type studies where there were insufficient data on which to judge the impact of loss to follow‐up and where sample sizes were heavily reduced for some analyses because of missing data.
Finally, we rated just under half of the studies at high risk of bias for confounding, which is likely to continue to be an issue for research in this field, as enhanced pictorial warnings were implemented at the same time as standardised packaging in Australia, and is likely to be the case with countries that introduce standardised packaging in the future (see Discussion and Table 1). It is therefore difficult to separate the effects of these two interventions. Hence, for all these studies, confounding is rated as high, even though often the studies controlled for the effect of other policies or interventions that happened around the time of standardised packaging legislation implementation, or other potential confounders.
Effects of interventions
See: Table 1
Changes in tobacco use (primary outcomes)
No studies reported uptake, cessation, or relapse prevention measures. Results for prevalence and consumption are presented below.
Prevalence
The one included study assessing the impact of standardised tobacco packaging on smoking prevalence in Australia (Diethelm 2015) found a 3.66% reduction in odds (P = 0.0061) when comparing before to after the implementation of standardised packaging, adjusting for confounders (β = ‐0.0372, 95% confidence interval (CI) ‐0.0638 to 0.0106; n = 700,000). This is consistent with a drop in the proportion smoking from 19% to 18.5%, i.e. a 0.5 percentage point drop in smoking prevalence around the time of the change.
Two further unpublished papers make use of the same data set and hence are classed as additional references under Diethelm 2015. A paper written for the Australian government (Chipty 2016) detected very similar findings, despite using slightly different methodological approaches; the authors found a statistically significant decline in smoking prevalence of 0.55 percentage points over the post‐implementation period, relative to what the prevalence would have been without the implementation of standardised packaging. A separate paper written for the tobacco industry (Kaul 2014) did not detect an effect attributable to standardised packaging; there are three key differences in their methods which may have led to these different conclusions. Firstly, Kaul 2014 chose to model the overall time trend for a shorter period of time (from July 2004 onwards, rather than from 2002); they state they have done so because the trend appears non‐linear in the first two years compared to later years. However, the analysis in Diethelm 2015 makes some allowance for this by the inclusion of additional covariates and hence Diethelm’s final model (unlike that of Kaul) is not a simple linear time trend. Secondly, Kaul 2014 excludes December 2012 from their analyses (when standardised packaging came into effect), whereas both Diethelm 2015 and Chipty 2016 include this month; this appears to be a post hoc decision made in the Kaul 2014 analysis. Thirdly, Kaul 2014 primarily analyses residuals, rather than estimation of the trend before and after the implementation of standardised packaging, which Diethelm 2015 and Chipty 2016 have done.
Given the consistency in findings between Diethelm 2015 and Chipty 2016 and given that Diethelm 2015 is the primary reference for this study (as the only peer‐reviewed published reference analysing this data set), our conclusions on this outcome are based on those presented by Diethelm 2015.
No experimental studies looked at changes in prevalence.
Consumption
Impact of standardised packaging in Australia
Two studies assessed the impact of standardised tobacco packaging on consumption in Australia. Scollo 2015 (8811 participants) used the bespoke ‘National Tobacco Plain Packaging Tracking survey’ to assess changes in self‐reported consumption (among current smokers surveyed at three time periods): between the pre‐standardised packaging phase in Australia (pre: April to September 2012) and two subsequent time periods: the transition phase during which standardised packages were being introduced into the Australian market (transition: October and November 2012), and one year post‐standardised packaging phase (post: December 2012 to November 2013). No significant change was detected in cigarette consumption among daily cigarette smokers, at least weekly smokers, or at least monthly smokers, and among at least monthly smokers of brands of any market segments (value/mainstream/premium); the authors report that there was reasonable power to detect modest changes for all categories.
Miller 2015 (268 participants) used one cross‐sectional survey of a national online panel developed from a number of sources including advertising and ‘word‐of‐mouth’ in Australia. Smokers of cigars or cigarillos, or of both, were asked to assess self‐reported changes in consumption since ‘two years ago’ (a period including the introduction of standardised packaging.) Due to small cell sizes, only simple descriptives were presented. For cigar smokers, 42% reported lower consumption, 13% more, and 45% the same. For cigarillo smokers 44% reported lower consumption, 15% more, and 42% the same.
Other studies
Of the two UK experimental studies that assigned participants to branded or standardised packs, Maynard 2015 (128 participants) found that self‐reported cigarette consumption did not differ significantly during the 24‐hour period between those smoking from the branded pack (mean = 10.86) versus the standardised pack (mean = 10.34), β = −0.58 (95% CI: −1.63 to + 0.48), P = 0.279 (adjusted). Similarly, Maynard 2015 found no differences across a 24‐hour period in the volume of smoke inhaled (mL) between branded and standardised packs (branded pack mean = 765.15, standardised mean = 817.26, β = +54.78 mL, 95% CI: ‐112.50 to +222.07, P = 0.518 (adjusted)). Moodie 2013 (187 participants) found that participants' self‐reported cigarette consumption was lower when using the standardised compared with participants' own branded pack. Moodie 2013 found the midweek average cigarette consumption per day when using the standardised pack was 14.9, compared with 15.5 while using own branded packs (P < 0.05) and the weekend average cigarette consumption per day was 15.7 while using standardised and 16.7 using own branded packs (P < 0.01).
Changes in secondary behavioural outcomes
Changes in quit attempts
Two studies assessed the impact of standardised packaging on quit attempts in Australia. In their study of Australian adult smoker cohorts (Durkin 2015, 5441 participants), 1) before standardised packaging implementation, during 2) early and 3) late implementation, and 4) one year post‐implementation of standardised packaging (but prior to the tax increase in December 2013), the adjusted proportions attempting to quit in the past month were: 1) before: 20.2%; 2) early implementation: 25.5%, odds ratio (OR) 1.43, 95% CI 1.00 to 2.03, P < 0.05; 3) late implementation: 17.4%, OR 0.81, 95% CI 0.58 to 1.12, n.s.; one‐year post: 26.6%, OR 1.52, 95% CI 1.01 to 2.30, P < 0.05.
Calls to the Quitline are an indirect measure of quit attempts. Young 2014 found that there was a 78% increase in the number of calls to the Quitline in Australia associated with the introduction of standardised packaging (baseline, 363/week; peak, 651/week, 95% CI 523 to 780/week; P < 0.001). This peak occurred four weeks after the initial appearance of standardised packaging and was prolonged (43 weeks) with an estimated 86% of these additional calls retained relative to the previous week until the end of the period of study. In comparison, the 2006 introduction of graphic health warnings had the same relative increase in calls (84%; baseline, 910/week; peak, 1673/week, 95% CI 1383 to 1963/week; P < 0.001), but the impact of standardised packaging continued for a longer period of time as each post‐week following the graphic health warning introduction retained only 40% of the previous week's calls (for 20 weeks).
No experimental studies evaluated changes in quit attempts.
Smoking behaviour changes such as stubbing out a cigarette early, forgoing cigarettes, smoking less around others
Impact of standardised packaging in Australia
Durkin 2015 (5441 participants), using adjusted analyses, found that continuing smokers in Australia were significantly more likely to report increases in stubbing out their cigarette early when comparing the year after standardised packaging was introduced to pre‐standardised packaging, but not in the earlier implementation phases (pre: 21.9% (reference); early implementation: 22.2%, OR 1.02 (95% CI 0.68 to 1.54); late implementation: 22.5%, OR 1.04, 95% CI 0.76 to 1.43; one year post‐standardised packaging (but prior to the tax increase in December 2013): 28.4%, OR 1.55, 95% CI 1.01 to 2.36, P < 0.05). In addition, continuing smokers surveyed during early implementation were significantly more likely to report increased rates of stopping themselves from smoking when they had an urge compared to those surveyed in the pre‐standardised packaging phase (pre: 36.7%, (reference); early implementation: 44.9%, OR 1.51, 95% CI 1.08 to 2.10, P < 0.05), but not at the two later follow‐ups (late implementation: 39.4%, OR 1.15, 95% CI 0.87 to 1.52; one year post‐standardised packaging: 38.1%, OR 1.08, 95% CI 0.74 to 1.57).
Of the two Australian studies (Zacher 2014; Zacher 2015) that examined the impact of standardised packaging on smoking in outdoor cafes, Zacher 2014 observed that from the pre‐standardised packaging to the post‐standardised packaging phases there was a 23% decline in active smoking observed (incident rate ratio (IRR) 0.77, 95% CI 0.71 to 0.84, P < 0.001). Adjusted Poisson regression models confirmed that the observed rate of packs to patrons declined in the post‐phase by 15%. The rate of observed smokers to patrons also declined significantly (by 23%; IRR 0.77, 95% CI 0.71 to 0.84, P < 0.001) between phases, whereas the rate of visible packs to observed active smokers did not change (IRR 0.04, 95% CI 0.96 to 1.13). In Zacher 2015, which extended the study to one year post‐standardised packaging, the prevalence of active smoking observed declined, from 8.4% of patrons pre‐ to 6.4% early post‐implementation (IRR 0.78, P < 0.001), and remained lower (at 6.8%) one year post‐implementation (IRR 0.85, P = 0.013), and there was no change between early and one year post‐implementation (IRR 1.08, P = 0.607). There was a significant interaction for the rate of observed active smoking among patrons between pre‐implementation and one year post‐implementation and the presence of children at a venue (P = 0.015), with a greater decline in venues with children present (IRR 0.47, P < 0.001) than in those without (IRR 0.88, P = 0.058).
In Nicholson 2015 (1643 participants), smokers were asked if they had noticed the warning labels on their packs in the last month and then whether the warning labels stopped them from having a smoke when they were about to. Smokers who had noticed warning labels in the last month were more likely to say that these labels led them to forgo at least one cigarette after standardised packaging implementation compared with before (OR 1.54, 95% CI 1.14 to 2.09). However, Yong 2015 (1525 participants) found there was no significant change in warning‐related forgoing of cigarettes from pre‐ to post‐standardised packaging among adult smokers (β = 0.01; standard error (SE) = 0.02, non‐significant (n.s.)). Similarly, when White 2015a (7740 participants) asked adolescent smokers (established and non‐established) who had seen a cigarette pack in the past six months whether they had not had a cigarette because of the health warnings, there was no significant change in the frequency of not having a cigarette because of the health warnings in 2011 pre‐standardised packaging versus 2013 post‐standardised packaging (F = 1183) 0.042, P = 0.52).
Other studies
Findings were mixed in the three UK experimental studies that assigned participants to branded or standardised packs. Maynard 2015 (128 participants) found no difference in smoking behaviours over the 24‐hour period: 1) reporting stubbing out a cigarette early (standardised versus branded β = 0.03, 95% CI ‐0.14 to 0.20, P = 0.723); 2) forgoing a cigarette (standardised versus branded β = 0.03, 95% CI ‐0.14 to 0.19, P = 0.744); and 3) smoking less around others (standardised versus branded β = 0.07, 95% CI ‐0.09 to 0.22, P = 0.401). Moodie 2011 (48 participants) reported that young adult smokers were more likely to engage in changes in their smoking behaviour when using the standardised packs compared to branded packs; over the four‐week study period, participants completed a questionnaire twice a week: (1) the proportion reporting forgoing cigarettes: standardised = 15% versus branded = 4% (n.s); standardised = 20% versus branded = 6% (n.s.); standardised = 19% versus branded = 6% (P < 0.05); standardised = 30% versus branded = 9% (P < 0.05) for the four questionnaires respectively; (2) smoking less around others (at all four time points = significant): standardised = 33% versus branded = 11% (P < 0.01); standardised = 37% versus branded = 10% (P < 0.01); standardised = 46% versus branded = 13% (P < 0.001); standardised = 44% versus branded = 7% (P < 0.001) for the four questionnaires respectively. Moodie 2013 (187 participants) found that young female daily smokers reported changing their smoking behaviour in a number of ways over the one‐week period when using standardised packs compared with using their own branded packs, through: foregoing cigarettes (13% reported this behaviour versus 4%, P < 0.01 midweek; 15% versus 8%, P < 0.05 weekend) and smoking less around others (33% versus 11%, P < 0.001 midweek; 39% versus 16%, P < 0.001 weekend). Stubbing out cigarettes was more frequent when using standardised packs than their own branded packs, for the weekend (17% reported this behaviour versus 10% respectively, P < 0.05), but not for the midweek measure (10% versus 5% respectively, n.s.).
Changes in avoidance behaviours
Impact of standardised packaging in Australia
Wakefield 2015 (7175 participants) found no immediate change in the proportion of Australian smokers who reported concealing their packs or using a different container for their cigarettes, but reports that there was an increase in these behaviours from pre‐ to one year post‐standardised packaging: pre‐standardised packaging: 17.1% (reference); transition: 19.1%, OR 1.15, 95% CI 0.90 to 1.46, P = 0.252; one‐year post‐standardised packaging (but prior to the tax increase in December 2013): 23.1%, OR 1.47, 95% CI 1.26 to 1.71, P < 0.001. There was an immediate and sustained increase in the proportion who had requested a different graphic heath warning when purchasing a pack in the past month (hence avoiding particular health warnings): pre‐standardised packaging: 3.9% (reference); transition: 8.5%, OR 2.28, 95% CI 1.52 to 3.44, P < 0.001; one‐year post‐standardised packaging: 9.1%, OR 2.49, 95% CI 1.89 to 3.29, P < 0.001.
Yong 2015 (1525 participants) found a large increase in avoidance behaviour regarding warning labels (made any effort to avoid looking at or thinking about the warning labels, such as covering them up, keeping them out of sight, using a cigarette case, avoiding certain warnings, or any other means) from pre‐ to post‐standardised packaging (OR 3.06, P < 0.001) in their cohort study of smokers from pre‐ to post‐implementation. Changing attentional orientation (smokers were asked when they look at a cigarette pack whether they usually notice the warning labels or branding first) affected avoidance behaviours: shifting from first not focusing to focusing first on the health warning labels (from pre‐ to post‐waves) was associated with an increase in avoidance of warning labels (β = 0.08, P = 0.07) compared with those who first focused on the pack branding at each wave. In contrast, changing the initial focus away from the warnings was significantly associated with a decline in avoidance behaviour (β = −0.19, P = 0.06) compared with those who first focused on warning labels at both waves.
Zacher 2014 observed that concealment of tobacco packs outside cafes (by a telephone, wallet or some other object) increased significantly between pre‐ and early post‐standardised packaging (IRR 2.33, 95% CI 1.72 to 3.17, P < 0.001), from 4.4% of fully branded packs pre‐ to 9.5% of standardised packs post‐standardised packaging. Zacher 2015 found that whilst pack concealment increased between the pre‐ (branded packs: 4.0%) and early post‐standardised packaging (standardised packs: 8.9%) phases (IRR 2.48, P < 0.001), concealment resumed its baseline level by one year post‐PP (standardised packs: 4.4%, IRR 1.22, P = 1.00). Zacher 2014 observed that the use of external cigarette cases was significantly more common in the post‐standardised packaging phase (3.5%) than pre‐ (1.5%) (IRR 2.79, 95% CI 1.77 to 4.40, P < 0.001). Zacher 2015 observed that the prevalence of external case use increased between pre‐ (1.2%) and early post‐standardised packaging (3.5%, IRR 3.44, P = 0.001), at one year post‐standardised packaging (1.9%, IRR 1.36, P > 0.999), there was no evidence of a difference from pre‐standardised packaging. Zacher 2014 observed that the proportion of packs orientated face‐up declined from 85.4% of fully branded packs pre‐ to 73.6% of standardised packs post‐implementation (IRR 0.87, 95% CI 0.79 to 0.95, P = 0.002). Zacher 2015 observed that the percentage of packs oriented face‐up declined from pre‐ (branded packs: 85.2%) to early post‐implementation (standardised packs: 74.0%, IRR 0.87, P = 0.037), but returned to the baseline level one year post‐standardised packaging (standardised packs: 85.7%, IRR 0.99, P = 1.000).
Miller 2015 (268 participants) observed that among cigar and cigarillo smokers' reports 11% self‐reported deliberately concealing or decanting their products more often than "two years ago" (a period including the introduction of standardised packaging), 21% less often and 56% the same.
Other studies
In the UK, experimental studies had similar outcomes in which avoidance behaviours increased. Maynard 2015 (128 participants) found a significant increase in avoidance behaviours over the 24‐hour experimental period: 1) those assigned standardised packs were more likely to report keeping the pack out of sight than those assigned branded packs (β = 0.15, 95% CI 0.01 to 0.29, P = 0.031) and more likely to report covering the pack (β = 0.08, 95% CI 0.00 to 0.16, P = 0.044). Moodie 2011 (48 participants) found that young adult smokers were more likely to engage in avoidant behaviours at each time point (four questionnaires taken over the two‐week period): 1) Keeping the pack out of sight: branded = 13% versus standardised = 53%, P < 0.001; branded = 13% versus standardised = 53%, P < 0.001; branded = 13% versus standardised = 60%, P < 0.001; branded = 7% versus standardised = 57%, P < 0.001, for the four questionnaires respectively. 2) Covering the pack: branded = 4% versus standardised = 22%, P < 0.01; branded = 2% versus standardised = 26%, P < 0.01; branded = 4% versus standardised = 26%, P < 0.01; branded = 4% versus standardised = 30%, P < 0.001, for the four questionnaires respectively. Moodie 2013 (187 participants) found that young female smokers were more likely to engage in avoidant behaviours, when smoking standardised packs versus branded packs at the two time points over each one‐week period: keeping the pack out of sight (54% standardised versus 11% branded, P < 0.001 midweek; 55% versus 10%, P < 0.001 weekend); covering the pack (10% standardised versus 2% branded, P < 0.001 midweek; 21% versus 3% respectively, P < 0.001 weekend).
Eye tracking (movements and fixations)
In their study of adults, Munafò 2011 (43 participants) assessed the number of eye saccades (movements) and duration of fixations, in a mixed 3x2x2 experimental design, assessing smoking status (non‐smoker, weekly smoker, daily smoker) as a between‐participants factor, pack type (branded, standardised) and location of eye gaze (health warning, brand information) as within‐participant factors. A main effect of package type was observed (F (1, 39) = 5.51, P = 0.024) and further analyses, stratified by smoking status, clarified the nature of an observed three‐way interaction. This indicated the presence of a pack type/location interaction among non‐smokers (F (1, 13) = 17.63, P = 0.001, h2 = 0.58) and weekly smokers (F (1, 12) = 17.06, P = 0.001, h2 = 0.59), but not daily smokers (F (1, 12) = 0.95, P = 0.35, h2 = 0.07). This interaction in non‐smokers and weekly smokers reflected an equal number of eye movements towards health warning and brand information on branded packs, but greater eye movements towards health warning information and fewer towards brand information on standardised packs. These effects were not observed for the duration of individual fixations, which confirmed that the results for number of saccades could not be explained by fewer but prolonged fixations on brand names for standardised packs in non‐smokers and weekly smokers. Instead, this suggests that these groups show increased visual attention towards health warnings on standardised packs.
In their study of adolescents, Maynard 2013 (87 participants) assessed the number of eye saccades in a mixed 4x2x2 experimental design, with smoking status (never‐smoker, experimental smoker, weekly smoker, daily smoker) as a between‐participants factor, and pack type (branded, standardised) and location of eye gaze (health warning, branding) as within‐participant factors. They also found evidence of a three‐way interaction (F (3, 83) = 4.138, P = 0.009, partial eta squared = 0.130). Further analyses, stratified by smoking status, clarified the nature of this as indicating the presence of a pack type/location interaction among experimenters (F (1, 33) = 17.62, P < 0.001) and weekly smokers (F (1, 12) = 4.91, P = 0.047), but not among never‐smokers (F (1, 25) = 0.24, P = 0.63) or daily smokers (F (1, 13) = 0.87, P = 0.37). For experimenters and weekly smokers, this interaction was characterised by an equal number of eye movements towards the health warnings and branding on branded packs (experimenters: t(33) = 0.41, P = 0.68; weekly smokers: t(12) = 0.56, P = 0.58), but more eye movements towards health warnings than branding on standardised packs (experimenters: t(33) = 2.69, P = 0.011; weekly smokers: t(12) = 2.25, P = 0.044). Among never‐smokers, a main effect of location was observed, (F (1, 25) = 6.95, P = 0.014), reflecting more eye movements towards the health warnings than the branding; a main effect of pack type (F (1, 25) = 11.36, P = 0.002) was also observed, indicating more eye movements overall to branded packs than standardised packs. No main effect of pack type or location was observed among daily smokers. Analysis of the time per image spent fixating health warnings compared to branding confirmed that experimental and weekly smokers spent more time fixating health warnings on standardised packs than on branded packs. Compared with branded packaging, standardised packaging increased the time spent attending the warnings compared with the branding among experimenters and weekly smokers, but not daily smokers who made equal numbers of eye movements to the warnings on branded and standardised packs. Unlike with adults, adolescent never‐smokers preferentially attended to the health warnings irrespective of whether presented on branded or standardised packs.
In their study of adult regular smokers, Maynard 2014 (30 participants) used a within‐participant design with location of eye gaze (health warning, branding), pack type (branded, standardised, blank) and health warning familiarity (familiar, unfamiliar) as within‐participant factors. Analysis of variance indicated that smokers were biased towards fixating the branding rather than the health warning on all three pack types (branded packs: t(29) = 13.12, P < 0.001, d = 2.44; standardised packs: t(29) = 10.59, P < 0.001, d = 2.05; blank packs: (t(29) = 3.40, P = 0.002, d = 0.69). For blank packs this meant that smokers preferentially attended to the blank region over the health warnings. However, more saccades were made to branding on branded packs than standardised packs (t(28) = 5.47, P < 0.001, d = 0.35), and on branded packs (t(28) = 12.56, P < 0.001, d = 1.06) and standardised packs (t(28) = 8.97, P < 0.001, d = 0.76) than blank packs. Conversely, an equal number of saccades were made to health warnings on branded and standardised packs (t(28) < 0.001, P = 1.00, d = 0.08), but more saccades were made to health warnings on blank packs than either branded (t(28) = 3.85, P < 0.001, d = 0.53) or standardised packs (t(28) = 4.00, P < 0.001, d = 0.44). There was no main effect of familiarity of health warnings and no interactions including this factor, even when the number of cigarettes participants reported smoking per day (a proxy for familiarity) was included as a covariate in the ANOVA. Familiarity with health warnings had no effect on eye‐gaze location. The results suggest that health warning familiarity is not the reason for regular smokers’ lack of visual attention to health warnings; instead, both a preference for branding and an active avoidance of warnings may explain regular smokers’ lack of attention to health warnings.
Shankleman 2015 assessed the proportion of gaze time spent on health warnings in a study of 30 adult non‐smokers (< 100 cigarettes in lifetime and not current), using a within‐participant design with pack type (branded, standardised) and type of health warning (black & white text‐only warning, graphic colour warnings containing an image alongside a text warning, and colour text‐only warning) as within‐participant factors. They observed that gaze time towards different types of warnings increased when they were presented on standardised packs compared to branded packs (F (1,29) = 26.9, P < 0.001, partial η2 = 0.481). There was no interaction between pack type and warning type (F (2,58) = 1.25, P = 0.295, partial η2 = 0.041), so the effect of standardised packaging on gaze time did not vary significantly for the three different types of warning.
Pack selection tasks
In Hogarth 2015 (144 participants), standardised pack stimuli, unlike branded pack stimuli, did not prime tobacco choice in either of two experiments, irrespective of whether the tobacco reward was a branded 10‐pack or a branded/standardised 20‐pack.
In a pack selection task (Hammond 2011) in the USA, 38.5% (318/826) of the female youth participants (smokers and non‐smokers) selected a pack. Significantly fewer respondents selected a standardised versus (male or female) branded pack (Chi2 = 29.0, P < 0.001). When excluding branded packs designed to appeal mainly to males (given participants were female), the branded packs designed to appeal mainly to females were 2.7 times more likely to be selected than the standardised packs (using the same brand names as the brands that would appeal mainly to females) (43.4% versus 16.4%; Chi2 = 38.9, P < 0.001).
In a similar pack selection task among young women in Brazil (White 2012), overall 52.1% (325/640) selected a pack, 39.6% of participants chose a branded pack and 12.5% a standardised pack.
In a similar pack selection task with UK female youth (Hammond 2013), overall 48.4% of participants accepted the offer and selected a pack (458/947 participants). Of the participants offered four branded packs designed to appeal to females, significantly more (51.8%) accepted a pack compared to participants offered the same four packs with standardised packaging (44.6% of participants accepted a pack). Overall, respondents offered standardised packs were significantly less likely than respondents in the branded pack condition (Chi2 = 5.0, P = 0.026) to accept a pack.
Rousu 2013 (402 participants) asked smokers to bid for four different types of packs in an auction: one pack was standardised (in this experiment the packaging retained brand names and descriptors in non‐standardised fonts), which attracted a lower bid than the other branded conditions. In other analyses of the same data, some evidence emerged that standardised packaging caused a greater proportion of smokers to decrease their demand for cigarettes.
Secondary outcomes (non‐behavioural outcomes)
Quitting cognitions
Quit intentions/plans
Five studies from Australia assessed quit intentions/plans (Brennan 2015; Durkin 2015; Wakefield 2012; Wakefield 2013; Yong 2015), with mixed results.
Impact of standardised packaging in Australia
Four studies assessed the impact of standardised packaging implementation on quit intentions/plans. A cross‐sectional study (Wakefield 2013, 536 participants) found no association between use of standardised versus branded packs on planning to quit in the next 30 days during implementation of standardised packaging. A series of cohorts found a short‐lived increase in intentions to quit among continuing smokers surveyed towards the end of standardised packaging implementation compared with before, although this effect was not sustained one year after implementation (Durkin 2015, 5441 participants). Yong 2015 in a cohort survey of smokers (1525 participants) found that a greater number of measures in relation to reactions to health warnings were predictive of intention to quit, shortly after standardised packaging implementation, than before. A second study, involving a series of cohort surveys found that reactions to health warnings predicted intentions to quit during the first year following implementation of standardised packaging (Brennan 2015, 3125 participants); Brennan 2015 also found that intentions were predicted by more concern than enjoyment, and disagreeing that the dangers of smoking have been exaggerated.
Other studies
One experimental study found no effect of viewing standardised or branded packaging on quit intentions (Wakefield 2012, 1203 participants).
Motivation to quit smoking
Twelve studies from Australia, the USA, France and the UK assessed motivation to quit smoking, also with mixed results (Brose 2014; Gallopel‐Morvan 2011; Gallopel‐Morvan 2012; Gallopel‐Morvan 2015b; Maynard 2015; Mays 2015; Moodie 2011; Moodie 2013; Nicholson 2015; Wakefield 2013; Wakefield 2015; Yong 2015).
Impact of standardised packaging in Australia
Four studies assessed the impact of standardised packaging implementation in Australia on motivation to quit smoking. One cross‐sectional survey (Wakefield 2013, 536 participants) found no difference in seriously considering quitting in the next six months, between those adults smoking tobacco in standardised packs versus those smoking tobacco from their own branded packs when standardised packs were being introduced. There was, however, a relationship between standardised packaging and health warnings on motivation to quit: Yong 2015 (1525 participants) in a cohort survey found that smokers, shortly after standardised packaging implementation, were more likely to agree that warning labels on cigarette packs made them "more likely to quit smoking" than prior to implementation; Wakefield 2015 (7175 participants), in cross‐sectional tracking surveys, found that a greater proportion of smokers credited the graphic health warnings with providing "much more motivation to quit" one year after standardised packaging was introduced than pre‐standardised packaging. Similarly, Nicholson 2015 (1643 participants), in serial cross‐sectional surveys, found that Aboriginal or Torres Straits Islander smokers were just as likely to recall noticing warning labels before and after standardised packaging was introduced, but after standardised packaging was implemented they were more likely to believe the warning labels made them more likely to quit.
Other studies
In a USA online experimental study, Mays 2015 (740 participants) found that those who viewed gain‐framed warnings on standardised packs reported greater motivation to quit than participants who viewed loss‐framed warnings on standardised packs. Gallopel‐Morvan 2011 (836 participants) conducted a cross‐sectional study in France, in which participants viewed images of various packs, and found that standardised packaging was perceived to be more effective for motivating smokers to quit compared to branded packs. In experimental studies (in the UK and France), findings were mixed. Moodie 2011 (48 participants) and Moodie 2013 (187 participants), in studies involving the use of standardised packs, found that those using standardised packs, on about half of the occasions when measurements were taken, were significantly more likely to want to quit than those smoking branded packs, whereas Maynard 2015 (128 participants) found no difference in the contemplation ladder (an assessment of readiness to consider stopping smoking) when smokers used standardised packs for 24 hours. Brose 2014 (98 participants) also found no effect on motivation to quit in an experimental study in the UK where young smokers handled branded versus standardised packs; Gallopel‐Morvan 2015b (142 participants), however, found that when using standardised packs, participants were more motivated to stop than when using branded packs, and more likely to search for information on quitting.
Thinking about quitting
Ten studies from Australia, France and the UK assessed thinking about quitting (Brennan 2015; Durkin 2015; Gallopel‐Morvan 2015a; Maynard 2015; Moodie 2011; Moodie 2013; Wakefield 2012; Wakefield 2013; White 2015a; Yong 2015).
Impact of standardised packaging in Australia
Five studies assessed the impact of standardised packaging in Australia on thoughts about quitting, with mixed results. One cross‐sectional study (Wakefield 2013, 536 participants) that assessed the impact of standardised packaging during implementation found that adult smokers who used standardised packs were more likely to think about quitting and rate quitting as a higher priority in their lives compared to those who smoked from their own branded packs. However, using a series of cohort studies, Durkin 2015 (5441 participants) found no significant differences in the proportion of continuing smokers who changed their thoughts about quitting to at‐least‐daily at follow‐up, compared to those in the pre‐standardised packaging cohort. An Australian cohort study that assessed the impact of standardised packaging pre‐ and post‐implementation (one year after) of standardised packaging (Yong 2015, 1525 participants) found that adult smokers who used standardised packs were more likely to think that the warning labels led them to think about quitting compared to pre‐standardised packaging, whereas a cross‐sectional, pre‐post standardised packaging study among past‐year adolescent smokers found no difference in thinking about quitting because of the warnings (White 2015a, 7740 participants). Brennan 2015 (3125 participants) found that in the first year of standardised packaging, thoughts about quitting were related to disliking the look of their pack, less satisfaction from their cigarettes compared to a year ago, disagreeing that the dangers of smoking had been exaggerated, attributing much more motivation to quit to graphic health warnings, and pack concealment in the past month.
Other studies
In five experimental studies, three (368 participants) found that using standardised packs was associated with increased thoughts about quitting (Gallopel‐Morvan 2015a; Moodie 2011; Moodie 2013), whereas two studies (1331 participants) did not (Maynard 2015; Wakefield 2012).
Intention to try smoking
Seven studies from Australia, China, Canada, France and the UK assessed intention to try smoking (Chow 2015; Ford 2013; Gallopel‐Morvan 2011; Hammond 2009; Hammond 2014; Kotnowski 2015; White 2015a).
Impact of standardised packaging in Australia
White 2015a (7740 participants) assessed Australian adolescent students in two cross‐sectional school‐based surveys before and after standardised packaging, and found that among those who had seen a cigarette pack in the last six months, there was a significant decrease in the proportion responding "don’t know" and "disagreeing" that "some brands are easier to smoke than others", following the implementation of standardised packaging. In the same study, an indirect measure was used to assess susceptibility to smoking among never‐smokers who had seen a cigarette pack in the last six months; the proportion of students reporting that none of their five closest friends smoked was significantly greater after standardised packaging than before. Moreover, among those who had seen a cigarette pack in the last six months, the proportion of non‐susceptible non‐smokers increased significantly and the proportion of current and experimental smokers significantly decreased.
Other studies
In an online within‐participant panel experiment in the UK (Hammond 2009, 516 participants) involving branded and standardised (brown and white) pack images, in all branded versus standardised comparisons, youth stated that they were less likely to try the standardised pack if they were to try smoking. Additionally when presented with two standardised packs only, but differing by having a descriptor versus no‐descriptor condition, respondents were more likely to report trying standardised packs if they included the adjectives smooth or gold, than standardised packs without those terms. When comparing standardised packs (with and without descriptors), significantly fewer youth perceived differences in trying smoking across the standardised packs, compared with their responses to the same branded comparisons (with and without descriptors). A similar online within‐participant experiment in the UK (Hammond 2014, 762 participants) found that youth were less likely to report that the standardised packs would make them want to try smoking (regardless of health warning label size and type, and brown or white colour) in comparison to the branded packs. There were no differences for either colour (brown versus white) of standardised packs. In a cross‐sectional survey in the UK with 1025 never‐smoking 11‐ to 16‐year‐olds (Ford 2013), a standardised pack was significantly less likely to tempt participants to smoke than the branded pack, P < 0.001. A between‐participants experiment in China (Chow 2015) that included 116 non‐smoking 18‐ to 22‐year‐olds found no difference in intention to smoke between those viewing branded and standardised packs, although there was an interaction between packaging and brand familiarity such that the familiarity of the brand exerted a moderating effect on the impact of packaging on intention to smoke. In an online survey in Canada (Kotnowski 2015) among 448 female young smokers and non‐smokers who viewed packs with different packaging attributes (structure, brand, branding, warning label size and price), pack structure (traditional, lipstick, slim, booklet) was the most influential factor in motivating trial intent among females, accounting for 46% of the variation, and branding accounted for 18% of the variance where participants were more likely to want to try the branded rather than standardised packs. In a cross‐sectional face‐to‐face interview study in France (Gallopel‐Morvan 2011), in which 836 smoking and non‐smoking adults viewed images of various packs, respondents were more likely to state that the standardised packs would prevent adolescents from starting to smoke and less likely to say that they would increase consumption among youth, compared to branded packs. Respondents also believed that branded packs were more intended for adolescents than the standardised packs.
Craving
A between‐participants face‐to‐face experiment with young adult smokers recruited 98 participants from a university online participant pool in the UK (Brose 2014), and found significantly lower ratings for craving after viewing standardised versus branded packs. A mixed model ANCOVA showed a significant interaction of packaging and before and after viewing pack (F (2,94) = 8.77, P < 0.001, partial η2 = 0.16) for standardised packs than preferred (their own pack) and non‐preferred branded packs. There was no difference between the two branded pack conditions.
Positive attributes
Appeal, taste and quality were evaluated in a range of ways across a large number of studies. Given the large volume of data, we have tabulated the results (see Table 2; Table 3; Table 4), but we also summarise them briefly by outcome and population group below.
Appeal
Thirty studies assessed appeal. Details of individual studies and their outcomes can be found in Table 2.
Impact of standardised packaging in Australia
Five studies (32,852 participants) assessed the impact of standardised packaging implementation in Australia on appeal (Balmford 2015; Dunlop 2015; Miller 2015; Wakefield 2015; White 2015a): four with adults (Balmford 2015; Dunlop 2015; Miller 2015; Wakefield 2015) and one with adolescents (White 2015a). All found appeal ratings to be higher for branded compared with standardised packs.
Other studies
Of the remaining studies, 10 evaluated measures of appeal in adult smokers (Borland 2013; Brose 2014; Gallopel‐Morvan 2015a; Gallopel‐Morvan 2015b; Guillaumier 2014; Maynard 2015; Moodie 2011; Moodie 2013; Wakefield 2008; Wakefield 2012). The nine of these that compared standardised with branded packs found appeal ratings to be higher with branded packs (3106 participants). A further study (Borland 2013, 160 participants) found that among five standardised packs which differed by pack shape and opening, the shape of the standardised pack significantly affected attractiveness, with rounded and bevelled packs rated as the most attractive; there was no effect of the different openings on attractiveness of the standardised packs. One study evaluated appeal in adult non‐smokers: Chow 2015 (116 participants) found that likeability was higher for familiar brands when in branded or standardised packs but that there was no evidence for a difference in likeability between branded and standardised packs when the brands were unfamiliar. A further five studies evaluated appeal in adult samples, including both smokers and non‐smokers. In Adkison 2014; Bansal‐Travers 2011; Doxey 2011; Gallopel‐Morvan 2011 (total of 2630 participants), branded packs were rated higher on measures of attractiveness and appeal than standardised packaging. Hammond 2011 (826 participants), conducted in women, also found that standardised packs (of ‘female’ brands) were given significantly lower appeal ratings than the female‐branded (with or without descriptors), and male‐branded packs.
Six studies evaluated measures of appeal in people under the age of 18. Four of these were conducted in samples including smokers and non‐smokers. In the four which compared branded and standardised packaging (4174 participants), all found appeal and attractiveness ratings to be lower for standardised packaging (Babineau 2015; Germain 2010; Hammond 2013; Hammond 2014). In a further study (Moodie 2012, 658 participants), when assessing different structural designs for standardised packs, 42% expressed a preference for a pack design they liked the most (50% no preference, 8% 'don’t know'), with 10% preferring the regular flip‐top, 25% the slide‐pack and 7% superslims. In one study in 1025 non‐smoking youth (Ford 2013), a composite pack appraisal (appeal) score was significantly lower for a standardised pack compared with a traditional flip‐top branded pack, which was significantly lower than two novelty structural design packs (superslims and pack with an innovative opening).
A further three studies evaluated appeal in samples including people over and under the age of 18; all had findings consistent with those above. In Hammond 2009 (516 participants), adult smokers and youth perceived the standardised packs as significantly less attractive; within standardised pack comparisons, packs with descriptors (such as smooth, gold) were perceived as significantly more attractive than those without descriptors, for both adult smokers and youth. Gallopel‐Morvan 2012 (540 participants) found that a branded pack was rated significantly higher than standardised packs for "attention grabbing", "flashy", "attractive", "nice", "trendy"; there were no differences between the three standardised packs for these attributes, except for "flashy" ‐ a brown standardised pack was rated as significantly more "flashy" than a white standardised pack. White 2012 (640 participants) found that branded packs were rated as significantly more appealing than standardised packs with and without descriptors; the standardised packs with descriptors were also rated as significantly more appealing than the standardised no‐descriptor packs.
Taste
Twenty‐one studies assessed perceptions of taste based on the appearance of standardised packs. Details of individual studies and their outcomes can be found in Table 3.
Impact of standardised packaging in Australia
Two studies (Miller 2015; Wakefield 2015), both in adult smokers, assessed the impact of standardised packaging in Australia on perceived taste of tobacco products. Wakefield 2015 (7175 participants) found no change in perceived differences in taste of different brands, during transition or at one‐year post‐standardised packaging compared to pre‐standardised packaging; Miller 2015 (268 participants) found that cigars and cigarillo smokers most commonly reported (66%) that the product they currently smoked was "about the same" (in terms of taste and enjoyment, one measure) compared with "two years ago" (a period including the introduction of standardised packaging), while 19% reported reduced/lower taste and 15% reported improved taste.
Other studies
Seven remaining studies evaluated perceptions of taste in adult smokers, with most finding lower perceived taste for standardised packs. Maynard 2015 (128 participants) found no significant differences between branded and standardised packs on taste; four studies (1576 participants) found taste ratings to be significantly worse for standardised packs compared to branded packs (Brose 2014; Gallopel‐Morvan 2015a; Gallopel‐Morvan 2015b; Wakefield 2012); Guillaumier 2014 (354 participants) found that branded packs were rated significantly more appealing on taste attributes than standardised packaging for one of the brand pair comparisons but not for the other; and in Wakefield 2008 (813 participants), although there were no significant differences between the three standardised packs and the branded pack for the statement “tastes like cheap tobacco”, the two least branded standardised packs were rated as significantly lower for the statement “rich in tobacco”. Four further studies (2735 participants) evaluated measures of taste in adult smokers and non‐smokers; in all four, tobacco in branded packs was rated more highly than tobacco in standardised packs for taste (Adkison 2014; Bansal‐Travers 2011; Doxey 2011; Hammond 2011).
A further four studies measured perceptions of taste in youth samples which included smokers and non‐smokers. Results generally found lower perceived taste for standardised packs, but this varied according to the colour of the standardised pack. In Hammond 2013 (947 participants), tobacco in standardised packs received significantly worse taste ratings compared to branded conditions; and Germain 2010 (1087 participants) found that in comparison with a branded pack, tobacco in the plainest standardised pack was rated more negatively in terms of positive taste characteristics, with no differences between the branded pack and the other two standardised pack conditions. Colour was important in the remaining two studies: Hammond 2014 (762 participants) found that compared with branded packs, the standardised packs with picture warnings on a brown but not white colour were significantly less likely to be perceived as having a smooth taste; and Moodie 2012 (658 participants) found that when assessing different colours for standardised packs, the red‐coloured standardised pack tended to be associated with stronger taste, there was no clear pattern with green, and the lighter colours were generally associated with weaker taste.
Four studies evaluated measures of taste in both children and adults. Again, standardised packs were generally rated as significantly worse‐tasting than branded packs, but there was variation by colour, presence of descriptors and structure. In Hammond 2009 (516 participants), adult smokers were significantly more likely to perceive brown but not white standardised packs as less smooth‐tasting than their branded counterparts; youth were also significantly more likely to perceive the brown packs as less smooth‐tasting than their branded counterparts, but also in one out of the two white standardised pack/branded pack comparisons. Within standardised pack comparisons, standardised packs with descriptors (such as smooth, gold) were significantly more likely to be perceived as smoother‐tasting than those without, for adult smokers and youth. In Kotnowski 2015 (448 participants), a lipstick‐designed pack structure and slim pack were perceived to taste significantly better than the traditional pack structure (there was no difference in taste perceptions between a booklet‐designed pack and the traditional pack structure); respondents were significantly more likely to rate branded packaging as the pack that would contain better‐tasting cigarettes compared to standardised packs. White 2012 (640 participants) found that branded packs had significantly higher taste ratings than standardised packs with and without descriptors; the standardised packs with descriptors were also rated as having significantly higher taste ratings than the standardised no‐descriptor packs. Gallopel‐Morvan 2012 (540 participants) found that grey and white standardised packs were rated as significantly lighter‐tasting than the branded pack and a brown standardised pack.
Quality, value and demand
Twenty‐two studies assessed quality. Details of individual studies and their outcomes can be found in Table 4.
Impact of standardised packaging in Australia
Four studies (9903 participants) assessed the impact of standardised packaging implementation in Australia on perceived quality of tobacco among adult smokers (Balmford 2015; Miller 2015; Wakefield 2013; Wakefield 2015), and found decreased perceptions of quality compared to before, with findings largely pointing to standardised packs being perceived as lower quality. Balmford 2015 (1924 participants) found a significant increase in the proportion of participants who perceived that brands do not differ in prestige (or did not know) at both the follow‐up waves after the implementation of standardised packaging; there was a significant reduction in the proportion that perceived their brand to be of high or very high quality at both the follow‐up waves after implementation of standardised packaging compared to the wave before implementation. Similarly, Wakefield 2015 (7175 participants), using a national sample, found significantly more smokers reported lower satisfaction, lower quality, and lower value of their cigarettes than a year ago, after standardised packaging had been implemented compared to pre‐standardised packaging, but not during the transition period; they were significantly more likely to believe packs did not differ in prestige after standardised packaging compared with pre‐standardised packaging, but not during the transition period. In Wakefield 2013 (536 participants), a cross‐sectional survey, the finding that those smoking from standardised packs tended towards rating their packs as less satisfying and lower in quality compared to a year ago when smoking branded packs was borderline significant, but there was no difference when controlling for the proportion of the sample smoking from a standardised pack. In contrast, Miller 2015 (268 participants) found that 69% said their cigars and cigarillos were the same quality as "two years ago" (a period including the introduction of standardised packaging), 16% lower, 15% higher; for perceived value for money, 41% reported the same, 41% lower, and 18% higher.
Other studies
Ten remaining studies evaluated outcomes related to quality, value and demand in adult smokers. Seven of the remaining studies (2165 participants) found that standardised packaging was perceived as having lower quality/value: including measures of quality (Gallopel‐Morvan 2015a; Gallopel‐Morvan 2015b; Moodie 2011; Moodie 2013), motivation to purchase/choose (Brose 2014; Gallopel‐Morvan 2015a;Gallopel‐Morvan 2015b; Guillaumier 2014; Wakefield 2012); satisfaction (Gallopel‐Morvan 2015a; Gallopel‐Morvan 2015b; Moodie 2011; Moodie 2013), and perceived pleasure (Gallopel‐Morvan 2015a; Gallopel‐Morvan 2015b). In Gallopel‐Morvan 2015a (133 participants), participants also indicated that they felt significantly more embarrassed and would be "spreading a bad image of themselves" when using the standardised pack than their own branded pack, and that the branded pack was rated as having significantly more natural tobacco than standardised packs. Borland 2013 (160 participants) found that among five standardised packs which differed by pack shape and opening, the shape of the standardised pack significantly affected perceived quality, with the rounded and bevelled pack shapes as having the highest perceived quality of cigarette, and the regular flip‐top opening rated lower in perceived quality compared with the slide opening style. Mixed findings were reported in the remaining two studies: Maynard 2015 (128 participants) found that smokers randomised to the standardised pack condition, compared with those randomised to the branded pack condition, reported significantly less enjoyment of smoking, but no difference in satisfaction or acceptance of smoking; those randomised to standardised packs were significantly more likely to rate them as cheap. In Wakefield 2008 (813 participants) quality and satisfaction were rated lower for standardised packs, but there was no significant difference in ratings across the brands for other attributes: good value for money, exclusive/expensive brand, brand you might try/smoke and lower class, as pack branding reduced. Three further studies (2233 participants) evaluated outcomes related to quality in adults in samples which included smokers and non‐smokers. All three found standardised packs to be rated as lower quality than branded packs (Adkison 2014; Bansal‐Travers 2011; Gallopel‐Morvan 2011). In addition, in Bansal‐Travers 2011 participants were more likely to say they would buy the branded pack rather than the standardised packs if they were to choose between the two, and in Gallopel‐Morvan 2011 participants were significantly more likely to say that a branded pack appeared to be most expensive, and that they would be more motivated to purchase it, compared to the standardised pack.
Four studies evaluated measures related to perceived quality/value in people under the age of 18. In one study in non‐smokers, Ford 2013 (1025 participants) found that there was no significant difference in a composite pack receptivity (value) score between a standardised pack and a regular flip‐top branded pack; scores for the latter were significantly lower than two novelty structural design packs (superslims and a pack with an innovative opening). The other three studies included both smokers and non‐smokers, and found that the quality of standardised packs was perceived as lower than branded packs. In Babineau 2015 (1378 participants), in a pack preference task in which students were asked which pack they would choose, just over half selected a branded pack, 34% no pack and 13% a standardised pack. Similarly, Hammond 2014 (762 participants) found that compared with branded packs, standardised packs were significantly less likely to be selected as the pack participants would choose. Germain 2010 (1087 participants) found that as branding decreased, perceptions of the pack being lower class became stronger as the packs became progressively plainer; there was no significant difference in the perception of the pack being lower class between the two standardised packs, with 80% and 30% graphic and text warnings.
One study assessed quality in both adult and adolescent populations. Gallopel‐Morvan 2012 (540 participants) found that a branded pack was rated significantly higher than standardised packs for good‐quality cigarettes and for motivating purchase. There were no differences in quality ratings for the three standardised packs (white, grey or brown), but the grey pack was rated significantly higher on motivating purchase than the brown and white packs.
Salience and recall of health warnings
Health warning salience
Nineteen studies evaluated the impact of standardised packaging on salience of health warnings. Again, outcome measures varied across studies, and we have tabulated results in Table 5. Findings are briefly summarised by study population below.
Impact of standardised packaging in Australia
Seven studies assessed the impact of standardised packaging in Australia on health warning salience, six with adult smokers (Dunlop 2015; Miller 2015; Nagelhout 2015; Nicholson 2015; Wakefield 2015; Yong 2015), and one with youth (White 2015a). In general, the findings pointed towards greater salience of health warnings on standardised rather than branded packs. Wakefield 2015 (7175 participants), found that significantly more smokers noticed warnings first when looking at the pack during the transition and post‐standardised packaging periods, compared to pre‐standardised packaging, and Yong 2015 (1525 participants) found that there was a marked increase in attentional orientation towards health warnings in noticing but not in reading of warning labels, after standardised packaging was implemented compared to before. Nagelhout 2015 (2666 participants) found that a significantly greater proportion of smokers reported noticing, reading and talking about health warning labels at the two post‐standardised packaging waves compared with the pre‐ wave. Dunlop 2015 (15,745 participants) found that there was a significant increase in the proportion of smokers having strong cognitive, emotional and avoidant responses to graphic warnings in the two to three months after the introduction of standardised packaging, but did not find a significant change in the proportion of smokers strongly agreeing that the warnings were the only thing they noticed on their packs after the introduction of the standardised packs. However, Nicholson 2015 (1643 participants) found that smokers were similarly likely to recall noticing warning labels before and after standardised packaging was introduced. Miller 2015 (268 participants) found that 43% of cigar or cigarillo smokers said that they noticed warnings the same as "two years ago", 16% less often, and 33% more often. White 2015a found that among youth who had seen a cigarette pack in the last six months, there was no change in the frequency of students reading, attending to, thinking or talking about the health warnings after the introduction of standardised packaging.
Other studies
The five experimental studies in adult smokers were more mixed. In Gallopel‐Morvan 2015a and Gallopel‐Morvan 2015b (total 275 participants) there were no differences in ratings of the believability or credibility of the warnings on standardised packs compared to their own branded packs. In Moodie 2013 (187 participants), warnings were rated as being read more closely, and thought about more, on standardised packs than on their own branded packs, but no significant difference in the overall warning response composite scale was detected at any measurement point. Moodie 2011 (48 participants) also found no significant difference in the overall warning response composite scale at any measurement point. Maynard 2015 (128 participants) found that smokers randomised to a standardised pack condition were significantly more likely to report that the health warnings were very noticeable and more serious than smokers randomised to the branded pack condition; however, there was no significant difference in the believability of the health warnings or ratings of the health warnings on awareness of health risks across the two conditions. The two experimental studies in adult populations including smokers and non‐smokers did detect differences in health warning salience between branded and standardised packs. Al Hamdani 2013 (220 participants) found that participants were significantly more likely to recall the correct health warning on the two plainest types of standardised packs compared with a branded pack. Bansal‐Travers 2011 (397 participants) found that participants were significantly more likely to perceive the health warning as more likely to attract their attention on the packs with 100% health warnings (a form of standardised packaging) than the health warnings on branded packs with 30% and 50% health warnings. Finally, Borland 2013 (160 participants), which investigated different pack characteristics, found that shape and opening affected how distracted participants were from the health warnings, with the regular flip‐top pack shape and opening being rated as being least distracting from the health warnings.
Three experimental studies evaluated health warning salience in people under the age of 18, all of which included smokers and non‐smokers. Two of these detected a significant effect of standardised packaging on health warning salience: Goldberg 1999 (401 participants) found that recall levels of two ("Smoking can kill you" and "Cigarettes are addictive") of three warnings were significantly higher on the standardised pack (one was borderline significant) than the branded pack, although recall of the third warning ("Tobacco smoke causes fatal lung disease in non‐smokers") was significantly lower for standardised than for the branded packs; and Hammond 2014 (762 participants) found that compared with branded packs, the standardised packs were significantly more likely to be perceived as having a higher impact health warning. In contrast, a further two studies did not detect a difference: Germain 2010 (1087 participants) found that overall 58% of participants correctly recalled the graphic health warning and that this did not vary by pack condition (packs becoming progressively plainer).
One study, Gallopel‐Morvan 2012 (540 participants), found the health warning was rated as significantly more prominent in standardised packs than in the branded pack condition.
Perceptions of harm
Twenty‐seven studies measured the impact of standardised packaging on perceptions of harm, again using a diverse range of methods. Summary data from each study can be found in Table 6; as with other sections, we briefly summarise the findings by population group below. As explained below, perceptions of harm of standardised packaging were related to pack colour in some studies (see Table 6 and Characteristics of included studies for detail on each study).
Impact of standardised packaging in Australia
Eight studies assessed the impact of standardised packaging implementation in Australia on perceptions of harm, six with adults (Balmford 2015; Miller 2015; Nicholson 2015; Wakefield 2013; Wakefield 2015; Yong 2015), and two with youth. The findings were mixed. Yong 2015 (1525 participants) found a significant increase in reporting that the warning labels made them think about the health risks of smoking after standardised packaging was introduced compared to before; Balmford 2015 (1924 participants) found a significant reduction in the proportion of smokers who said they chose their brand for health reasons after the implementation of standardised packaging compared with the wave before implementation; and Wakefield 2015 (7175 participants) observed that significantly more smokers believed that brands did not differ in harmfulness one year post‐standardised packaging compared to pre‐standardised packaging, but not during the transition period. However, Wakefield 2015 also found no change in the perceived harmfulness of cigarettes compared with a year ago, nor in the belief that variants did not differ in strength, nor in believing the dangers of smoking were exaggerated. Similarly, Nicholson 2015 (1643 participants) observed that smokers were likely to believe smoking was dangerous to others before and after standardised packaging was introduced. Miller 2015 (268 participants) found that the majority of cigar and cigarillo smokers (66%) said that they perceived the harm from their current product (standardised) to be the same as compared to two years ago (branded), 15% reported harm to be lower, and 19% reported harm to be higher. Wakefield 2013 (536 participants), an earlier cross‐sectional regional survey in Australia during standardised packaging implementation, did not find any significant differences between those smoking standardised and branded packs in thinking about the harms of smoking or believing that the dangers of smoking have been exaggerated. In White 2015a (7740 participants), in youth who had seen a cigarette pack in the last six months, acknowledgement of negative health effects of smoking that had been promoted by health warnings or tobacco control advertising was high across the two surveys, with little change over time; exceptions to this were significant increases in the proportion agreeing that smoking was a leading cause of death and caused blindness, which increased over time. For new health messages introduced post‐standardised packaging, awareness was high with little change for two (gum/teeth disease and kidney disease), but increased for awareness of bladder cancer. White 2015b, using data from the same study, found that there was a significant decrease in the proportion disagreeing with the statements that "some cigarette brands contain more harmful substances than others" and"some brands are more addictive than others" following standardised packaging; however, there was no change over time in responses to the statement that "some cigarette brands are easier to quit than others".
Other studies
Experimental studies in adult smokers also offered mixed results. In two studies, an impact was detected: in Gallopel‐Morvan 2015a (133 participants), participants were more likely to report that the (brown) standardised pack was significantly more likely to make them think about the dangers of tobacco than their own branded pack; and in Gallopel‐Morvan 2015b (142 participants), respondents were significantly more likely to state that (brown) standardised packs raised awareness of the dangers of tobacco compared with branded packs. In contrast, the remaining four studies (1703 participants) did not detect a difference between (brown) standardised and branded packs in perceptions of harm (Brose 2014; Guillaumier 2014; Moodie 2011; Wakefield 2012). Mixed results were also found from studies in samples including adult smokers and non‐smokers, but this can be attributed to the colour of the standardised packaging. Adkison 2014 and Gallopel‐Morvan 2011 (1836 participants) found that (brown) standardised packs were significantly more likely to be associated with harm and danger (see Table 6 for detail). Bansal‐Travers 2011 and Doxey 2011 (909 participants) found no significant differences in perceived health risks of (white) standardised packs compared with branded packs. Hammond 2011 (826 participants) found that branded packs were given significantly lower ratings of harmfulness than standardised packs (described as light brown/beige).
Five studies evaluated perceptions of harm in people under the age of 18. In surveys and experimental studies, findings were more consistent with standardised packs perceived as more harmful, and again this was related to colour. In Ford 2013 (1025 participants), the only study conducted exclusively in never‐smokers, participants rated significantly more harmful a (brown) standardised pack than the regular branded pack; in addition the standardised pack (which had a traditional flip‐top design) was rated significantly more harmful than three branded novelty packs (designed with a distinctive shape, opening style or bright colour). Similarly, Babineau 2015 (1378 participants) found that branded packs were significantly more likely to be thought to carry less of a health risk than (brown) standardised packs. Hammond 2013 (947 participants) found that in an overall aggregate index score among all 10 brands, standardised packs (cardboard‐coloured) were rated as significantly higher health risk than branded packs (aimed at women) with descriptors, but not the same branded packs without descriptors or branded packs aimed at men. Hammond 2014 (762 participants) found that compared with branded packs, (brown) standardised packs with the 40% and 80% pictorial health warnings were significantly less likely to be perceived as having a lower health risk than the (brown) standardised pack with the text warnings. Moodie 2012 (658 participants) found that just under half of their participants made associations between different standardised pack colours and level of harm. The red‐coloured standardised pack tended to be associated with greater harm, there was no clear pattern with green, and the lighter colours were generally associated with reduced harm (with white the most clearly associated with reduced harm by 18%).
Finally, three studies evaluated perceptions of harm in studies that included youth and adults, all of which tested the impact of different pack characteristics; the findings were mixed. Hammond 2009 (516 participants) found variations based on colour such that in both the white standardised pack comparisons with branded packs, a significantly greater proportion of adult smokers perceived the standardised pack as having lower health risks and being easier to quit; for the brown standardised packs, for one of the comparisons with branded packs, a significantly greater proportion of smokers perceived the standardised pack as having greater health risk with no difference in ease of quitting, but there was no significant difference for this attribute in the other comparison. The findings with youth were mixed: with the white standardised pack a significantly greater proportion of youth perceived it as having lower health risks than branded packs in one out of two comparisons, and the brown standardised pack as greater health risks in one out of two comparisons with branded packs. Within standardised pack comparisons, packs with descriptors (such as smooth, gold) were significantly more likely to be perceived as lower health risks than those without, for both adult smokers and youth. In contrast, White 2012 (640 participants) did not find a significant difference across conditions (branded/standardised with descriptors, standardised without descriptors) in health risk ratings of the packs, even though the standardised packs were brown‐coloured. Kotnowski 2015 (448 participants) found that a lipstick‐designed pack structure, slim pack and booklet design were perceived as significantly less harmful than the regular pack structure; there was no evidence of a difference between (brown) standardised and branded packaging.
Discussion
Summary of main results
Standardised packaging has the potential to decrease tobacco use prevalence through two routes: (1) reducing uptake in non‐users (typically youth, under 24 years old), and (2) reducing use in current tobacco users (whether through cessation, relapse prevention, or reduction in consumption).
As seen in Table 1, the one study that assessed the impact of standardised tobacco packaging on smoking prevalence in Australia found a 3.7% reduction in odds when comparing before to after the packaging change, or a 0.5 percentage point drop in smoking prevalence, when adjusting for confounders. However, certainty in this finding was graded low, the advised starting point for observational evidence using the GRADE system. Despite the fact that in Australia standardised packaging was implemented concurrently with enhanced pictorial health warnings, we did not downgrade further specifically for this as the low GRADE takes into account the inherent difficulties in removing possible confounding from observational evidence, and as data on our secondary non‐behavioural outcomes provides plausible mechanisms of effect for the observed decline in prevalence. Evidence concerning cigarette consumption among current smokers came from four studies which reported mixed findings: two, including a large series of cross‐sectional surveys in Australia among current smokers before, during and after standardised packaging implementation, did not detect a difference in the number of cigarettes smoked (although this study did not include smokers who quit during the study period). Of the two small experimental studies in the UK, which involved using standardised packs for one week and one day respectively, the first reported a small, statistically significant reduction in the mean number of cigarettes smoked per day, and the second found no significant difference in either the number of cigarettes smoked per day or the volume of smoke inhaled. Certainty in the evidence is again limited. No included studies evaluated uptake, cessation or relapse prevention.
Due to limitations in the certainty of the evidence for these primary outcomes, with only five included studies assessing these outcomes, studies measuring related secondary outcomes can provide further information. As stated elsewhere, standardised packaging could work by removing the imagery/livery from tobacco packs which is misleading, attractive or which decreases the salience of health warnings (see How the intervention might work). By removing these attributes, an important cue to tobacco use both in smokers and non‐smokers may be eliminated. Furthermore, through removing these attributes, standardised packaging could alter knowledge, attitudes and beliefs about tobacco use, which could influence tobacco uptake in children and young people and lead to tobacco reduction or cessation, or both. Studies measuring these secondary outcomes are therefore important in assessing the likelihood that standardised packaging will contribute to decreasing tobacco use prevalence.
Studies measuring secondary outcomes were heterogeneous for a number of important factors, including study design, populations, standardised packaging characteristics, sampling methods and outcome measures. We were therefore unable to pool intervention impact statistical estimates, and thus we adopted a narrative approach. We summarise the evidence below, and whilst a few outcomes have mixed results (e.g. for quit intentions, some studies detected positive effects and some did not detect an effect), most of the evidence suggests that standardised packaging affects outcomes that could reduce smoking; none suggest that standardised packaging would increase smoking.
Regarding secondary behavioural outcomes, for current smokers, evidence from two Australian studies indicates that standardised packaging was associated with an increase in quit attempts. One study, assessing calls to a Quitline, also compared the impact of standardised packaging with the introduction of graphic warnings in Australia in 2006. The relative increase in calls was similar, but after the introduction of standardised packaging the increase was sustained for a longer period of time.
Several observational Australian studies also found evidence of increased avoidance behaviours (such as concealing the pack) post‐standardised packaging, and these were corroborated by experimental studies from the UK. Australian and UK studies found mixed evidence of self‐reported reduced smoking when using standardised packs (through forgoing cigarettes, stubbing out cigarettes early, smoking less around others and one examining the volume of smoke inhaled). Studies of eye‐tracking overall show increased visual attention towards health warnings on standardised compared with branded packs, and cue‐related tobacco choices were significantly lower with standardised than with branded packs. Corroborative evidence for an impact of standardised packaging on reduced smoking also came from four studies involving pack selection, in which participants (youth and adults) believed that they were either purchasing packs or would be sent packs; in all these studies participants were significantly more likely to choose the branded pack. One of the four studies was an auction, which used an established methodology in economics for assessing consumer behaviour; this study provides evidence that in addition to pictorial health warnings being less appealing, standardised packaging resulted in a reduced demand for cigarettes.
Regarding secondary non‐behavioural outcomes, findings on quitting cognitions among smokers were mixed, whereas findings on intention to smoke/susceptibility to smoking among youth generally pointed towards standardised packs being less likely to motivate intention to smoke. Evidence was very consistent in a wide range of studies, including some in Australia before and after standardised packaging, that standardised packs were less appealing than branded packs. The evidence was more mixed in relation to the taste of tobacco, but overall pointed in the direction of tobacco in standardised packs having a worse perceived taste than tobacco in branded packs; colour also played a role, with tobacco in brown‐coloured standardised packs being more likely to be rated worse‐tasting than tobacco in branded or white packs. Most studies assessing perceptions of quality found that tobacco in standardised packs was judged to be of lower quality than that in branded packs. Similarly, most studies of health warning salience indicated that health warnings were more salient on standardised compared with branded packs. Evidence on harm perceptions was more mixed, particularly following implementation in Australia; in experimental studies colour was a clear factor, with tobacco in brown standardised packs being perceived as more harmful than tobacco in branded packs and in comparison to tobacco in lighter‐coloured standardised packs. In one small experimental study, craving to smoke was also significantly lower with standardised than with branded packs.
In summary, there is a consistency of evidence for the impact of standardised packaging on some outcomes. The limited evidence we have from one study suggests that standardised packaging can lead to decreases in smoking prevalence. There was also limited evidence suggesting standardised packaging may increase quit attempts, and mixed evidence on consumption. No studies reported on cessation or relapse prevention. There were also no published peer‐reviewed behavioural studies on the impact of standardised packaging on smoking uptake, the key primary outcome for non‐smokers. However, the evidence from current studies for the secondary outcomes is consistent. Standardised packaging was less appealing to youth and adults, and, for most studies, using a variety of measures, standardised packaging was associated with decreased intention to smoke.
Overall completeness and applicability of evidence
We included 51 studies, all of which sought to address questions relevant to this review and used quantitative techniques. Due to the relatively recent introduction of standardised packaging (which was only complete in Australia at the time of our study search) and the heterogeneity of the included studies, we could not pool study results and have produced a narrative review.
Of the 51 included studies, only five contributed to our primary outcomes. The lack of studies assessing the primary outcomes reflects the recency of standardised packaging legislation in Australia. More studies are in the pipeline that will address this issue, particularly as other countries are now implementing or will be implementing standardised packaging.
Given the recency of standardised packaging in Australia, studies from Australia are also limited in their length of follow‐up. Indeed, a major limitation of the current version of this review is that it is unable to assess changes in tobacco use prevalence over a longer time period. This is particularly important for marketing restrictions, which consist of the removal of branded information. Previous research suggests the effects of removing tobacco marketing may not appear immediately upon implementation or exposure; rather, these effects are exerted over time as brand associations weaken (National Cancer Institute 2008). This is most apparent in the case of youth, for whom the effects of diminished tobacco marketing occur gradually as subsequent cohorts of youth age and enter the period of smoking initiation without these inducements to smoke.
When longer‐term impact studies become available, we will also be able to assess whether any immediate effects of standardised packaging implementation are sustained, or whether they are short‐lived, perhaps due to the immediate contrast of standardised with branded packs, or whether any impact may have a delayed onset. There was a notable lack of studies evaluating cessation, uptake, and relapse prevention; as illustrated in Figure 1, future studies assessing these outcomes could bridge the gap between signals from secondary outcomes and prevalence data.
When governments introduce standardised packaging, this provides an opportunity to refresh and enhance health warnings on the packs, so it is likely that confounding between standardised packaging and changes to health warnings will be a feature of other studies in the future. Nevertheless, researchers can make efforts to control for this in their studies, and experimental studies can complement population data on the effects of standardised packaging and graphic health warnings.
Secondary behavioural outcomes, on the whole, indicate how standardised packaging could reduce tobacco prevalence, increasing our confidence in the evidence we found on our primary outcomes.
Similarly, for the secondary non‐behavioural outcomes, there was evidence from a variety of different outcomes that standardised packaging reduces positive attributes and therefore the appeal of tobacco packs. These provide support for plausible mechanisms of effect consistent with the observed decline in prevalence and again strengthen our confidence in the findings.
In addition to studies directly comparing standardised and branded packaging, a subset of studies also contributed data on other pack characteristics, which provide additional points for consideration when evaluating and implementing standardised packaging. In particular, there were certain characteristics that affected the impact of standardised packaging on our outcomes. The most prominent was the colour of the packs. The studies consistently indicated that tobacco packs in darker colours, compared with lighter colours, were perceived as less appealing and more harmful, and in some studies were associated with harsher/worse taste and more salient health warnings. The use of descriptors on standardised packs, such as 'smooth' or 'gold', also influenced outcomes, compared with standardised packs where descriptors were absent. Descriptors diminished the impact of standardised packaging. Although not directly assessing standardised packaging, we also included two studies (Borland 2013; Moodie 2012) that assessed different structural designs for tobacco packs (pack shape and openings). These studies showed that the shape of standardised packs significantly affected attractiveness, with innovative designs such as rounded, bevelled and slide‐packs being preferred compared to traditionally‐shaped packs with square edges and a flip‐top opening. This is important, because standardised packaging policies do not always include the shape of the packs. Innovative pack shapes were also associated with increased perceived quality; shape and opening design also affected the salience of health warnings, with the regular flip‐top pack shape and opening rated as being least distracting from the health warnings. Lastly, there was a clear relationship between standardised packaging and health warnings, with standardised packs with larger graphic warnings having most impact.
Quality of the evidence
Given the inherent challenges in assessing the impact of population‐level policies such as standardised packaging, it is not surprising that a number of methodological limitations are apparent in the studies. This is reflected in the GRADE ratings in Table 1.
The most common limitation is the difficulty of isolating the impact of standardised packaging from other packaging changes to the warnings in studies in Australia. Studies from other countries which had not introduced standardised packaging also suffered from bias, predominantly due to sampling and the use of convenience samples rather than representative populations.
National policies such as standardised packaging cannot be assessed using randomised controlled trials, generally regarded as the most robust design, because countries cannot be randomly assigned to introduce the policy or not. With observational studies, the GRADE rating is low and studies can then be up‐ or downgraded depending on the extent to which they meet other criteria. A range of studies using different designs, including longitudinal and time series studies, are also considered robust for use when randomised controlled studies are not possible, and we have included such studies in this review. However, even with longitudinal and times series studies, there are significant methodological challenges to measuring the impact of individual policy measures on tobacco use prevalence. This is particularly true in the case of standardised packaging, for which the effects of a policy are likely to occur gradually over time, as noted above. In addition, tobacco control measures such as standardised packaging are often implemented at the same time as other policy measures. In Australia, standardised packaging was implemented simultaneously with enhanced pictorial health warnings. Isolating the impact of standardised packaging from other tobacco control measures, market trends and ‘secular’ changes in smoking prevalence makes causal attributions more uncertain. Low GRADE ratings for our primary outcomes reflect these inherent challenges, which have also been noted in previous reviews of tobacco marketing (Lovato 2011; US DHHS 2014). For these reasons, the legal and regulatory thresholds for evaluating the effectiveness of marketing restrictions to date have focused on secondary outcomes.
Some authors implemented creative designs such as randomising participants to trial the use of standardised packs in countries where standardised packaging had not been introduced. However, some of these studies used methods which limit their generalisability. In studies of smoking behaviours, most used self‐report because it is difficult in large studies to validate responses. Studies have generally shown that self‐report is a reliable indicator of smoking status (IARC 2008). Finally, for studies conducted in countries where standardised packaging has not yet been introduced, it is difficult to replicate a market in which all tobacco products are in standardised packs.
Nevertheless, a major strength of this review is the wide range of research designs and outcomes used. This includes the use of experimental research designs with high internal validity, which can be used to paint a more complete picture than observational studies alone.
Potential biases in the review process
We followed standard Cochrane methods where applicable, which are considered the gold standard. However, some element of subjectivity was needed, both in terms of 'Risk of bias' assessments and narrative syntheses; we have been transparent about our decisions throughout.
With regard to 'Risk of bias' assessments, we adopted an approach used in a previous review of standardised packaging to account for a variety of study designs (Moodie 2012c).
There are a number of tools available to help authors assess risk of bias across a range of study designs and we chose ours because of its previously‐established usefulness in assessing studies in this area. Although we could have used other tools, and can revisit this in the future should Cochrane tools for our range of study designs be developed, our tool of choice allowed us to systematically identify study limitations. Use of a different tool is unlikely to substantially change our conclusions.
A narrative synthesis is difficult when assessing findings from such a large number of studies and a diverse range of outcomes and outcome measures, so some degree of simplification was necessary. By providing tables of outcomes we hope that the level of balance between synthesis and detail that we present here is helpful to readers, but we realise in synthesising such a large number of diverse studies that the omission of some nuances is inevitable. We hope, however, that this review provides a useful index and starting point for people seeking to explore sub‐questions in more depth. In addition, we needed to make decisions about how some measures were categorised, for example the placing of craving as a non‐behavioural outcome when it is a physiological reaction (Badger 2007; Loewenstein 1996). We also categorised pack selection outcomes as behavioural, if participants bought cigarette packs, or believed they were to be given or sent the packs, and non‐behavioural if they were answering hypothetically which packs they would choose or prefer. Although it is unlikely that this classification introduced bias, it is possible that other authors would have classified these differently.
A further potential source of bias is that we took the decision to exclude 'grey' literature. Given the large volume of unpublished data of unverified quality arising from multiple sources, we felt the most transparent, reproducible and unbiased approach to take was to limit our review to peer‐reviewed, published studies. This was a difficult decision to make and we recognise that this means that some relevant unpublished data may not be included, as well as tobacco industry research revealed through court exposure. However, given that systematic reviews need to follow transparent and reproducible methods, and given the large volume of 'grey' literature in this area coming from a range of sources, we felt this was the best approach to take. The systematic inclusion of 'grey' literature in this area is particularly challenging, given the absence of study registers and study conduct guidelines for the range of study types included in this review (e.g. for randomised controlled trials, we could have searched ClinicalTrials.gov and the ISCTRN, whereas there is no systematic way of recording all of the study and data types relevant to this review). Where unpublished data were available that related to published studies, we take this into account in our main analysis. Other 'grey' literature of particular relevance to our primary outcomes is discussed in Agreements and disagreements with other studies or reviews, to provide additional context.
Lastly, the searches for this review were last run in January 2016. We are aware of studies that have been published since this date which may be relevant for inclusion (see Studies awaiting classification). However, initial assessment of these studies indicates that they are unlikely to have an impact on the conclusions of this review. We will assess them in full when we conduct the next update, and will incorporate them as appropriate.
Agreements and disagreements with other studies or reviews
Reviews
Our findings are consistent with two other systematic reviews of the evidence published in peer‐reviewed journals: Stead 2013 (drawn from a published report Moodie 2012c) and Hughes 2016 (a review focusing on low‐ and middle‐income countries or low‐income settings in high‐income countries). These reviews also found consistent evidence that standardised packaging reduces the appeal of smoking, and that standardised packaging tended to increase the salience of health warnings and, when in a darker colour, to reduce misperceptions of differences in harm across different cigarette packs. However, our review is the first published systematic review to include behavioural outcomes following the introduction of standardised packaging in Australia. A recent evidence review (Hammond 2014b) reported three studies with preliminary evidence of increased quit attempts and avoidance behaviours. Our review included 12 studies which found further evidence of an impact on quit attempts and avoidance, but also assessed smoking prevalence, consumption, reduced smoking, quit cognitions and intention to smoke among non‐smoking youth.
Routinely collected, unpublished data from Australia
Our results showing a decline in prevalence are broadly consistent with unpublished routine data emerging from Australia. There are a number of sources of routine data in Australia which focus on smoking prevalence/consumption, expenditure, the market, clearance and sales data. One of these is Roy Morgan survey data, which is discussed elsewhere in relation to the one study on prevalence included in this review (Diethelm 2015). Other sources and key findings are briefly summarised here. Although these data are not currently available in peer‐reviewed, published form, they do provide additional context, which is particularly useful given the small number of included studies and the lack of other systematic reviews currently evaluating our primary outcomes.
Three national repeat cross‐sectional surveys in Australia found statistically significant reductions in measures of smoking in the period after standardised packaging was introduced. First, the National Drug Household Survey found that daily smoking prevalence amongst people aged 14+ fell significantly between 2010 and 2013 (after the introduction of standardised packaging and mostly before tobacco tax increases from Dec 1st 2013) (Australian Institute of Health and Welfare 2014). The reduction was from 15.1% in 2010 to 12.8% in 2013, a reduction of 15% overall. Declines were observed in all states except Tasmania. Among young people only, there was a slight rise in smoking amongst 12‐ to 17‐year‐olds over the period but this was not statistically significant. Secondly, the Australian Secondary Students Alcohol and Drug Survey found decreasing smoking prevalence among 12‐ to 17‐year‐olds (White 2015b). Conducted every three years, these surveys demonstrated statistically significant declines in all measures of smoking between 2008 and 2014, and also between 2011 and 2014, during the period when standardised packaging was introduced. Finally, the National Health Survey of adults aged 18 and over was conducted in 2011 ‐ 2012 and 2014 ‐ 2015 (Australian Bureau of Statistics 2015). Daily smoking prevalence fell from 16.1% in 2011 ‐ 2012 to 14.5% in 2014 ‐ 2015.
Data are also available on expenditure, market and sales of tobacco in Australia, which can be viewed as indirect measures of prevalence. Overall they show declines in the period following the introduction of standardised packaging. The Australian Treasury reports net tobacco clearances in cigarette stick equivalent terms which includes excise and customs duty, meaning that the effect of tobacco tax rises cannot be separated from any impact of standardised packaging. These figures are from information released by Treasury in response to a Freedom of Information request in 2015, which contains data relating to tobacco clearances provided by the Australian Taxation Office and Customs to Treasury. Tobacco clearances fell 3.4% between the full calendar years 2012 and 2013 and a further 7.9% by 2014, a total reduction of 11% between 2012 and 2014. Household expenditure data are reported by the Australian Bureau of Statistics (Australian Bureau of Statistics 2014). Expenditure on tobacco and cigarettes fell from AUD 4.227 billion in the September quarter of 2012, before the introduction of standardised packaging, to AUD 3.366 billion in the same quarter of 2015, an overall reduction of over 20%. This was not a linear trend, with a rise in estimated consumption in the June 2013 and Sept 2013 quarters. However, in all other quarters since implementation there was a decline. Three other sources include sales data but limited information is available. A 2014 Euromonitor report on Tobacco in Australia showed a continued decline in sales of tobacco between 2011 and 2014 but provides limited information on sources of data or methods (Euromonitor International 2015). Two commercial datasets (InfoView and Aztec sales data) also exist, but although trends were cited by industry stakeholders the underlying data are not publicly available from either source and thus cannot be verified.
Overall, findings from these routinely‐collected data support our finding of a reduction in smoking prevalence in relation to the introduction of standardised packaging in Australia. These datasets provide information consistent with the studies included in our review, increasing our confidence in our results. However, they do not attempt to determine causality. We look forward to further data being made available as standardised packaging is implemented in other countries.
Authors' conclusions
Implications for practice.
The available evidence suggests that standardised packaging may reduce smoking prevalence. Only one country had implemented standardized packaging at the time of this review, so evidence comes from one large observational study. A reduction in smoking behaviour is supported by routine data collected by the Australian government. Data on the effects of standardised packaging on non‐behavioural outcomes are clearer and provide plausible mechanisms of effect consistent with the observed decline in prevalence. In particular, there is a consistency of evidence, from a variety of differently designed studies, and from a range of diverse outcomes, that standardised packaging reduces the appeal of tobacco packs. Evidence on these secondary outcomes are consistent with the regulatory objectives of standardised packaging in Australia, as well as other countries that have implemented or are implementing standardised packaging to date (Australian Government 2016; French Ministry of Social Affairs 2014). The available evidence suggests that colours, descriptors, and pack shape may all affect the impact of standardized packaging. Better understanding of the impact of standardized packaging on tobacco uptake and cessation and of its longer term effects is likely to come once other countries have implemented and evaluated standardised packaging.
Implications for research.
Performing randomised controlled trials of standardised packaging for behavioural outcomes is challenging, as it is a population‐level intervention. However, observational data using established methods (e.g. interrupted time series, pre/post designs) can shed light on the impact of standardised packaging, and the experimental studies included in this review can provide further data to increase understanding of the role of packaging design in smoking‐related outcomes. Guidelines on best conduct for these types of studies are available and should be followed where possible (EPOC 2013; IARC 2008; MRC 2011). There is a need for more studies from Australia on uptake of tobacco use, and also the longer‐term effects of standardised packaging. As other countries implement standardised packaging, comprehensive research programmes should be considered to assess impact on all possible outcomes. These studies should measure and adjust for potential confounders where possible. Studies should also take into account the colour used and which colour is being rolled out in countries implementing standardised packaging. Further observational studies are particularly needed to assess prevalence, consumption, cessation, uptake, and relapse prevention.
What's new
| Date | Event | Description |
|---|---|---|
| 1 February 2016 | Amended | Protocol updated to incorporate prevention, reduction and cessation. (Merge of 2 protocols into 1: Tobacco packaging design for preventing tobacco uptake and Tobacco packaging design for tobacco use cessation and reduction) |
Acknowledgements
We thank Mary Birken, Martine Stead and Crawford Moodie for their input at early stages of this review. We thank Toby Lasserson at the Cochrane Central Editorial Unit for his support with analysis. Particular thanks go to the authors of many of the included studies who provided additional information and detail when contacted. We thank Lindsay Stead from the Cochrane Tobacco Addiction Group for her help with searching, the peer reviewers for their valuable input, and Tom Fanshawe from the Cochrane Tobacco Addiction Group for his statistical advice.
Appendices
Appendix 1. Search Terms
Tobacco concept AND plain packaging, where:
1. (Tobacco OR smoking OR smoker* or cigar* or cigarette*).ti, ab.
2. (Tobacco or Smoking or Smoking Cessation or Tobacco Industry or Tobacco Smoke Pollution).sh
3. (pack? or packet? or package* or packaging or plain pr warning or label$ or pictorial OR graphic).ti.
4. (Product labeling or Consumer Product Safety or Advertising as Topic).sh.
5. 1 or 2
6. 3 or 4
7. 5 and 6
Characteristics of studies
Characteristics of included studies [ordered by study ID]
Adkison 2014.
| Methods | Country: USA Setting: Online Date: July 2010 (one week period) Design: within‐participants experiment |
|
| Participants | USA Web survey with 1000 participants between the ages of 14 and 65 of any smoking status. The sample was specifically designed to represent 4 age groups: 14 ‐ 17 years (20%), 18 ‐ 21 years (20%), 22 ‐ 25 years (20%), and 25 ‐ 65 years (40%). The study used a web‐based survey methodology. Participants were recruited from a panel maintained by Global Market Insite (www.gmi‐mr.com/globalpanel/ index.php), a private company that maintains global consumer and specialty panels. Membership in their panel involves a double opt‐in process where interested parties complete an online registration form, and then activate their account by clicking a link provided by GMI via e‐mail. Average age: 31 years. 499 males (49.9%). Ever smoked daily: 496 (49.6%), no measure of current smoking. Smokeless tobacco use in last 30 days (1 ‐ 5 days to 20 ‐ 30 days): 165 (16.5%) | |
| Interventions | IV – Participants selected the most appealing and least appealing smokeless tobacco packs from 6 shown (Skoal Long Cut Mint, Camel Snus Frost, Marlboro Snus Peppermint, Camel Strips Fresh, Camel Orbs Fresh, and Stonewall Wintergreen Hard Snuff). Then these products were presented to participants with 3 distinct packaging variations: branded vs standardised, flavour descriptors vs no descriptors, and graphic versus text warning labels (data for the latter not relevant to this review) Branded = 2/6 smokeless tobacco products originally shown Standardised (plain) = Brown standardised packages On both branded and standardised packs, this text warning was shown: “This products can cause mouth cancer” |
|
| Outcomes |
[Secondary non‐behavioural]: most appeal to people your age, most likely to attract your attention, least attractive to a smoker, have the best taste, most dangerous to your health, deliver the most dangerous chemicals, which buy if you were trying to reduce health risks, make people think about the health risks of tobacco use, which would someone your age most want to be seen using, which contains smokeless tobacco of better quality (branded pack only) [author note: Participants were left to interpret their own perception of “quality” and respond accordingly] Analysis summary: Initially, participants were provided with a brief one‐sentence description of how to use each product, given that many of the products may have been unfamiliar, and were then asked to indicate which product was the most appealing and which was the least appealing. The tobacco products selected as ‘most appealing’ and ‘least appealing’ were then presented to participants with 3 distinct packaging variations. Standardised and branded packs shown at the same time on the screen, and asked to choose standardised, branded or no difference when asked questions. Knowledge of smokeless tobacco and perceptions of appeal, novelty, and health risks associated with SLT pack design characteristics, were tested using Chi2 tests of independence for each categorical variable. Multinomial regression was employed to evaluate the association between packaging elements and participant age. These models were adjusted for sex and race/ethnicity (White non‐Hispanic, Black non‐Hispanic, Hispanic, other non‐Hispanic), and tobacco use status |
|
| Funding source | "Data collection for this study was funded by the NCI‐funded Roswell Park TTURC, P50 CA111236 (PI Cummings). The preparation of this article has been supported by Federal funds from the National Institute on Drug Abuse, National Institutes of Health, and the U.S. Food and Drug Administration, Department of Health and Human Services, under Contract No. HHSN271201100027C. The views and opinions expressed in this document are those of the authors only and do not necessarily represent the views, official policy or position of the U.S. Department of Health and Human Services or any of its affiliated institutions or agencies." | |
| Conflicts of interest | "Richard J. O’Connor (RJO) has served as a consultant to the Tobacco Constituents Subcommittee of the Tobacco Products Scientific Advisory Committee (TPSAC) of the U.S. Food and Drug Administration. RJO, via a subcontract from Research Triangle Institute, reviewed confidential and trade secret documents on menthol cigarettes submitted by tobacco manufacturers pursuant to an FDA request, and presented this information in closed session to TPSAC (10 Feb 2011); this information was not used in any way in the current study." | |
| Notes | ||
| Risk of bias | ||
| Bias | Authors' judgement | Support for judgement |
| Selective reporting (reporting bias) | Low risk | Quote: “The current research evaluates the association between three SLT packaging elements –warning label format, flavor descriptors, and corporate branding – with percep‐ tions of health risks, novelty and appeal. Additionally, because it is particularly important to curb tobacco uptake among youth and young adults, we assess how messages conveyed by these packaging elements may differ across age groups, including youth (14‐17 years), young adults (18‐25 years), and older adults (26‐65 years).” Comment: Authors reported outcomes stated in aims and generally as expected |
| Sampling Method | High risk | Quote: “Participants were recruited from a panel maintained by Global Market Insite (http://www.gmi‐mr.com/global‐ panel/index.php), a private company that maintains global consumer and specialty panels.” Comment: online consumer panel, not enough detail given |
| Measurement of independent variable | Low risk | Comment: Standardised pack was distinguishable from branded packs. However standardised pack was brown with text warning only, unlike many plain packs that are on the market in countries |
| Measurement of dependent variable | Low risk | Quote: e.g. “Participants rated the packs compared with 'no difference' on appeal, novelty, and risk perceptions associated with product use.” Comment: Similar measures to previous studies |
| Control for confounding | Low risk | Comment: models were adjusted for some potential confounders |
| Statistical methods | Low risk | Comment: Appropriate |
Al Hamdani 2013.
| Methods | Country: Canada Setting: 3 Universities in Halifax Rural Municipality, Halifax, Nova Scotia Date: not known Design: Between‐participants experimental design. 4 (branded and 3 standardised pack levels) x 2 (smoking status: smokers and non‐smokers) in which participants were randomly assigned to view 1 package (smoking status was a non‐manipulated variable) |
|
| Participants | 220 adult university students (aged 19+). The accessible population consisted of adult university students who attended 3 universities: Dalhousie University, Saint Mary’s University, and Mount Saint Vincent University. This accessible population represents the target population because it includes adults who come from different socioeconomic status, cultural backgrounds, and geographical locations in Nova Scotia. The sample was recruited through information sheets posted around the university campuses. Interested students were asked to read the online information letter that served as the informed consent and preceded the image of the package and the health warning question. No average age provided but stated: 77.7% of the sample were aged 19 ‐ 24 with the remainder aged over 25. 100 men (45.5%). 53 smokers (24.1%); 167 non‐smokers (75.9%) |
|
| Interventions | IV: branded vs 3 levels of standardised packaging Branded = regular branded pack (Peter Jackson) Standardised (plain) = Compared 3 levels of standardised packaging (light green colour) to the equivalent branded pack. Plain package 1 preserved the orientation and font of the brand and its text but removed the logo and a red line on the bottom of the package. Plain package 2 standardised the orientation and font of the brand, and standardised and moved the brand text to the bottom of the package. Plain package 3 standardised the brand name and text, and placed them at the bottom of the package (30 cigarettes in standard font text). The packages become progressively plainer |
|
| Outcomes |
[Secondary non‐behavioural]: Health warning salience Analysis summary: 7‐minute survey on perceptions of the pack as a time‐delay strategy, then asked to answer a multiple‐choice question to test their recall of the health warning. A sequential binary regression analysis was conducted to look at whether standardised/packaging and/or smoking status affected health warning recall. Preliminary analysis showed that the demographic variables as well as smoking status did not vary significantly across the 4 pack conditions. Therefore, none of these variables was controlled for in the logistic regression analysis. A sequential binary logistic regression test was used to compare the odds of choosing the correct health warning on the original pack as compared to plain packs 1, 2 and 3, and the odds of choosing the correct health warning for smokers and non‐smokers. The main effects of smoking status and pack ID were entered in the first block, and the interaction between smoking status and pack ID was entered in the second block. A sequential binary logistic regression test to examine whether plain packaging and/or smoking status affects health warning recall |
|
| Funding source | not given | |
| Conflicts of interest | not given | |
| Notes | ||
| Risk of bias | ||
| Bias | Authors' judgement | Support for judgement |
| Selective reporting (reporting bias) | Low risk | Quote: “This study represents continuing efforts to test whether plain packaging increases health warning recall. It compares three levels of plain packaging to an original package with respect to health warning recall to add to the literature of plain packaging studies. It also examines how being a non‐smoker could increase the odds of recalling health warnings.” Comment: Aims set out were reported and were as expected. |
| Sampling Method | High risk | Quote: “The study population consisted of adult university students (19 or older) who attended three universities in Halifax Rural Municipality (HRM): Dalhousie University, Saint Mary’s University and Mount Saint Vincent University.” “The sample was recruited through information sheets posted around the university campuses.” Comment: convenience sample |
| Measurement of independent variable | Low risk | Quote: “The second is plain package 1, which preserved the orientation and font of the brand and its text but removed the logo and a red line on the bottom of the pack‐ age. The third package is plain package 2, which standardised the orientation and font of the brand, and standardised and moved the brand text to the bottom of the package. The fourth package is plain package 3, which standardised the brand name and text, and placed them at the bottom of the package. The packages become progressively plainer from the first package to the fourth package.” Comment: A variety of plain packs were used, which varied from the branded pack |
| Measurement of dependent variable | Low risk | Quote: “Once the participants were randomly assigned their pack, they completed a brief seven‐minute survey on their perceptions of the pack as a time‐delay strategy. Then they were asked to answer a multiple‐choice question to test their recall of the health warning.” Comment: Measures used (warning recall) similar to previous studies – established measures. |
| Control for confounding | Low risk | Quote: “A preliminary analysis showed that the demographic variables as well as smoking status did not vary significantly across the four pack conditions. Therefore, none of these variables were controlled for in the logistic regression analysis.” Comment: differences across groups tested |
| Statistical methods | Low risk | Comment: Appropriate |
Babineau 2015.
| Methods | Country: Ireland Setting: Secondary schools Date: March ‐ May 2014 Design: Within‐participant experimental pen & paper survey To measure young people’s perceptions of attractiveness, health risk and smoker characteristics of tobacco packaging |
|
| Participants | 1378 aged 16 ‐ 17 year‐olds. A representative sample of secondary schools (5th year of secondary school) aged 16 ‐ 17 from around Ireland was selected for participation. The schools were stratified on the basis of several factors: (A) geographic location, (B) school size, (C) type of school (boys, girls, co‐ed), (D) religious affiliation (according to the 3 categories of public education in Ireland: Catholic, Church of Ireland, interdenominational) and (E) socioeconomic status (schools designated ‘disadvantaged’ by the state vs non‐disadvantaged schools). After stratification according to the sampling criteria, a total of 30 individual schools were randomly selected for inclusion. In each school, all students in the 5th year were asked to participate in the research. After arranging a time with the principal and participating teachers, a researcher travelled to the school to administer the questionnaire to participating students. Average age 16.6 years. 767 male (55.7%) 602 female (43.7%) 9 self‐identified 'other'. 236 smokers (17.2%); 419 ex‐smokers (30.5%); 719 non‐smokers (52.3%) | |
| Interventions | IV = Brands: Silk Cut, Marboro or Benson and Hedges. Two comparisons were included in the paper Branded: (1) EU: Proposed packs as per the EU TPD 2014, including larger, dual‐sided text and pictorial health warnings covering 65% of the pack. Branded fonts and colours are retained Standardised (plain) = (2) Standardised packs with brand identifiers, including font, colour and embossing removed, as per Ireland’s Public Health (Standardised Packaging of Tobacco) Act 2014. Packs are of a brown matte colour and contain dual‐sided text and pictorial warnings covering 65% of the pack |
|
| Outcomes |
[Secondary non‐behavioural]: (1) attractiveness (“which, if either, of the cigarette packs do you think is more attractive”); (2) health risk (“which, if either, of the cigarettes do you think carries less of a health risk”) and (3) attributes of a typical smoker (“which, if either, of the cigarettes do you think is typically smoked by someone who is popular or well‐liked”). Pack preference task: All students were provided with a pack preference question, where they were presented with 6 pack images and an option of ‘No Pack/None of the Above’ on one page. For each brand of cigarette included in the study, a branded and a standardised pack were presented. They were then asked, “Given the choice between these packs, which one would you choose?” Analysis summary: Each page contained 1 pair of packs featuring the same brand, but a different level of standardisation ‐ i.e. 2 packs, one of which portrayed EU TPD guidelines and one portraying Irish standardised packaging guidelines. Asked to select a preferred pack for a series of outcome questions. Comparisons were conducted between all levels of standardisation for each brand, but not between brands. For the brand preference question, a variable was then created to indicate if the student chose a branded pack, a standardised pack, or no pack; Chi2 test to compare probability ppts selected EU or standardised pack for each outcome variable GEE regression models with exchangeable correlation matrices were conducted to explore the impact of demographic and smoking‐related factors on individuals’ perceptions of packaging. GEE binary logistic models conducted to explore factors related to pack preference with cases with missing data omitted. Individual regressions run for each brand for each of the 3 outcomes. 4 covariates included: gender, school‐level SES, country of birth and personal tobacco use (age omitted because of narrow age band). Interaction effects for all included variables also explored and entered into an additional model. Pack preference analysed through a binary variable |
|
| Funding source | “This project was funded by a Department of Health National Lottery Grant.” | |
| Conflicts of interest | “KB and LC have received funding from the National Lottery Grant Scheme of Ireland for the submitted work.” | |
| Notes | ||
| Risk of bias | ||
| Bias | Authors' judgement | Support for judgement |
| Selective reporting (reporting bias) | Low risk | Comment: Aims matched outcomes which were given for all participants and aims are as expected |
| Sampling Method | Low risk | Comment: Stratified random sampling of schools |
| Measurement of independent variable | Low risk | Comment: images of packs were easily distinguished |
| Measurement of dependent variable | Low risk | Comment: Used perceptions measures from other surveys ‐ although unclear the extent of reliability and validation but good face validity |
| Control for confounding | Low risk | Quote: "Four covariates were included in the GEE models: (A) gender, (B) school‐level socioeconomic
status, (C) country of birth (Ireland vs elsewhere) and (D) personal tobacco use (current smoker, ever smoker, non‐smoker). Age was omitted as all participants were in the 16–17 age range." Comment: Some potential confounders were controlled for |
| Incomplete outcome data (attrition bias) All outcomes | Unclear risk | Quote: "In the end, we approached 1412 students. A total of 28 students were unwilling to take part in the survey and an additional 6 left their survey completely blank on the day of administration leaving a final sample of 1378 and a response rate of 97.5%. " Comment: response rate was 90% for schools. Response rate for pupils a little unclear. The authors do not say anything about the sampling frame, i.e. how many were supposed to be in the class that day |
| Statistical methods | Low risk | Comment: Appropriate |
Balmford 2015.
| Methods | Country: Australia Setting: Respondents completed a survey via computer‐assisted telephone interview in earlier waves (beginning in 2002) and a mix of phone interview and web‐based survey in the 2 recent waves selected for this study Date: October 2011 ‐ December 2014 (3 waves of data) ‐ Specifically: October 2011 – February 2012 (pre‐SP) (n = 1104), February – May 2013 (post‐SP1) (n = 1093) and August – December 2014 (post‐SP2) (n = 1090) Design: Pre‐post standardised packaging study: longitudinal cohort study assessing a population‐based public health plain packaging intervention |
|
| Participants | Representative cohort of adult (aged 18+) smokers (smoked in last 30 days). All participants prior to the post‐SP wave were recruited by phone via a stratified random‐digit dialling frame, but new participants at the post‐SP wave were recruited by phone from a single source probability‐based panel via an address‐based frame Pre: 1104; Post (year 1): 1093; Post (year 2): n = 1090; TOTAL: 1924. Average age 51.5 years. 890 men (46.3%) Smokers 1924 (Pre‐SP: 1104 (100%) Post‐SP1: 1093 (100%) Post‐SP2: 1090 (100%) |
|
| Interventions | IV = pre‐ and post‐standardised packaging in Australia Branded = Real Australian brands on the market pre‐standardised packaging Standardised (plain) = Current Australian plain packages that came into effect December 1st 2012: dark brown‐green colour (Pantone 448C), with the brand name in the same typeface (Lucida Sans) and font size and colour (Pantone Cool Gray 2C). 75% pictorial health warning on front, 90% back |
|
| Outcomes |
[Secondary non‐behavioural]: determinants of brand choice including: ‘Was part of your decision to smoke your current brand based on whether it may not be as bad for your health' (1 of 3 options). Brand appeal: quality, prestige, perceptions of the appearance of one’s pack Analysis summary: The raw data were converted to Australian population estimates, with sampling weights calibrated to smoking prevalence by sex and age within each state and territory based on 2011 census and 2013 National Drug Survey data. Change over time (from pre‐ to post‐SP1 and post‐SP2) in brand awareness and identification along with other brand‐related measures was analysed using GEE by testing for a main effect of survey wave while controlling for potential confounders: demographics (age, gender, ethnicity, income and level of education), year of recruitment and mode of survey (internet or telephone). As the dependent variables were all treated as binary for the purpose of analysis, used binomial distribution and logit link function for the models. Assumed a working correlation structure which was unstructured given the large sample and used robust variance to compute the P values for the parameter estimates [11]. Overall, 1924 respondents provided at least one data point across the 3 survey waves (1000 with 1 data point, 496 with 2 data points and 428 with 3 data points), giving a total of 3276 person‐wave observations for the GEE analysis. GEE models were also used to explore correlates of brand awareness and identification and whether they differed between pre‐SP and post‐SP by testing for interactions by survey waves |
|
| Funding source | “Waves 8.5, 9 and 10 (Australia) of the ITC Four‐Country Survey are supported by multiple grants including grant P01 CA138389 (Medical University of South Carolina), National Cancer Institute of the United States, Canadian Institutes of Health Research (MOP115016), and National Health and Medical Research Council of Australia (APP1005922).” | |
| Conflicts of interest | Not listed in paper | |
| Notes | ||
| Risk of bias | ||
| Bias | Authors' judgement | Support for judgement |
| Selective reporting (reporting bias) | Low risk | Quote: “We explored the extent of changes in two variables, brand awareness (noticing others with the brand of cigarettes you smoke) and brand identification (perceiving something in common among smokers of your brand), and examined change in a number of other measures of brand appeal, brand characteristics and determinants of brand choice.” Comment: reported in line with aims and as expected |
| Sampling Method | Low risk | Quote: “The ITC‐4 is a longitudinal representative cohort study of adult smokers in the USA, Canada, UK and Australia conducted via computer‐assisted telephone interview in earlier waves (beginning in 2002) and a mix of phone interview and web‐based survey in the two recent waves selected for this study.” Comment: probability sample, nationally representative |
| Measurement of independent variable | Low risk | Quote: “Standardised packaging (SP) of tobacco products, introduced in Australia in December 2012, has the potential to disrupt this use of cigarette brands as part of identity badging. SP consists of two elements. First, plain packaging, which is designed to reduce the attractiveness and appeal of tobacco, increases the noticeability and effectiveness of health warnings, and reduce the ability of packaging to mislead consumers about smoking harms [4]. Second, it involves new larger graphic health warnings on the front face of the pack, designed to further highlight the health harms, but which also are likely to distract further from the branding of the pack.” Comment: Clear date of implementation and enforced |
| Measurement of dependent variable | Low risk | Quote: “We explored the extent of changes in two variables, brand awareness (noticing others with the brand of cigarettes you smoke) and brand identification (perceiving something in common among smokers of your brand), and examined change in a number of other measures of brand appeal, brand characteristics and determinants of brand choice.” Comment: similar to other previously used measures |
| Control for confounding | High risk | Quote: “while controlling for potential confounders: demographics (age, gender, ethnicity, income and level of education), year of recruitment and mode of survey (internet or telephone).” Comment: Whilst they adjusted for relevant confounders, standardised packaging was introduced alongside enhanced health warnings making it difficult to isolate the effects of standardised packaging |
| Incomplete outcome data (attrition bias) All outcomes | Unclear risk | Comment: No attrition/follow‐up rates stated |
| Statistical methods | Low risk | Comment: Appropriate |
Bansal‐Travers 2011.
| Methods | Country: USA Setting: Shopping mall (largest and most central mall in Buffalo) in Buffalo, New York Date: June ‐ July 2009 Design: Mall intercept survey |
|
| Participants | 397 adults (18+ US residents). Using a table in the mall staffed with at least 2 interviewers. The location of the table varied by day depending on space availability. People who approached the table were asked if they would like to participate. Average age 34 years. 203 men (51%); 194 women (49%). 197 smokers (49.6%); 200 non‐smokers (50.4%) | |
| Interventions | IV branded versus standardised packaging Standardised: white standardised pack with no health warning (Mayfair) Branded: Branded Mayfair with no health warning |
|
| Outcomes |
[Secondary non‐behavioural]: Most tar, smoothest taste, which buy, which buy if trying to reduce health risks, more attractive, appeal to youth < 18 years, contains cigarettes of better quality, appeal to youth aged < 18 years. Analysis summary: After completing a baseline survey, participants were asked to view a series of cigarette packages, one set at a time. Participants were allowed to pick up and review the packs if they wanted and then were asked 4 ‐ 8 questions about each set. Interviewer read and filled out the form. Participants were encouraged to select one of the packages in the set as a response for each question. Chi2 statistics were used to test for signifıcant differences in pack selections. In order to examine how different pack selections might be influenced by a person’s smoking status and type of cigarette smoked (among current smokers), a series of logistic regression analyses were performed. For these analyses, the main outcome variables were the different pack selections, and the independent variables were either smoking status (smoker or non‐smoker) or type of cigarette smoked (“light/mild” vs full flavour) among current smokers. The analyses were adjusted for the following variables (categoric): age in years (18 – 24, 25 – 34, 35 – 44, 45 – 54, 55 – 64, 65+); gender (male, female); race/ethnicity (white, non‐Hispanic; black, non‐Hispanic; Hispanic; Other, non‐Hispanic); and education level (12 years or less; greater than 12 years); and for the smoker‐only analysis, cigarettes per day (0 – 10, 11 – 20, 21+). Where 3 packs were presented for selection as the dependent variable (size, attribution), multinomial logistic regression was used. Regression models were conducted to test if the adjusted models differed from what is presented; . |
|
| Funding source | "This study was funded by a Developmental Research Grant from the Transdisciplinary Tobacco Use Research Center at the Roswell Park Cancer Institute, NCI grant P50 CA 111236, as well as supported in part by P01 CA138389 (Roswell Park Cancer Institute, Buffalo NY), funded by the U.S. National Cancer Institute." | |
| Conflicts of interest | "KMC has served in the past and continues to serve as a paid expert witness for plaintiffs in litigation against the tobacco industry. No other fınancial disclosures were reported by the authors of this paper." | |
| Notes | Some details taken from supplmentary online‐only appendix | |
| Risk of bias | ||
| Bias | Authors' judgement | Support for judgement |
| Selective reporting (reporting bias) | Unclear risk | Quote: See Table 2 Comment: Not all outcome measures were tested/reported for the plain pack comparison |
| Sampling Method | High risk | Quote:“recruited through a cross‐sectional mall‐intercept survey.” Author comment: "The participant went to the table, although we did have big signs by the table asking people if they would like to participate, and the interviewers did talk to people as they read the sign and walked by." Comment: Mall intercept, convenience sample |
| Measurement of independent variable | Low risk | Comment: packs were clearly distinguishable |
| Measurement of dependent variable | Unclear risk | Quote: “ Packs were rated on criteria including risk perceptions, quit motivation, and purchase interest.” Author comment: "Interviewer read and filled out the form while participant reviewed and handled the packs in each condition set." Comment: measures similar to those used in other studies but they were completed by the interviewer so participants might have felt some social pressure to respond but not clear in which direction they might have felt pressure |
| Control for confounding | Low risk | Comment: potential confounders were controlled for |
| Statistical methods | Low risk | Comment: Appropriate |
Borland 2013.
| Methods | Country: Australia Setting: Web‐based survey with video clips of pack opening Date: Not stated Design: Between‐ and within‐participants experimental design. 5 (pack design) x 2 (brand: Benson & Hedges, a prestige brand vs Longbeach, a discount brand) x 2 (health warning size: 30%, the current size, vs 70%). Within‐participants: pack design. Between‐participants: brand and health warning. Two substudies were conducted with different pack designs: pack shapes and pack openings |
|
| Participants | 160 young Australian adult (aged 18 ‐ 29) ever‐smokers (smokers and recent quitters). The survey was conducted on the internet by a registered market research company (the Social Research Centre). Respondents were drawn from a national panel of previously identified smokers from the company’s database. Participating respondents were awarded credits as part of a redemption scheme devised by the market research company 80 men (50%) 80% (129) smokers; 32 (20%) non‐smokers; 33 ex‐smokers (20.6%). Median age 25 years |
|
| Interventions | Not about standardised packaging (as all packs were standardised), but pack structure (shapes and openings) The 5 pack shapes were: 1. standard pack (7 ‐ 6 ‐ 7 organisation of the cigarettes); 2. wider and thinner shape (2x10 pack); 3. squarer and fatter shape (4x5 pack); 4. bevelled‐edged; and 5. rounded pack shape (both of the last 2 had the same basic shape as the standard pack) The 5 pack openings were: 1. standard flip‐top; 2. flip opening from the base (Rotate); 3. slide‐out mechanism (Slide); 4. case opening; and 5. side opening flip‐top (Side‐Flip), sometimes called a Lighter pack All packs were standardised: Beige (cardboard) coloured with standard font for the brand, the descriptor name (e.g. Fine) and the number of cigarettes. The study used a 10‐point font Standardised pack would be 1 in each of the variations above, i.e. the standard flip‐top pack. Other shapes and openings would be viewed as non‐standardised for the purposes of this study HW: 30% front and back, 70% front and back but only image of front shown. All packs used the same graphic health warning on the face of the pack (‘Smoking causes peripheral vascular disease’), with the current picture redesigned for the 70% warnings. The colour, font and HW size were different from those subsequently implemented in Australia |
|
| Outcomes |
[Secondary non‐behavioural]: 1) perceived attractiveness; 2) quality of the cigarettes contained; 3) distraction from the health warning on the pack (rankings were from 1 (least) to 5 (most) on each characteristic); 4) which pack shape they preferred most and least Analysis summary: Repeated measures analysis of variance was used to test for mean differences between pack shapes/openings and to identify interactions with brand or health warnings. They used Spearman’s r for correlations. Post hoc tests used Bonferroni corrections for multiple comparisons. They used a significance level of 0.05 throughout but note that within‐participant power to find effects was greater than for the between‐participants effects. Overall means for pack preferences were calculated where ratings were only of most and least by scoring 5 points for each most preferred, 1 point for least preferred and scoring all other cases 3 points |
|
| Funding source | Funded by Quit Victoria and the VicHealth Centre for Tobacco Control, Cancer Council Victoria | |
| Conflicts of interest | RB is a member of a Technical Advisory Committee advising the Australian Department of Health and Ageing on various aspects of the implementation of the plain packaging legislation. He did not use any information he may have gained on that committee in making decisions on the form of the study, and this study was designed and implemented completely independent of that committee. | |
| Notes | ||
| Risk of bias | ||
| Bias | Authors' judgement | Support for judgement |
| Selective reporting (reporting bias) | Low risk | Quote: “The aim of this study was to identify young Australian adult smokers’ perceptions of different pack designs and the cigarettes contained in those packs.” Comment: Authors report results in line with aims of study and as expected |
| Sampling Method | High risk | Quote: “The survey was conducted on the internet by a registered market research company (the Social Research Centre). Respondents were drawn from a national panel of previously identified smokers from the company’s database.” Comment: Non‐probability sample, no other details given |
| Measurement of independent variable | Low risk | Comment: Different packages were cleary depicted, in images and video used to show pack openings Quote: “Respondents were shown real size computer‐generated static images of five pack shapes (order randomised) and made their ratings of them (figure 1). This was followed by short video clips of five different methods of pack openings which showed the packs opening, followed by static images of partly opened packs (again in randomised order) used when rating the packs (figure 2).” |
| Measurement of dependent variable | Low risk | Quote: “Respondents ranked packs on attractiveness, perceived quality of the cigarettes contained within and extent that the pack distracted from health warnings.” |
| Control for confounding | Low risk | Comment: Measures are similar to previous surveys and good face validity |
| Incomplete outcome data (attrition bias) All outcomes | Unclear risk | Quote: “Repeated measures analysis of variance was used to test for mean differences between pack shapes/openings and to identify interactions with brand or health warnings. We used Spearman’s r for correlations. Post hoc tests used Bonferroni corrections for multiple comparisons.” Comment: within‐participants and between‐participants comparions, it does not seem that confounding was controlled for in between‐group comparisons |
| Statistical methods | Low risk | Comment: Appropriate |
Brennan 2015.
| Methods |
Country: Australia Setting: National Tobacco Plain Packaging Tracking Survey, Australia. Dual‐frame random digit dialling telephone surveys with approx 100 surveyed per week Date: December 2012 ‐ November 2013 Design: Observational cohort survey ‐ continous cross‐sectional surveys with follow‐ups carried out one month later. (Both baseline and follow‐up surveys had to be completed during the first year of implementation of the packaging changes (prior to implementation of the 12.5% tax increase for tobacco products that occurred in Australia on 1 December 2013) |
|
| Participants | Australian adult cigarette smokers aged 18 ‐ 69 (Note: the sample was restricted to current smokers of factory‐made or roll‐your‐own cigarettes; currently smoked daily or weekly, or smoked monthly or less‐than‐monthly but self‐identified as a smoker rather than as an ex‐smoker). Continuing cigarette smokers at follow‐up: 2948 (*Sample used in analyses predicting daily thoughts about quitting, intentions to quit in next month, firm date to quit in next month, pack concealment, stubbing out and stopping oneself from smoking); 54.7% men (n = 1612); 45.3% women (n = 1335) Baseline cigarette smokers at follow‐up: N = 3125 (Sample used in analyses predicting attempts to quit in past month) 55.1% men (n = 1594) 44.9% women (n = 1403) Age not available The average age of the sample (n = 5441) 45.2 years. Across each stage of standardised packaging, the average age of the sample: Pre (n = 1423) 50.3 years; Early transition (n = 276) 47.6 years; Late transition (n = 617) 45.6 years; Post‐year 1 (n = 3125) 42.7 years |
|
| Interventions | IV: Branded vs standardised packs in Australia Branded = Own brand of factory‐made or roll‐your‐own cigarettes Standardised (plain) = dark brown‐green colour (Pantone 448C), with the brand name in the same typeface (Lucida Sans) and font size and colour (Pantone Cool Gray 2C). 75% pictorial HW on front; 90% back |
|
| Outcomes |
[Secondary behavioural]: Predictors of quit attempts, pack concealment, stubbing out and stopping oneself from smoking Analysis summary: 2 analytical samples: 1. Cigarette smokers at baseline who continued to be cigarette smokers at follow‐up (‘continuing cigarette smokers’; n (weighted) = 2948; n (unweighted) = 2907) were used in models predicting all outcomes except for quit attempts. 2. Cigarette smokers at baseline who completed the follow‐up survey (‘baseline cigarette smokers’; n (weighted) = 3125; n (unweighted) = 3081 were used in models predicting the likelihood that smokers had attempted to quit in the month between the baseline and follow‐up surveys. The baseline sample was weighted using a design weight and a post‐stratification weight, accounting for telephony status (landline or mobile), gender, age by education, and state of residence. The follow‐up sample was weighted using a longitudinal weight, derived from an adjustment to the baseline weighting variable, which accounted for each participant’s probability of being retained in the follow‐up sample. A series of initial logistic regression models was conducted to examine the association between each predictor and each outcome (i.e. 1 model per predictor/outcome). When more than 1 significant predictor (at P < 0.05) of an outcome was identified, a multivariable model was conducted that included all predictors associated with the outcome at P < 0.05, so as to identify the strongest independent predictors. Initial and multivariable models were conducted that were unadjusted and adjusted for the covariates described above as well as the date of the follow‐up survey and the number of days between surveys. Unadjusted and adjusted models controlled for the baseline level of the outcome variable. Conducted 2 sets of sensitivity testing: 1. To examine the possibility that associations between the predictors and the outcomes were influenced by the anticipation of the 12.5% tax increase on 1 December 2013 rather than the packaging changes, all adjusted analyses were repeated excluding respondents who were followed up in November 2013; 2. Previous research has indicated that interest in quitting tends to be lower in the last 3 weeks of December and higher in the first 2 weeks of January, so repeated all adjusted analyses including an indicator variable to capture the January seasonality effect. Adjusted for the effects of sample weighting on parameter estimates and SEs. In addition, unconditional approach used to limit the sample as appropriate for each set of analyses, ensuring correct estimation of the SEs. Cases that had missing data on outcome variables, the baseline versions of these variables and predictor variables (typically < 5% combined) were deleted listwise from each model |
|
| Funding source | “The National Plain Packaging Tracking Survey was funded under a contract with the Australian Government Department of Health and Ageing.” | |
| Conflicts of interest | “The authors wish to advise that MW was a member and MS a technical writer for the Tobacco Working Group of the Australian National Preventive Health Task Force and MW was a member of the Expert Advisory Committee on Plain Packaging that advised the Australian Department of Health on research pertaining to the plain packaging legislation. MW, SD and EB hold competitive grant funding from the Australian National Health and Medical Research Council and MW holds competitive grant funding from the US National Institutes of Health, Australian National Preventive Health Agency and BUPA Health Foundation.” | |
| Notes | ||
| Risk of bias | ||
| Bias | Authors' judgement | Support for judgement |
| Selective reporting (reporting bias) | Low risk | Comment: All outcomes were reported as stated in aims. Outcomes were given for whole sample |
| Sampling Method | Low risk | Comment: random‐digit dialling telephone surveys |
| Measurement of independent variable | Low risk | Comment: The date of the implementation of standardard packaging was known and well enforced |
| Measurement of dependent variable | Low risk | Comment: Measures have been used in other surveys |
| Control for confounding | High risk | Quote: “It is also possible that the impact of these beliefs may be moderated by responses to the GHWs.” Comment: Enhanced graphic/pictorial health warnings (GHW) were implemented at the same time as standardised packaging so it is difficult to separate the effects. Hence confounding rated high even though other factors had been controlled for. |
| Incomplete outcome data (attrition bias) All outcomes | Low risk | Quote: "Using dual frame random digit dialling telephone surveys (response rate 57%), we conducted a prospective cohort study in which resondents completed a follow‐up interview approximately 1 month after baseline (median time to follow‐up=29 days, range=18‐64 days; mean retention rate per month=83%, range=78%‐87%). The study procedure is described in more detail elsewhere". Comment: Reponse rate and follow‐up rate do not seem to provide a high risk for bias |
| Statistical methods | Low risk | Comment: Appropriate |
Brose 2014.
| Methods | Country: UK Setting: University research laboratory/study centre (University College London) Date: Oct ‐ Dec 2012 Design: Between‐participants experimental design |
|
| Participants | 98 smokers over the age of 18 and abstained from smoking for at least 12 hours before their scheduled study participation. Recruited through University College London’s Psychology online participant pool, open to students and also members of the public. Average age 23.3 years. 36 men (36.7%) | |
| Interventions | IV: Participants were randomised into 3 groups – preferred branded pack, non‐preferred branded pack or standardised pack group Branded = 1) Participant’s preferred branded pack (they brought their own packs); and 2) Non‐preferred (other) branded pack (1 of 2 regular branded cigarette packs was used). N.B. A non‐preferred branded pack was included to assess whether any cue reactivity could be reduced using any pack different from the ones participants most strongly associated with smoking and to see if any favourable evaluation of branded packs was linked specifically to the preferred brand. Standardised (plain) = Modelled on Australian standardised packaging (without brand or variant name): dark brown‐green colour as those used in Australia (Pantone 448C), with the brand name in the same typeface (Lucida Sans) and font size and colour (Pantone Cool Gray 2C). 75% pictorial HW on both sides |
|
| Outcomes |
[Secondary non‐behavioural]: craving and motivation to stop Analysis summary: Participants completed a baseline questionnaire before undertaking the exposure task during which they were presented with a closed cigarette packet and asked to describe each side of the packet in detail for 1 min to ensure engagement with the design of the packs and the health warnings on them, so that the differences in pack design and prominence of health warnings could affect craving and evaluation of packaging. Following the exposure task, participants completed a second questionnaire and were debriefed using a standardised script. One‐way ANOVAS and Chi2 statistics were used to compare baseline characteristic across the 3 groups. Sensitivity analyses adjusted for age and gender and frequency of smoking. Mixed‐model 3x2 ANCOVAs with packaging type as between‐participants variable and time point of measurement (baseline to post‐exposure) of craving or motivation to stop as within‐participant variable were used to assess the effect of packaging type on craving and motivation to stop smoking. Significant findings were followed up by one‐way ANCOVAs followed with Sidak‐adjusted pairwise comparisons of the change in craving or motivation from baseline to post‐exposure in the 3 groups. Participants’ perceptions of the pack, smokers using it and effectiveness of the pack to affect behaviour were entered into a one‐way MANCOVA and, following a significant result, perceptions across the 3 groups were compared in individual one‐way ANCOVAs followed with Sidak‐adjusted pairwise comparisons |
|
| Funding source | "Leonie Brose’s post was funded by the National Centre for Smoking Cessation and Training (NCSCT). Chwen Chong and Emily Aspinall have no competing interests to declare. Susan Michie has received travel funds and hospitality from Pfizer, who manufacture Champix. She has received fees for speaking at educational events sponsored by Pfizer. She has received research funds and consultancy payments from the Department of Health and the Department of Transport and is co‐director of the NCSCT. Andy McEwen undertakes research and consultancy and receives fees for speaking from companies that develop and manufacture smoking cessation medications (Pfizer, GSK and Novartis). He also has a share of a patent for a novel nicotine delivery device and he is the director of the NCSCT" | |
| Conflicts of interest | "Leonie Brose’s post was funded by the National Centre for Smoking Cessation and Training (NCSCT). Chwen Chong and Emily Aspinall have no competing interests to declare. Susan Michie has received travel funds and hospitality from Pfizer, who manufacture Champix. She has received fees for speaking at educational events sponsored by Pfizer. She has received research funds and consultancy payments from the Department of Health and the Department of Transport and is co‐director of the NCSCT. Andy McEwen undertakes research and consultancy and receives fees for speaking from companies that develop and manufacture smoking cessation medications (Pfizer, GSK and Novartis). He also has a share of a patent for a novel nicotine delivery device and he is the director of the NCSCT" | |
| Notes | ||
| Risk of bias | ||
| Bias | Authors' judgement | Support for judgement |
| Selective reporting (reporting bias) | Low risk | No evidence of this |
| Sampling Method | High risk | Quote: "Participants were invited to the study centre… They were then paid or given research credits before being asked to do a breath test to verify abstinence." Comment: likely to be a highly selective sample of interested participants. Not clear the extent to which participants knew exactly what was going to be assessed. Small convenience sample of students. See text on sample above |
| Measurement of independent variable | Low risk | Comments: Standardised and branded packs were easily distinguishable |
| Measurement of dependent variable | Low risk | Quote: "Post‐exposure, participants completed 10 ratings in relation to the pack to which they had been exposed. All were rated on five‐point scales and scored so that higher scores reflected more positive evaluations" Comment: fairly well‐established measures and measurement likely to be robust |
| Control for confounding | Low risk | Comment: 3 groups were largely similar; they differed significantly on age of starting smoking which was used as a covariate in the analyses |
| Incomplete outcome data (attrition bias) All outcomes | Low risk | Quote:"Two participants were excluded from data analysis; one had a CO reading above 10ppm (preferred branded pack) and the other reported smoking within the last 12 hours (standard pack), leaving a sample of 98 participants. This sample size gave 80% power to detect effects of f=.3 (medium effect) in a repeated measures ANOVA with a=0.5" Comment: Complete outcome data appear to have been obtained from all the others except the 2 excluded participants. |
| Statistical methods | Low risk | Comment: Appropriate |
Chow 2015.
| Methods | Country: China Setting: 'Lab' experiment conducted with Chinese non‐smoking students in Macau Date: unknown Design:Between‐participants experiment with a 2 (label type: existing vs plain packaging) × 2 (brand familiarity: familiar vs unfamiliar brand) factorial design to investigate the effects of this new cigarette labelling format on smoking intent and brand likability among young people |
|
| Participants | The sample comprised 116 non‐smoking students aged 18 ‐ 22, 58 percent of them women, studying on the same programme and course at a university in Macau Part of a course curriculum in classroom in a university in China (took place during their normal lectures) 18 ‐ 22 years, average age unknown 42% (n = 49) men, 58% (n = 67) women 100% non‐smokers |
|
| Interventions | IV: 2x2 factorial design (packaging and brand familiarity) Branded: Among the 2 treatment conditions that showed the existing packaging, 1 was with a familiar brand “Marlboro” which accounted for more than 50% market share and the other was with an unfamiliar brand “Taipan” which accounted for only a minimal market share and a limited distribution. 50/50 split between the brand message and government message, with the government message in the text‐plus‐graphic format Standardised: Familiar brand Marlboro vs unfamiliar brand Taipan both on standardised packaging |
|
| Outcomes |
[Secondary non‐behavioural]: smoking intent and the brand’s likability. Brand likability was assessed with a single statement concerning how much they disliked the brand as a result of the packaging: This packaging makes you dislike the cigarette brand. Smoking intent was measured by the participating students’ responses to 3 statements ranked on a 9‐point Likert scale Analysis summary: A lab experiment with a 2 (label: existing versus plain packaging format) × 2 (brand familiarity: familiar vs unfamiliar brand) factorial design. During their normal lectures, students in the different treatment cells were first presented with pictures showing different cigarette‐pack labelling designs, and then instructed to complete a questionnaire measuring their smoking intent and the brand’s likability. The 4 treatments (i.e. 2×2 different cigarette packs) were randomly assigned to students. Survey completed immediately after experiment. Label type is the predictor and 'brand familiarity' is being used as a mediator |
|
| Funding source | None provided | |
| Conflicts of interest | None provided | |
| Notes | ||
| Risk of bias | ||
| Bias | Authors' judgement | Support for judgement |
| Selective reporting (reporting bias) | Low risk | Quote: "The sample comprised 116 non‐smoking students aged 18‐22, 58 percent of them female, studying on the same program and course at a university in Macau." Comment: Clearly set out hypotheses which were reported on in the results |
| Sampling Method | High risk | Comment: Convenience sample |
| Measurement of independent variable | Low risk | Quote: "Before analyzing the data, we had to ensure that the four treatments had been successfully
imposed on subjects through the manipulation." Comment: the authors tested whether the brands were distinguishable in the way intended and they were |
| Measurement of dependent variable | Low risk | Quote: "These statements were developed from the study done by Sabbane et al. (2009a, b), but required significant adaptation in accordance with the results of a focus group due to the very different context of our experiment." Comment: The questions were based on previous research and a local focus group |
| Control for confounding | Low risk | Comment: The authors tried to control for confounders in the design of their study |
| Statistical methods | Low risk | Comment: Appropriate |
Diethelm 2015.
| Methods |
Country: Australia Setting: Roy Morgan Research's Single Source survey. Nationally representative of Australia. Door‐to‐door using CAPI (computerised assisted interviews) Date: January 2001 ‐ December 2013 Design: Observational. Continuous cross‐sectional surveys. 156 months, monthly observations were computed from weekly surveys by the previous authors (Kaul and Wolf) of the working paper from which these data were extracted. Data analysed up until approximately 1 year afer the implementation of standardised packaging |
|
| Participants | Roy Morgan Research’s Single Source using random sampling methods.The total sample size over the period was approx 700,000; the average annual sample size was approx 54,200, with 4500 sample size per month. The composition of the sample changes each month (hence age, gender N/A) | |
| Interventions | IV: Plain packaging vs branded packaging (roll‐your‐own and factory‐made) Branded = prior to standardised packaging introduction Standardised (plain) = dark brown‐green colour (Pantone 448C), with the brand name in the same typeface (Lucida Sans) and font size and colour (Pantone Cool Gray 2C). 75% pictorial HW on front; 90% back |
|
| Outcomes |
[Primary]: Prevalence of tobacco smoking among adults over 156 months comparing pre‐ and post‐standardised packaging law Analysis summary: Stepwise (forward selection, backward elimination, both) logistic regression using the Akaike information criterion (AIC) to determine the final model. Also fitted a Loess non‐parametric trend, in the same way as Kaul and Wolf did in their paper, using R’s loess function with the same default parameters. Analysis is adjusted, for the following policies: graphic health warnings, smoke‐free policies, and tax increases on tobacco products |
|
| Funding source | “This research received no specific grant from any funding agency in the public, commercial or not‐for‐profit sectors.” | |
| Conflicts of interest | “The authors have no conflicts of interest to disclose.” | |
| Notes | For each month the percentage of smokers and size of the sample from the published figures were estimated and the number of smokers and non‐smokers in each sample was reconstructed. Additional data were provided by authors upon request. This paper investigated the findings of an unpublished industry‐funded paper (Kaul 2014). An upublished report for the Australian government also relies on the same data set (Chipty 2016) | |
| Risk of bias | ||
| Bias | Authors' judgement | Support for judgement |
| Selective reporting (reporting bias) | Low risk | Quote: “For each of 156 months from January 2001 to December 2013 we estimated the percentage of smokers and size of the sample from the published figures and reconstructed the number of smokers and non‐smokers in each sample.” Comment: Smoking prevalence were the only data available to analyse as indicated in objectives |
| Sampling Method | Low risk | Quote: “Roy Morgan Research’s data are known for the consistency of their random sampling methods and have been used in previous research to obtain reliable estimates of smoking prevalence in Australia...” Comment: Used probability sampling to obtain nationally representative sample |
| Measurement of independent variable | Low risk | Quote: "Australia was the first country to introduce this proposal by adopting the Tobacco Plain Packaging Act in November 2011 with progressive implementation between 1st October and 1st Decemer 2012" Comment: The date of the implementation of standardard packaging was known and well enforced, so it was possible to look for an effect on smoking prevalence |
| Measurement of dependent variable | High risk | Quote: “However, as the data used by Kaul and Wolf are not publicly available, we reconstructed them from Figures 1 and 2 in their paper on adults….We were able to replicate results of the authors’ weighted least square regression, corresponding to the straight line shown in their figure.” “…However, our results are clear cut and the addition of random noise to the data that our method may have induced will have biased any true effects towards the null, leading to an underestimate of the impact. It should also be noted that the way the data were extracted from the Roy Morgan database and aggregated over month is important; however little information on how this was done is provided by Kaul and Wolf.” Comment: The data (measurement of the dependent variable) were extracted from another paper, but they were able to replicate the analysis in the paper showing that it is highly likely the data were correctly extracted. Still, there are limitations because there was little information in the Kaul and Wolf paper on how the data were extracted from the Roy Morgan Reseach Database in the first place. |
| Control for confounding | High risk | Quote: “Together with the time variable (ranging from 1 to 156), we have included in the analysis the four indicator variables described above: Comprehensive smoke‐free policy (smoke. free); graphic health warnings (ghw); 25% tax increase (tax); plain packaging (pp).” “Another factor which may have also induced a decrease in smoking prevalence is the enlarged and enhanced health warnings, “which appeared on cigarette packs conjointly with the requirement for standardized packaging. It is however difficult to completely separate these two measures from each other as the larger health warnings are an integral part of the new pack design.” Comment: Enhanced pictorial warnings were implemented at the same time as standardised packaging so it is difficult to separate the effects. Hence confounding rated high even though other policies implemented that could have led to changes in smoking prevalence were included as indicator variables |
| Statistical methods | Low risk | Quote: “We ran stepwise (forward selection, backward elimination, both) logistic regression using the Akaike information criterion (AIC) to determine the final model.” Comments: Appropriate statistical methods were used to examine the effects of a policy using time series data |
| Other bias | Low risk | Secondary data from household survey that contain multiple measures, not just smoking‐focused. 'Computer Assisted Interviews' were used to collect the data. Ths survey ran for approximately 1 year after full implementation of standardised packaging (December 2013) |
Doxey 2011.
| Methods | Country: Canada Setting: web‐based Date: May ‐ June 2009 Design: Between‐participants design with 4 different pack conditions. Randomised (after assessing smoking status) to view 8 cigarette packs designed according to 1 of 4 experimental conditions: fully‐branded female brands; the same brands without descriptors (eg, ‘slims’); the same brands without brand imagery or descriptors (i.e. ‘standardised’ packs); and fully branded non‐female brands as a control condition |
|
| Participants | 512 women aged 18 ‐ 25 in Canada, smokers and non‐smokers Participants were recruited from a consumer panel of over 400,000 Canadians through Global Market Insite Inc. (GMI, Bellevue, Washington). Invitations to participate in the survey were emailed to select panel members, although the invitation did not indicate the nature. Participants complete a 20‐min survey by email 50% smokers/former smokers and 50% never‐smokers were randomised to each of the 4 conditions Average age 22 years. 212 (41%) smokers; 39 ex‐smokers (7.6%); 261 (51%) non‐smokers |
|
| Interventions | IV: 3 branded packs and standardised pack comparisons Branded = Condition 1: Branded female packs; Condition 2: Branded female packs with no descriptors; Condition 4: Non‐female branded packs Standardised = Condition 3: White standardised packs with brand names of real female brands (no variant/descriptor); All packages in the study displayed the same pictorial health warning covering 50% of the principal display surface, in accordance with Canadian regulations The 8 ‘female‐oriented’ brands were selected based on previous research and internal industry documents. These brands featured the descriptors extra slims, slims, menthol, cherry and vanilla, as well as ‘traditional’ female colour schemes, such as pink, white and other pastels. The ‘non‐female’ brands selected for condition 4 included popular ‘full flavour’ or ‘regular’ variants of Canadian cigarette brands |
|
| Outcomes |
[Secondary non‐behavioural]: perceived appeal, taste, tar delivery, health risks and smokers’ traits. For the first 4, responses were provided on a 5‐point Likert scale (e.g. 1 = ‘a lot more appealing’ to 5 = ‘a lot less appealing’) and subsequently coded as either a 1 (‘a little’/‘a lot more appealing’) or 0 (‘a little’/‘a lot less appealing’ and ‘no difference’). An overall index rating was created for each of the 4 measures, by summing scores across the 8 packages to yield a score between 0 and 8. For the smokers’ traits, for each package, respondents were asked to identify the typical smoker of each pack by answering the question ‘In your opinion, someone who chooses to smoke this brand is more likely to be' for 8 characteristics: female/male, glamorous/not glamorous, cool/not cool, exciting/ boring, popular/not popular, attractive/unattractive, slim/overweight, sophisticated/not sophisticated. For each set of traits, respondents could choose either trait, ‘don’t know’, or ‘no difference. The most desirable trait was scored a 1 and the less desirable trait, no difference and don’t know were scored a 0. Female was scored a 1 and male, no difference and don’t know were scored a 0. Analysis summary: Regression models were used to examine the effect of experimental condition for 3 primary outcomes: brand ratings, smoker trait ratings and beliefs about smoking. For each outcome, regression models were conducted in 2 steps. In step 1, only the experimental condition variable was included in the model. In step 2, the following variables were entered as covariates: age, education, income, self‐esteem, smoking status and weight concerns. Self‐esteem was included in models predicting brand ratings and smoker traits. Unless indicated otherwise, results are from the ‘adjusted’ models in step 2 with all covariates present. |
|
| Funding source | "Financial support for this project was provided by an Ontario Tobacco Research Unit Ashley Studentship for Research in Tobacco Control, a Canadian Institute for Health Research Strategic Training Program in Tobacco Research Fellowship, a Canadian Tobacco Control Research Initiative Student Research Grant, and the Propel Centre for Population Health Impact with funds from the Canadian Cancer Society." | |
| Conflicts of interest | "None" | |
| Notes | ||
| Risk of bias | ||
| Bias | Authors' judgement | Support for judgement |
| Selective reporting (reporting bias) | Low risk | Comment: appear reasonable and in line with study aims |
| Sampling Method | High risk | Quote: "Participants were recruited from a consumer panel of over 400 000 Canadians through Global Market Insite, Inc. (GMI, Bellevue, Washington)"..."Participants in the study were not recruited using random sampling and are therefore not necessarily representative of the Canadian population. For
example, the current sample reported somewhat higher levels of educational status than population‐based surveys.2 However, our sample was drawn from a national sample of heterogeneous
smokers and non‐smokers from throughout Canada, representing different socioeconomic levels that are broadly similar to the general Canadian population of youth and young adults" Comment: recruitment was through a large market research panel but educational differences apparent |
| Measurement of independent variable | Low risk | Comment: images were distinguishable. The use of white standardised packs may have diminished the differences between the results however |
| Measurement of dependent variable | Low risk | Comment: Although the provenance of the measures was not given, they appear to have good face validity |
| Control for confounding | Low risk | Quote: "There were no statistically significant differences between the four conditions on any
of the sociodemographic variables shown in table 1." Comment: groups across conditions were similar. The authors controlled for important covariates |
| Incomplete outcome data (attrition bias) All outcomes | Unclear risk | Comment: not enough detail given |
| Statistical methods | Low risk | Comment: Appropriate |
Dunlop 2015.
| Methods |
Country: Australia Setting: Cancer Institute’s Tobacco Tracking Survey (CITTS),New South Wales. A continuous cross‐sectional telephone survey with approximately 50 interviews conducted per week Date:April 2006 – May 2013 Design: Observational continuous cross‐sectional study with interrupted time‐series analyses until 5 months after compulsory standardised packaging implementaiton |
|
| Participants | 15,745 New South Wales, Australian adult cigarette smokers (aged 18+). Households are recruited using random‐digit dialling (landline telephone numbers only) and a random selection procedure is used to recruit participants within households (selecting the nth oldest eligible adult). Average age = unknown (18 – 29 n = 2265, 21%; 30 – 55 n = 8260, 48%; 55+ n = 4848, 31%) 47.5% men (n = 7503); 52.5% women (n = 8298) |
|
| Interventions | IV: branded vs standardised packaging Branded = own brands Standardised (plain) = dark brown‐green colour (Pantone 448C), with the brand name in the same typeface (Lucida Sans) and font size and colour (Pantone Cool Gray 2C). 75% pictorial HW on front; 90% back |
|
| Outcomes |
[Secondary behavioural]: warning avoidance (‘they make me feel that I should hide or cover my packet from the view of others’) Analysis summary: 2 approaches to statistical analysis used to assess impact of new packs on each outcome: 1) interrupted time series analysis; 2) multiple linear regression analyses to compare the scores for the 2 constructed scales in the months prior to and following the new packaging legislation, controlling for sociodemographic and smoking characteristics. Assessed impact of the introduction of the new packs on (1) the proportion of the sample strongly agreeing with each of the GHW statements, (2) the mean GHW Impact score, (3) the proportion of the sample strongly disagreeing with each of the pack perception statements and (4) the mean Negative Pack Perception score. Used autoregressive integrated moving average (ARIMA) analysis to model effects of introduction of the new packaging on the outcomes of interest, while accounting for background trends, seasonal variation, the effects of television anti‐tobacco advertising, and changes in cigarette price. ARIMA modelling chosen as data for each of the outcomes of interest were auto‐correlated. Next, multiple linear regression analyses was use to assess changes in scores on the GHW Impact and Negative Pack Perception scales, using month of interview as the indicator, focusing on the period of the introduction of the new packs. The months preceding and following the intervention were represented by a 5‐level term: (1) the 2 months preceding the change (August – September, ‘pre‐standardised packs’); (2) the 2 months of ‘phase‐in’ (October – November); (3) the 2 months ‘immediate post‐standardised packaging’ (December – January); (4) ‘3 – 4 months post‐standardised packaging’ (February – March); and (5) ‘5 – 6 months post‐standardised packaging’ (April ‐ May). Outcomes: Salience of tobacco pack health warnings, cognitive and emotional responses to warnings, avoidance of warnings, perceptions regarding one’s cigarette pack. Responses to these items were used in 2 ways. The first was collapsing responses for each item into a binary variable indicating strong agreement versus not. The second was averaging the responses to these items to create a scale indicating ‘Graphic Health Warning Impact’, with higher scores indicating greater overall impact Outcomes (Outcomes: Salience of tobacco pack health warnings, cognitive and emotional responses to warnings, avoidance of warnings, perceptions regarding one’s cigarette pack.) |
|
| Funding source | “This study was internally funded by the Cancer Institute NSW”. | |
| Conflicts of interest | "None" | |
| Notes | ||
| Risk of bias | ||
| Bias | Authors' judgement | Support for judgement |
| Selective reporting (reporting bias) | Low risk | Quote: “Limitations of the study include the use of landline‐only telephone numbers and a somewhat low response rate, possibly leading to some bias in sample composition. The rate of mobile‐only households in Australia, recently estimated at 19%, increased over the years of this study. Recent dual‐frame surveys have shown that samples recruited via mobile phone are more likely to include younger respondents and males than landline samples. The impact of these demographic differences are likely to be reduced in this study due to the inclusion of age and gender as covariates, the use of data weighted for these variables where appropriate, and the inclusion of smoking‐related covariates related to these demographic characteristics” Comment: biases were controlled for as far as possible |
| Sampling Method | Low risk | Quote: "Households are recruited using rando digit dialling (landline telephone numbers only) and a raondom selection process is used to recruit participants within households (selecting the nth oldest eligible adult)" Comment: Random‐digit dialling |
| Measurement of independent variable | Low risk | Quote: "On 1 December 2012, Australia became the first country to introduce mandatory plain packaging for all tobacco products." Comment: The date of the implementation of standardard packaging was known and well enforced |
| Measurement of dependent variable | Low risk | Quote: "the use of a time‐seires approach with multiple data points" and "From October 2011, smokers were asked a battery of questions relating to their perceptions of their packs" Comment: The same measures were used over time. Measures were similar to those used in other surveys |
| Control for confounding | High risk | Quote: "Owing to the simultaneous introduction of the plain packs and changes in the size and content of the warnings themselves, the relative contribution of the warning and pack changes to this increase
in smoker responses cannot be determined in this study" Comment: Enhanced pictorial warnings were implemented at the same time as standardised packaging so it is difficult to separate the effects. Hence confounding rated high even though other factors had been controlled for. |
| Incomplete outcome data (attrition bias) All outcomes | Low risk | Quote “An average response rate of 40% (American Association for Public Opinion Research Response Rate #4)” …."The response rate of CITTS is similar to that of other population telephone surveys on tobacco use in Australia, and was consistent across the study period, limiting its influence on the observed pattern of results.” Comment: Response rate is similar to other population telephone surveys |
| Statistical methods | Low risk | Comment: Appropriate |
Durkin 2015.
| Methods |
Country: Australia Setting: National Tobacco Plain Packaging Tracking Survey, Australia. Dual‐frame random‐digit dialling telephone surveys with approx 100 surveyed per week Date:April 2012 ‐ March 2014 Design: Observational. Cohort surveys. A series of 4 cohorts of Australian adult cigarette smokers originally sourced from a nationally representative cross‐sectional tracking survey probability sample. Followed up 1 month after the baseline interview. The 4 cohorts each completed 2 surveys 1 month apart (follow‐up period was 1 month). Timings of each participant’s baseline and follow‐up differed slightly (see details below). The pre‐standardised packaging phase included those who completed both baseline (10 April – 1 September 2012) and follow‐up surveys (7 May 2012 – 30 September 2012) prior to implementation of the packaging changes. The early transition/implementation phase included those surveyed at baseline in the pre‐packaging changes period (20 August – 28 September 2012) and followed‐up during the transition to the new packaging (1 October – 11 November 2012). The late transition phase included those first surveyed during the transition to the new packaging (1 October – 30 November 2012) and followed‐up either during the transition or soon after the full implementation of the new packaging (29 October 2012 – 20 January 2013). The 1‐year post phase included those who completed both surveys in the first year of full implementation of the new packaging (baseline surveys: 1 December 2012 ‐ 4 November 2013; follow‐up surveys: 2 January 2013 – 30 November 2013) |
|
| Participants | 5441 Australian adult (aged 18 – 69 years) current cigarette smokers of factory‐made or roll‐your‐own cigarettes Respondents come from a nationally representative cross‐sectional tracking survey (continuous cross‐sectional telephone baseline survey). Telephone interviews were conducted using a dual‐frame sample design, with half of baseline participants recruited via landline random digit dialling (RDD) and half by mobile phone RDD.Average age 45.2 (Pre‐ (n = 1423) 50.3 years; Early (n = 276) 47.6 years; Late (n = 617) 45.6 years; 1‐year post (n = 3125) 42.7 years). Men 54.9% (n = 2987), women 45.1% (n = 2454) | |
| Interventions | IV: branded vs standardised packaging in Australia Branded = own brand prior to standardised packaging Standardised (plain) = dark brown‐green colour (Pantone 448C), with the brand name in the same typeface (Lucida Sans) and font size and colour (Pantone Cool Gray 2C). 75% pictorial HW on front, 90% back |
|
| Outcomes |
[Secondary non‐behavioural]: Substantial research has demonstrated that thoughts about quitting and quit intentions prospectively predict making quit attempts. Frequency of thoughts about quitting was assessed by asking ‘During the past week, how often have you thought about quitting?’ with response options: ‘several times a day’; ‘once a day’; ‘once every few days’; ‘once’; or ‘not at all’. Consistent with previous research which found daily thoughts of quitting increased with antismoking advertising, responses were dichotomised into those who had thought about quitting at least once a day in the past week versus those who had thought about quitting less often. Quit intentions were measured using 2 questions: ‘Do you intend to quit in the next month?’ and ‘Have you set a firm date to quit in the next month?’ Analysis summary: Proportions of those reporting quitting‐related cognitions and behaviours in the follow‐up survey compared across 4 distinct phases. Each individual’s baseline level of each outcome variable was included as a predictor of that particular outcome variable at follow‐up, which enabled the use of the phase variable as a predictor of the variance in follow‐up quitting cognitions and behaviour that remained unexplained by an individual’s baseline levels ‐ the phase variable acted as a predictor of the difference in an individual’s quitting cognitions and behaviours between the baseline and follow‐up surveys (approximately 1 month apart). In all logistic regression analyses, the pre‐ phase was used as the referent category. Conducted models that were unadjusted and adjusted for covariates. Preliminary logistic regression analyses (unadjusted and adjusted) were first conducted to examine if there were any differences between phases on the baseline levels of each outcome variable. In analyses examining whether phase was associated with quit attempts at follow‐up, used the recency of previous quit attempts at baseline as the baseline level of the outcome variable. Used 5 categories indicating whether smokers had never previously tried to quit, had tried to quit more than 12 months ago, had tried to quit between 6 and 12 months ago, had tried to quit 2 – 6 months ago or had tried to quit within the past month. Additionally, conducted sensitivity testing to explore effects (in adjusted models) with and without inclusion of data collected in November 2013, the month prior to the tax increase on 1 December 2013. Also repeated all adjusted analyses including 2 indicator variables to capture seasonality effects. All analyses were conducted adjusting for the effects of sample weighting on parameter estimates and SEs. In addition, the ‘subpopulation’ command in Stata was used to limit the sample as appropriate for each set of analyses, ensuring correct estimation of the SEs. All reported adjusted proportions and ORs were adjusted for age, sex, education, socioeconomic status, HSI, antismoking advertising activity, change in cigarette price, number of days between the baseline and follow‐up surveys and date of follow‐up survey |
|
| Funding source | “The National Plain Packaging Tracking Survey was funded under a contract with the Australian Government Department of Health and Ageing" | |
| Conflicts of interest | “The authors wish to advise that MW was a member andMS a technical writer for the Tobacco Working Group of the Australian National Preventive Health Task Force and MW was a member of the Expert Advisory Committee on Plain Packaging that advised the Australian Department of Health on research pertaining to the plain packaging legislation. MW, SD and EB hold competitive grant funding from the Australian National Health and Medical Research Council and MW holds competitive grant funding from the US National Institutes of Health, Australian National Preventive Health Agency and BUPA Health Foundation.” |
|
| Notes | ||
| Risk of bias | ||
| Bias | Authors' judgement | Support for judgement |
| Selective reporting (reporting bias) | Low risk | As expected from previous surveys |
| Sampling Method | Low risk | Quote: "Telephone interviews were conducted using a dual‐frame sample design, with half of baseline participants recruited via landline random digit dialling (RDD) and half by mobile phone RDD" Comment: random‐digit dialling telephone surveys |
| Measurement of independent variable | Low risk | Comment: The date of the implementation of standardard packaging was known and well enforced |
| Measurement of dependent variable | Low risk | Quote: "..examine the effects of the new packaging on quitting‐related cognitions and behaviours;" Comment: Measures had been used in other surveys |
| Control for confounding | High risk | Quote: "At the same time new and larger GHWs covering 75% of the front of cigarette packs (up from 30% previously) and maintaiing coverage of 90% of the back, were also introduced." Comment: GHW Enhanced pictorial warnings were implemented at the same time as standardised packaging so it is difficult to separate the effects. Hence confounding rated high even though other factors had been controlled for |
| Incomplete outcome data (attrition bias) All outcomes | Low risk | Quote: “The mean monthly baseline survey response rate was defined as completed baseline interviews as a proportion of ‘estimated in‐scope contacts’ that could be interviewed within the survey period. This is a conservative assessment of the response rate, to take account of the fact that some households/respondents that refused the screening process would in fact be in‐scope (see technical report for detail of calculations). The mean monthly baseline survey response rate, adjusted for those who declined to be formally screened, but may have been eligible for the study, was 57% (range 51–63%). All survey participants who agreed to be recontacted were followed up approximately 1 month later (median=29 days, range 18–64 days), thereby creating an ongoing series of 1‐month cohort samples……Of the eligible baseline cigarette smokers (n(unweighted)=8597), 95% agreed to be recontacted (n(unweighted)=8144) and of these, 83% were successfully recontacted and completed the follow‐up survey (n(unweighted)=6775).” Comment: Reasonable response rates both for baseline and for follow up surveys |
| Statistical methods | Low risk | Comment: Appropriate |
Ford 2013.
| Methods | Country: UK Setting: In‐home survey in the UK (wave 6 of the Youth Tobacco Policy Survey (YTPS)). The YTPS is a long‐running, repeat cross‐sectional study examining the impact of tobacco policies on young people Date: July ‐ September 2011 Design: cross‐sectional survey |
|
| Participants | FACTS International, a market research company, recruited participants and conducted the survey. Random location quota sampling was used to generate a sample of 11 – 16‐year‐olds from households across the UK. Sampling involved a random selection of 92 electoral wards, stratified by Government Office Region and A Classification Of Residential Neighbourhoods (ACORN) classification (a geodemographic classification system that describes demographic and lifestyle profiles of small demographic areas) to ensure coverage of a range of geographic areas and sociodemographic backgrounds. Wards covering the islands, areas north of the Caledonian Canal, or those with fewer than 3 urban/suburban Enumeration Districts, were excluded from the sampling frame for cost and practicality reasons. In each selected ward, a quota sample, balanced across gender and age groups, was obtained. 1025 youth aged 11 ‐ 16 who have never smoked. The fieldwork comprised in‐home face‐to‐face interviews, accompanied by a self‐completion questionnaire to gather more sensitive information on smoking behaviour. 51.5% (n = 528) males |
|
| Interventions | IV: To compare adolescents’ responses to 3 different styles of cigarette packaging: novelty (branded packs designed with a distinctive shape, opening style or bright colour), regular (branded pack with no special design features) and standardised (brown pack with a standard shape and opening and all branding removed, aside from brand name). Brand names were concealed in an attempt to reduce prior brand knowledge informing pack ratings. Fronts of packs only shown. Participants viewed a single image of all 5 packs Branded = Pack A (Mayfair), a popular and familiar brand, represented an everyday pack without any notable design features, other than the blue colour. It therefore provided the potential for use as a benchmark ‘regular’ pack against which other packs could be compared; 3 packs (packs B, C,D) were selected to represent a range of ‘novelty’ packs. Pack B (Silk Cut Superslims) was an innovative, smaller and slimmer than usual pack shape with elegant and feminine aspects. Pack C (Marlboro Bright Leaf) provided an example of innovative opening, resembling a flip‐top cigarette lighter, more masculine features and dark colouring. Pack D (Pall Mall) represented a classic pack style but with a striking and unique bright pink colour (not relevant to this review so not mentiond in text of the review). Standardised (plain) = Pack E (a plain brown pack) represented a pack that was void of all design features. Health warning: text message ‘Smoking seriously harms you and others around you’ 30% UK text warning on front on all packs |
|
| Outcomes |
[Secondary non‐behavioural]: 11 items assessed young people’s responses to packaging across the 5 different pack designs. Participants were asked: ‘Can you tell me the number that best describes each pack?’ and were assessed via scales: (1) Attractive/ unattractive; (2) Eye‐catching/not eye‐catching; (3) Cool/not cool; (4) Not at all harmful/very harmful; (5) Fun/boring; (6) Worth looking at/not worth looking at; (7) Meant for someone like me/not meant for someone like me; (8) Grown‐up/childish; (9) Puts me off smoking/tempts me to smoke; (10) I dislike this pack/I like this pack; and (11) I would not like to have this pack/I would like to have this pack. Responses were provided on 5‐point semantic scales (e.g. 1 = ‘Attractive’ to 5 = ‘Unattractive’). Prior to analysis, items (1 – 7) were reverse coded to make a low score (1) indicative of a negative rating and a high score (5) indicative of a positive pack rating Analysis plan: Participants viewed 1 image, which displayed all 5 cigarette packs, and were asked to rate each pack on 11 items. Paired t‐tests were used to produce mean scores of the 11 items for: (1) the ‘traditional’ pack (Mayfair) relative to the mean scores for each of the 3 ‘novelty’ packs (Silk Cut Superslims, Marlboro Bright Leaf and Pall Mall) and (2) the standardised pack relative to the mean scores of each of the other 4 packs. The authors then combined these 11 measures into 2 separate variables using principal components analysis: (1) PACK APPRAISAL: 5 items combined to form a composite pack appraisal measure: (i) Unattractive/attractive; (ii) Not eye‐catching/eye‐catching; (iii) Not cool/cool; (iv) Boring/fun; (v) Not worth looking at/worth looking at and (2) PACK RECEPTIVITY: (6) Not meant for someone like me/meant for someone like me; (7) Puts me off smoking/tempts me to smoke; (8) I dislike this pack/I like this pack; (9) I would not like to have this pack/I would like to have this pack. In the analyses, the authors presented unajusted analyses for all individual items, but adjusted for the 2 composite variables |
|
| Funding source | “This work was supported by a grant from Cancer Research UK (C312/A8721). The UK Centre for Tobacco Control Studies contributed to the funding of Allison Ford and Gerard Hastings.” | |
| Conflicts of interest | “None” | |
| Notes | ||
| Risk of bias | ||
| Bias | Authors' judgement | Support for judgement |
| Selective reporting (reporting bias) | Low risk | Cross‐sectional survey. Possible that not all responses included in the article but limited, if any, evidence of reporting bias |
| Sampling Method | High risk | Survey representative of 11 ‐ 16‐year‐olds in the UK using established methods used in the same survey over a number of years. However, this article included only data from never‐smokers and this sub‐sample is not representative of all UK never‐smokers in this age group |
| Measurement of independent variable | High risk | Comment: not all the packs were clearly distinguishable. e.g. no brand names, but some packs still had logos (Marlboro). Standardised pack also did not have brand name. |
| Measurement of dependent variable | Low risk | Quote: "A number of stages between April and July 2011 informed the development and refinement of the 11 survey items. Initially, a set of eight exploratory qualitative focus groups with 15 year‐olds generated understanding about how young people think about and respond to cigarette packaging. Ideas for survey items, question styles and visual prompts were examined in a further six focus groups, segmented by gender and age (11–12, 13–14 and 15–16 year‐olds). A draft questionnaire was then piloted with 12 participants aged 11–16 years. A professional interviewer administered the questionnaire, observed by a researcher. On completion of the questionnaire, the interviewer left the room to enable the researcher to conduct a cognitive interview to assess participant understanding, ease of responding, relevance of questions and ability to respond." Comment: A range of variables included but careful testing conducted |
| Control for confounding | Low risk | Comment: Adjusted for relevant covariates |
| Incomplete outcome data (attrition bias) All outcomes | Low risk | Although not explicitly described, analysis of outcome data will only have included those who completed the survey in full and there may have been partial responses not included. However this is not unusual for a cross‐sectional survey |
| Statistical methods | Low risk | Quote: "Analyses were carried out using generalised estimating equations (GEE) for binary outcomes with an exchangeable correlation structure in order to generate estimates of the likelihood of (1) positive appraisal and (2) receptivity for each pack… for each of the five packs, two hierarchical binary logistic regression models were constructed to examine whether any association existed between (1) positive pack appraisal and susceptibility and (2) receptivity to the pack and susceptibility. GEE and logistic regression models controlled for the potential influence of demographic and smoking‐related factors identified in past research as influencing youth smoking". Comment: Appropriate |
Gallopel‐Morvan 2011.
| Methods |
Country: France Setting: Face‐to‐face interviews in the home Date: November 2008 Design: Observational cross‐sectional. (everyone exposed to same conditions in the same order – standardised pack and then branded pack) |
|
| Participants | A representative sample of 836 smokers and non‐smokers aged 18+ (quota sample was representative of age, sex and SES). LH2, the market research company, split France into different regions. People were recruited door‐to‐door 402 (48%) men; 434 (52%) women Age not asked, only age group: under 25: 11% (n = 92); 25 ‐ 34: 16% (n = 134); 35 ‐ 49: 27%; (n = 226); 50 ‐ 64: 25% (n = 209); 65+ 21% (n = 175). 278 (33.2%) smokers |
|
| Interventions | IV: 2 packs. Leading French pack: Marlboro standardised pack vs Marlboro branded pack (2 packs) Branded = Marlboro. Actual packs in France (leading brands) that were red and white Standardised (plain) = Standard grey packs. Text warnings on both plain and branded packs are white with black text, 30% on front and 40% on back |
|
| Outcomes |
First publication [Secondary non‐behavioural]: appeal, awareness of smoking dangers, reported to facilitate intentions to reduce consumption, to quit, or not to start among non‐smokers Analysis summary: Showed 1 pack and then the other and asked them to rate the pack. Showed physical packs. Ratings on the standardised pack vs branded pack were compared with Chi2 tests. Responses were also analysed taking into account smoking status, sex, and respondent age, a logistic binary regression was used. Used a Chi2 test (table 2) and binary logistic regression (table 3). Second publication [Secondary non‐behavioural]: For each brand, respondents were asked which pack (regular, limited edition, plain or none) was (1) most effective in getting attention, (2) most attractive, (3) most effective in convincing non‐smokers not to start, (4) most effective in motivating smokers to quit, (5) most effective in motivating smokers to reduce consumption and (6) most effective for motivating youth to purchase the pack. The order that respondents were shown each set of packs was randomised Analysis summary: All analyses were conducted on weighted data. For pack perceptions, Chi2 tests used to examine for differences in the proportion of respondents selecting each pack. Logistic regression models were run to examine differences in perceptions (attention‐grabbing, attractiveness and youth motivation to purchase) of the limited‐edition packs in comparison to regular and standardised packs. For each of the 3 limited‐edition packs, the dependent variables were attention‐grabbing (where 0 = selecting the regular or SP as most attention‐grabbing and 1 = selecting the limited‐edition pack as most attention‐grabbing), attractiveness (0 = selecting the regular or SP as most attractive and 1 = selecting the limited‐edition pack as most attractive) and youth purchase motivation (0 = selecting the regular or SP as most likely to motivate youth to purchase the pack and 1 = selecting the limited‐edition pack as most likely to motivate youth to purchase the pack). Gender, age (18 ‐ 34 vs 35+ years) and smoking status (non‐smoker vs smoker) were entered as predictor variables in each of the models. Logistic regressions were also conducted to examine whether SPs, in comparison to regular and limited‐edition packs, were perceived by smokers as more likely to reduce consumption or motivate quitting. Gender, age, daily cigarette consumption (< 10 cigarettes per day vs 10+ cigarettes per day) and quit intentions (intending to quit vs not intending to quit) were used as predictor variables. A separate logistic regression was also conducted to test whether SPs were perceived by non‐smokers as a means for preventing non‐smokers from starting, this time using age and gender as predictor variables. For each of the 3 SPs (Camel, Lucky Strike and Gauloises), the dependent variable was either reducing consumption (0 = regular/limited‐edition pack, 1 = SP), motivating quitting (0 = regular/limited‐edition pack, 1 = SP) or preventing non‐smokers from starting (0 = regular/limited‐edition pack, 1 = SP) |
|
| Funding source | "Les auteurs remercient l’Institut national du cancer pour le financement de cette recherche effectuée dans le cadre du projet : « Comment mettre en oeuvre les dispositions de la CCLAT pour parvenir à une dénormalisation de la consommation de tabac ? », numéro de projet 07/2D0708/DP‐104‐015/NG‐LCp" |
|
| Conflicts of interest | ||
| Notes | 278 (33.2%) smokers; 558 (66.8%) non‐smokers | |
| Risk of bias | ||
| Bias | Authors' judgement | Support for judgement |
| Selective reporting (reporting bias) | Low risk | Quote: "L’objectif de cet article est de pallier cette lacune et de présenter les résultats d’une étude réalisée en France sur un échantillon représentatif de fumeurs et de non‐fumeurs." Comment: Authors examined what they set out to examine – testing previous findings among a French sample |
| Sampling Method | Low risk | Quote: “Des interviews en face à face ont été réalisées par l’Institut d’études LH2 en novembre 2008 sur un échantillon représentatif de 836 Français fumeurs et non‐fumeurs âgés de 18 ans et plus (méthode des quotas). La représentativité de l’échantillon a été assurée en termes de sexe, d’âge et de catégorie socioprofes‐ sionnelle après stratification par région et catégories d’agglomération. Plus précisément, le territoire natio‐ nal a été découpé en régions UDA1 (région pari‐ sienne, Nord, Est, bassin parisien Est, bassin parisien Ouest, Ouest, Sud‐Ouest, Sud‐Est/Centre‐Est et Médi‐ terranée), et à l’intérieur de chacune d’elles en caté‐ gories d’agglomération (rurale, de 2 000 à 20 000 habitants, de 20 000 à 100 000, plus de 100 000 et l’agglomération parisienne pour les zones concer‐ nées). La France s’est ainsi retrouvée découpée en sous‐strates à l’intérieur desquelles les communes où les interviews ont été réalisées ont été tirées au sort selon un procédé de tirage systématique.” Comment: Probability sample |
| Measurement of independent variable | Low risk | Quote: “Puis l’enquêteur leur remettait un paquet de cigarettes standardisé gris « prototype » de la marque leader en France qu’ils pouvaient visualiser, manipuler et toucher.” Comment: Grey plain pack was used, unlike many on the market now but clearly distinguishable |
| Measurement of dependent variable | Low risk | Comment: A number of measures were used, similar to measures from other studies |
| Control for confounding | Low risk | Quote: “Les réponses ont également été analysées selon le statut tabagique, le sexe, et l’âge des répondants.“ Comment: 1 group only. Differences examined by gender, age, and smoking status |
| Statistical methods | Low risk | Quote: See tables 3 and 5 Comment: Appropriate. Note Indicated P < 0.10 in some cases, but only for testing group differences, not overall differences on key outcomes |
Gallopel‐Morvan 2012.
| Methods |
Country: France Setting: Street interviews Date: March ‐ April 2008 Design: Between‐participants experimental design. Participants were randomly exposed, via showcards, to 1 of 4 pictures of cigarette packs: either a branded Marlboro pack, or a white, grey or brown standardised Marlboro pack |
|
| Participants | 540 people aged 15 ‐ 25 years; adolescent and young adult smokers and non‐smokers. Street intercept interviews (approached and surveyed in the street) were used. Average age: 19.6 years. Males 49.4% (n = 266) females 50.6% (n = 273) | |
| Interventions | IV: Marlboro branded vs 3 different colours of Marlboro standardised Branded = Real brand, Marlboro (note: All packs had the (black and white) text warning ‘Fumer Tue’ (Smoking Kills) covering 30% of the front panel of the pack. Only picture of front of pack shown Standardised (plain) = white, grey or brown plain pack with Marlboro printed in a standardised black font in the centre of the pack |
|
| Outcomes |
[Secondary non‐behavioural]: product appeal (attention‐grabbing, attractive, original, nice, flashy, trendy, motivates purchase), perceptions of the cigarettes inside (good quality, light taste) and the most salient feature of the pack (asked unaided what they first saw on pack – assessing health warning and brand name prominence) Analysis summary: A 5‐point semantic differential scale was used to measure pack perceptions: “attention grabbing”, “attractive”, “original”,“nice”, “flashy”, “trendy” and “motivates purchase”. Perceptions of the cigarettes inside (good quality, light taste) were also assessed, on a 5‐point Likert scale, ranging from strongly disagree = 1 to strongly agree = 5. Health warning and brand name prominence was assessed by asking participants, unaided, what they first saw on the cigarette pack. Pearson’s Chi2 tests were performed to examine brand name and health warning prominence on the different packs. Gender, age and smoking status were used as predictor variables. Logistic regression models were conducted to examine the effect of these variables on the awareness of health warning and brand name. For pack perceptions and purchase intentions assessed on 5‐point Likert scales, Fisher’s tests (ANOVA: analysis of variance) were conducted to test differences between the pack conditions (‘branded vs plain packs’ and then if significant ‘grey vs white vs brown plain packs’). Bonferroni t‐tests were used for multiple pairwise comparisons. The moderating hypothesis was confirmed when this interaction was significant. Variance analyses were thus conducted, the independent variables being the packs (‘branded vs plain packs’ and ‘grey vs white vs brown plain packs’) and the presumed moderator (gender, age and smoking status) |
|
| Funding source | This work was supported by a grant from the French National Committee for Tobacco Control (CNCT) | |
| Conflicts of interest | "None" | |
| Notes | Daily/regular smokers: 38.0% (n = 205); Occasional smokers: 11.8% (n = 64); combined smokers, daily/occasional: 49.8% (n = 269). Non‐smokers 50.2% (n = 271) | |
| Risk of bias | ||
| Bias | Authors' judgement | Support for judgement |
| Selective reporting (reporting bias) | Low risk | Comment: outcomes reported were in line with aims and as expected |
| Sampling Method | High risk | Comment: convenience sample through street interviews |
| Measurement of independent variable | Low risk | Comment: packs were clearly distinguishable |
| Measurement of dependent variable | Low risk | Comment: provenance of questions unclear but reasonable face validity |
| Control for confounding | Unclear risk | Comment: few potential confounders were controlled for |
| Incomplete outcome data (attrition bias) All outcomes | High risk | Quote: "Using a street‐intercept approach, a total of 540 people aged 15 to 25 years were interviewed." Comment: not enough details given, but likely to be a low response rate in street interviews |
| Statistical methods | Low risk | Comment: Appropriate |
Gallopel‐Morvan 2015a.
| Methods | Country: France Setting: 5 cities Date: April 2013 Design: Repeated measures (within‐participants) experimental 10‐day study |
|
| Participants | 133 young adult roll‐your‐own (RYO) smokers aged 18 – 25 years intercepted by market research recruiters in city centres. Average age 21.8 years. 62 male (46.6%) Market recruiters from LH2 (a leading research marketing firm) were instructed to intercept people in the street in 5 citiies in France (Paris, Marseille, Metz, Nantes, Toulouse) and inform them that the study was concerned with smokers’ opinions of tobacco and packaging. For those willing to participate and available for the duration of the 10‐day study, a recruitment questionnaire was used to determine eligibility (NOTE: 18 ‐ 25‐year‐old RYO smokers *need to buy enough RYO tobacco to last for the 10 days of the study). The recruiters also needed to visit their home within the next week or so, on a day and at a time suitable for them, in order to transfer the rolling tobacco they had purchased into different packs) |
|
| Interventions | Participants used their own RYO tobacco transferred to standardised packs for 10 days Branded = own brand Standardised (plain) = same dark brown‐green colour as those used in Australia (Pantone 448C), with the brand name in the same typeface (Lucida Sans) and font size and colour (Pantone Cool Gray 2C). 75% pictorial HW on both sides |
|
| Outcomes | [Secondary non=behavioural]: Baseline (branded RYO packs) and follow‐up (standardised RYO packs) questionnaires assessing measures: 1. Packaging appeal: · Brand attachment: 5 items were aggregated in 1 component and mean used · Brand attitude (liking brand) · Pack perceptions (desirability, attractiveness, style, fashion and coolness) · Pack attitude (liking pack) 2. Taste (good, natural, light) 3. Pack quality· ‐ Quality · Feelings when smoking (satisfaction, pleasure) · Feelings when smoking in the presence of others (embarrassment, image) 4. Purchase and smoking behaviour 5. 2 items were used to measure the credibility of warnings, and whether they made participants more aware of tobacco dangers 6. Feel like quitting Analysis summary: t‐tests for paired samples compared mean scores for participants’ own packs and standardised packs |
|
| Funding source | "The study was funded by the French Health Ministry. Crawford Moodie is funded by Cancer Research UK" | |
| Conflicts of interest | "None" | |
| Notes | ||
| Risk of bias | ||
| Bias | Authors' judgement | Support for judgement |
| Selective reporting (reporting bias) | Low risk | Quote: "To address these gaps in the literature, a naturalistic approach was employed where young adult RYO smokers used plain packs for 10 days. They were given plain packs featuring the name of the brand they smoke most often, allowing us to assess level of brand attachment and whether this was impacted by plain packaging. We also explored pack and product percep‐ tions, feelings about smoking, feelings when using the pack in front of others, response to the health warnings and cessation‐ related behaviour. " Comment: in line with aims and as expected. Repeats methods of previous studies |
| Sampling Method | High risk | Quote: "In April 2013, young adult RYO smokers aged 18–25 years were recruited from five cities in France (Paris, Marseille, Metz, Nantes, Toulouse) by LH2, a leading market research company
in France (http://www.lh2.fr). LH2 were fully briefed on study protocol but were not informed about the purpose of the study." Comment: market research company and street intercept interviews, so a convenience sample |
| Measurement of independent variable | Low risk | Quote: “The RYO plain packs were the same dark brown‐green colour as those used in Australia (Pantone 448C), with the brand name in the same typeface (Lucida Sans) and font size and colour (Pantone Cool Gray 2C). Pictorial health warnings featured on 75% of both sides of packs, consistent with the warning size proposed in the draft Tobacco Products Directive (TPD) in 2012.15 “ Comment: pack images were clearly distinguishable; standardised packs are similar to those on the market today |
| Measurement of dependent variable | Low risk | Quote: "To measure brand attachment, a five‐item scale (table 1) that has been validated in France and tested on a range of brands was used.17" Comment: quote given is one measure which had been previously validated. The provenance of other measures was not discussed but they were similar to measures used elsewhere and had good face validity |
| Control for confounding | High risk | Quote: "As smokers were exposed to plain packaging with large health warnings, we are unable to disentangle the individual impact of the warnings and of removing the branding, and how each of these may have influenced responses" Comment: The impact of standardised packaging could not be isolated |
| Incomplete outcome data (attrition bias) All outcomes | Unclear risk | Comment: no response rate given |
| Statistical methods | Low risk | Comment: Appropriate |
Gallopel‐Morvan 2015b.
| Methods |
Country: France Setting: In‐home survey (BL), in 5 cities in France (Paris, Marseille, Metz, Nantes, Toulouse) and online survey follow‐up after 10‐day study was over (smoking from standardised pack) Date: March 2013 Design: Pre‐post test |
|
| Participants | 142 adult women (aged 25 ‐ 40) regular (daily/weekly) and occasional smokers. Opportunistic recruiting (intercept study – approached in street in cities listed above). However, no locations for street intercept given, ‘dans la rue.’ A meeting took place in their home for the interview and participants were provided with study materials (to transfer their own cigarettes into a plain pack to smoke for the next 10 days) and baseline survey based on their own branded pack of cigarettes. All study instructions were given at this primary meeting. Participants filled out an online survey after the 10‐day study was over (smoking from plain pack) Average age 32.9 years |
|
| Interventions | IV: Branded (BL) vs standardised pack usage for 10 days Branded = Participants used their own branded pack ((e.g. Vogue, Camel, Marlboro, Winston), would have had 2013 EU warning, 30% text front and 40% picture back Standardised (plain) = “Identical” to Australian packs [Drab brown with text in grey]. HWs were 75% of the front and back of the surface Note Australian: dark brown‐green colour (Pantone 448C), with the brand name in the same typeface (Lucida Sans) and font size and colour (Pantone Cool Gray 2C). 75% pictorial HW on both sides |
|
| Outcomes |
[Secondary non‐behavioural]: 1. perceptions and attitudes towards packages cigarettes and the tobacco brand; 2. perception of cigarettes contained in the packages and health messages; 3. feelings against smoking and smoking of others; 4. behavioural intentions (want to stop smoking, reduce number smoked, etc.). Responses were measures on a 5‐point Likert scale: 1 = strongly disagree 2 = slightly disagree 3 = no opinion 4 = slightly agree 5 = strongly agree OR responses could be by the Osgood scale : Score: 1 (not attractive) to 5 (very attractive) Analysis summary: Respondents filled out a baseline (pre‐test) survey based on their own branded pack of cigarettes (interview at home, before the use of packages neutral) and neutral packets after the initial interview for 10 days (online survey): Pre‐test = face‐to‐face interview; Post‐test = online survey. Naturalistic study, own packs vs plain packs with own brand name; In order to compare the outcomes (averaged) 'classic' vs the neutral packages, a paired T‐test was used |
|
| Funding source | ||
| Conflicts of interest | ||
| Notes | ||
| Risk of bias | ||
| Bias | Authors' judgement | Support for judgement |
| Selective reporting (reporting bias) | Low risk | Quote: “L’objectif de notre recherche est de compléter ces travaux sur l’impact des paquets neutres sur les femmes et, pour la première fois sur cette population en France, dans une situation réelle de consommation.” Comment: Repeated study conducted in another country, similar outcomes reported |
| Sampling Method | High risk | Quote: "En mars 2013, des femmes fumeuses quotidiennes et occasionnelles âgées de 25 à 40 ans ont été recrutées par une société d’étude de marché dans cinq villes françaises (Paris, Marseille, Metz, Nantes, Toulouse). Les recruteurs abordaient des femmes dans la rue et leur proposaient de participer à une étude sur le tabagisme." Comment: non‐probability sample convenience |
| Measurement of independent variable | Low risk | Quote: “Les paquets neutres utilisés étaient identiques aux paquets australiens (couleur Pantone 448C, nom de la marque écrit en Lucida Sans et de couleur Pantone Cool Gray 2C). Deux avertissements visuels déjà existants en France couvraient 75% de la face avant et arrière des paquets neutres, conformément au projet de Directive européenne des produits du tabac de l’époque ‐2013‐ (figure 2).” Comment: Standardised packs used similar to those now on the market. Cigarettes transferred into plain packs with respondents’ brand name. Knowing they were their own cigarettes would have diminshed any differences between the standardised and branded packs |
| Measurement of dependent variable | High risk | Quote: “Les questions suivantes étaient posées aux répon‐ dantes sur leur paquet de cigarettes « classique » (interview à domicile, avant l’utilisation des paquets neutres) et sur les paquets neutres après les avoir utilisés pendant 10 jours (questions posées par Internet, envoi d’un courriel aux répondantes) : perception et attitudes à l’égard des paquets de cigarettes et de la marque de tabac ;
perception des cigarettes contenues dans les paquets et des messages sanitaires ;
sentiments par rapport au fait de fumer et de fumer devant les autres ;
intentions de comportement (envie d’arrêter, de réduire, etc.). ” Comment: Similar to previous studies. However, measured using different mode at pre‐post, (face‐to‐face then internet) |
| Control for confounding | Unclear risk | Quote: “Afin de comparer les moyennes obtenues sur les paquets « classiques » vs. les paquets neutres, un test T pour échantillons appariés a été utilisé. “
Comment: no controls for confounding, however within subjects design. |
| Incomplete outcome data (attrition bias) All outcomes | Unclear risk | Quote: Parmi les 198 répondantes recrutées, 142 ont rempli totalement et correctement le questionnaire final (sur Internet) et déclaré avoir seulement utilisé les paquets neutres pendant 10 jours.
Comment: 72% completed follow‐up. |
| Statistical methods | Unclear risk | Quote: “Afin de comparer les moyennes obtenues sur les paquets « classiques » vs. les paquets neutres, un test T pour échantillons appariés a été utilisé.”
Comment: T‐tests only used, natural experiment in real world |
Germain 2010.
| Methods | Country: Australia Setting: online survey Date: Not stated Design: between‐participants experiment with 5 (degree of standardised packaging and graphic health warning) x3 (brand types) design, using a web‐based methodology to expose adolescents to 1 (out of 15) randomly selected cigarette pack, during which respondents completed ratings of the pack |
|
| Participants | 1087 14‐ to 17‐year‐olds ‐ smokers and non‐smokers Panel members were originally sourced from various methods including computer‐assisted telephone interviews and face‐to‐ face and online market research databases. Panel members were contacted by e‐mail and asked whether they were willing to allow their child to complete an online survey about cigarette packaging being conducted by The Cancer Council Victoria. Average age 15.4 years. 537 male (49.4%). Smokers: Established smoker: 193 (17.8%); Experimenter: 238 (21.9%) Experimenters + Established Smokers n = 430, 39.6%) Nonsusceptible non‐smoker + Susceptible non‐smoker = 656 Nonsusceptible non‐smoker: 45.4%; Susceptible non‐smoker 15.0% (combined 60.4%) |
|
| Interventions | IV: branding and graphic health warnings and brand types Branded = Branded Pack: used the 3 most popular Australian brands (Winfield; Peter Jackson; Longbeach). Pack variants (Winfield ‘‘Blue’’; Peter Jackson ‘‘Rich’’; Longbeach ‘‘Rich’’) were those that were most popular among adult smokers. All the conditions mentioned had the same graphic health warning visible on the top (i.e. 30% of the pack face) as required by Australian Government legislation Standardised (plain) = Standardised pack 1: a plain cardboard brown pack that maintained the brand name font (i.e. original font size, style and position) and positioning of brand and descriptor; Standardised pack 2: a plain cardboard brown pack, with brand name in standard font in a prominent position on the pack and descriptor information in standard font at the bottom; Standardised pack 3: a plain cardboard brown pack, with brand name in smaller standard font positioned at the bottom, and ‘‘(xx number) cigarettes’’ in larger font in a prominent position on the pack; Standardised pack 4, added a large graphic health warning (covering 80% of the front of the pack) to the plainest pack tested (standardised pack 3). Packages were cardboard brown. All the other standardised packs had 30% warnings |
|
| Outcomes |
[Secondary non‐behavioural]: looking at the same pack throughout 1) rate attributes of the displayed pack including: ‘‘This pack looks as if it would be: ‘‘popular among smokers’’; ‘‘attractive’’; ‘‘good value for money’’; ‘‘an exclusive/expensive brand’’; and ‘‘a brand you might try/smoke.’’ 2) number of attributes of typical smokers of the pictured cigarette pack, including: ‘‘A typical smoker of this pack is.’’: ‘‘trendy/stylish’’; ‘‘young’’; ‘‘masculine’’; ‘‘lower class’’; ‘‘sociable/outgoing’’; and ‘‘confident/successful’’. 3) respondents were asked to think about how a cigarette from the pictured pack might taste; and to 4) rate a number of descriptions on how well they relate to the pack shown, including: ‘‘I think these cigarettes might.’’: ‘‘be rich in tobacco flavour’’; ‘‘be low in tar and nicotine’’; ‘‘taste of cheap tobacco’’; ‘‘be satisfying’’; ‘‘be like a light cigarette’’; ‘‘be of the highest quality tobacco’’; and ‘‘be harsh on the throat.’’ Within each of the questions, attributes were presented randomly to avoid order effects. 5) after the pack was removed from view, respondents were asked ‘‘Thinking back to the pack you just saw, please write down the health warning that appeared at the top of the pack.’’ Analysis summary: email link to online survey. A principal components analysis using oblique rotation was performed to examine which components within each outcome measure category (i.e. pack characteristics, smoker characteristics, sensory perceptions) loaded together. (1) positive pack characteristics—‘‘ popular among smokers’’; ‘‘attractive pack’’; ‘‘good value for money’’; ‘‘exclusive/expensive’’; ‘‘a brand you might try/smoke’’; (2) positive smoker characteristics—‘‘ trendy’’; ‘‘young’’; ‘‘masculine’’; ‘‘sociable’’; ‘‘confident’’; (3) negative taste—‘‘cheap’’; ‘‘harsh’’; (4) light taste – ‘‘low tar’’; ‘‘light’; (5) positive taste—‘‘rich’’; ‘‘satisfying’’; ‘‘high quality’. Analysis of variance tests were conducted to explore mean differences in ratings of plain packs 1, 2, and 3 as compared with original branded packs. Analyses of variance were also conducted to compare plain pack 3 with plain pack 4, to examine the effect on pack ratings of adding a large graphic health warning to 80% of the front of the pack. The interaction between smoking experience and pack conditions on pack ratings was analysed. Finally, Chi2 analyses were conducted to examine respondents’ recall of the graphic health warning by pack condition. Wherever multiple pairwise comparisons were conducted, Bonferroni adjustments were made |
|
| Funding source | "This study was funded by Quit Victoria and the Cancer Council Victoria." | |
| Conflicts of interest | "There are no conflicts of interest for any author." | |
| Notes | ||
| Risk of bias | ||
| Bias | Authors' judgement | Support for judgement |
| Selective reporting (reporting bias) | Low risk | Comment: appeared to reflect the aims of the study |
| Sampling Method | High risk | Quote: "Members of an existing national online panel who were identified as having children between the ages of 14 and 17 years comprised the sampling frame for the study. Panel members were originally sourced from various methods including computer‐assisted telephone interviews and faceto‐
face and online market research databases. Panel members were contacted by e‐mail and asked whether they were willing to allow their child to complete an online survey about cigarette packaging being conducted by The Cancer Council Victoria.'...sourcing respondents through their parents may have elicited desirable responses from adolescents. Adolescents may have sought their parents’ or others’ input into their responses and it was not possible to control the degree of supervision of
responses. However, the randomized design should mean that this kind of interference in responses was equally distributed across conditions" Comment: Unlikely to be a representative sample of adolescents. No details given about the original panel |
| Measurement of independent variable | Low risk | Comment: packs were clearly distinguishable |
| Measurement of dependent variable | Low risk | Quote: "Stage of smoking uptake was determined by responses to these questions [3]." Comment: provenance of some measures was clear but not all measures, although they appeared to have good face validity |
| Control for confounding | Low risk | Quote: "Analysis of variance and chi‐square tests were performed to check that random assignment yielded equivalent groups'...'Table 1 shows that neither respondents’ demographic characteristics nor smoking experience varied significantly across the different pack conditions" Comment: Groups appeared comparable across the different conditions |
| Incomplete outcome data (attrition bias) All outcomes | High risk | Quote: "Overall, 1087 adolescents completed the survey, yielding a response rate of 15% of all the e‐mail invitations sent." Comment: low response rate and details of how comparable the sample was to the population in general were not given |
| Statistical methods | Low risk | Comment: Appropriate |
Goldberg 1999.
| Methods | Country: Canada Setting: A shopping mall in Vancouver BC Date: details not given Design: Between‐participants experiment with 3 (different health warnings) x2 (branded or white standardised) |
|
| Participants | 401 teenagers, aged 14 to 17 years, who indicated that they smoked cigarettes or were open to trying cigarettes within the next year Intercept study in shopping malls with a computer screen. Participants were randomly assigned to be exposed to 1 of 3 health warnings drawn from the 8 existing mandated ones. Half of the members of each group were assigned to see the warning on a regular (branded pack), and the other half on a white standardised package |
|
| Interventions | IV: standardised vs branded packaging on health warning response. The cigarette pack was shown on a table Branded = pack (no details given) with warning label Standardised (plain) = white pack with warning label Health warnings: Participants were randomly assigned to be exposed to 1 of 3 health warnings drawn from the 8 existing mandated ones: "Smoking can kill you," "Cigarettes are addictive," and "Tobacco smoke causes fatal lung disease in nonsmokers." Black and white text warnings in place at the time in Canada, 25% excluding borders |
|
| Outcomes |
[Secondary non‐behavioural]: recall of health warning Analysis summary: Chi2 tests were run between the 3 health warning messages |
|
| Funding source | “This project was funded by Health Canada.” | |
| Conflicts of interest | No details in paper | |
| Notes | ||
| Risk of bias | ||
| Bias | Authors' judgement | Support for judgement |
| Selective reporting (reporting bias) | Low risk | |
| Sampling Method | High risk | Quote: "The study was conducted in a Vancouver, British Columbia, mall with 401 teenagers,
aged 14 to 17 years, who indicated that they smoked cigarettes or were open to trying cigarettes
within the next year" Comment: very few details given; convenience sample |
| Measurement of independent variable | Low risk | Comment: also the packs used were not presented in the paper, from the description it appeared they would be distinguishable |
| Measurement of dependent variable | Low risk | Quote: "Following exposure, subjects were asked to recall the warning on the cigarette package." Comment: simple recall question |
| Control for confounding | Unclear risk | Comment: No details given of difference between groups |
| Incomplete outcome data (attrition bias) All outcomes | Unclear risk | Comment: no details given on response rate, etc |
| Statistical methods | Unclear risk | Comment: very few details available |
Guillaumier 2014.
| Methods | Country: Australia Setting: large Social and Community Welfare Organisation in Western Sydney, New South Wales Date: March ‐ December 2012 Design: Between‐participants 2×2 factorial design trial embedded within a cross‐sectional computer touchscreen survey |
|
| Participants | 354 socially disadvantaged welfare aid adult recipients (aged 18+) who were current smokers were recruited. The sample was drawn from a service outlet of a large, national non‐government, social and community service organisation (SCSO). The service provides ‘emergency relief’ welfare such as food vouchers, grocery items and financial aid to individuals experiencing various forms of social and financial hardship across a large catchment area of Western Sydney. The client profile of SCSOs includes an over‐representation of disadvantaged groups including Aboriginal and Torres Strait Islanders, single parents, long‐term unemployed and those whose primary income is a government benefit. Participants were introduced to the study when they attended the SCSO for their emergency relief appointment. Staff explained that there was a study about smoking. If interested, they were led to a private room where a research assistant provided more detailed info and assistance to complete the survey if needed. Participation was assumed to be consent. Participants received a AUD 20 gift voucher for participating 138 men (39%) Average age not available |
|
| Interventions | IV: The 4 pack conditions were: (1) branded Winfield Blue 25; (2) standardised Winfield Blue 25; (3) branded B&H Smooth 25 and (4) Standardised B&H Smooth 25. Within each pack condition, respondents were presented with a standard set of items to rate their assigned pack. Plain pack digital images were created using specifications outlined in the Australian Government’s Tobacco Plain Packaging Act 2011, while images of branded packs were supplied by the Centre for Behavioural Research in Cancer, Victoria, Australia Branded = Branded pack conditions replicated cigarette packs available for purchase at the time of survey. 2 of the most popular brand variants in the Australian mainstream: branded Winfield blue and branded premium Benson and Hedges Smooth 25 Standardised (plain) = Australian: dark brown‐green colour (Pantone 448C), with the brand name in the same typeface (Lucida Sans) and font size and colour (Pantone Cool Gray 2C) All pack conditions featured the same graphic image and text HW: ‘smoking causes peripheral vascular disease’ that first appeared on Australian cigarette packs in 2006. These were pre‐ and post‐real packages in Australia – so 30% front‐of‐pack warnings increased to 75% of the pack face, and 90% back‐of‐pack warnings remained |
|
| Outcomes |
[Secondary non‐behavioural]: Participants were asked to rate their assigned pack on measures of brand appeal and purchase intentions. Brand appeal: rated packs on brand appeal scales (1 ‐ 7) Purchase Intentions: Participants were presented with images of the 2 brand name options (Winfield and B&H) on a single screen and asked: “If you ran out of cigarettes and only the packs below were available in the store you went to, which would you be most tempted to buy?” Participants could choose between the 2 brand name images or select "I would not buy any". Analysis summary: Participants were randomly allocated to 1 of the 4 cigarette pack conditions by Digivey’s randomise function, which uses a pseudo‐random number generator provided by the underlying programming language. Participants who had previously viewed and rated a standardised packaging image, received standardised image response options, and those who had previously rated a branded packaging image (i.e. pack A or C) received branded image response options at this question; Pairwise comparisons using the Wilcoxon rank sum test were undertaken to compare median scores between branded packaging and standardised packaging for each of the 2 brand names. OR analyses were used to assess the effect of packaging type (branded vs standardised) on purchase intention |
|
| Funding source | “This study was part of a project funded by a grant from the Hunter Medical Research Institute (G1101150).” | |
| Conflicts of interest | “AG was supported by an Australian Postgraduate Award PhD scholarship administered through the University of Newcastle. BB was supported by a Cancer Institute NSW Career Development Fellowship. CP was supported by Cancer Control Collaboration funding.” | |
| Notes | ||
| Risk of bias | ||
| Bias | Authors' judgement | Support for judgement |
| Selective reporting (reporting bias) | Low risk | Comment: in line with objectives |
| Sampling Method | Unclear risk | Quote: "The primary limitation of the study is its reliance on a convenience sample limiting its external validity and generalisability. However, socially disadvantaged groups are notoriously difficult to recruit and retain in health research.(33 34) Recruitment challenges were overcome by accessing community services as recruitment sites and using convenience samples." Comment: A convenience sample but as the authors state it is very difficult to access a random sample of socially disadvantaged groups |
| Measurement of independent variable | Low risk | Comment: packs shown were easily distinguishable |
| Measurement of dependent variable | Low risk | Quote: "The outcome measures used in this study pose an additional limitation. Although they were selected for the purpose of comparing results with previous plain pack research,(19 20) they have not been evaluated for validity or reliability and this should be assessed in the future." Comment: The measures used had good face vaildity although the authors have commented on the need for further research in this area, they were comparable with measures used in ohter studies |
| Control for confounding | Low risk | Quote: "Sociodemographic characteristics were similar across the four intervention groups" Comment: Groups appeared similar |
| Incomplete outcome data (attrition bias) All outcomes | Low risk | Quote: "A total of 787 clients were approached by SCSO staff during the study period and 608 were eligible to be approached to participate by the RA. Of those, 581 (96%) completed the survey and 362 (62%) of them were identified as current smokers (daily and occasional). Eight smokers were excluded as they primarily used something other than manufactured or roll‐your‐own tobacco." Comment: High response rate and few exclusions |
| Statistical methods | Low risk | Comment: Appropriate |
Hammond 2009.
| Methods | Country: UK Setting: Online Date: June 2008 ‐ Aug 2008 Design: Within‐participants online experiment. Participants were asked to compare pairs of cigarette packs on 5 measures: taste, tar delivery, health risk, attractiveness and either ease of quitting (adult smokers) or brand they would choose if trying smoking (youth) |
|
| Participants | Respondents were recruited from a proprietary consumer panel managed by the UK survey firm, ‘YouGov’, which consisted of over 185,000 individuals. Current adult smokers, and youth sample with no specific smoking status, required for eligibility (Adults: aged 18+, smokers Youth: < aged 11 ‐ 17.) Adults who reported at least 1 cigarette in the past month were eligible. No criteria for youth (< 18 years) 516 adult smokers and 806 youth aged 11 – 17; n = 1322 total Adults: 38.5 years (13.6) Youth: 14.6 years (2.0) |
|
| Interventions | IV: branded versus standardised pack pair comparisons Branded = Cigarette packs used in this study featured leading UK Brands (Marlboro, Mayfair, Lambert & Butler and Richmond). Brands were purposefully selected to examine common brand descriptors and colour variations Standardised (plain) = 2 standardised pack comparisons: (1) standardised versus branded packs and (2) standardised with descriptor versus plain without descriptor. 2 of the brand pairs (‘L&B Gold’ vs. ‘L&B King Size’ and ‘Mayfair Smooth’ vs. ‘Mayfair King Size’) were modified to examine the impact of standardised packaging. Standardised versions of these packs were created by substituting all brand imagery and colour for a plain ‘white’ background or a plain ‘brown’ background. The name of each brand was printed in Arial 14 point font. All of the packs shown to participants displayed the same pictorial health warning covering 30% of the ‘front’ of the pack in anticipation of the pictorial warnings that were introduced in the UK in October 2008, 4 months after the study was conducted |
|
| Outcomes |
[Secondary non‐behavioural]: smoothest taste, which would you buy if you were trying to reduce the risk to your health, which is the most attractive, which brand would make it easier to quit smoking (adults)/if you were to try smoking one of these brand which would you use (youth) Analysis summary: Randomly assigned to a group which included branded + standardised packs (type of plain: white or brown). For each of the 5 questions (tar level, health risk, etc.), a ‘Difference Scale’ was calculated to examine how often respondents selected either of the packs, as opposed to selecting ‘no difference’. A score of ‘1’ was assigned each time respondents selected either of the 2 packs. Scores were summed across the 8 brand pairs for a total score between 0 and 8. A ‘Light/Low Tar Brand’ Scale was calculated in the same way to examine how often respondents selected brands designated as ‘light/low tar'. Each of these scales served as the outcome variable in linear regression models described below. Chi2 tests were used to test which pack was more likely to be selected within each brand pair. 2 summary scales were also created. |
|
| Funding source | This research was funded by grants from the British Heart Foundation and Cancer Research UK | |
| Conflicts of interest | “None declared” | |
| Notes | Adults: 100% smokers Youth: 27.4% smokers | |
| Risk of bias | ||
| Bias | Authors' judgement | Support for judgement |
| Selective reporting (reporting bias) | Low risk | Comment: outcomes as expected |
| Sampling Method | High risk | Quote: "Respondents were recruited from a proprietary consumer panel managed by the UK survey firm, ‘YouGov’, which consisted of over 185 000 individuals. Adults who reported at least one cigarette in the past month were eligible. Panel members with youth <18 years of age were asked by email if they were willing to allow their youth to participate" Comment: Large market research panel, but method of sampling youth is likely to introduce bias |
| Measurement of independent variable | Low risk | Comment: images were clearly distinguishable |
| Measurement of dependent variable | Low risk | Quote: "An initial set of questions were asked about smoking status, intention to quit smoking, cigarettes per day and susceptibility to smoking among youth using validated measures" Comment: initial measures were validated. Provenance of other measures unclear but had good face validity |
| Control for confounding | High risk | Comment: Potential confounders were not controlled for |
| Incomplete outcome data (attrition bias) All outcomes | Unclear risk | Comment: Not enough detail given to assess |
| Statistical methods | Low risk | Comment: Appropriate |
Hammond 2011.
| Methods | Country: USA Setting: Online Date: February 2010 Design: Between‐participants experiment (random assignment to 1 of 4 experimental conditions) |
|
| Participants | National sample of 826 18‐ to 19‐year‐old females including both smokers and non‐smokers. Participants were recruited from a consumer panel through Global Market Insite, Inc. (GMI), with a panel reach of more than 2.8 million individuals in the USA. Participants were randomised to view 8 cigarette packs designed according to 1 of 4 experimental conditions: fully‐branded female packs, same packs without descriptors (e.g. “ slims ” ), same packs without brand imagery or descriptors (“ plain ” packs) , and branded non‐female brands. Participants rated packs on measures of appeal and health risk and completed a behavioural pack selection task Average age 18.5 years. 100% female. Current smokers (daily, weekly, monthly) = 323; Daily smoker: 24.3% (n = 199) Weekly smoker: 9.8% (80) Monthly smoker: 5.4% (44); 39.1% current smokers 503 non‐smokers 60.9% |
|
| Interventions | IV: 3 branded (1 without descriptors) vs 1 standardised Branded = The 8 “female‐oriented” brands were selected based on market share or popularity among smokers, as well as previous research. 6 of the 8 brands are sold in the USA; the Vogue and Silk Cut brands are sold in the UK. These brands featured the descriptors superslims, slims, lights, menthol, blue, rose, cherry, and smooth, as well as “traditional” female colour schemes, such as pink, white, and other pastels. The brand descriptors and brand imagery of each female‐oriented package was modified according to the experimental condition. Condition 1 packs featured all brand imagery and descriptors (female standard condition). Condition 2 packs featured brand imagery but no descriptors (female no descriptors condition). Condition 4 included non–female‐oriented “male” packages as a control condition. These brands were also chosen based on market share and included popular “full‐flavour” or “regular” varieties of American cigarette brands that lacked overtly female design elements. Standardised (plain) = Condition 3 (female standardised condition), packs were shown without either brand imagery or descriptors, a light brown/beige cardboard look |
|
| Outcomes |
[Secondary non‐behavioural]: Pack ratings: 1) Brand Appeal (“How appealing is this brand of cigarettes compared to other brands on the market?”); 2) Brand Taste ("How do you think these cigarettes would taste compared to other brands?”); 3)Tar Delivery (“How much tar do you think these cigarettes would have compared to other brands?”); and 4) Health Risks (“Compared to other cigarette brands on the market, would these cigarettes be . . . less/more harmful?"). Responses were provided on a 5‐point Likert scale (e.g. 1 = a lot more appealing, 2 = a little more appealing, 3 = no difference, 4 = a little less appealing, and 5 = a lot less appealing ). Ratings were subsequently coded as either a 1 (a little /a lot more appealing) or 0 (a little/a lot less appealing and no difference). All analyses run with binary variable, as well as with the “original ” 5‐point Likert ratings. Authors present data for the binary measure of appeal, taste, tar, and health risk but note pattern of results was the same regardless of whether the binary outcome or the original 5‐point rating was used. An overall index rating was created for each of the 5 ratings, by summing scores across the 8 packages to yield a score between 0 and 8, where the number corresponds to the total number of packs rated as more appealing/better taste/lower tar/less harmful. Smoker Image Ratings: For each cigarette package, respondents were asked to identify the typical smoker of each pack by answering the question, “ In your opinion, someone who chooses to smoke this brand is more likely to be . . . ” for 7 characteristics: female/male, glamorous/not glamorous, cool/not cool, popular/not popular, attractive/unattractive, slim/overweight, and sophisticated/not sophisticated. For each set of traits, respondents could choose either trait or no difference . The female/male question was recoded so female was scored a “ 1 ” and male , no difference , and don’t know were scored a “0”. For the remaining traits, the more desirable trait (e.g. glamorous) was scored a “1”, and the less desirable trait (e.g. not glamorous), no difference, and don’t know were scored a “0”. Behavioural Task — Pack Selection: Respondents were asked which, if any, packs they would like to be sent upon conclusion of the study. Respondents could select 1 of the 4 cigarette packs displayed on the screen. Images presented in random order and included : (1) a fully‐branded female pack , (2) a plain female pack , (3) a fully‐branded non‐female pack, and (4) a plain non‐female pack. Each of the packs was drawn at random from the packs used in each experimental condition. Participants could also select an “ I do not want a pack of cigarettes ” option, which was prominently displayed on the screen. Note that participants were informed after making their selection that no packs would actually be mailed and the study did not promote or endorse smoking in any way. Analysis summary: Regression models were used to examine the effect of experimental condition for 3 primary outcomes: pack ratings, smoker image ratings, and beliefs about smoking. For each outcome, regression models were conducted in 2 steps. In Step 1, the model included only the “condition” variable. In Step 2 of the model, the following variables were entered as covariates: age, education, income, ethnicity, smoking status, and weight concerns. In Step 3, all 2‐way interactions with the “condition” variable were tested by entering each interaction term into the model 1 at a time. |
|
| Funding source | "This work was funded by the Roswell Park Transdisciplinary Tobacco Use Research Center ( P50 CA111236 ) with support from the Propel Centre for Population Health Impact and a Canadian Institutes of Health Research New Investigator Award" . | |
| Conflicts of interest | "None declared" | |
| Notes | ||
| Risk of bias | ||
| Bias | Authors' judgement | Support for judgement |
| Selective reporting (reporting bias) | Low risk | Comment: outcomes reported in line with aims and expectations |
| Sampling Method | Low risk | Quote: "Participants were recruited from a consumer panel through Global Market Insite, Inc. (GMI), with a panel reach of more than 2.8 million individuals in the United States. Additional information on the GMI panel is available online ( http :// www . gmi ‐ mr . com ). Participants in the GMI panel were
invited to participate in the “ cigarette packaging ” survey by email." Comment: Large consumer panel with detailed information about its representation |
| Measurement of independent variable | Low risk | Comment: images were clearly distinguishable |
| Measurement of dependent variable | Low risk | Quote: "These measures were modified from previous research as well as tobacco industry market research (Germain et al., 2009)." Comment: this quote gives an example of how some measures had been used elsewhere. The provenance of all measures is not stated but they had good face validity |
| Control for confounding | Low risk | Quote: "In Step 2 of the model, the following variables were entered as covariates: age, education,
income, ethnicity, smoking status, and weight concerns." Comment: some possible confounders were controlled for. Only education differed across the groups (Table 1) |
| Incomplete outcome data (attrition bias) All outcomes | Unclear risk | Comment: No response rate given or nos of incompletes etc |
| Statistical methods | Low risk | Comment: Appropriate |
Hammond 2013.
| Methods | Country: UK Setting: online Date: May 2010 Design: A between‐participants experiment was conducted in which participants were randomised to 1 of 4 experimental conditions (branded female packs, the same packs without descriptor words, the same packs without brand imagery or descriptors (“standardised” packs), and branded non‐female brands). Within each condition, participants viewed 10 cigarette packages presented 1 at a time in random order |
|
| Participants | A national sample of smoking and non‐smoking 947 16‐ to 19‐year‐old female participants in the UK completed an online survey. Participants were recruited from a consumer panel with a reach of more than 300,000 individuals through Global Market Insite, Inc. (email invitations were sent to parents or guardians, who then gave consent for their child to complete the survey) Average age 17.8 years |
|
| Interventions | IV: 4 conditions Branded = Female‐oriented packaging was modified according to the experimental condition: 1) branded female‐oriented packs 2) female‐oriented branded packs, no descriptors (e.g. “slims”) 3) standardised: female‐oriented packs, no branding or descriptors, cardboard‐coloured 4) control: popular UK brands but non–female‐oriented packs Standardised = condition 3) The 10 “female‐oriented” brands were selected based on previous research. Brands were purposefully selected to examine the descriptors superslims, menthol, frost, silver, pink, purple, blue, cherry, vanilla, and arome, as well as “traditional” female colour schemes, such as pink and white All had black and white text warning (UK 30%) |
|
| Outcomes |
[Secondary non‐behavioural]: Participants were asked to rate each package on 4 measures: (1) brand appeal (“How appealing is this brand of cigarettes compared to other brands on the market?”); (2) brand taste (“How do you think these cigarettes would taste, compared to other brands?”); (3) tar delivery (“How much tar do you think these cigarettes would have compared to other brands?”); and (4) health risks (“Compared to other cigarette brands on the market, would these cigarettes be . . . less/more harmful?”). Responses were provided on a 5‐point Likert scale (e.g. 1 “A lot more appealing” to 5 “A lot less appealing”) and subsequently coded as either a 1 (“a little”/“a lot more appealing”) or 0 (“a little”/“a lot less appealing” and “no difference”). An overall index rating was created for each of the 4 measures, by summing scores across the 10 packages to yield a score between 0 and 10. Smoker image ratings: respondents asked to identify the typical smoker of each pack for 7 characteristics: female/male, glamorous/not glamorous, cool/not cool, popular/not popular, attractive/unattractive, slim/overweight, sophisticated/not sophisticated. An index variable was created for each of the 7 characteristics by summing the number of desirable traits endorsed by smokers across the 10 brands (1 for each desirable characteristic, female considered desirable, range: 0 – 10). An overall “smoker image” variable was created by calculating the average across each of the 7 characteristics. At the end of the experiment, participants were asked which pack they would like out of either 4 fully‐branded packs vs 4 plain packs (2 conditions between participants), or if they did not want a pack. Packs shown were randomly selected from the experimental conditions. Participants were told immediately after they made their selection that they would not be given the pack Analysis summary: Participants randomly assigned to 1 of 4 groups. Within each condition participants viewed 10 cigarette packages presented 1 at a time, participants could look at the pack for as long as they wanted. Because differences in smoking behaviour were observed between experimental conditions, all linear regression models included the following covariates: age, education, ethnicity, smoking status, and weight concerns. Therefore, all values reported from the linear regression models represent “adjusted” values. Unstandardised betas are reported for all linear regression models. Finally, comparisons across conditions for each of the individual 10 female‐oriented packages were tested using logistic regression models, where 1 more appealing, better taste, lower tar, and less harmful, and 0 no difference or less appealing, worse taste, higher tar, and more harmful, adjusting for age, education, ethnicity, smoking status, and weight concerns. The Hosmer‐Lemeshow test was used to test the logistic regressions for goodness‐of‐fit |
|
| Funding source | “Funding support was provided by Action on Smoking and Health (the United Kingdom), the Propel Centre for Population Health Impact, a Canadian Institutes of Health Research New Investigator Award, a Canadian Cancer Society Research Institute Junior Investigator Award, and a Project Grant from the U.S. National Cancer Institute (P01 CA138‐389‐01).” | |
| Conflicts of interest | None provided in article | |
| Notes | ||
| Risk of bias | ||
| Bias | Authors' judgement | Support for judgement |
| Selective reporting (reporting bias) | Low risk | All outcomes were reported as stated in aims. Outcomes were given for the whole sample |
| Sampling Method | High risk | Quote: "Participants were recruited from a consumer panel with a reach of more than 300,000 individuals through Global Market Insite, Inc. (Bellevue, WA; http://www.gmi‐mr.com/global‐panel/). Email
invitations were sent to parents or guardians, who then gave consent for their child to complete the survey. Comment: The survey was conducted on the internet by a registered market research company." Recruitment was indirect via guardians/parents. |
| Measurement of independent variable | Low risk | Quote: "The 10 'female‐oriented; brands were selected based on previous research [15]. Brands were purposefully selected to examine the descriptors superslims, menthol, frost, silver, pink, purple, blue, cherry, vanilla, and arome, as well as 'traditional' female color schemes, such as pink and white
(Figure 1). Female‐oriented packaging was modified according to the experimental condition, as shown in Figure 1. Condition 4 included leading varieties of non–female‐oriented 'male' packages as a control condition." Comment: Images clearly differentiated between the 4 different conditions |
| Measurement of dependent variable | Low risk | Quote: "the socially desirable response may have been to provide lower ratings of appeal and other positive attributes of cigarette brands, thereby underestimating positive pack and trait ratings. However, the between subjects experimental design and randomization of participants to experimental conditions are considerable strengths of the study, which ensure that any biases are equal across groups... participants based their evaluations on images of cigarette packages, rather than observing packs directly. This may have attenuated responses to cigarette packs in some cases, particularly with respect to the shape and size of “slim” packs, which are difficult to convey in a two‐dimensional image" Comment: Fairly standard and simple questions used with a modest range of dependent variables. Not sure whether to take the above quotes into account but these would apply for many of the studies. |
| Control for confounding | Low risk | Comment: Controlled for possible confounders |
| Incomplete outcome data (attrition bias) All outcomes | Low risk | Comment: Out of the 949 sample, there were smaller samples for some of the analyses, presumably due to missing data, but this was not discussed in the paper |
| Statistical methods | Low risk | Comment: Appropriate |
Hammond 2014.
| Methods | Country: UK Setting: Online survey recruited through adult members of the YouGov online panel Date: June 2012 Design: Within‐participants experiment, with a 2x3 factorial design, in which the appearance of cigarette packs was manipulated based on standardised pack colour (white or brown) and type of health warning (40% text warning, 40% pictorial warning or 80% pictorial warning). Branded packs carried a 40% text warning only (warnings at the bottom of the pack). Discrete choice experiment between pack pairs |
|
| Participants | 762 British youth, smokers and non‐smokers, recruited from a proprietary consumer panel managed by the UK survey firm, ‘YouGov’, which consisted of 350,000 adults at the time of the survey. Although the panel as a whole is not representative of the UK population, quota‐based sampling from within the panel is designed to achieve a representative sample for each survey Average age: 14.4 (11 ‐ 17‐year‐olds) 54.9% (n = 418) male; 37 smokers (4.9%) 8 ex‐smokers (1%); 715 non‐smokers (93.8%) |
|
| Interventions | IV: Standardised vs branded packs Branded = Each pair included the same reference pack, a branded Benson and Hedges (B&H) pack on the UK market at the time of the study, alongside a B&H pack modified according to the factorial design. 1 additional pair of packs was viewed to test consumer perceptions of ‘Superslims’ packaging. The pair consisted of a regular Silk Cut branded pack and a Silk Cut ‘Superslims’ variety, both of which were available on the UK market. Branded packs carried a 40% text warning only (warnings at the bottom of the pack) Standardised (plain) = Either brown or white. Warning labels on the standardised packs were of 3 different types and sizes: (40% text warning, 40% pictorial warning or 80% pictorial warning). All B&H except 1, Silk Cut Superslims |
|
| Outcomes |
[Secondary non‐behavioural]: attractive, smooth taste, health risk, tar level, try smoking and warning impact. Which pack would they choose. Analysis summary: Chi2 tests were used to examine whether there was a significant difference in the proportion of participants who selected either pack within each pair for each of the 6 outcomes. ‘Neither/no difference’ responses were excluded from this analysis. To adjust for multiple comparisons, the Benjamin–Hochberg adjustment was applied. 20 GEE models were used to test for differences across the 6 pairs for each of the 6 outcomes. Separate GEE models were used for each outcome. All 6 pack pairs had the same reference group (the regular branded B&H pack) hence the outcome of interest in each model was the proportion of individuals who selected the unbranded comparison pack. The 2 factors, standardised pack colour and warning type, were entered as indicator variables in the model. ‘Neither/no difference’ responses were grouped with responses for those who selected the branded pack for this analysis. The 2‐way interaction between standardised pack colour and warning type was tested by running additional GEE models with the interaction term. Chi2 and GEE analyses. Models adjusted for age, gender, smoking status (never smoked or prefer not to say vs tried smoking or current smoker) and social grade |
|
| Funding source | "The fieldwork for this study was funded from the charitable resources of Action on Smoking and Health" | |
| Conflicts of interest | “None declared” | |
| Notes | ||
| Risk of bias | ||
| Bias | Authors' judgement | Support for judgement |
| Selective reporting (reporting bias) | Low risk | Comment: outcomes were as expected |
| Sampling Method | High risk | Quote: "Participants were recruited from a proprietary consumer panel managed by the UK survey firm, ‘YouGov’, which consisted of 350,000 adults at the time of the survey. Although the panel as a
whole is not representative of the UK population, quota‐based sampling from within the panel is designed to achieve a representative sample for each survey. Panel members with children aged between 11 and 17 years were approached online to participate in the survey. The survey was only undertaken if the adult panel member approved and the young person was available and willing to participate." Comment: Although a large market research company panel and quota sampling employed, the method for recruiting young people would have introduced bias |
| Measurement of independent variable | Low risk | Comment: packs were clearly distinguishable |
| Measurement of dependent variable | Low risk | Comment: provenance of all the DV measures not stated but had good face validity |
| Control for confounding | Low risk | Quote: "Analyses were adjusted for age, gender, smoking status (never smoked or prefer not to
say vs tried smoking or current smoker) and social grade" Comment: potential confounders were adjusted for |
| Incomplete outcome data (attrition bias) All outcomes | High risk | Comment: "In total, 7396 panel members were approached and 762 young people completed the survey, giving a total response rate of 10.3%. This is lower than YouGov’s typical response rate of 40–60% due to the requirement for the young person to be available and willing to complete the survey (although only five young people did not want to take the survey)". |
| Statistical methods | Low risk | Comment: Appropriate |
Hogarth 2015.
| Methods |
Country: England Setting: University of Bristol Date: Experiment 1, July 2012; Experiment 2, April 2013 Design: 2 within‐participants experiments (1 also had a between‐participants element) to test whether standardised vs branded UK cigarette pack stimuli would differentially elicit instrumental tobacco‐seeking in a nominal Pavlovian to instrumental transfer (PIT) procedure Analysis summary: Percentage choice of tobacco over chocolate contrasted between the standardised pack, branded pack and no‐stimulus condition of the PIT test, in a within‐participants analysis of variance (ANOVA) |
|
| Participants | Convenience sample of staff and students at Bristol University recruited using range of media (posters, University website, email) Experiment 1: n = 23; 20.8 years (SD 2.3, range 18 ‐ 27); 70% male Experiment 2 n = 121; 21.3 years (SD = 3.32, range = 18 – 36); 51% male All smokers, but Expt 2 smokers of 1 of 5 brands available in both Australia/UK. |
|
| Interventions | Branded = same brands as standardised but fully branded and 30% health warnings. Standardised (plain) = Experiment 1: the pack displayed was sampled randomly from a set of 100 stimuli (10 brands × 10 health warnings standard 30% UK set). The reward they thought they were getting was a pack of their preferred brand of 10 cigarettes. Experiment 2: same packs displayed as in Experiment 1. Reward was a pack of 20 cigarettes either standardised Australian pack or branded UK pack of their preferred brand | |
| Outcomes | [Secondary behavioural]: tobacco‐seeking behaviour | |
| Funding source | "Funding from the British Heart Foundation, Cancer Research UK, Economic and Social Research Council, Medical Research Council and the National Institute for Health Research, under the auspices of the UK Clinical Research Collaboration, is gratefully acknowledged. This work was carried out at the School of Experimental Psychology, University of Bristol. The work was supported by the Medical Research Council (MC_UU_12013/6 to M.R.M. and G0701456 to L.H.) and the Economic and Social Research Council (RES‐000–22‐4365 to L.H. and a PhD studentship to O.M.M.). O.M.M. and M.R.M. are members of the UK Centre for Tobacco and Alcohol Studies, a UK Clinical Research Council Public Health Research: Centre of Excellence." | |
| Conflicts of interest | "None" | |
| Notes | ||
| Risk of bias | ||
| Bias | Authors' judgement | Support for judgement |
| Selective reporting (reporting bias) | Low risk | Quotes: "Experiment 1 used the previously described PIT procedure to test whether plain cigarette pack stimuli would show reduced control over tobacco‐seeking than branded pack stimuli..... Experiment 2: “completed a task identical to experiment 1…....Experiment 2 reports part of the test phase of a randomized controlled trial, the full protocol for which has been registered (ISRCTN 52982308)." Comment: Both experiments used a previously tested procedure (although there was a difference in the reward offers in Experiment 2). The outcomes stated in the protocol match those analysed and published |
| Sampling Method | High risk | Quote: "…with a convenience sample of adult smokers…" Comment: Convenience sample |
| Measurement of independent variable | Low risk | Quote: "In the PIT test that followed, choice between the two responses was tested in extinction during presentation of either an image of a plain pack (Fig. 1a, from [5,6]) or a branded UK pack(Fig. 1b). Blank no‐stimulus trials were intermixed randomly." Comment: Images clearly differentiated between the branded and standardised packs |
| Measurement of dependent variable | Low risk | Quote: "Experiment 1: One participant was excluded for reporting inaccurate knowledge of the response–outcome contingencies following concurrent choice acquisition, leaving a final sample of n = 23 for analysis..... Experiment 2: “Seven participants were excluded due to computer failure or inaccurate knowledge of the response–outcome contingencies, leaving a final sample of n = 121 for analysis." Comment: PIT uses standard techniques. Participants are trained and any failing the response‐outcome contingency check were excluded from the analysis as indicated in the quote. |
| Control for confounding | High risk | Comment: Relatively few demographic data collected, and no subgroup differences examined except by frequency of smoking |
| Statistical methods | Low risk | Comment: Appropriate |
Kotnowski 2015.
| Methods | Country: Canada Setting: Online study Date: November 2013 Design: Discrete choice experiment |
|
| Participants | 448 smoking and non‐smoking women aged 16 ‐ 24 years Participants recruited from Global Marketing Institute, Inc. a commercial market research service from a national Canadian panel of 219,000 participants. Women belonging to the target group were sent an email via the panel and those who responded, were eligible and participated were reimbursed using the panel’s usual rate Mean age 20.3 years. 218 (48.7%) smokers. 230 (51.3%) non‐smokers |
|
| Interventions | Respondents were shown 10 choice sets, each containing 4 packs with different combinations of the attributes: 1) pack structure (slim, lipstick, booklet, traditional); 2) brand (“Vogue,” “du Maurier”); 3) branding (branded, standardised); 4) warning label size (50%, 75%); and 5) price (CAD 8.45, CAD 10.45). Each choice set contained 4 pack profiles and the alternative ‘none’ The choice sets were presented as 2D image. Pack profiles were generated by combining different levels of each attribute. A subset of 37 pack profiles were selected arranged into 10 orthogonal and balanced choice sets. To mitigate the potential that 2D images could underestimate the effect of different shapes and sizes, 1 additional balanced and orthogonal choice set was created and marked as a holdout. Each holdout profile was presented to respondents as a video, which offered a means to illustrate the structural differences between packs in a 3D format, including package depth and opening‐style Branded = For 3) branded is an option Standardised (plain) = For 1) traditional vs alternative structures. For 3) standardised is an option. Followed the Australian model, same dark brown‐green colour as those used in Australia (Pantone 448C), with the brand name in the same typeface (Lucida Sans) and font size and colour (Pantone Cool Gray 2C) |
|
| Outcomes |
[Secondary non‐behavioural]: The outcome measures were pilot‐tested through cognitive interviews to ensure question wording was relevant to smokers and non‐smokers and perceived in similar ways. For each choice set, respondents chose the brand that they: (1) would rather try, (2) would taste better, and (3) would be less harmful, or “none.” For each outcome, the attributes’ impact on consumer choice was analysed using a multinomial logit model. Analysis summary: Multinomial logit models were used to analyse the effect of each attribute on the 3 outcomes. Responses were analysed based on Random Utility Theory. Fitting the Multinomial Logit Model Attribute‐level importance was modelled by the main effects multinomial logit models and estimated using “binary” coding. The multinomial logit models were extended to estimate 2 attribute interactions. The estimated parameter coefficients from the main effects model, and respecified using “effects” coding, were used in subsequent analyses to assess attribute importance. Attribute importance was expressed as a percentage and calculated by comparing ranges of attribute‐level coefficient values, i.e. the difference between an attribute’s highest and lowest parameter coefficient values. The relative importance weight of each attribute was calculated with respect to the sum of utility ranges. To account for the moderating effect of smoking status and age, adjusted multinomial logit models were constructed using “effects” coding by interacting smoking status and age with each attribute. Smoking status was modelled as a categorical variable (smoker, non‐smoker), and age was modelled as a continuous variable |
|
| Funding source | “This work was supported by a CIHR/Training Grant in Population Intervention for Chronic Disease Prevention: A Pan‐Canadian Program (grant number 53893) (KK); the Propel Centre for Population Health Impact, a Canadian Institutes for Health Research New Investigator Award (DH); and a Canadian Cancer Society Research Institute Junior Investigator Research Award (DH).” | |
| Conflicts of interest | “None declared.” | |
| Notes | ||
| Risk of bias | ||
| Bias | Authors' judgement | Support for judgement |
| Selective reporting (reporting bias) | Low risk | Comment: Followed standard discrete choice experiment procedures. Findings unlikely to be selectively reported |
| Sampling Method | High risk | Quote: "Participants were recruited from Global Market Insite, Inc., a commercial market research service (www.gmi‐mr.com), offering a Canadian panel consisting of 219 000 participants. The sample included smokers and nonsmokers because within this age category there is reasonable uptake in smoking behaviors. During November 2013, females belonging to the target age group were sent an email invitation to participate in an online survey. After providing consent and completing the survey, participants were remunerated from Global Market Insite, Inc. in accordance with their usual rate." Comment: Very much a convenience sample depending on who responded, likely to be selective. Quote: "The survey was programmed to only operate on browsers that were at least 550 pixels wide and 900 pixels long (ie, larger than a smart‐phone device) to ensure that pack images did not appear too small on the screen." Comment: This requirement in sampling will have favoured respondents with better access to technology and thus possibly higher socio‐economic status but this is not discussed (although education level is noted in Table 1). Overall we can assume that this sample is not representative of Canadian smokers and non‐smokers even in the designated age category |
| Measurement of independent variable | Low risk | Comment: Packs were clearly different in terms of their attributes and between standardised and branded packaging |
| Measurement of dependent variable | Low risk | Quote: "The outcome measures were pilot tested through cognitive interviews to ensure question wording was relevant to smokers and nonsmokers and perceived in similar ways" Comment: Fairly standard and simple questions used with a modest range of dependent variables |
| Control for confounding | Low risk | Comment: Age and smoking status were taken into account |
| Incomplete outcome data (attrition bias) All outcomes | Unclear risk | Comment: Limited information provided but it appears that only participants who completed the full task were included in the analysis |
| Statistical methods | Low risk | Quote: "Multinomial logit models were used to analyze the effect of each attribute on: (1) intentions to try, (2) perceptions of product taste, and (3) perceptions of product harm. Responses were analyzed based on Random Utility Theory" Comment: standard procedures for discrete choice experiment followed |
Maynard 2013.
| Methods |
Country: England Setting: 3 secondary schools in Bristol Date: June ‐ November 2011 Design: Mixed‐model experimental design with smoking status as a between‐participants factor and pack type (branded/standardised) and eye gaze location (health warning or branding) as within‐participants factors |
|
| Participants | A convenience sample of adolescents aged 14 ‐ 19 comprising never‐smokers (n = 26), experimenters (n = 34), weekly smokers (n = 13) and daily smokers (n = 14). Average age of sample: 16.6 years; 44.8% (n = 39) male. They were recruited from 3 comprehensive (i.e state‐run, open to pupils of all abilities) out of 6 such schools that were contacted about the study and responded. Recruitment of the pupils was led by a psychology teacher in each of the 3 schools and most participants were studying psychology at GCSE (General Certificate of Secondary Education) examinations which are taken at age 16, or A‐level, examinations which are taken at age 18. Pupils who expressed an interest in participating arranged a testing time with the teacher and testing was completed during either their psychology lesson or during a period | |
| Interventions | IV: branded vs standardised packs Branded = Branded pack images were taken from the 10 popular cigarette brands in the UK (Benson & Hedges, Lambert and Butler, Mayfair, Richmond, Silk Cut, Embassy, Marlboro, Player’s Gold Leaf, Royals and Sterling). Standardised (plain) = Standardised white pack images were taken from an example of a standardised pack created for Action on Smoking and Health (England), and modified to create 10 standardised pack images with the cigarette brand names described above included as plain text. 10 different pictorial health warnings, selected at random from those in use at that time on cigarette packs in the UK, were paired with each of branded and standardised pack images, to create a total of 200 stimuli (100 branded, 100 standardised). These pictorial warnings were placed on the rear panel of packs in the UK at that time. In this study they were placed on the front of the pack, as semantic content (i.e. written health warnings) is known to capture visual attention preferentially. |
|
| Outcomes |
[Secondary, behavioural]: number of eye movements(dominant eye) to health warnings and branding on standardised and branded packs Analysis summary: Eye‐position data were analysed offline using an automatic saccade detection procedure. A saccade was defined as a change in eye position with a minimum velocity of 30 degrees/second, or a minimal acceleration threshold of 8000 degrees/second. A fixation started after the velocity fell below this value for 5 successive samples. The primary outcome was the number of eye movements made to 2 regions of interest: (i) the lower part of the cigarette packs comprising the health warning (7.4 x 10.3 degrees visual angle in height and width, respectively), and (ii) the upper part of the cigarette pack comprising the branding (10.4 x 10.3 degrees of visual angle). A 4 (smoking status: never‐smoker, experimenter, weekly smoker, daily smoker) x2 (saccade landing position: health warning, branding) x2 (pack type: plain, branded) analysis of variance was used to analyse the number of eye movements data. Interaction effects were explored by further stratified analyses |
|
| Funding source | "Funding from the UK Centre for Tobacco and Alcohol Studies, British Heart Foundation, Cancer Research UK, Economic and Social Research Council, Medical Research Council, and the National Institute for Health Research, under the auspices of the UK Clinical Research Collaboration, is gratefully acknowledged." | |
| Conflicts of interest | "No conflicts to declare" | |
| Notes | ||
| Risk of bias | ||
| Bias | Authors' judgement | Support for judgement |
| Selective reporting (reporting bias) | Low risk | Quote: “The present study therefore attempted to replicate the study by Munafò and colleagues in adolescents, assessing the effects of plain packaging on visual attention towards health warnings on branded and plain packs of cigarettes.” Comment: Replication of previous study and same outcomes assessed |
| Sampling Method | High risk | Quote: “A convenience sample of adolescents…” Comment: Convenience sample |
| Measurement of independent variable | Low risk | Quote: "number of eye movements to health warnings and branding on plain and branded packs" Comment: standardised and branded packs were very distinct |
| Measurement of dependent variable | Low risk | Quote: “Two‐dimensional eye movements were recorded using an Eyelink 1000 (SR Research Ltd, ON, Canada)…. Eye‐position data were analysed off‐line using an automatic saccade detection procedure.” Comment: Objective outcomes |
| Control for confounding | Unclear risk | Relatively small sample not controlled for confounding |
| Incomplete outcome data (attrition bias) All outcomes | Low risk | Quote: "Fourteen participants were excluded from further analysis due to inability to track their eyes (n=8), computer error (n=3), the participant feeling ill (n=1) and time constraints requiring the termination of the experiment (n=2)" Comment: 14 of the 101 removed from data analysis because of problems tracking eye movements and illness |
| Statistical methods | Low risk | Comment: Appropriate |
Maynard 2014.
| Methods |
Country: England Setting: University of Bristol Date: 6th November 2012 ‐ 1st March 2013 Design: Repeated measures design, using eyelink 2 eye tracker |
|
| Participants | A convenience sample of 30 adult (18 ‐ 40 years) daily dependent smokers from students and staff at University of Bristol and the general population. Average age 21.0 years (63% men (n = 11) | |
| Interventions | Standardised pack 1: Brand name but no variant. Cardboard‐coloured, with 30% pictorial warning
Standardised pack 2 (blank pack): No brand name or variant, cardboard‐coloured with 30% pictorial warning Packs carried either a familiar UK EU pictorial warning and an unfamiliar EU pictorial warning not used in the UK. The 10 familiar and unfamiliar warnings were matched on effectiveness based on a pre‐study pilot. Branded pack images: taken from 10 popular tobacco brands in the UK (Benson & Hedges, Lambert & Butler, Mayfair, Richmond, Silk Cut, Embassy, Marlboro, Player’s Gold Leaf, Royals and Sterling) |
|
| Outcomes |
[Secondary behavioural]: Physiological, the number of fixations to health warnings and branding on the different pack types Analysis summary: Eye‐position data were analysed in the same way as in their previous studies (Maynard et al. 2013; Munafò et al. 2011). A 2 (eye gaze location: health warning, branding) ×3 (pack type: branded, plain, blank) ×2 (health warning familiarity: familiar, unfamiliar) analysis of variance (ANOVA) was used to analyse the data on the number of saccades. Interaction effects were explored by further stratified analyses corrected for multiple comparisons, using the Bonferroni method. In cases where Mauchly’s Test of Sphericity indicated that the assumption of sphericity had been violated, Greenhouse Geisser corrected values were used. Effect sizes were calculated using Cohen’s d for t‐tests and eta‐squared for ANOVA. To describe the focus of participants’ attention, a time‐course analysis was conducted for each of the 3 pack types |
|
| Funding source | “Funding from the UK Centre for Tobacco and Alcohol Studies, British Heart Foundation, Cancer Research UK, Economic and Social Research Council, Medical Research Council, and the National Institute for Health Research, under the auspices of the UK Clinical Research Collaboration, is gratefully acknowledged. The funders had no further role in study design; in the collection, analysis and interpretation of data; in the writing of the report; or in the decision to submit the paper for publication.” | |
| Conflicts of interest | “No conflict declared” | |
| Notes | Quote: “As intended, the ‘blank’ pack looked like a cigarette pack with the branding removed. However, it is possible that the attention to this area of the pack, which we have ascribed to warning avoidance, maybe the result of an interest in a particularly novel cigarette pack (i.e., one without any branding). While this is possible and may explain some of the attention directed to this area of the pack, it is unlikely that this explains why smokers attended this region of the pack for approximately 8000 ms, for each of the 20 blank packs shown to them. Second, to further investigate the effect of branding on visual attention, it would be interesting to see how the participants’ own cigarette brand influences viewing patterns. However, as information on participants’ preferred brands was not obtained, this analysis cannot be performed.” | |
| Risk of bias | ||
| Bias | Authors' judgement | Support for judgement |
| Selective reporting (reporting bias) | Low risk | Quote: “The present study aimed to establish which of these three explanations accounts for why regular smokers do not attend cigarette pack health warnings.” Comment: the outcomes assessed were clearly identified from the findings of previous studies |
| Sampling Method | High risk | Quote: " ..convenience sample.." Comment: a convenience sample |
| Measurement of independent variable | Low risk | Quote: "Visual stimuli of branded and plain packs of cigarettes were identical to those used in their previous eye‐tracking studies. Blank packs were created by removing all text from the plain packs, leaving only the health warning.” Comment: The 3 conditions were easily distinguishable |
| Measurement of dependent variable | Low risk | Quote: “The eye‐tracking procedure was the same as for our previous eye‐tracking studies” Comment: Objective measurement using an automatic saccade detection procedure |
| Control for confounding | Unclear risk | Quote: "This study used a repeated measures design with eye gaze location (health warning, branding), pack type (branded, palin, blank) and health warning familiarity (familiar, unfamiliar) as within‐subjects factors" Comment: 1 group only, relatively small sample not adjusted for possible confounders |
| Incomplete outcome data (attrition bias) All outcomes | Low risk | Quote: “Two participants were excluded from further analysis due to an inability to track their eye movements” Comment: minimal attrition |
| Statistical methods | Low risk | Comment: Appropriate |
Maynard 2015.
| Methods |
Country: England Setting: University of Bristol Date: March – December 2013 Design: Randomised controlled experimental trial between‐participants design. 24 hours for the study and follow‐up was 48 hours after baseline smoking day |
|
| Participants | 128 regular daily smokers, aged between 18 and 40 years. Participants were recruited from the staff and students at the University of Bristol and the general population, through existing email lists, poster and flyer advertisements, online and by word of mouth. Age: 21 (21.09 in branded condition, 21.66 in plain condition) Note: recruited to obtain equal number of people aged 18 ‐ 34 and 35+. 50% male (n = 64) | |
| Interventions | IV: Usual brand vs standardised Branded = Participants were given their usual UK branded pack of cigarettes (Marlboro Gold, Marlboro Red, Dunhill Red, Benson and Hedges Gold, Benson and Hedges Silver). Warning on Branded Pack and Plain Pack were attempted to match: 'Smoking harms babies' on plain pack and 'Smoking when pregnant harms your baby' Standardised = Australian plain pack of cigarettes which matched their preferred UK brand. Note Plain packs had the text‐plus graphic on all packs (where UK branded had text‐only on front 30% and text‐plus‐graphic 40% on the back) |
|
| Outcomes |
[Primary]: consumption during the 24‐hour smoking day. [Secondary behavioural]: Physiological, volume of smoke inhaled; forgo cigarettes, stub out cigarette early, smoke less around others, keep pack out of sight, cover pack. These and the 2 questions about thinking about quitting below were statements answered with binary (yes/no) responses. ‘Yes’ responses were summed to create an overall score of smoking behaviour [Secondary non‐behavioural]: 1) self‐reported ratings of motivation to quit smoking (as measured by the Quitting Contemplation Ladder); think about quitting in the next few weeks, think about quitting within a year. 2) the cigarette taste test (To assess the taste of the cigarettes smoked at the blind ‘tasting’ on the baseline day, participants were asked “How did this cigarette taste”, and when they returned on the final test day, participants were asked “How did the cigarettes in the pack given to you yesterday taste”. To answer these questions participants were required to report their agreement with the statements “The taste of this cigarette was strong/harsh/dry/stale /dull/dirty”, each on a 7‐point scale between “Strongly disagree” to “Strongly agree”. Participants also reported on a 7‐point scale between “Much better” to “Much worse” the answer to the question “Compared to my usual cigarette, the taste of this cigarette is…”; 3) At the final test day, participants also answered a series of questions about their experiences on the smoking test day. To assess ‘Experience of smoking’, participants were asked, “To what extent did you experience the following as you smoked the cigarettes? a) Enjoyment, b) Satisfaction, c) Acceptance”; 4) To assess ‘Experience of using the pack’, participants were asked “To what extent did you experience the following about the cigarette pack? a) Embarrassment, b) Shame, c) Acceptance”; 5) To assess 'Rating of cigarette pack attributes’, i.e. participants ’perceptions of the packs, participants were asked to “Rate the cigarette pack on the following attributes: a) Style, b) Fashion, c) Cheapness, d) Coolness, e) Attractiveness, f ) Quality, g) Appeal”; 6) To assess participants’ ‘Rating of the health warning’, participants were asked to “Rate the health warning on the following attributes: a) Noticing, b) Seriousness, c) Believability, d) Awareness of health risks”. Mean responses across the sub‐questions were then calculated in order to calculate an overall response for each of the 5 questions. 7) Participants were also asked to report their ‘Attitudes to plain packs’ by answering the following 3 questions “Do you think plain packaging would make you smoke fewer cigarettes? ”,“Do you think plain packaging would help you to quit smoking?” and “Do you think plain packaging would prevent children from starting smoking?”. Each of these questions was answered on a 4‐point scale, with higher scores indicating higher agreement with each of the questions. Analysis summary: Linear regression was used to evaluate the effect of cigarette packaging (branded or plain) on the primary and secondary outcome measures. Analyses were conducted with and without adjustment for age, gender, heaviness of smoking and, where appropriate, corresponding baseline measures. Whether these effects differed between men and women was investigated by including appropriate interaction terms in the models |
|
| Funding source | “This study was funded by a PhD studentship to OMM from the UK Clinical Research Collaboration, and by the Medical Research Council (grant number MC_UU_12‐13/6). The funder had no role in any aspect pertinent to the study. We declare that we have not received support from any companies for the submitted work. As the corresponding author, OMM had full access to all of the data in the study and had final responsibility for the decision to submit for publication.” | |
| Conflicts of interest | “The authors declare that they have no competing interests” | |
| Notes | Some details taken from: Maynard OM, Leonards U, Attwood AS, Bauld L, Hogarth L, Munafo MR. Plain packaging of cigarettes and smoking behavior: study protocol for a randomized controlled study. Trials 2014, 15 :252 www.trialsjournal.com/content/15/1/252 | |
| Risk of bias | ||
| Bias | Authors' judgement | Support for judgement |
| Random sequence generation (selection bias) | Low risk | Quote: “The lead researcher was blind to the condition assigned to participants until the participant returned on the final test day. To perform the randomisation, the lead researcher, who enrolled participants, contacted an experimental collaborator with the participant’s preferred brand of cigarettes and the participant’s gender. The collaborator then used random number generator software, along with a pre‐assigned code, to allocate the participant to the branded or plain cigarette pack condition. A pack of the assigned cigarettes was then placed into a concealed envelope labelled with the participant’s anonymised identification number.” Comment: Random component included |
| Allocation concealment (selection bias) | Low risk | Quote: “The lead researcher was blind to the condition assigned to participants until the participant returned on the final test day. To perform the randomisation, the lead researcher, who enrolled participants, contacted an experimental collaborator with the participant’s preferred brand of cigarettes and the participant’s gender. The collaborator then used random number generator software, along with a pre‐assigned code, to allocate the participant to the branded or plain cigarette pack condition. A pack of the assigned cigarettes was then placed into a concealed envelope labelled with the participant’s anonymised identification number.” Comment: The allocation sequence was concealed from the lead researcher who was involved in the enrolment and assignment of participants |
| Blinding of outcome assessment (detection bias) All outcomes | Low risk | Quote: “The lead researcher was blind to the condition assigned to participants until the participant returned on the final test day”….” rather than simply asking participants to report their smoking behaviour, we examined the effect of plain cigarette packaging on actual smoking behaviour over 24 hours as measured by a topography monitor.” Comment: Data were collected using topography machine and not subjective assessment by the outcome assessor |
| Selective reporting (reporting bias) | Low risk | Quote: "The published protocol describes the procedures in detail and no changes to the trial design or method were made after trial commencement" Comment: outcomes are as outlined in the published trial protocol |
| Incomplete outcome data (attrition bias) All outcomes | Low risk | Quote: “Of 396 people who completed the initial assessment, 128 met the inclusion criteria and were recruited into the study, with 64 participants assigned to branded cigarette packs and 64 to plain cigarette packs. Of the remaining 268 participants, 257 did not meet the inclusion criteria (the majority did not smoke one of the specific brands used in the study or failed to meet the smoking behaviour criteria [i.e. number of cigarettes smoked per day or time to first cigarette]), 10 failed to attend their allocated testing session and one participant declined to participate after completing the initial assessment. One participant randomised to branded cigarette packaging did not provide secondary outcome data…. … The shorter trial period used here ensured minimal attrition, and therefore reduced the risk of bias due to selective drop‐out”. Comment: High completion rate and short follow‐up period meant very little attrition |
Mays 2015.
| Methods | Country: USA Setting: Online Date: 2013 Design: Between‐participants design (2x2 factorial design), pictorial warning was treated as a within‐participants factor |
|
| Participants | 740 US smokers aged 18 – 30 years from a consumer research panel Members of a market research panel maintained by YouGov, (Palo Alto, California, USA). The panel includes approximately 1.2 million US adults recruited through internet‐based advertisements, email and other methods to participate in online surveys Average age: 23.8 (18 and 30 years), 411 men (55.5%) |
|
| Interventions | IV: To examine the effects of packaging (branded vs plain) and warning‐message framing (gain vs loss) on cessation motivation in young adult smokers Branded = Pack images used a brand unfamiliar to US smokers to account for smokers’ brand preferences (Peter Jackson ‐‐ blue packaging). Branded packs were created using a pack image freely available from the Tobacco Labelling Resource Library Standardised (plain) = Displayed the brand name in standard font, and were brown in colour. Warnings in the loss‐framed condition were those proposed by the FDA conveying health risks of smoking (e.g. 'Cigarettes cause cancer'). Adapted the warning‐label message text to emphasise the benefits of quitting (e.g. 'Quitting smoking reduces the risk of cancer'). All cigarette packs used images from the FDA‐proposed warning labels (50%). Although the size of the image depended on participants’ computer screens, images were scaled to the dimensions of a standard US cigarette pack, spaced equally apart, and shown in the same layout for all participants. NOTE: Personalised and non‐personalised were grouped together as no difference |
|
| Outcomes |
[Secondary non‐behavioural]: The primary outcome was participants’ motivation to quit reported in response to the cigarette pack images Analysis summary: In each condition, participants viewed images of 4 adapted cigarette packs each of which displayed a pictorial warning, which was treated as a within‐participants factor in analyses. Participants viewed all 4 pack images presented in the same manner on a single screen for as long as they wished. The cessation motivation question was directly below each image. Participants indicated how much each pack image motivated them to quit smoking through a single, 7‐point response item anchored at 1 (‘Not at all’) and 7 (‘A lot’). ‘The information on the packs focused on the benefits of quitting smoking with a 5‐point Likert‐type response ranging from 1 (‘Strongly disagree’) to 5 (‘Strongly agree’). Examined success of plain packaging manipulation using an item to assess whether participants could recall the brand of cigarette packs shown as a proxy for attention to branding. Response options included Marlboro, Camel, Peter Jackson (the correct brand) and Newport. ANCOVA then used to assess differences in motivation to quit on average for all packs and individually for each of the 4 warnings based on framing and packaging. Bivariate tests (i.e. t‐tests, F tests) were used to identify demographic and smoking‐related variables associated with study outcomes for inclusion as covariates in multivariable analyses. A similar series of bivariate tests as well as multivariable regression were used to determine the success of the experimental manipulations. To examine differences in motivation to quit between the 4 warning labels, paired t‐tests were used in the full sample and separately by experimental condition. For each set of t‐tests, used a Bonferroni correction to adjust for multiple comparisons. ANCOVA then used to assess differences in motivation to quit on average for all packs and individually for each of the 4 warnings based on framing and packaging. Demographic and smoking‐related characteristics associated with outcome variables in bivariate analyses (P < 0.05) were included as covariates. Main effects for message framing and packaging and their interaction were first inspected. Based on the findings, pair‐wise adjusted least square mean differences were evaluated between all 4 study conditions using Tukey’s posthoc adjustment |
|
| Funding source | “This research was supported by an individual allocation to Darren Mays from the American Cancer Society Institutional Research Grant to Georgetown Lombardi Comprehensive Cancer Center (Grant # IRG‐97‐152‐17). This work was also supported in part by the Biostatistics and Bioinformatics Shared Resource of Georgetown Lombardi Comprehensive Cancer Center through Comprehensive Cancer Center Support Grant # P30CA051008 (PI: Louis M Weiner). The study sponsors had no role in the study design; in the collection, analysis and interpretation data; in the writing of the report; and in the decision to submit the paper for publication. The content is solely the responsibility of the authors and does not necessarily represent the official views of the National Cancer Institute or the National Institutes of Health.” | |
| Conflicts of interest | “None” | |
| Notes | ||
| Risk of bias | ||
| Bias | Authors' judgement | Support for judgement |
| Selective reporting (reporting bias) | Low risk | Comment: results reported are in line with objectives and expectations |
| Sampling Method | Low risk | Quote: "In 2013, we sampled US young adult smokers aged 18–30 years who were members of a market research panel maintained by YouGov, (Palo Alto, California, USA). The panel includes
approximately 1.2 million US adults recruited through internet based advertisements, email and other methods to participate in online surveys. Purposive sampling for this study occurred in two steps. We first determined the demographic characteristics of US young adult smokers using data from the 2011 National Health Interview Survey, a national survey conducted by the US Centers for Disease Control and Prevention.1 Sample targets were created based on the proportion of young adult smokers in
strata for age (<25 years, 25–30 years), race/ethnicity (white and other groups, black/African–American, Hispanic), and education (≤high school, some college, college degree, graduate degree). These proportions were used to target invitations and monitor accrual in an effort to maintain demographic diversity..........Although the sampling strategy was designed to maintain demographic diversity, the study was conducted among members of an internet market research panel which may reduce generalisability." Comment: very large original panel and steps were taken to create a representative sample |
| Measurement of independent variable | Low risk | Comment: images were clearly distinguishable. Manipulation checks were also used |
| Measurement of dependent variable | Low risk | Quote: "Baseline motivation to quit smoking was captured before participants viewed cigarette pack images using four reliable and valid items.19...The primary outcome was participants’ motivation to quit reported in response to the cigarette pack images. Participants indicated how much each pack image motivated them to quit smoking through a single, 7‐point response item anchored at 1 (‘Not at all’) and 7 (‘A lot’). We examined participants’ motivation to quit in response to each pack image and average motivation across all four packs (Cronbach’s α=0.92). We selected a different item for the outcome measure to avoid habituation that may occur from using the same questions at baseline and in response to pack images." Comment: Main outcome measure based on validated measure and care taken to avoid habituation |
| Control for confounding | Low risk | Potential confounders were controlled for |
| Incomplete outcome data (attrition bias) All outcomes | Unclear risk | Quote: "The raw response rate among eligible panel members was 19%, comparable to similar internet‐based young adult smoking research." Comment: low response rate |
| Statistical methods | Low risk | Comment: Appropriate |
Miller 2015.
| Methods |
Country: Australia Setting: National online panel developed from a number of sources including advertising and ‘word‐of‐mouth’ Date: March 2014 Design: Cross‐sectional online survey (mixed methods overall) |
|
| Participants | 268 adult (18+) cigar and/or cigarillo smokers. 139 (52%) men; 129 (48%) women. Recruited from an existing panel who had expressed their willingness to be contacted for research purposes | |
| Interventions | IV: plain packaging vs branded packaging (cigar and cigarillo) Branded = Compared to the brand they used to smoke 2 years ago Standardised (plain) = Like cigarettes, the new provisions for cigar and cigarillo boxes and packs, and bags for packaging of single cigars for sale prohibit logos, brand imagery and design. (Australian legislation details: dark brown‐green colour (Pantone 448C), with the brand name in the same typeface (Lucida Sans) and font size and colour (Pantone Cool Gray 2C). 75% pictorial HW on front, 90% back. Cylindrical tubes in which cigars can be packaged for sale must display text‐only warnings |
|
| Outcomes |
[Primary]: Self‐reported consumption changes since 2 years ago [Secondary behavioural]: deliberately concealed or decanted [Secondary non‐behavioural]: appeal of packaging and product; changes in taste, enjoyment; perceived quality, value and harm; frequency of noticing warnings, recall of cigar graphic health warnings Analysis summary: Simple descriptives (for continuous variables, means and SDs were calculated; frequencies reported for categorical data.) Small cell sizes prevented more complex analyses |
|
| Funding source | “This study was funded under a contract with the Australian Government Department of Health” | |
| Conflicts of interest | “The authors wish to advise that CM and MW were members of the Expert Advisory Committee on Plain Packaging that advised the Australian Department of Health on research pertaining to the plain packaging legislation. MW holds competitive grant funding from the Australian National Health and Medical Research Council, US National Institutes of Health, Australian National Preventive Health Agency and BUPA Health Foundation. CM and MW hold such grant funding from Cancer Council South Australia.” | |
| Notes | Note, type of tobacco packing smoked: 79% smoke cigarettes, 62% roll‐your‐own, 44% cigarillos, 94% cigars | |
| Risk of bias | ||
| Bias | Authors' judgement | Support for judgement |
| Selective reporting (reporting bias) | Low risk | Quote: “The current research sought to assess, among different segments of cigar consumers …:more ‘downstream’ perceived changes in smoking behaviours and thoughts since the implementation of plain packaging” Comment: relevant aim was to assess perceived changes in smoking behaviours and thoughts which were reported in the study |
| Sampling Method | Low risk | Quote: "This sample was recruited from an existing national online panel who had expressed their willingness to be contacted for the purpose of research. This panel develops their database from a numbr of sources including advertising and 'word‐of‐mouth'". Comment: Difficult to access cigar users and this online survey seems an appropriate tool to do so |
| Measurement of independent variable | High risk | Quote: “Exposure to cigar and/or cigarillo plain packaging was reported consistently by approximately half of participants, in terms of purchasing and smoking cigar/cigarillos that had come in compliant packaging and recalling any one of the cigar/cigarillo specific GHWs.” Comment: Although the date of the implementation of standardised packaging was well enforced, only half of the respondents reported consistent exposure to standardised packaging |
| Measurement of dependent variable | High risk | Quote “Cross‐sectional survey which was not explicitly focusing on standardised packaging.....The online survey used questions adapted from existing tobacco control monitoring surveys where available and new, survey‐specific questions where necessary, with response options informed by the qualitative research. …self‐perceived changes in beliefs and behaviour since the implementation of plain packaging.” ……”Other factors to consider in the interpretation of the results are social desirability and political sensitivities. Overall, care was taken in the ordering and framing of questions and discussion prompts to minimise socially desirable responses…… ..Where possible, questions were not framed in the context of plain packaging, however, it was necessary in some instances to ask participants to recall perceived changes since its implementation…. “. Comment: The main question did ask retrospectively for self‐reported changes since the standardised packaging legislation so social desirability may have influenced responses |
| Control for confounding | High risk | Comment: Enhanced pictorial warnings were implemented at the same time as standardised packaging so it is difficult to separate the effects. Only descriptive data are presented so other potential influences are not controlled for |
| Incomplete outcome data (attrition bias) All outcomes | Low risk | Quote: “A total of 56 589 email invitations describing the nature of the study (ie, to gather information regarding people’s views and experiences about smoking cigars and other tobacco products) were sent out to randomly selected members of the online panel, of which 5761 started the survey (response rate of 10%). Only 283 of these participants (ie, 5% of the people who started the survey) met the eligibility criteria as assessed by screening questions at the beginning of the survey, that is, they were aged 18 years or older and reported that they currently smoked either cigars and/or cigarillos, with a further 15 excluded due to incomplete responses, leaving 268 participants in the sample.” Comment: Cross‐sectional survey with overall response rate 10%. Although only 5% were eligible, only a small proportion were excluded due to incomplete data |
| Statistical methods | High risk | Comment: Only descriptives presented |
Moodie 2011.
| Methods |
Country: Scotland Setting: Greater Glasgow Date: May ‐ June 2010 Design: Counterbalanced repeated measures (within‐participants) experiment with 2 weeks using standardised pack and 2 weeks using their own branded packs. Participants completed questionnaires twice a week resulting in 4 questionnaires per brand type (referred to as questionnaire 1, 2, etc) |
|
| Participants | 48 young adult smokers aged 18 ‐ 35 years. Door‐knock method from 14 postcode sectors using random location quota sampling; conducted by market recruiters. Average age = 27 years; 50% men (n = 24) | |
| Interventions | IV: Branded vs standardised packs Branded = Own regular pack brand, e.g. the brand they normally smoke. UK cigarette packs contained 1 of 2 text health warnings on the front (‘Smoking kills’ or ‘Smoking seriously harms you and others around you’) and 1 of 14 ‘pictorial’ warnings on the reverse panel, although 3 are in fact text warnings as they do not display a picture, photo, pictogram or symbol Standardised (plain) = The plain packs were otherwise identical, with a fictitious brand name Kerrods, to prevent copyright breach, and all relevant legal markings and a barcode. All Kerrods packs had the same warning on the pack front TEXT only ('Smoking kills') and one ‘pictorial’ warning on the reverse panel showing a set of healthy and diseased lungs, to save costs Average size HW for both types of packs: 30% on front and 40% on back |
|
| Outcomes |
[Secondary behavioural]: smoke less around others, forego smoking, stubbing out cigarettes early, keeping pack out of sight or covering pack, measured via yes/no responses [Secondary non‐behavioural]: thinking about quitting, motivation to quit, feelings about smoking (enjoyable, satisfying), pack perceptions(stylish, fashionable, cheap, cool, attractive, quality, appealing), health warnings (noticeable, believable, seriousness, highlighting the health risks of smoking). All measured on 5‐point scales Composite scores were derived for categories of responses (such as pack perceptions, response to warnings), by summing the individual items and then rescaling to a 5‐point scale Analysis summary: Analysis focused on comparing ratings between branded and standardised packs. For each time point, paired t‐tests were used to produce mean scores for the standardised packs relative to mean scores for their own packs. Given the ordinal nature of the 5‐point scales, the Wilcoxon signed rank test, a non‐parametric procedure suited to paired data, was used to test for significant differences between the ratings of standardised packs versus the ratings of the participant’s own packs at each measure. Data on occurrence of avoidant behaviours are binary (yes/no), and the McNemar test was used to test for differences in response between participants’ measures at each time point on the standardised pack and the respective measure on their own pack |
|
| Funding source | "Cancer Research UK; UK Centre for Tobacco Control Studies fund two of the authors (GH and AF)" | |
| Conflicts of interest | "None" | |
| Notes | All potential participants were informed that the study was concerned with smokers' experiences of, and opinions about, tobacco packaging | |
| Risk of bias | ||
| Bias | Authors' judgement | Support for judgement |
| Selective reporting (reporting bias) | Low risk | Comment: First study of its kind with appropriate outcomes |
| Sampling Method | Low risk | Quote: “Young adult smokers (n=140) were recruited from 14 randomly selected postcode sectors in Greater Glasgow, using random location quota sampling. The 14 postcode sectors were randomly selected, stratified by deprivation category score (a measure of multiple deprivation), to ensure coverage of a range of socio‐economic backgrounds. Within each selected postcode sector, 10 participants were recruited, using the door knock method, according to quota controls on age, gender and social grade.” Comment: Sampling used random location quota sampling techniques |
| Measurement of independent variable | Low risk | Quote: “ [from a pilot] Smokers did not question the authenticity of the Kerrods packs or highlight any problems transferring their cigarettes into these packs, which took only a minute or so. All smokers reported using the packs for the 2 weeks, although one smoker reported not using the pack on a night out after he ran out of cigarettes.” Comment: Kerrods and their own packs were not identical apart from the branding, e.g. the brand name differed, but they were clearly distinguishable from branded packs |
| Measurement of dependent variable | Low risk | Quote: “A pre‐pilot naturalistic study was then conducted with six smokers, in March 2010, who were provided with 14 plain packs (without cigarettes inside) and asked to transfer cigarettes from their packs into the plain packs each day for a 2‐week period. They were also asked to complete identical questionnaires every second day for these 2 weeks. Questionnaires were developed by the research team, primarily from smokers’ reactions to plain packs within the focus groups, and covered five areas: pack perceptions, pack feelings, feelings about smoking, health warnings (measured on five‐point scales) and behavioural change/avoidant behaviour (measured via yes/no responses). The items on behaviour change and avoidant behaviour were adapted from the International Tobacco Control project. Two focus groups were subsequently employed to explore participants’ experience of using the plain packs, completing and comprehension of the questionnaires, and any aspects of the study protocol that could be improved. The two focus groups thought that the questionnaire was comprehensible but completing it every second day was cumbersome” "The questionnaire was informed by piloting and using previously used measures. The frequency of completion was reduced to twice a week based on the above feedback in the pilot study” |
| Control for confounding | High risk | One group only, and possible confounders not controlled for |
| Incomplete outcome data (attrition bias) All outcomes | High risk | Quote: “From the 140 participants recruited, 34 (25%) were noncompleters, who failed to participate at all, 58 (41%) were partial completers (who participated but did not return all the questionnaires or report using the correct pack) and 48 (34%) were completers, who completed the full study as intended. Noncompleters, with a mean age of 23 years (SD=4.7), were younger than both completers (mean age= 27 years, SD=5.5) and partial completers (mean age= 28 years, SD=5.5). There was no marked difference in participation, however, by amount smoked, motivation to quit or attempts to quit. The analysis focuses only on the 48 completers.” Comment: 34% of those who were recruited completed the study |
| Statistical methods | Low risk | Comment: Appropriate |
Moodie 2012.
| Methods | Country: UK Setting: online survey Date: June ‐ October 2010 Design: Experimental within‐participants design using discrete choice experiments |
|
| Participants | 658 adolescents 10 ‐ 17 years old. Convenience sample. To maximise awareness of the survey and encourage participation, the survey was publicised in 4 ways: (a) through the W‐WEST website (youth smoking group, www.w‐west.org.uk); (b) via existing NHS youth services and partner organizations of W‐WEST and NHS Greater Glasgow and Clyde; (c) through existing and trusted media contacts of W‐WEST and NHS Greater Glasgow and Clyde; and (d) via engagement with young people at community events organised by W‐WEST. In each case, young people were informed what the survey was about and given information on how to access the survey at the W‐WEST website if they chose to do so Average age 13.1 years. 311 males (47%) Ever smoker (25%): regular smoker n=49, occasional smoker n= 11, experimenter n=67; ex‐smokers: n=35. Never‐smokers = n=496 (75%). Susceptible never‐smokers (n=80). |
|
| Interventions | IV: comparing 3 structural designs and 4 colours for standardised pack comparisons Branded = Branding was based on shape with the traditional flip‐top opening being considered typical. Hence this condition was brown standardised pack and standard flip‐top opening Standardised (plain) = (2) Brown standardised packs with 30% warning, 1 pack with non‐standard slide opening, and 1 lipstick‐shaped/superslims pack. No brand names. 4 identical but different‐coloured standardised packs were also shown in a separate image: (green, red, light blue, and white) Health warning: shown in all images “Smoking Kills” on the front, 30% text warning |
|
| Outcomes |
[Secondary non‐behavioural]: of relevance to this study: 1)Criteria for choosing cigarettes. Participants were asked “How important do you think each of these things are to young people who smoke when choosing cigarettes,” with the 5 categories: price, what their friends/family smoke, seeing a famous person smoke a particular brand, the brand, and the look of the cigarette pack. All responses were measured on 5‐point scales ranging from 1 (very important) to 5 (not at all important). These were later recoded to binary variables to calculate the proportion who rated each as “very important” or “important” (Codes 1 – 2) and those who did not rate each as important (Codes 3 – 5). 2)Pack Colour 4 items were used to assess perceptions of product strength and harm via pack colour with the help of an image showing 4 identical but differently‐coloured packs (green, red, light blue, and white) with only the health warning “Smoking Kills” on the front. Participants were asked to look at the 4 differently‐coloured packs and answer which pack they thought would have (a) the strongest tasting cigarettes, (b) the weakest tasting cigarettes, (c) the most harmful cigarettes, and (d) the least harmful cigarettes. Response options included the 4 colours, 'they’re all the same', and 'don’t know'. 3) Structural preferences for standardised packs. Participants were shown an image of 3 different dark brown “plain” packs (a regular flip‐top pack, a slide pack, and a superslims pack) and asked (a) which pack they liked the most and (b) which pack people their age would be most likely to smoke. Response options were Pack 1 (flip‐top), Pack 2 (slide pack), Pack 3 (superslims pack), none of them, and don’t know (see Figure 2) Analysis summary: Descriptive data were examined and items, originally measured on a 5‐point scale, were dichotomised to show the proportion of young people responding to each item. Chi2 analyses tested differences in responses by ever‐smokers compared with never‐smokers and non‐susceptible never‐smokers compared with susceptible never‐ smokers |
|
| Funding source | “NHS Greater Glasgow and Clyde and Cancer Research UK.” | |
| Conflicts of interest | “None declared” | |
| Notes | ||
| Risk of bias | ||
| Bias | Authors' judgement | Support for judgement |
| Selective reporting (reporting bias) | Low risk | Comment: Possible that not all questions asked were reported in the article but otherwise reporting looks relatively unbiased |
| Sampling Method | High risk | Quote: "W‐WEST is a prochoice smoking group with 11 members, both smokers and nonsmokers, aged between 12 and 17 years. W‐WEST started in 2008 and is funded by NHS Greater Glasgow and Clyde as part of the national Smoking Prevention Action Plan" Comment: Likely to be an unrepresentative sample due to approach to recruitment. Respondents recruited via 1 youth group website in the West of Scotland which is explicitly pro‐tobacco control despite having members who are smokers and non‐smokers Quote: "The survey was also run at the same time as a campaign called ‘Plain Truth’" Comment: It is highly unlikely that the survey obtained responses from young people who would not be interested in (or possibly supportive of) tobacco control and standardised packaging. |
| Measurement of independent variable | Low risk | Comment: 3 main elements to the study all focusing on perceptions: a) criteria for choosing cigarettes b) pack colour c) plain packaging (completely plain except for health warning but with 3 types of pack that differed in shape or opening style only). Main outcome variables appear similar to those used in previous studies including by the research team |
| Measurement of dependent variable | High risk | Quote: "The online questionnaire, called the “Youth Tobacco Packaging Survey 2010,” was initially developed by a youth group operating within Greater Glasgow in Scotland called W‐WEST (Why Waste Everything Smoking Tobacco?) … The research team from the University of Stirling helped develop the questionnaire …The questionnaire was piloted to assess comprehension among young people by members of NHS Greater Glasgow and Clyde Smoke Free Youth Services. Following piloting, minor revisions were made to the wording of the questionnaire." Comment: Other aspects of the survey may be more problematic in terms of the design and variables used, particularly the range of variables included given the survey was initially designed by the youth group and then refined by the researchers at two stages (after initial design and then following piloting) |
| Control for confounding | High risk | Comment: Only 1 group, but highly selective sample (see above), and only controlled for smoking status |
| Incomplete outcome data (attrition bias) All outcomes | Low risk | Comment: Responses appear to have only been analysed for those who completed the survey, 658 adolescents. No information provided to clarify any missing answers or partial responses and how these were treated if included, but as this was a fairly simple survey this is not a significant cause for concern |
| Statistical methods | Low risk | Quote: "Descriptive statistics were standardized for age by weighting the sample to provide an equal proportion in each year group." Comment: A table is included which provides details of the sample characteristics before and after weighting. Differences pre‐ and post‐weighting for smoking status and smoking susceptibility were modest. Quote: (see also above under ‘Analysis plan’) "Descriptive data were examined and items, originally measured on a 5‐point scale, were dichotomized to show the proportion of young people responding to each item. Data have been analyzed using the chi‐square test to identify differences in responses by ever‐smokers compared with never‐smokers and nonsusceptible never‐smokers compared with susceptible never‐smokers." Comment: Appropriate |
Moodie 2013.
| Methods |
Country: Scotland Setting: The 6 most populated cities and towns in Scotland Date: June 2011 ‐ March 2012 Design: Counterbalanced repeated measures (within participants) experiment with 1 week using standardised pack and 1 week using their own branded pack. Participants completed questionnaires twice a week (‘midweek’ and ’weekend’) |
|
| Participants | 187 women daily smokers 18 ‐ 35 years old, average age 27.1 years; recruited by door knocking | |
| Interventions | IV: Branded vs standardised packs Branded = Own regular pack brand, e.g. the brand they normally smoke. UK cigarette packs contained 1 of 2 text health warnings on the front (‘Smoking kills’ or ‘Smoking seriously harms you and others around you’) and 1 of 14 ‘pictorial’ warnings on the reverse panel, although 3 are in fact text warnings as they do not display a picture, photo, pictogram or symbol Standardised (plain) = The plain packs were otherwise identical, with a fictitious brand name Kerrods, to prevent copyright breach, and all relevant legal markings and a barcode. All Kerrods packs had the same warning on the pack front TEXT only (smoking kills) and 1 of 3 ‘pictorial’ warnings on the reverse panel showing either a set of healthy and diseased lungs, smoke in a child’s face or a text warning about seeking help. These were 2012 UK warnings. Average size HW for both types of packs: 30% on front and 40% on back |
|
| Outcomes |
[Primary]: Consumption [Secondary behavioural]: 5 measures: stub out cigarette, forego cigarette, smoking around others, keep pack out of sight, cover pack [Secondary non‐behavioural]: thinking about quitting, wanting to quit, pack perceptions (not stylish, unfashionable, cheap, uncool, unattractive, poor quality, unappealing), feelings about smoking (satisfying, enjoyable, feeling good). For health warnings: noticing, believability, seriousness, read more closely, thought about more. All measured on 5‐point scales. Composite scores were derived for categories of responses (such as pack perceptions, response to warnings), by summing the individual items and then rescaling to a 5‐point scale Analysis summary: Paired t‐tests were used to test for differences in mean reported daily consumption while using the Kerrods pack versus their own pack. As the data on avoidant/cessation behaviours were binary (yes/no) the McNemar test was used to test for differences in response to the Kerrods pack versus their own pack. The number of avoidant/cessation behaviours associated with each pack was also counted and paired t‐tests were used to test for differences in the mean number of actions taken with the Kerrods pack versus their own pack. Analysis focused on comparing ratings between branded and plain packs at different time points. For each time point, paired t‐tests were used to produce mean scores for the plain packs relative to mean scores for their own packs. Wilcoxon signed rank test, a non‐parametric procedure suited to paired data, was used to test for significant differences between the ratings of plain packs versus the ratings of the participant’s own packs at each measure. Comparisons across time were also made by comparing the midweek composite scores versus the weekend composite scores for the Kerrods pack and comparing the midweek composite scores versus the weekend composite scores for their own pack. The Wilcoxon signed rank test was used to test for differences, across time, in the composite scores. Paired t‐tests were used to test for differences between midweek and weekend reports on the number of avoidant/cessation behaviours and reported daily consumption with each pack |
|
| Funding source | “This work was supported by Cancer Research UK grant number A13467. The funders had no role in study design; in the collection, analysis and interpretation of the data; in the writing of the report; and in the decision to submit the article for publication. The researchers are independent from the funders.” | |
| Conflicts of interest | “None” | |
| Notes | "The market recruiters, who were briefed about the study protocol but blind to the purpose of the study, informed all potential participants that the study was concerned with smokers' opinions of cigarette packaging”….” Participants were instructed to transfer cigarettes from their own packs into the Kerrods packs supplied to them and use these for 1 week of the study, and their own packs for the other week of the study" | |
| Risk of bias | ||
| Bias | Authors' judgement | Support for judgement |
| Selective reporting (reporting bias) | Low risk | Quote from abstract aims: “To explore young adult women smokers’ cognitive and emotional response to using dark brown ‘plain’ cigarette packs in natural settings and whether plain packaging is associated with any short‐term change in smoking behaviour”. Comment: the measures studied are in line with the aims and comprehensive |
| Sampling Method | Low risk | Quote: “..using random location quota sampling. The postcode sectors were randomly selected, stratified by DEPCAT score, which is a measure of multiple deprivation, to ensure coverage of a range of socioeconomic backgrounds. Within each postcode sector, market recruiters were instructed to recruit either six or seven participants, using the door knock method, according to quota controls on age (18–24/25–35) and daily consumption (light/moderate smokers were defined as those smoking 14 cigarettes a day or less, heavy smokers as those smoking 15 cigarettes a day or more).” Comment: Sampling used random location quota sampling techniques |
| Measurement of independent variable | Low risk | Quote: "The plain packs were otherwise identical, with a fictitious brand name Kerrods, to prevent copyright breach, and all relevant legal markings and a barcode" Comment: Kerrods and their own packs were not identical apart from the branding, e.g. the brand name differed, but they were clearly distinguishable from branded packs |
| Measurement of dependent variable | Low risk | Comment: commonly‐used measures were collected, which had been previously piloted and tested by the authors in a prior study |
| Control for confounding | Unclear risk | One group only. Could also be an influence of the false brand and other possible confounders not controlled for |
| Incomplete outcome data (attrition bias) All outcomes | High risk | Quote: “Of the 301 participants recruited, 54 (17.9%) were noncompleters, who failed to participate at all after completing the prestudy questionnaire, 60 (19.9%) were partial completers, who failed to return all the questionnaires or reported using the incorrect pack (eg, they used their own packs when they were meant to be using the Kerrods packs), and 187 (62.1%) were full completers, who returned all the questionnaires and reported using the correct packs. Results presented in this paper are based on the full completers.” Comment: Just over half those who were recruited completed the study |
| Statistical methods | Low risk | Comment: Appropriate |
Munafò 2011.
| Methods |
Country: UK Setting: University of Bristol Date: May 2010 Design: mixed‐model experimental design (comprising smoking status (non‐smoker, weekly smoker, daily smoker) as a between‐participants factor, and package type (branded, plain) and location of eye gaze (health warning, brand) as within‐participants factors) |
|
| Participants | 43 young adults, average age 24.0 years, 67.4% (n = 29) were men, 67.1% (n = 28) were smokers (14 weekly, 14 daily) were recruited from the general population via advertisements around university precinct and surrounding area | |
| Interventions | IV: branded vs standardised packs Branded = Branded pack images were taken from the 10 popular cigarette brands in the UK (Benson & Hedges, Lambert and Butler, Mayfair, Richmond, Silk Cut, Embassy, Marlboro, Player’s Gold Leaf, Royals and Sterling). Standardised (plain) = Standardised white pack images were taken from an example of a standardised pack created for Action on Smoking and Health (England), and modified to create 10 standardised pack images with the cigarette brand names described above included as plain text. 10 different pictorial health warnings, selected at random from those in use at that time on cigarette packs in the UK, were paired with each of branded and standardised pack images, to create a total of 200 stimuli (100 branded, 100 standardised). These pictorial warnings were placed on the rear panel of packs in the UK at that time. In this study they were placed on the front of the pack, as semantic content (i.e. written health warnings) is known to capture visual attention preferentially |
|
| Outcomes |
[Secondary behavioural]: Eye movements/fixations towards health warnings vs brand information Analysis summary: Only data from participants’ dominant eye were analysed, as is standard practice. The eye‐position data were analysed offline by an automatic saccade detection procedure. A saccade was defined as a change in eye position with a minimum velocity of 30 °/second, or a minimal acceleration threshold of 8000 °/second. A fixation started after the velocity fell below this value for 5 successive samples. The primary outcome was the number of saccades made to 2 regions of interest: (i) the lower part of the cigarette packs comprising the health warning information (7.4 ∞ 10.3 ° visual angle in height and width, respectively), and (ii) the upper part of the cigarette pack comprising brand information (10.4 x 10.3 ° of visual angle). A 3x2x2 mixed‐model ANOVA of number of saccades, with smoking status (non‐smoker, weekly smoker, daily smoker) as a between‐participants factor, and package type (branded, plain) and location of eye gaze (health warning, brand) as within‐participants factors |
|
| Funding source | “Funding from the British Heart Foundation, Cancer Research UK, the Economic and Social Research Council, the Medical Research Council and the National Institute of Health Research, under the auspices of the UK Clinical Research Collaboration, is gratefully acknowledged.” | |
| Conflicts of interest | “Funders (see Acknowledgements) had no input into any aspect of the study. MRM and LB are members of the UK Centre for Tobacco Control Studies. LB is scientific adviser on Tobacco Control to the Department of Health in England. MRM, NR, LB and UL have no relevant interests to declare.” | |
| Notes | ||
| Risk of bias | ||
| Bias | Authors' judgement | Support for judgement |
| Selective reporting (reporting bias) | Low risk | Comment: Outcomes assessed are as expected |
| Sampling Method | High risk | Quote: “A convenience sample of non‐smokers (defined as never having smoked more than 100 cigarettes in their life‐time, and not currently smoking), weekly smokers (defined as smoking at least one cigarette per week, but not daily) and daily smokers (defined as smoking at least one cigarette per day) were recruited…” Comment: a convenience sample |
| Measurement of independent variable | Low risk | Quote: 'Visual stimuli were designed specifically for the purposes of this study, and comprised an identically sized image of a cigarette pack which was either branded or plain" Comment: standardised and branded packs were very distinct |
| Measurement of dependent variable | Low risk | Quote: “Two‐dimensional eye movements of both eyes were recorded using an Eyelink II (SR Research Ltd, ON, Canada).” Comment: objective measure |
| Control for confounding | Unclear risk | One group only, and possible confounders not controlled for |
| Incomplete outcome data (attrition bias) All outcomes | Unclear risk | Comment: No details given |
| Statistical methods | Low risk | Comment: Appropriate |
Nagelhout 2015.
| Methods | Country: Australia Setting: Online survey Date: 3 survey waves: Wave 1, September 10 ‐ 30 2012 (before standardised packaging); Wave 2, January 15 – February 7, 2013 (post); Wave 3, May 15 ‐ June 9, 2013 (post) Design: Longitudinal (pre‐ and two post‐) study of population interventions ‐‐ media campaign and standardised packaging. 2 follow‐up waves within reasonable time frames of the interventions. Wave 2 began ˜1½ months after the new HWLs and standardised packaging was required on all products, and during/1 week after the mass media campaign aired for the first time. Wave 3 began ˜5½ months after the new HWs and standardised packaging was required on all products, and during the time the mass media campaign was airing for the second time |
|
| Participants | 2666 (wave 1 = 901; wave 2 = 887; wave 3 = 878) Australian adult smokers, aged 18+ years (although panel participants were selected to be broadly representative of key consumer segments in Australia, the precise sampling frame is unknown). Recruited from online consumer panel provided by Global Market Insights (GMI: www.gmi‐mr.com): Recruited from commercial sampling frame and followed over time. Those lost to follow‐up were replenished to maintain a sample size of 1000 respondents at each wave. Although panel participants were selected to be broadly representative of key consumer segments in Australia, the precise sampling frame is unknown Average age = 42 years. 1136 men (42.6%). All smokers |
|
| Interventions | IV: Pre‐post study of actual standardised packs as implemented in Australia Branded = original branded packs Standardised (plain) = dark brown‐green colour (Pantone 448C), with the brand name in the same typeface (Lucida Sans) and font size and colour (Pantone Cool Gray 2C). 75% pictorial HW on front, 90% back |
|
| Outcomes |
[Secondary non‐behavioural]: Self‐reported measures of: 1) attention to warning labels ('In last month, how often, if at all, have you noticed health warnings on cigarette packages?' And ‘In the last month, how often, if at all, have you read or looked closely at the warning labels on cigarette packs?’ with 5‐point scale options. Scores for the 2 items were averaged to form a continuous variable (range 1 ‐ 5); 2) talking about warning labels measured with 3 items: ‘In the last month, how often have you talked to others about the warning labels on cigarette packs?’, ‘In the last month, how often have your family members spoken with you about the warning labels on cigarette packs?’, and ‘In the last month, how often have other people besides your family spoken with you about the warning labels on cigarette packs?’. Response options were ‘not at all’, ‘once’, ‘a few times’, ‘often’, and ‘very often’. These 3 items were dichotomised (not at all versus the rest) and then summed into a count variable (range 0 – 3) with higher numbers indicating more talking about HWLs; and 3) Campaign recall, only assessed at waves 2 and wave 3 as there was no campaign at wave 1, using a single question: ‘In the last month, have you seen any anti‐smoking ads on television, which talked about the dangers of smoking?’, with dichotomised responses (1 = ‘yes’, 0 = ‘no’, ‘don’t know’ or not asked). Analysis summary: Chi2 tests were used to assess differences in sample characteristics across waves and differences in the outcome measures (i.e. attention and talking about HWs) between respondents who recalled the campaign and those who did not recall the campaign. GEE analyses were performed to examine whether attention to and talking about HWLs changed over time and whether campaign recall was associated with attention and talking. Linear GEE models were estimated when examining attention to HWLs as the outcome and Poisson GEE models were estimated when examining talking about HWLs as the outcome. The exchangeable correlation structure was used with robust variance estimators. The repeated measures variable was survey wave. All GEE models adjusted for age, gender, education, income, daily versus non‐daily smoker, Heaviness of Smoking Index, quit intention, previous quit attempts, and time in sample. Sensitivity analyses were conducted with weighted factors |
|
| Funding source | “This work was supported by the U.S. National Cancer Institute, grant number (R01 CA167067). The funder had no involvement in the design of the study, the collection, analysis and interpretation of the data, the writing of the paper, or the decision to submit the paper for publication.” | |
| Conflicts of interest | No details provided in paper | |
| Notes | ||
| Risk of bias | ||
| Bias | Authors' judgement | Support for judgement |
| Selective reporting (reporting bias) | Low risk | Comment: Simple range of measures about recall of a media campaign and attention to, and conversations about, health warnings. Close‐ended questions. Limited scope for selective reporting |
| Sampling Method | High risk | Quote: "Longitudinal data were obtained from three survey waves among Australian adult smokers, aged 18 years and older, who were recruited from an online consumer panel provided by Global Market Insights (GMI: http://www.gmi‐mr.com). Panel participants were selected to be broadly representative of key consumer segments in Australia. Eligible participants were smokers who smoked at least 100 cigarettes in their lifetime, and smoked at least once in the previous month" Comment: As stated above, sampling frame is unknown. Parameters for representativeness not specified ‘broadly representative’ raises questions ‐ in what respects? |
| Measurement of independent variable | Low risk | Comment: Implementation of standardised packaging was well enforced |
| Measurement of dependent variable | Low risk | Comment: 3 hypotheses clearly articulated that serve as dependent variables: attention to warning label, talking about warning labels, campaign recall. The second is most subjective but few response options provided which likely limits bias |
| Control for confounding | High risk | Comment: Enhanced pictorial warnings were implemented at the same time as standardised packaging so it is difficult to separate the effects |
| Incomplete outcome data (attrition bias) All outcomes | Unclear risk | Comment: Replenishment sampling at follow‐up for those not followed up |
| Statistical methods | Low risk | Comment: Appropriate |
Nicholson 2015.
| Methods |
Country: Australia Setting: Participants were from communities served by 34 Aboriginal community‐controlled health services (ACCHSs) and 1 community in the Torres Strait. The communities were selected based on the population distribution of Aboriginal and Torrese Strait Islander people by state or territory and remoteness Date: April 2012 ‐ October 2013 Design: Observational. Continuous cross‐sectional surveys. Conducted before and after standardised packaging was mandated (1 Dec 2012), treating the 3‐month phase‐in period as “before”. (i.e. April ‐ Nov 2012 vs Dec 2012 ‐ Oct 2013) |
|
| Participants | 1643 adult Aboriginal and Torres Strait Islander smokers and recent quitters from the communities described above (ex‐smokers who quit ≤ 12 months ago), aiming for equal numbers of men and women, and people aged 18 ‐ 34 and 35+ years (average age 36.95 years; 795 men (48.4%); 848 women (41.6%). Participants are part of the Talking About The Smokes (TATS) project which is a collaboration between research institutions and ACCHSs and their state. Participants were recruited and surveyed via face‐to‐face. (N.B. note from author: All 1643 defined themselves as current smokers, but only 1599 had smoked in the previous month) | |
| Interventions | IV: Branded vs standardised packaging in Australia Branded = pre‐standardised packaging in Australia Standardised (plain) = same dark brown‐green colour as those used in Australia (Pantone 448C), with the brand name in the same typeface (Lucida Sans) and font size and colour (Pantone Cool Gray 2C). 75% pictorial HW on front, 90% back |
|
| Outcomes |
[Secondary behavioural]: Additional analyses were conducted on forgoing cigarettes because of warning labels [Secondary non‐behavioural]: There were 4 main outcomes: believing smoking is dangerous to others (“agree” or “strongly agree” that cigarette smoke is dangerous to both non‐smokers and children), being very worried that smoking will damage the smoker’s own health in the future, agreeing that mainstream society disapproves of smoking, and wanting to quit Analysis summary: How often respondents noticed warning labels (in the past month), anti‐tobacco news stories (in the past 6 months) and anti‐tobacco advertising or information(in the past 6 months) were assessed on a 5‐point scale ranging from “never” to “very often”, which was later collapsed to 3 categories (never, sometimes, often). Those asked about warning labels were also asked about forgoing cigarettes: “Have the warning labels stopped you from having a smoke when about to?”. Covariates included daily or non‐daily smoking status and sociodemographic indicators. Also assessed for variation according to tobacco control activity that had occurred at the project site over the previous year (whether there were dedicated tobacco control resources, and the number of media used to communicate anti‐tobacco advertising), which was determined in the project site survey. Logistic regression was used to assess: (i) variation in health information recall (often vs sometimes or never) by daily smoking status, sociodemographic variables, and tobacco control activity at the project site; (ii) the association between health information recall and the 4 main outcome measures; and (iii) variation in warning label recall and outcomes before and after plain packaging was mandated. Stata 13 commands were used to adjust for the sampling design, identifying the 35 project sites as clusters and the quotas as strata. Data for health information recall were excluded for less than 2% of participants due to missing or refused responses, and for less than 2% due to “don’t know” responses. Questions about recall of warning labels were not asked of those who had not smoked in the past month (n = 44), nor those surveyed at the first project site (n = 26), after which questions were modified. These participants were therefore excluded from logistic regression analyses, which controlled for recall of each other type of health information, survey month (collapsed into 2‐month blocks), daily smoking status and other sociodemographic covariates. Regression analyses for wanting to quit excluded a further 4.8% of smokers who responded “don’t know” to this question |
|
| Funding source | “The full list of acknowledgements is available in Appendix 4.” | |
| Conflicts of interest | “No relevant disclosures”. | |
| Notes | ||
| Risk of bias | ||
| Bias | Authors' judgement | Support for judgement |
| Selective reporting (reporting bias) | Low risk | Comment: Uses ITC methods and questions and reports expected outcomes |
| Sampling Method | Low risk | Quote: “Briefly, we used a quota sampling design to recruit participants from communities served by 34 Aboriginal community‐controlled health services (ACCHSs) and one community in the Torres Strait (project sites), which were selected based on the population distribution of Aboriginal and Torres Strait Islander people by state or territory and remoteness.”,….”The baseline sample closely matched the sample distribution of the 2008 National Aboriginal and Torres Strait Islander Social Survey (NATSISS) by age, sex, jurisdiction and remoteness, and by number of cigarettes smoked per day for current daily smokers. However, there were inconsistent differences in some socioeconomic indicators: our sample had higher proportions of unemployed people, but also higher proportions who had completed Year 12 and who lived in more advantaged areas” Comment: Overall sample similar to 2008 national survey |
| Measurement of independent variable | Low risk | Comment: The date of the implementation of standardised packaging was known and well enforced |
| Measurement of dependent variable | Low risk | Quote: “Interviews were conducted face to face by trained interviewers, almost all of whom were members of the local Aboriginal and Torres Strait Islander community. The survey, entered directly onto a computer tablet” ….”As the TATS project is part of the International Tobacco Control Policy Evaluation Project (ITC Project), survey questions were based on ITC Project survey questions and are presented in Appendix 1” Comment: Appropriate methods and used previously tested ITC questions |
| Control for confounding | High risk | Comment: Enhanced pictorial warnings were implemented at the same time as standardised packaging so it is difficult to separate the effects. Hence confounding rated high even though other factors had been controlled for. |
| Incomplete outcome data (attrition bias) All outcomes | Unclear risk | Comment: little detail given |
| Statistical methods | Low risk | Comment: Appropriate |
Rousu 2013.
| Methods | Country: USA Setting: Grocery Stores, 4 cities Date: May ‐ September 2009 Design: Experimental field auction through grocery store intercepts |
|
| Participants | Tables were set up at grocery stores in 4 cities to conduct the field experiments: Selinsgrove, PA; Columbia, SC; Tampa, FL; and San Diego, CA. US adult smokers: age 18+, had smoked more than 100 cigarettes in their lifetimes and had smoked at least 1 cigarette in the past month. Posters invited people to attend in grocery stores with signs indicating they could earn USD 15 for 15 minutes of their time 402 participants, average age 38.0 years. 225 men (56%), 177 women (44%). 100% smokers |
|
| Interventions | IV: Experimental auctions. 4 HWL conditions, all with the same novel message (i.e. smoking causes mouth cancer), which was not at that time on US HWLs Labelling option 1: text‐only message that covered 50% of 1 side of the package (US policy at that time); Labelling option 2: text‐only message that covered 50% of the lower half of the front, back and 1 side of the package; Labelling option 3: text message with pictorial image of mouth cancer, covering 50% of the lower half of the front, back and 1 side of the package; Labelling option 4: the same text and pictorial image as in condition 3, but with all colour and symbolic brand elements removed (i.e. standardised packaging), aside from the brand font, size, and descriptors. Eligible participants were randomly assigned to bid on packs of cigarettes with different labelling options in 1 of 5 experimental manipulations:
Each of these experimental manipulations involved random ordering of pack presentation and bids All 4 HWL conditions were affixed to the 3 most popular brands within major product classes (i.e. Marlboro Red, Marlboro Lights, and Newport Menthol). At the beginning of the study, participants indicated their preference for full flavour, light, or mentholated cigarettes, and their subsequent participation involved bidding on the corresponding most popular brand within this preferred class. In other words, each participant bid only on Marlboro Red cigarettes, Marlboro Light cigarettes, or Newport Menthol cigarettes, depending on their preference Branded = labelling options 1 to 3. Standardised (plain) = labelling option 4. The pack was a beige colour and the font of the brand name and variant was not standardised |
|
| Outcomes |
[Secondary non‐behavioural]: Value Analysis summary: Field auctions. Data collected using Becker‐DeGroot‐Marschak auction mechanism – each participant given opportunity to examine product and asked to place bid on product reflecting how much they would be willing to pay. Participants chose which of the 3 brands they conducted the auction with. The goal was to estimate the percentage of US smokers that will decrease their demand for cigarette packs with pictorial labels and with standardised packaging relative to text‐only warnings, as well as to determine the factors that influence decreased demand. Both unconditional and conditional models were estimated to determine how smokers from different demographic groups and with different smoking‐related characteristics may be affected differently by labelling alternatives. To examine the possible impact of demographic and smoking related characteristics on whether a participant bid less for cigarettes that contained the more prominent label, the authors used probit models |
|
| Funding source | “The authors thank the Robert Wood Johnson Foundation for grant funding (grant #65166) to make this project possible.” | |
| Conflicts of interest | Not provided | |
| Notes | ||
| Risk of bias | ||
| Bias | Authors' judgement | Support for judgement |
| Selective reporting (reporting bias) | Low risk | Comment: Authors appear to have reported all planned outcomes |
| Sampling Method | High risk | Comment: Mall intercept.There were no statistical tests that showed whether there were group differences between the conditions |
| Measurement of independent variable | Low risk | Comment: Differences were clearly apparent in the packs presented. However, standardised packaging included the brand name being written in non‐standardised font and descriptors were included |
| Measurement of dependent variable | Low risk | Comment: Purchase of pack |
| Control for confounding | Low risk | Comment: possible confounders controlled for |
| Incomplete outcome data (attrition bias) All outcomes | Unclear risk | Comment: No response rate given |
| Statistical methods | Low risk | Comment: Appropriate |
Scollo 2015.
| Methods |
Country: Australia Setting: National Tobacco Plain Packaging Tracking Survey, Australia. Dual‐frame random‐digit dialling telephone surveys to landline and mobile phones.with approx 100 surveyed per week Date: 9 April 2012 ‐ 30 March 2014 Design: Observational. Continuous national cross‐sectional surveys |
|
| Participants | Adult smokers, 18 ‐ 69 years resident in Australia and contactable by landline or mobile telephone. ˜100 interviews completed each week; 8811 total. Average age 46.7 years; 4858 (55.1%) men. 7218 daily and 946 weekly or monthly cigarette (factory‐made or roll‐your‐own) smokers for the consumption outcome | |
| Interventions | IV: prior to standardised packaging introduction Branded = own brand prior to standardised packaging Standardised (plain) = Dark brown‐green colour (Pantone 448C), with the brand name in the same typeface (Lucida Sans) and font size and colour (Pantone Cool Gray 2C). 75% pictorial HW on front, 90% back |
|
| Outcomes |
[Primary]: Cigarette consumption between baseline and the 3 outcome periods. Daily, weekly and monthly cigarette smokers were asked how many cigarettes they smoked per day, week or month (respectively). For analysis, these were configured into cigarettes per day Analysis summary: Logistic and linear regression to assess changes between the pre‐standardised packaging period (April ‐ September 2012; n = 2223) and 3 subsequent time periods: the transition phase during which plain packages were being introduced into the Australian market (October and November 2012; n = 776); standardised packaging year 1 (December 2012 ‐ November 2013; n = 4431); and standardised packaging post‐tax (December 2013 ‐ March 2014; n = 1381). Linear regression used to assess changes in daily cigarette consumption for daily, weekly and monthly cigarette or roll‐your‐own smokers (configured into cigarettes per day). (Note: “All analyses were conducted in Stata V.12.1, adjusting for the effects of sample weighting on parameter estimates and SEs. In addition, an unconditional approach (ie, the ‘subpopulation’ command in Stata V.12.1) was used to limit the sample as appropriate for each set of analyses, ensuring correct estimation of the SEs.” All regression models controlled for sociodemographics. For analyses examining daily cigarette consumption, past 3‐month exposure to anti‐smoking campaigns aired on television during the survey period, as measured by Target Audience Rating Points (TARPs) for adults aged 18 and above, was also controlled for |
|
| Funding source | “The National Plain Packaging survey was funded under a contract with the Australian Government Department of Health and Ageing.” | |
| Conflicts of interest | “The authors wish to advise that MS was a technical writer for and MW a member of the Tobacco Working Group of the Australian National Preventive Health Task Force and MW was a member of the Expert Advisory Committee on Plain Packaging that advised the Australian Department of Health on research pertaining to the plain packaging legislation. MW holds competitive grant funding from the Australian National Health and Medical Research Council and MW holds competitive grant funding from the US National Institutes of Health, Australian National Preventive Health Agency and BUPA Health Foundation" | |
| Notes | To describe changes among smokers in use of various types of tobacco products, reported prices paid and cigarette consumption following standardisation tobacco packaging introduction Extraction supplemented by information from: Coomber K, Zacher M, Durkin S, Brennan E, Scollo M, Wakefield M/Myers P, Vickers N, Misson S. Australian National Tobacco Plain Packaging Tracking Survey: Technical Report. Prepared for Australian Government Department of Health. Centre for Behavioural Research in Cancer, Cancer Council Victoria/Social research Centre. March 2015 |
|
| Risk of bias | ||
| Bias | Authors' judgement | Support for judgement |
| Selective reporting (reporting bias) | Low risk | Comment: Data reported are as anticipated for study objectives |
| Sampling Method | Low risk | Quote: “As detailed in Wakefield et al…, a dual frame design using random digit dialling to landline and mobile phones was used, with an average adjusted response rate per 4‐week period of 57%.” Comment: Random‐digit dialling was employed. |
| Measurement of independent variable | Low risk | Comment: The date of the implementation of standardised packaging was known and well enforced, so it was possible to look for an effect on consumption |
| Measurement of dependent variable | Low risk | Quote from supplementary report on methodology: “Where possible, survey questions were drawn or adapted from established surveys” Comment: Used previously tested questions as appropriate |
| Control for confounding | High risk | Comment: Enhanced pictorial warnings were implemented at the same time as standardised packaging so it is difficult to separate the effects. Hence confounding rated high even though other factors had been controlled for |
| Incomplete outcome data (attrition bias) All outcomes | Unclear risk | Missing data exclusions included those who "did not provide a valid pack size (n = 231) and did not report a price (n = 413)" |
| Statistical methods | Low risk | Comment: Appropriate |
Shankleman 2015.
| Methods |
Country: UK Setting: City University, London Date: August 2013 Design: This study used a factorial (2x3) within‐participants design (but with participants randomised to different orders of conditions). 2 factors were varied: packaging style and type of health warning. Eye‐tracking study that compared branded vs standardised within participants, with the 6 different warnings appearing on the 6 standardised and the branded packs |
|
| Participants | 30 never‐smokers, (6 men (20%) and 24 women) aged between 19 and 40 years, mean age 23 (SD 4.4) from City University London, UK. Most were full‐time students. “Opportunity” recruitment (assume means opportunistic) | |
| Interventions | IV: The visual stimuli were identically sized branded or standardized cigarette packages Standardised (plain) = The appearance of the standardised pack images was based on the current Australian guidelines: the colour selected was Pantone 448C, and a white Helvetica typeface was used to denote the brand and brand variation. Branded = scanned copies of 6 popular brands currently available in the United Kingdom: Benson & Hedges, Camel, Lambert & Butler, Lucky Strike, Pall Mall, and Richmond WARNINGS: In the UK, warnings currently appear at the bottom of the pack, and differ in size between front and back. The authors opted to standardise all warnings to 40% of the pack size, approximating European regulations at the time of testing. The 2 black & white text warnings used were those currently employed on the front of cigarette packets in the UK: ‘Smoking Kills’ and ‘Smoking seriously harms you and others around you.’ The design implied matching these 2 black & white warnings with the same number of colour text and colour image & text warnings. Given that there are 15 colour health warnings currently in use on the back of cigarette packs in the UK (4 colour text and 11 colour image & text), 2 colour text and 2 colour image & text warnings were selected based on a pilot study |
|
| Outcomes |
[Secondary behavioural]: A model TX300 video eye tracker (Tobii Technology AB, Danderyd, Sweden) recorded eye gaze data from both eyes simultaneously at 120 Hz (i.e. 8.3 ms per sample). Gaze position was the mean proportion of a 5‐second viewing period spent gazing at the warning level region of the images of the cigarette packets Analysis summary: Data for each participant was copied to SPSS in order to assess group trends which were analysed with factorial (2x3) ANOVA using the general linear model repeated measures routine. The ANOVA tested the main effects of packaging style and warning type and the interaction between them. Greenhouse‐Geisser corrections were applied for violations of sphericity. The statistical significance for each category of warning label alone was tested (via t‐tests) in addition to factorial analysis |
|
| Funding source | “No specific funding was obtained for this study. KLM is funded by the Wellcome Trust (grant number 09401). KY is funded by the BBSRC (Grant Ref: BB/K01479X/1). These funders had no role in study design, the collection, analysis, and interpretation of data, the writing of the report, or the decision to submit the article for publication". | |
| Conflicts of interest | “All authors have completed the Unified Competing Interest form at www.icmje.org/coi_disclosure.pdf (available on request from the corresponding author) and declare no competing interests.” |
|
| Notes | Note: not all participants saw the same warnings, but these were not always viewed on the same brands of standardised and branded: In the main experiment, each participant saw the selected 6 warnings twice each, once on a branded pack and once on the standardised version of that same pack. To counter any associations between particular brands and particular warnings, a Latin square was used to generate 6 different possible pairings of the 6 brands with the 6 warning labels. Then participants were rotated through these pairings in counter‐balanced sets of 6, thus ensuring that each warning appeared equally often with each brand across the full sample of participants to investigate whether standardised cigarette packaging increases the time spent looking at health warnings, regardless of the format of those warnings. “Participants were told that the aim of the study was to examine attitudes towards cigarette packaging” |
|
| Risk of bias | ||
| Bias | Authors' judgement | Support for judgement |
| Selective reporting (reporting bias) | Low risk | Comment: Follows similar procedures established in eye‐tracking studies |
| Sampling Method | High risk | Quote “opportunity sampling” Comment: convenience sample |
| Measurement of independent variable | Low risk | Comment: Packs were clearly different for standardised and branded packaging |
| Measurement of dependent variable | Low risk | Quote: “A model TX300 video eye tracker (Tobii Technology AB, Danderyd, Sweden) recorded eye gaze data from both eyes simultaneously at 120 Hz (i.e. 8.3 ms per sample).” Comment: Objective measure – eye gaze |
| Control for confounding | High risk | One group only, plus for this study "The analysis was exactly as planned at the time of study design, except that further investigation of any effects by demographic subgroups was not possible due to the homoegeneity of the final sample." Comment: Unlike other similar studies, it did not adjust |
| Incomplete outcome data (attrition bias) All outcomes | Low risk | Quote: "32 participants were recruited through opportunity sampling at City University London. Two participants completed the experiment but were excluded from further analysis due to technical problems during eye tracking (n = 1; no eye position recoverable for > 50% of viewing time) or having smoked more than 100 cigarettes in their lifetime (n =1)." Comment: 30 of 32 participants recruited completed the study |
| Statistical methods | Low risk | Comment: Appropriate |
Wakefield 2008.
| Methods |
Country: Australia Setting: online Date: November, 2007 Design: This study employed a 3 (brand types) x6x4 (degree of standardised packaging) between‐participants experimental design using an internet online method to expose adult smokers to 1 randomly selected cigarette pack, after which respondents completed ratings of the pack |
|
| Participants | Panel originally sourced from various methods, including telephone interviews, face‐to‐face market research. Panel members emailed with web link to survey, given chance to win 1 of 10 shopping vouchers as incentive to participate. Adults aged 18 ‐ 49 years old, smoked at least weekly. The panel was broadly representative of Australian Bureau of Statistics norms in relation to geographical location, income and age. 813 smokers: 309 men (38%), 504 women (62%). 81% aged 30 years or older | |
| Interventions | IV: 4 packs, 1 branded and 3 standardised. The brand types were the 3 most popular Australian brand variants among adult smokers (Winfield Blue 25s; Peter Jackson Rich 30s; Longbeach Rich 40s) Standardised (plain): All standardised packs in generic pack of cardboard brown colour previously demonstrated to elicit Negative responses. 3 variations 1: maintains a branded font (i.e. original font size, style and position) and positioning of brand/descriptor; 2: brand name in a standard font in a prominent position on the pack with descriptor information in a standard font at the bottom; 3: brand name in a smaller standard font positioned at the bottom and ‘‘(xx number) cigarettes’’ in a larger font in a prominent position on the pack. Standardised pack 3 was the plainest Branded = Original pack (available for purchase at time of study) All pack conditions had the same graphic health warning visible on the top of the face of the pack as required by Australian Government legislation |
|
| Outcomes |
[Secondary non‐behavioural]: asked to rate the cigarette pack they were shown in relation to: brand image (the mental associations that are stimulated by the pack’s appearance alone); smoker attributions (anticipated personality/character type of the typical person who might be expected to regularly smoke the pack displayed); and inferred smoking experience (the type of smoking experience which might be anticipated from a cigarette contained in the displayed pack). When viewing the cigarette pack, respondents were asked to rate the following phrases describing attributes of the cigarette pack shown from 0 (not at all well) to 10 (extremely well). (For analysis, dichotomised to 0 ‐ 4 and 5 ‐ 10) ‘‘This pack …’’: ‘‘is a popular brand among smokers’’; ‘‘has an attractive looking pack’’; ‘‘is good value for money’’; ‘‘is an exclusive/expensive brand’’; and ‘‘is a brand you might try/smoke’’. Looking at the same pack, respondents were then asked to rate a number of attributes of typical smokers of the pictured cigarette pack from 0 (not at all) to 10 (extremely well). ‘‘A typical smoker of this pack is …’’: ‘‘trendy/stylish’’; ‘‘young’’; ‘‘masculine’’; ‘‘lower class’’; ‘‘sociable/outgoing’’; ‘‘older/ mature’’; and ‘‘confident/successful’’. Finally, looking at the same pack, respondents were asked to think about how a cigarette from the pictured pack might taste, and to rate the following descriptions on how well they relate to the pack shown from 0 (not at all) to 10 (extremely). ‘‘These cigarettes would taste …’’: ‘‘rich in tobacco flavour’’; ‘‘low in tar and nicotine’’; ‘‘of cheap tobacco’’; ‘‘satisfying’’; ‘‘like a light cigarette’’; ‘‘of the highest quality tobacco’’; and ‘‘harsh on the throat’’. Within each of the questions, attributes were presented randomly to avoid order effects Analysis summary: Eligible respondents were randomly allocated to view 1 of 12 pack conditions that varied by brand and extent of plain packaging. All pack conditions had the same graphic health warning visible on the top of the face of the pack. After viewing their assigned pack, respondents completed ratings of the pack in relation to perceived attributes of the brand, perceived attributes of smokers of the brand and expected taste/quality of the cigarette. The assigned pack was present on the screen as the smoker completed each of the ratings. Shown different images of packs and asked to rate them on a variety of elements (cigarette packs on attractiveness, brand imagery characteristics and, perceived sensory attributes)". Respondents were asked to rate the cigarette pack they were shown in relation to: brand image (the mental associations that are stimulated by the pack’s appearance alone); smoker attributions (anticipated personality/character type of the typical person who might be expected to regularly smoke the pack displayed); and inferred smoking experience (the type of smoking experience which might be anticipated from a cigarette contained in the displayed pack). When viewing the cigarette pack, respondents were asked to rate the following phrases describing attributes of the cigarette pack shown from 0 (not at all well) to 10 (extremely well) |
|
| Funding source | “This study was funded by Quit Victoria and the Cancer Council Victoria.MAW was supported by an Australian National Health and Medical Research Council Principal Research Fellowship.” | |
| Conflicts of interest | “None” | |
| Notes | ||
| Risk of bias | ||
| Bias | Authors' judgement | Support for judgement |
| Selective reporting (reporting bias) | Low risk | Comment: Authors appear to report all outcomes they set out to measure |
| Sampling Method | Low risk | Quote: "A sampling frame of adults aged 18–49 years was sourced from an existing national online
panel. The panel members were originally sourced from various methods including computer‐assisted telephone interviews and face‐to‐face market research, during which participants supplied their email address and gave permission to be contacted by email to participate in future research as well as through online marketing and other online databases.The panel was broadly representative of Australian Bureau of Statistics norms in relation to geographical location, income and age". Comment: A market research company sourced the panel, but the study reported it was broadly representative of the local population |
| Measurement of independent variable | Low risk | Comment: clearly distinguished different packs |
| Measurement of dependent variable | Low risk | Quote: "First, the use of an 11‐point response scale produced an irregular response distribution and we needed to dichotomise responses to conduct analysis. In future studies a more usual 5‐ point Likert scale with named response options would be preferred." Comment: little detail given but also a limitation of scales used |
| Control for confounding | Low risk | Quote: "Analysis of variance and x2 tests were used to check that random assignment yielded equivalent groups with respect to smoking history and demographic characteristics." Comment: These tests indicated in the table that the groups were similar |
| Statistical methods | Low risk | Comment: Appropriate |
Wakefield 2012.
| Methods |
Country: Australia Setting: Online Date: October ‐ November 2010 Design: A 3 (size of pictorial health warning) x2 (standardised vs branded) between‐participants experimental design |
|
| Participants | A sampling frame of adults (at least) weekly smokers aged 18+ years was sourced from a national online panel (www.iview.com.au). Panel members had participated previously in surveys, after which they had given permission to be contacted by e‐mail to participate in future research. Panel members who were smokers aged 18 or older were emailed an invitation to participate in a study about their opinions of a brand with which they might be familiar. Respondents were given a chance to win 1 of 10 AUD 100 shopping vouchers as an incentive 1203 participants. 538 men (44.7%) |
|
| Interventions | IV: different sized health warnings and standardised vs branded packs 3 pictorial health warning sizes: 30% vs. 70% or 100%. 3 current Australian graphic health warnings that had evaluated strongly in a government evaluation were included: ‘Smoking causes peripheral vascular disease’; ‘Smoking causes throat and mouth cancer’; and ‘Smoking harms unborn babies’ Branding = Within their assigned pack condition, each respondent was exposed to 6 different brands to improve generalisability of results. These brands were the 2 most popular ‘mainstream’ Australian brands (Peter Jackson Rich and Winfield Blue), the 2 most popular ‘value’ brands (Horizon Blue and Longbeach Rich), the most popular ‘premium’ brand (Benson & Hedges Smooth) and the largest‐selling international brand (Marlboro Red). In total, 216 separate digital images of packs were created in Adobe Photoshop, manipulating branding/ plainness, size of health warning and specific warning message, presented across 6 different brands Standardised = Brown real pack Respondents were allocated randomly to view 1 of 6 pack conditions that varied by size (30%, 70% or 100%) of front‐of‐pack pictorial health warning and presence/absence of branding. After random assignment to 1 of these pack conditions, participants consecutively viewed and rated 6 cigarette brands within their pack condition ‐ 3 current health warnings were included on the packs. In total, 216 separate digital images of packs were created in Adobe Photoshop, manipulating branding/plainness, warning size and specific warning message, presented across 6 different brands |
|
| Outcomes |
[Secondary non‐behavioural]: Positive pack characteristics: (combined measure from: popular among smokers, attractive, sophisticated, brand you might try/smoke); positive smoker characteristics: (combined measure from: trendy, successful); negative smoker characteristics (boring); positive taste characteristics: (combined measure from: enjoyable to smoke, satisfying in taste); negative harm characteristics (combined measure from: high in tar, harmful to your health). Attitudes to smoking were ‘How much do you feel like having a cigarette right now?’ and ‘How much do you feel like quitting today?’ and ‘How likely are you to be smoking cigarettes a year from now' and 'I regret having started smoking', 'The health effects of smoking are exaggerated', 'I get a lot of pleasure out of smoking', 'Smoking is a disgusting habit'. 'Which pack would you be most tempted to buy?' Analysis summary: When viewing each brand, respondents were asked to rate it on visual analogue scales from 0 (‘not at all well’) to 10 (‘extremely well’) on a number of attributes. To assess effects on these rating outcomes, 2‐way ANOVAs examined the main effects of pack plainness and size of pictorial health warning, and interactions between plainness and size of PHW. Main effects of age group (18–29 years versus 30 + years) on pack ratings were also assessed using ANOVAs, including interactions between age and plainness of pack, age and warning size, and a 3‐way interaction between age, plainness of pack and warning size. Main and interaction effects of plainness of pack and warning size on purchase intent, attitudes toward smoking and smoking intentions were investigated by logistic regression analysis. Where multiple pairwise comparisons were conducted, Bonferroni adjustments were made |
|
| Funding source | “This study was funded by project grant no. 623203 from the Australian National Health and Medical Research Council (NHMRC). Melanie Wakefield was funded by an NHMRC Principal Research Fellowship. David Hammond was funded by a Canadian Institutes for Health Research New Investigator Award (Hammond) and a Canadian Cancer Society Research Institute Junior Investigator Research Award (Hammond).” | |
| Conflicts of interest | “There are no conflicts of interest.” | |
| Notes | ||
| Risk of bias | ||
| Bias | Authors' judgement | Support for judgement |
| Selective reporting (reporting bias) | Low risk | Comment: appear to be in line with aims |
| Sampling Method | Unclear risk | Quote: "A sampling frame of adults aged 18 years and over was sourced from a national online panel (http:// www.iview.com.au). Panel members had participated previously in surveys, after which they had given permission to be contacted by e‐mail to participate in future research." Comment: not much detail given on intended sample size etc., size of national panel etc. |
| Measurement of independent variable | Low risk | Comment: packs were easily distinguishable |
| Measurement of dependent variable | Unclear risk | Comment: not enough detail given on provenance of measures |
| Control for confounding | Low risk | Comment: groups in this experiment appeared broadly equivalent |
| Incomplete outcome data (attrition bias) All outcomes | Unclear risk | COmment: not enough detail given |
| Statistical methods | Low risk | Comment: Appropriate |
Wakefield 2013.
| Methods |
Country: Australia Setting: State of Victoria Date: Nov 2012 ‐ Dec 2012 Design: Cross‐sectional survey via computer‐assisted telephone interviews |
|
| Participants | Representative sample of adults aged 18 years and over, residing in the general population of the Australian state of Victoria; current smokers of cigarettes, pipes and/or cigars (daily, weekly or less than weekly. RYO could also be included. All had to have a usual brand of cigarettes that they were or had used prior to the intro of plain packaging (72.3% were smoking from a plain pack and 27.7% were smoking from a branded pack) Part of Victorian Smoking and Health Survey – cross‐sectional telephone survey undertaken annually. Computer‐assisted telephone interviews were conducted using a dual‐frame survey design incorporating samples generated by random‐digit dialling to landline and mobile phones. In 45% of cases where it was possible to match landline phone numbers to residential addresses, primary approach letters were posted prior to the phone call to give notice of a ‘community survey of health attitudes and behaviours’. 536 participants, average age 40.2 years, 303 men (56.6%) |
|
| Interventions | IV: Branded vs standardised Branded = Own regular pack brand: Branded pack used by participants. (30% front of pack graphic health warnings) Standardised (plain) = Dark brown‐green colour (Pantone 448C), with the brand name in the same typeface (Lucida Sans) and font size and colour (Pantone Cool Gray 2C). 75% pictorial HW on front, 90% on back |
|
| Outcomes |
[Secondary non‐behavioural]: thinking about quitting, seriously considering quitting, planning to quit, quitting priority, harm perceptions (frequency of thinking about harm your smoking might be doing to you and would you agree dangers of smoking have been exaggerated), brand satisfaction, brand quality Analysis summary: First compared the characteristics of those smoking from standardised and branded packs using bivariate logistic regression for binary variables and analysis of variance for continuous outcomes. Variables associated with standardised or branded pack use at P < 0.25 were included as covariates in multivariate logistic regression analyses to examine whether current possession of a standardised pack compared with a branded pack was associated with the above outcome measures and in analysis of covariance to determine if smoking from a standardised pack was associated with higher ratings of quitting as a life priority. A third set of models additionally controlled for the proportion of the sample interviewed during each survey week who reported smoking from a standardised pack. Did this to control for the extent to which, as the survey period progressed, smokers would have been increasingly exposed to plain packs in their social networks, even though they may not have been personally smoking from one. Finally, in a sensitivity analysis, repeated all analyses for brand‐loyal smokers, defined as those who had been smoking the same brand for a year. (Model 1: SES, daily consumption levels, recalled at least 1 anti‐smoking advertisement, brand segment and previous quit attempts; Model 2: SES, daily consumption levels, recalled at least 1 antismoking advertisement, brand segment, previous quit attempts, covariates, proportion of sample smoking from a plain pack each week of the interview) |
|
| Funding source | “This study was funded by Quit Victoria. The researchers declare that they are independent from the funder. The funder had no influence on the overall study design or on the decision to submit the paper for publication.” | |
| Conflicts of interest | “LH and SD had financial support from Quit Victoria for the submitted work.” | |
| Notes | ||
| Risk of bias | ||
| Bias | Authors' judgement | Support for judgement |
| Selective reporting (reporting bias) | Low risk | Quote: "The Victorian Smoking and Health Survey is a crosssectional telephone survey undertaken annually with a representative sample of adults aged 18 years and over, residing in the general population of the Australian state of Victoria." Comment: Authors appear to report all prespecified outcomes and report results in full for 3 different statistical models |
| Sampling Method | Low risk | Comment: Representative survey conducted as part of ongoing annual health survey |
| Measurement of independent variable | Low risk | Quote: “To ascertain exposure to the new plain packs, current cigarette smokers who reported smoking their usual FMC or RYO brand were asked: “Is the cigarette/tobacco pack you are currently smoking one of the new dark brown packs which has all of its logos removed and a large picture health warning on the front?”" Comment: clear question to distinguish branded vs standardised packs |
| Measurement of dependent variable | Low risk | Comment: Unclear how questions were assessed and validated but face validity appears high |
| Control for confounding | Low risk | Comment: Multiple models tested for multivariate regression analysis including measures thought to influence outcomes |
| Incomplete outcome data (attrition bias) All outcomes | Low risk | Quote: "The overall response rate, defined as completed interviews as a proportion of the sample who could be contacted within the call cycle and who were identified as eligible for the survey, was 63%” Comment: Reasonable response rate |
| Statistical methods | Low risk | Comment: Appropriate |
Wakefield 2015.
| Methods |
Country: Australia Setting: National Tobacco Plain Packaging Tracking Survey, Australia. Dual‐frame random digit dialling telephone surveys to landline and mobile phones, with approx 100 surveyed per week Date: April 2012 – November 2013 inclusive (Corresponding to 6 months prestandardised packaging (April – September 2012), 2 months of transition (October/November 2012) and 1 year after full implementation (December 2012 – November 2013)) Design: Observational.continuous cross‐sectional surveys |
|
| Participants | 7175 cigarette smokers (weighted; unweighted n = 7133). 149 respondents who did not provide valid data on all demographic covariates were excluded. Men: 3933 participants (Pre: n = 1191 (55%); Transition: n = 416 (55%); 1‐year: n = 2326 (55%)). Women: 3241; (Pre‐PP: n = 985 (45%): Transition: n = 342 (45%); 1‐year: n = 1914 (45%)). Respondents were recruited using a dual‐frame sample design, with half of all respondents approached via landline random‐digit dialling (RDD) and half by mobile phone RDD. For the landline sample, to correct for over‐representation of older female at‐home respondents, interviewers asked to speak to the youngest male aged 18 – 69 years, and if not available, the youngest female. Further detail available in a Technical Report but a continuous cross‐section design with an average of 100 interviews completed per week. Telephone interviews with adult smokers of factory‐made or roll‐your‐own cigarettes (respondents who smoked daily or weekly, or who smoked monthly or less‐than monthly and self‐identified as smokers) and recent quitters (quit in the last year) were conducted in English | |
| Interventions | IV: Own brand vs standardised packaging before, during and after standardised packaging implementation Branded = own brand Standardised (plain) = Dark brown‐green colour (Pantone 448C), with the brand name in the same typeface (Lucida Sans) and font size and colour (Pantone Cool Gray 2C). 75% pictorial HW on front, 90% back |
|
| Outcomes |
[Secondary behavioural]: Avoidant responses were measured with 2 questions: whether in the past month they had asked for a pack with a different health warning on it (yes vs no) and how often in the past month they had covered up or concealed their pack or put their cigarettes in another container (several or many times vs other responses) Questionnaire measures were adapted from other population surveys such as the Australian arm of the International Tobacco Control survey (www.itcproject.org/surveys) and tapped similar constructs to those used in past studies to assess appeal, health warning effectiveness and perceived harm. To test whether outcomes differed between 3 phases of standardised packaging implementation (pre‐PP (referent), transition and during plain packaging (PP year 1)), a series of unadjusted and adjusted logistic regression analysis were used [Secondary non‐behavioural]: As a general measure of overall appeal, the extent to which respondents liked the look of their current pack was rated on a 5‐point scale from ‘strongly agree’ to ‘strongly disagree’ (dichotomised into disagree/strongly disagree vs neither/agree/strongly agree). Smokers were also asked to rate their current cigarettes or tobacco as ‘higher’, ‘lower’ or ‘about the same’ compared with a year ago, in terms of quality, satisfaction, value for money and appeal of the packaging (coded as lower than a year ago vs higher/about the same). Additionally, smokers were asked whether or not there were differences between brands in prestige (no vs yes/do not know) and on a 4‐point scale from ‘not at all different’ to ‘very different’, how different cigarette brands were in taste (not at all different vs a little/somewhat/very different/do not know) Analysis summary: All adjusted models included HSI, demographic characteristics, recent antismoking campaign activity and change in cigarette price as covariates. Data were weighted to account for telephony status (landline or mobile phone), gender, age by education and state of residence (see Supplementary Technical report). All statistical analyses were conducted using Stata V.12.1 using weighted data (using the svy command with ‘p’ weights). In addition, an unconditional approach (i.e. the ‘subpopulation’ command in Stata V.12.1) was used to limit the sample as appropriate for each set of analyses, ensuring correct estimation of the SEs. To test whether outcomes differed between 3 phases of plain packaging implementation (pre‐ (referent), transition and during standardised packaging (PP year 1)), a series of unadjusted and adjusted logistic regression analysis. All adjusted models included HSI, demographic characteristics, recent antismoking campaign activity and change in cigarette price as covariates. Interactions were tested between phase (pre‐ vs PP year 1) and age (18 – 29; 30 – 49; 50 – 69 years), sex and SES (low, mid and high) for all outcomes. For the post‐year 1 phase, the form of change over time was assessed by examining adjusted regression models that included linear and quadratic terms for month. The presence of a significant linear term within post‐year 1 indicates a significant linear increase (or decrease) within the year, while the additional presence of a significant quadratic term signifies the increase (or decrease) was curvilinear over the months, that is, that it reached a peak (or trough) and then declined (increased) again. Finally, sensitivity testing examined whether the inclusion season variables influenced the pattern of observed findings in adjusted models |
|
| Funding source | “The National Plain Packaging Tracking survey was funded under a contract with the Australian Government Department of Health and Ageing.” | |
| Conflicts of interest | “The authors wish to advise that MW was a member and MS a technical writer for the Tobacco Working Group of the Australian National Preventive Health Task Force and MW was a member of the Expert Advisory Committee on Plain Packaging that advised the Australian Department of Health on research pertaining to the plain packaging legislation. MW, SD and EB hold competitive grant funding from the Australian National Health and Medical Research Council and MW holds competitive grant funding from the US National Institutes of Health, Australian National Preventive Health Agency and BUPA Health Foundation.” | |
| Notes | ||
| Risk of bias | ||
| Bias | Authors' judgement | Support for judgement |
| Selective reporting (reporting bias) | Low risk | Comment: All outcomes were as expected and also as stated in aims. Outcomes were given for whole sample |
| Sampling Method | Low risk | Quote: "Respondents were recruited using a dual‐frame sample design, with half of all respondents approached via landline random digit dialling (RDD) and half by mobile phone RDD" Comment: Random‐digit dialling |
| Measurement of independent variable | Low risk | Comment: The date of the implementation of standardised packaging was known and well enforced |
| Measurement of dependent variable | Low risk | Quote: “Questionnaire measures were adapted from other population surveys such as the Australian arm of the International Tobacco Control survey (http://www.itcproject.org/surveys) and tapped similar constructs to those used in past studies to assess appeal, health warning effectiveness and perceived harm” Comment: Standardised and tested questions were used |
| Control for confounding | High risk | Comment: Enhanced pictorial warnings were implemented at the same time as standardised packaging so it is difficult to separate the effects. Hence confounding rated high even though other factors had been controlled for. |
| Incomplete outcome data (attrition bias) All outcomes | Low risk | Comment: possible confounders were controlled for |
| Statistical methods | Low risk | Comment: Appropriate |
White 2012.
| Methods | Country: Brazil Setting: Online Date: May ‐ June 2011 Design: Between‐participants online experimental study. Participants were randomly assigned to 1 of 3 experimental conditions (branded vs standardised vs standardised with no descriptors) |
|
| Participants | 640 young women (16 – 26 years) from Brazil, including smokers and non‐smokers. Participants were recruited from an online panel through Global Market Insite, Inc. (GMI), a commercial market research company with a panel reach of over 350,000 Brazilians. The panel included residents living in any region of Brazil. While the sample may not have necessarily been representative of the entire female young adult population in Brazil, the sample does represent a national heterogeneous group of young women Average age = 22.4 years; 184 smokers (28.4%) |
|
| Interventions | IV: = 3 conditions: standardised pack with no descriptors vs standardised pack with descriptors vs branded pack Branded = 10 female‐oriented brands were selected for the current study, including 4 brands sold in Brazil (Virginia Slims Silver, Dunhill Carlton – Carlton Mint Blend, Vogue Bleue and Marlboro Gold Original), and 6 other leading international cigarette brands (Peel Sweet Melon, John Player Special Pink, Benson & Hedges Superslims Park Avenue, DJ Mix Strawberry Flavor, Silk Cut Superslims Menthol, and Capri Baunilha). Brands were purposely selected to feature different colour descriptors (silver, gold, blue, and pink) and flavour descriptors (baunilha/vanilla, strawberry, mint, sweet melon, and menthol), as well as other descriptors such as superslims. Packages that featured “traditional” female colour schemes, including the use of pink, light green, light blue, and white, as well as smaller pack shapes, were also selected. Standardised (plain) = Condition 2: Brown “plain” packages: the same packages with all brand imagery removed, including colours and graphics, but with brand descriptors maintained; or Condition 3: “plain‐no descriptors” packages: the same packages with both descriptors and imagery removed Portuguese text was digitally added to packages with English‐only text to ensure that participants who could only read Portuguese would be able to distinguish the packages in the standardised condition and the standardised‐no descriptors condition. Since pictorial health warning labels are only shown on the back side of the package in Brazil, these were not visible to the participants in any of the images shown. The order in which the packages were viewed was counter‐balanced across participants |
|
| Outcomes |
[Secondary non‐behavioural]: Brand ratings Participants were asked to rate each of the 10 packages “compared to other brands you can buy in stores” on 4 measures: 1) brand appeal; 2) perceived taste; 3) health risk; and 4) smoothness. Responses were provided on a 5‐point Likert scale (e.g. 1 = “A lot more appealing” to 5 = “A lot less appealing”) and were subsequently recoded into a binary variable as either a 1 (“a little”/“a lot more appealing”) or 0 (“a little”/“a lot less appealing” and “no difference”). A summary index rating was created for each of the 4 brand rating measures, by summing scores across the 10 packages to yield a score between 0 and 10, where the number corresponded to the total number of packs rated as more appealing/better taste/less harmful/ smoother on the throat. Pack selection task. Prior to the conclusion of the study, participants were told that as a thank‐you gift for completing the survey, they could, if they wished, select a pack they would like to be sent from a choice of 4 cigarette packages shown on the screen. Participants were shown 4 packages: 2 branded packages and 2 standardised packages, regardless of the condition they were assigned to earlier in the survey. Packs were drawn at random from those displayed previously. The participants had the option to select 1 of the 4 packages shown, or select an “I do not wish to receive a package” option, prominently displayed on the screen. Immediately after making their selection, the participants were informed that no packages would be mailed as the investigators did not want to endorse smoking Analysis summary: Chi2 tests were used to assess differences in key sociodemographic factors between experimental conditions. Logistic regression models were used to examine the effect of the experimental conditions for single packages on the 4 brand attributes, and to examine the extent to which participants selected a pack (branded or plain) in the pack selection task. Linear regression models were used to examine the effect of the experimental conditions on each of the 4 brand attribute and 6 smoker image index variables, including the overall “positive smoker image index” |
|
| Funding source | "Financial support for this project was provided by the National Institutes of Health (grant number 1 P01 CA138‐389‐01), a Canadian Institutes of Health Research New Investigator Award (Hammond), the Canadian Cancer Society Research Institute Junior Investigator Award (Hammond), and the Propel Centre for Population Health Impact. Additional support was provided by the Ontario Tobacco Research Unit (OTRU) Ashley Studentship for Research in Tobacco Control (White), a Canadian Institute for Health Research (CIHR) Banting and Best Canada Graduate Scholarship (White), an Ontario Graduate Scholarship (White), a CIHR Training Grant Program in Population Intervention for Chronic Disease Prevention: A Pan‐Canadian Program Award (White), a Senior Investigator Award from the Ontario Institute for Cancer Research (Fong), and a Prevention Scientist Award from the Canadian Cancer Society Research Institute (Fong)." | |
| Conflicts of interest | “The authors declare that they have no competing interests” | |
| Notes | ||
| Risk of bias | ||
| Bias | Authors' judgement | Support for judgement |
| Selective reporting (reporting bias) | Low risk | Comment: results reflect aims and are as expected |
| Sampling Method | High risk | Quote: "Participants were recruited from an online panel through Global Market Insite, Inc. (GMI), a commercial market research company with a panel reach of over 350,000 Brazilians. The panel included residents living in any region of Brazil. While the sample may not have necessarily been representative of the entire female young adult population in Brazil, the sample does represent a national heterogeneous group of young women…. Panel members were invited to participate in the online survey via e‐mail, but were not informed about the purpose of the study……' 'Participants in this study were not recruited through random sampling and were limited to individuals with internet access. In 2011, Brazil had an internet penetration of 41%, or almost 76 million people [31]. Individuals with internet access likely have a higher degree of education and literacy than the general population. In addition, the self‐reported smoking prevalence in our sample (28.4%) was higher than national smoking prevalence estimates for young women. Therefore, the findings may not generalize to the broader population of female youth in Brazil" Comment: some evidence that the sampling method resulted in bias |
| Measurement of independent variable | Low risk | Comment: packs were distinctive |
| Measurement of dependent variable | Low risk | Quote: "All key measures including those for the brand ratings, smoker image ratings and pack selection task were adapted from previous research [16] and were translated into Portuguese by two independent bilingual translators.Cognitive pre‐testing of the survey was conducted to ensure that the translated questions conveyed the intended meaning in a clear manner that minimized response error" Comment: measures had been used in other studies and cognitive testing was used to check comprehension |
| Control for confounding | Low risk | Comment: only ethnicity of the measures tested differed across groups and analyses controlled for ethnicity and other potential confounders |
| Statistical methods | Low risk | Comment: Appropriate |
White 2015a.
| Methods |
Country: Australia Setting: Cross‐sectional school‐based surveys of adolescents in 2 Australian states conducted in 2011 and 2013 Date: 2011: June ‐ December. 2013: June ‐ November Design: Pre‐post survey sesign. 2 serial cross‐sectional surveys |
|
| Participants | A representative sample of Australian students aged 12 – 17 years in year levels 7 – 12. School principals were sent an invitation letter seeking consent for study participation. School samples 2011 Survey Schools were randomly selected from the 3 main Australian education sectors (government, Catholic and independent) to ensure proportional representation The 2011 data come from the states’ component of a national triennial survey of a representative sample of Australian students aged 12 – 17 years in year levels 7 – 12. The 2013 survey was separate from the national study, although it drew on the procedures and samples of the 2011 survey used. Parents sent a consent letter for their child's participation. On an agreed day external research staff attended the school to administer the pencil‐and‐paper questionnaire to the preselected classes of students, during school time Sample analysed here: saw cigarette packs in previous 6 months (weighted data): 2011: n = 3888 (61%), 2013: n = 3852 (65%) Boys 2011: 1672 (43%); 2013: 1887 (49%) Girls 2011: 2216 (57%); 2013:1965 (51%) Current smokers: 2011: 466 (12%), 2013: 308 (8%); experimental: 2011: 894 (23%), 2012: 693 (18%); combined current and experimental: 2011:1361 (35%), 2013: 1002 (26%) |
|
| Interventions | IV: branded vs standardised in Australia Branded = As before standardised packaging was introduced Standardised (plain) = dark brown‐green colour (Pantone 448C), with the brand name in the same typeface (Lucida Sans) and font size and colour (Pantone Cool Gray 2C). 75% pictorial HW on front, 90% back |
|
| Outcomes |
First publication [Secondary behavioural]: Students indicated how frequently they had not had a cigarette because of the warnings [Secondary non‐behavioural]: thinking about quitting; cognitive processing of warnings: how frequenty participants: read; paid close attention to; thought about and talked about the warning labels using a 5‐point scale: (1) ‘never’; (2) ‘once or twice'; (3) ‘sometimes’; (4) ‘often’ and (5) ‘every time I see them.’ In addition, students indicated how frequently they had not had a cigarette because of the warnings. Students who had smoked in the previous 12 months were asked how frequently they thought about quitting smoking because of the warnings. Perceptions of the health consequences of smoking: In both surveys, students were presented with the same list of 18 items and asked to indicate whether they agreed or disagreed that they were caused by smoking, using a 5‐point Likert scale Analysis summary: Data from students who had seen a cigarette pack in the previous 6 months were used. Logistic regression analyses compared proportions across the 2 surveys. Linear regression analyses examined change in the cognitive processing variables between the surveys Second publication [Secondary non‐behavioural]: 1) Brand character ratings: students were presented with a photographic image of each of 4 brands of Australian cigarettes and asked to include their level of agreement with 3 statements about the brand and the pack: this brand appeals to me, the pack looks good, the pack looks ugly; 3 statements about people who smoke the brand: are cool, are successful, are daggy (uncool). Responses on a 5‐point scale ranging from strongly agree to strongly disagree with 'not sure' in the middle. Brands were 3 most commonly smoked by Australian adolescents (Winfield, Peter Jackson, Longbeach) and a premium brand (B&H) which was fifth most commonly smoked in 2011. All images included a GHW as mandated at that time, with the same health warning used for each pack image within a survey year (eg, ‘Smoking causes mouth and throat cancer’ in 2011; ‘Smoking causes mouth cancer’ in 2013). For each brand, responses for the 6 items were summed with items recoded where necessary such that higher scores indicated a positive view (range 6 – 30). (Cronbach’s α for each brand in each year was adequate: 2011 range: 0.77 – 0.78; 2013 range: 0.73 – 0.75). 2) Attraction of cigarette packs (appeal outcome): indicated their level of agreement to 4 positive (‘cool’, ‘good’, ‘interesting’, ‘exciting’),and 4 negative (‘ugly’, ‘daggy (uncool)’, ‘gross’, disgusting’) descriptions of cigarette packs using a 5‐point scale. Students could also respond that they ‘cannot comment’ with these responses coded as missing. Positive and negative subscale scores were created by taking the average of the 5‐point ratings for the items on each scale. Both scales have good internal reliability with internal reliability for the current study high (positive pack image scale: α = 0.85; negative pack image scale: α = 0.78) Brand differences (harm and appeal outcomes): extent to which standardised packaging may be associated with a reduction in perceived differences in brands in harm and harm‐related outcomes, as well as 1 appeal outcome. Students indicated their level of agreement to 5 statements reflecting that some brands of cigarettes are: ‘easier to smoke than others’, ‘more addictive than others’, ‘easier to quit than others’, ‘have more harmful substances in them than others’ and ‘have better looking packs than others’. Students could also give a ‘don’t know’ (5) response. Items were recoded into 3 categories: ‘strongly agree/agree’, ‘strongly disagree/disagree’ and ‘don’t know’. Analysis summary: Analyses focus on data from students aged 12 – 17 years as this is the typical age range for secondary students in Australia. To correct for any oversampling or undersampling of students within age, sex and education sector groups, data were weighted to reflect the number of male and female students of each age enrolled in each education section in each state in each survey year. Analyses adjusted for clustering of students within schools and robust SEs were used. Generalised linear regression models tested the change in scores across survey years for brand character ratings and positive and negative pack image ratings. Multinomial logistic regression examined change in the distribution of responses for the 3‐level categorical variables assessing brand differences. Smoking status, age, sex, school education sector and state were included as covariates in analyses examining effect of year. When the effect of year was significant, its interaction with smoking status was fitted to determine if the effect was consistent across smoking status groups. Students with missing data on variables were excluded from relevant analyses. Examined whether adjusting for parental consent procedures and parental and friend smoking altered the pattern of results by repeating all analyses controlling for these variables |
|
| Funding source | “Data used in this study were gathered from surveys funded fully or in part by the Australian Government Department of Health and Ageing. Cancer Councils and health departments of participating states also contributed funding for the 2011 surveys” | |
| Conflicts of interest | “The authors wish to advise that MW was a member of the Tobacco Working Group of the Australian National Preventive Health Task Force and the Expert Advisory Committee on Plain Packaging that advised the Australian Department of Health on research pertaining to the plain packaging legislation. VW holds competitive grant funding from the Victorian Cancer Agency and the National Breast Cancer Foundation, VW and MW hold such funding from the Australian National Health and Medical Research Council and MW holds such funding from the US National Institutes of Health, Australian National Preventive Health Agency and BUPA Health Foundation.” | |
| Notes | ||
| Risk of bias | ||
| Bias | Authors' judgement | Support for judgement |
| Selective reporting (reporting bias) | Low risk | Comment: Consistent with aims |
| Sampling Method | Low risk | Quote: "Schools were randomly selected from the three main Australian education sectors (government, Catholic and independent) to ensure proportional representation. Principals consented to study
participation and when a school declined, it was replaced with the school geographically closest to the original school within the same education sector"...."Schools were approached regarding surveying one class of students from each of years 7–10 (age 12–15) or two classes of students from each of years 11 and 12 (age 16 and 17). Researchers worked with each school to ensure selected classes were representative of all classes (eg, no electives)." ... "In both states in 2011 and in one state in 2013, parents were informed about the study and asked to let the school know if they did not want their child to participate. Owing to requirements stipulated by the education authorities governing government
and Catholic schools in the second state in 2013, an active parental consent procedure was used. In this procedure, parents were informed about the study and provided written consent to the school for the student’s participation. While active parental consent procedures reduce student participation numbers and increase the statistical intraclass correlation, substance use estimates
are similar to those found with passive parental consent."..."The pattern of results reported above was replicated in both sets of sensitivity analyses." Comment: Methods employed were appropriate for school surveys and schools were randomly selected. Consent procedure changed at 2013. Sensitivity analyses produced the same pattern of results as reported below. The cross‐sectional samples were quite different, the only variable they did not differ on was 'father smokes' but most of these attributes were included as covariates in the anayses |
| Measurement of independent variable | Low risk | Comment: The date of the implementation of standardised packaging was known and well enforced |
| Measurement of dependent variable | Low risk | Quote: "Items used for this investigation were taken from larger surveys in both years" Comment: Measures were commonly‐used questions used in several other studies |
| Control for confounding | High risk | Comment: Enhanced pictorial warnings were implemented at the same time as standardised packaging so it is difficult to separate the effects. Hence confounding rated high even though other factors had been controlled for |
| Incomplete outcome data (attrition bias) All outcomes | Low risk | Comment: 2011 30% response rate; 2013 – for same sample surveyed in 2011 60%; 38% for new schools approached. Weighted data and adjusted results presented |
| Statistical methods | Low risk | Comment: Appropriate |
Yong 2015.
| Methods |
Country: Australia Setting: National phone or web surveys (International Tobacco Control Policy Evaluation Project) Date: Wave 1: September 2011 ‐ February 2012; Wave 2: February ‐ May 2013 Design: Pre‐post longitudinal cohort study |
|
| Participants | Nationally representative (random digit dialling) probability sample of smokers aged 18+ (smoked at least 100 cigs in lifetime; smoked at least once in past 30 days). Participants were recruited by telephone (random‐digit dialling), but they could choose to complete the survey by phone or by web Wave 1: n = 1104, Wave 2: n = 1093 (Note: 1525 unique individuals (853 with 1 data point and 672 with 2 data points) who provided a total of 2197 person‐wave observations for GEE analyses) Pre‐ Mean age = 46.24 Post‐ Mean age = 48.48 GEE sample Mean = 47.35 Men: Wave 1: 502; Wave 2: 507 Women: Wave 1: 602; Wave 2: 586 |
|
| Interventions | IV: own brands vs standardised Branded = own brands before standardised packaging implementation Standardised (plain) = Dark brown‐green colour (Pantone 448C), with the brand name in the same typeface (Lucida Sans) and font size and colour (Pantone Cool Gray 2C). 75% pictorial HW on front, 90% back |
|
| Outcomes |
[Secondary behavioural]: forgoing cigarettes and avoidance behaviours [Secondary non‐behavioural]: 1) quit intentions. At each wave, assessed smokers’ quit intentions using the question: “Are you planning to quit smoking—within the next month, within the next 6 months, sometime in the future beyond 6 months, or are you not planning to quit?”.2) HWL salience. Assessed using 2 questions: “In the last month, how often, if at all, have you noticed the warning labels on cigarette packages?”; and “In the last month, how often, if at all, have you read or looked closely at the warning labels on cigarette packages?”, both rated on a 5‐point response scale from ‘never’ to ‘very often’. Initial exploratory analyses indicated that the policy changes had different effects on the 2 measures, thus they were used as separate measures rather than combined into a scale. 3) HWL cognitive reactions. Assessed using 3 questions: “To what extent, if at all, do the warning labels make you think about the health risks of smoking?”; “To what extent, if at all, do the warning labels on cigarette packs make you more likely to quit smoking?”; “In the past 6 months, have warning labels on cigarette packages led you to think about quitting?”. The first 2 questions had response options: “Not at all, A little, Somewhat, and A lot” and the last one had: “Not at all, Somewhat, and Very much.” Responses to the 3 questions were combined into a scale by averaging them. 4) HWL behavioural reactions. Assessed using 2 questions, 1 assessing forgoing behaviour: “In the last month, have the warning labels stopped you from having a cigarette when you were about to smoke one?” (Never, Once, A few times, Many times); and the other assessing avoidance behaviour “In the last month have you made any effort to avoid looking at or thinking about the warning labels—such as covering them up, keeping them out of sight, using a cigarette case, avoiding certain warnings, or any other means?” (Yes/No) N.B. Attentional orientation (AO) When you look at a cigarette pack, what do you usually notice first—the warning labels, or other aspects of the pack, such as branding?” Analysis summary: Smokers’ reactions and avoidance orientation (AO) to health warnings (HWLs) pre‐implementation and post‐implementation of the standardised packaging and enhanced health warnings law, were computed for descriptive purposes using weighted data. GEE models were employed to examine pre–post changes by testing for significant main effect of survey wave while controlling for sociodemographic and smoking‐related variables. Dichotomous outcome variables such as avoidance and AO were modelled using binomial distribution with logit link function. Outcome variables such as noticing, reading, cognitive reactions, forgoing and quit intentions were treated as quasilinear and modelled as continuous variables using Gaussian distribution with identity link function as initial exploration indicated that these variables when dichotomised were less sensitive in detecting an effect due to loss of information. Parameters were estimated using unstructured correlation structure with robust variance estimation procedure. GEE modelling of pre–post changes was limited to smokers only (both recontacted and newly‐recruited smokers) at both survey waves, as ex‐smokers are less likely to be exposed to the pack HWLs. To examine whether the pre–post changes differed by AO patterns, difference scores were employed as outcomes and linear regression analyses conducted (since the difference scores were generally normally distributed) to test for group differences in outcomes by regressing the difference scores onto a dummy variable used to represent the 4 different patterns of change across waves in AO towards the HWLs (i.e. brand‐brand; brand‐warning; warning‐brand and warning‐warning). For ease of interpretation, a relevant subgroup was chosen as the reference group for comparison purposes. This set of analyses included only smokers who provided data on both survey waves. To assess effects of attrition, baseline differences were examined in covariates between those retained and lost and found those lost to the study were more likely to be highly educated, complete a phone survey and be recruited into the study in the year before the baseline wave. These variables were controlled for in all regression analyses. Finally, additional GEE analyses were conducted to examine associations of upstream HWL reactions and AO with warning‐stimulated cognitive reactions (midstream outcome) and quit intentions (downstream outcome), to determine whether the strength of the associations differed between pre‐policy and post‐policy implementation by testing for any significant interactions between survey year and reactions on the outcome of interest |
|
| Funding source | “The ITC Four Country Survey is supported by multiple grants including R01 CA100362, P50 CA111236 (Roswell Park Transdisciplinary Tobacco Use Research Centre), P01 CA138389 (Medical University of South Carolina), P30 CA138313 (Hollings Cancer Center Support Grant, Medical University of South Carolina) and an ITC pilot study grant (Medical University of South Carolina), all funded by the National Cancer Institute of the USA, Robert Wood Johnson Foundation (045734), Canadian Institutes of Health Research (57897, 79551), National Health and Medical Research Council of Australia (265903, 450110, APP1005922), Cancer Research UK (C312/A3726), Canadian Tobacco Control Research Initiative (014578) and Centre for Behavioural Research and Program Evaluation, National Cancer Institute of Canada/Canadian Cancer Society.” | |
| Conflicts of interest | “KMC has served in the past and continues to serve as a paid expert witness for plaintiffs in litigation against the tobacco industry. GTF and JFT have each served as a paid expert witness or consulting expert for governments in countries whose policies are being challenged by parties under trade agreements. DH has served as an expert witness on behalf of national governments in legal challenges to packaging regulations, as well as an advisor to regulatory agencies for tobacco packaging policies. RB was a member of an expert advisory committee that advised the Australian government on the research done to support the introduction of the plain packaging legislation.” | |
| Notes | ||
| Risk of bias | ||
| Bias | Authors' judgement | Support for judgement |
| Selective reporting (reporting bias) | Low risk | Comment: objectives as expected and reported |
| Sampling Method | Low risk | Comment: random‐digit dialling, could be completed by phone or web |
| Measurement of independent variable | Low risk | Comment: The date of the implementation of standardised packaging was known and well enforced |
| Measurement of dependent variable | Low risk | Comment: used commonly‐used measures |
| Control for confounding | High risk | Comment: Enhanced pictorial warnings were implemented at the same time as standardised packaging so it is difficult to separate the effects. Hence confounding rated high even though other factors had been controlled for. |
| Incomplete outcome data (attrition bias) All outcomes | Low risk | Quote: "To assess effects of attrition, we examined baseline differences in covariates between those retained (n=788) and those lost (n=316) and found those lost to the study were more likely to be highly educated (p=0.04), complete a phone survey(p<0.001) and be recruited into the study in the year before the baseline wave (p=0.006). These variables were controlled for in all regression analyses." Comment: Controlled for differences between those followed up and those not in analyses |
| Statistical methods | Low risk | Comment: Appropriate |
Young 2014.
| Methods |
Country: Australia Setting: Analysed phone call logs to National Quitline in New South Wales and the Australian Capital Territory (ACT). Date: April 2004 ‐ 28 February 2006; and 1 March 2006 ‐ 31 March 2013 Call data from 1 April 2004 ‐ 28 February 2006 were provided by Macquarie Telecom (Sydney, Australia) and from 1 March 2006 ‐ 31 March 2013 by the Telstra Analyser (Telstra, Melbourne, Australia) Design: Interrupted time‐series design |
|
| Participants | Quitline is a free resource that can be used by smokers who are motivated and seeking support to quit. Calls from NSW and ACT were involved | |
| Interventions | IV: own brand vs standardised brands. Branded = own brands Standardised (plain) = Dark brown‐green colour (Pantone 448C), with the brand name in the same typeface (Lucida Sans) and font size and colour (Pantone Cool Gray 2C). 75% pictorial HW on frton, 90% on back. |
|
| Outcomes |
[Secondary behavioural]: Calls to Quitline (indirect measure of quit attempts) Analysis summary: As the data for weekly number of calls to the Quitline were autocorrelated (each value was correlated with the previous value) autoregressive integrated moving average (ARIMA) analysis in SAS version 9.3 (SAS Institute Inc) were used. ARIMA models enabled the investigation of changes over time while accounting for seasonal variation and background trends in such things as the effects of television anti‐tobacco advertising, changes in cigarette pricing relative to weekly earnings and number of smokers in the community. In ARIMA modelling, comprising model investigation, estimation and diagnostic checking, the methods of Box et al (Appendix; online at mja.com.au) were followed. A single model fitted to the entire 7‐year period of Quitline call data did not meet technical criteria for model fit. Therefore, separate models that included data for 12 months before and 6 months after each intervention (1 March 2005 ‐ 1 September 2006 and 1 October 2011 ‐ 1 April 2013) were fitted, as this was the longest duration of follow‐up for tobacco plain packaging available at the time of the study |
|
| Funding source | "This study was internally funded by the Cancer Institute NSW." | |
| Conflicts of interest | "No relevant disclosures." | |
| Notes | ||
| Risk of bias | ||
| Bias | Authors' judgement | Support for judgement |
| Selective reporting (reporting bias) | Low risk | Comment: objectives as would be expected for this study |
| Sampling Method | Low risk | Quote: "Whole‐of‐opulation interrupted time‐series analysis in New South Wales and the Australian Capital Territory between 1 March 2005 and October 2006 for the comparator, graphic health warnings, and October 2011 and April 2013 for the intervention of interest, tobacco plain packaging" Comment: Used all calls data |
| Measurement of independent variable | Low risk | Comment: The date of the implementation of standardised packaging was known and well enforced |
| Measurement of dependent variable | Low risk | Quote: "Call data from 1 April 2004 to 28 February 2006 were provided by Macquarie Telecom (Sydney, Australia) and from 1 March 2006 to 31 March 2013 byt he Telstra Analyser (Telstra, Melbouren, Australia)" Comment: objective dependent variable.Calls data were provided from the telecoms companies involved |
| Control for confounding | High risk | Comment: Enhanced pictorial warnings were implemented at the same time as standardised packaging so it is difficult to separate the effects. Hence confounding rated high even though other factors had been controlled for |
| Incomplete outcome data (attrition bias) All outcomes | Low risk | Comment: Other possible confounders were controlled for |
| Statistical methods | Low risk | Comment: Appropriate |
Zacher 2014.
| Methods |
Country: Australia Setting: 25 café strips: 18 Melbourne suburbs; 7 Adelaide suburbs Date: mid‐October 2012 ‐ mid‐April 2013. (Pre‐study carried out mid‐October 2011 ‐ mid‐April 2012) Design: Observational study convenience sample pre and during/post standardised packaging (PP) implementation |
|
| Participants | No recruitment of participants: passive observation only. Selection of locations: For the pre‐standardised packaging phase, street segments were selected (referred to as ‘café strips’) from a range of socioeconomic areas in Melbourne and Adelaide that were known to have many popular cafés, restaurants and bars. Fieldworkers sampled every venue in their assigned café strip/s which had outdoor seating visible from the footpath. New venues were added to the sample if they had opened between phases. 520 unique venues of which 480 venues allowed smoking and had patrons present at least once in either phase. At least 1 patron was present for 2391 observations pre‐PP and for 2219 observations post‐PP (total n = 4610) | |
| Interventions | Branded = pre‐PP, branded packs and 30% front‐of‐pack warnings and 90% back‐of‐pack warnings. Standardised (plain) = 75% front‐of‐pack warnings and 90% back‐of‐pack warnings. Set of 14 HW: Dark brown‐green colour (Pantone 448C), with the brand name in the same typeface (Lucida Sans) and font size and colour (Pantone Cool Gray 2C). New set of 14 warnings divided into 2 sets to be rotated after 12 months (so 7 new warnings during the post‐ phase of this study) | |
| Outcomes |
[Secondary behavioural): At each café strip venue, fieldworkers recorded observations using notepads/smartphone data collection applications, including: (1) number of people smoking or holding/rolling/lighting a cigarette. Package display was recorded slightly differently in each phase. Pre‐standardised packaging , fieldworkers noted: (2) number of packages visible on the table; (3) number of packages orientated (a) face‐down; (b) standing on their side, top or bottom; (c) in a case or tin (not the original packaging); (d) completely concealed by a telephone, wallet or some other object, so that the fieldworker was unable to ascertain its orientation; (e) with an unknown orientation (i.e. too far away/inadvertently obscured) Post‐standardised packaging phase: fieldworkers noted the same things, but separately for fully‐branded packs, PPs and packs of unknown packaging. 5c ‐ 5e classified as unknown packaging Analysis summary: Multi‐level Poisson models were employed to test the effect of phase (pre‐ or post‐standardised packaging) on the prevalence of pack display among patrons. Random intercepts were included for café strip and venue in all models to adjust SEs for correlations among observations within the same venue and among venues within the same café strip. In order to analyse the data as the rate of packs to patrons, the count of patrons was used as an offset term, meaning that for an observation (i.e. 1 for each venue in each wave) to be included in the analysis at least 1 patron had to be present. The rates of smokers to patrons and packs to active smokers were tested similarly, using appropriate offset terms (patrons and active smokers, respectively). The analysis of packs to active smokers excluded observations where no active smokers were recorded, due to the offset term. For each outcome, unadjusted models were first run, followed by models adjusting for city, SES, presence of children, month, day/time, temperature and wind speed. A series of analyses were then conducted (using the adjusted models) to examine interactions between phase and city, SES, presence of children and day/time to determine whether or not the rates of packs to patrons and smokers to patrons changed more between phases in some situations than others. To determine whether any effects were absent in October/November (when plain packs were first emerging onto the market) but present or stronger in December onwards (when all packs sold were required to be plainly packaged), a 2‐category variable was also created for month, comparing October/November to December–April observations, and tested its interaction with phase. Multi‐level Poisson models were then used to examine whether phase had any effect on face‐up pack orientation, concealment or external case use. Compared rates of face‐up orientation and pack concealment among fully‐branded packs pre‐standardised packaging to rates among plain packs post‐standardised packaging, excluding packs in external cases and packs in unknown orientations from the total count of packs pre‐standardised packaging to ensure that rates had comparable denominators in both phases. Only observations for which at least 1 known‐orientation fully‐branded (pre‐ PP) or plain (post‐PP) pack was recorded were included in these analyses due to the offset term. The rate of case use was analysed for all observed packs in both phases, because the authors could not determine whether the original package was fully branded or standardised; accordingly, at least one pack had to be observed for an observation to be included in the analysis. Interactions between phase and covariates were also examined. A sensitivity analysis was then conducted, limiting the sample to venues which were open for business in both the pre‐ and post‐PP phases. The analytical procedure mirrored the steps for the main analysis |
|
| Funding source | “This study was funded by Cancer Council Victoria, Cancer Council South Australia, and Quit Victoria.” | |
| Conflicts of interest | “None” | |
| Notes | ||
| Risk of bias | ||
| Bias | Authors' judgement | Support for judgement |
| Selective reporting (reporting bias) | Low risk | Comment: This built on a previous study (Wakefield 2013) and objectives for this study were as expected |
| Sampling Method | High risk | Quote: “in October 2011, we selected a convenience sample of 25 cafe strips'...'Our results were consistent even when limiting the sample to stores that were observed in both phases, suggesting that the findings were not biased by inclusion of slightly different stores before and after plain packaging” Comment: Convenience sample. Selection of location remained consistent over the pre‐ and post‐ time periods. Findings did not change when new stores were included |
| Measurement of independent variable | Low risk | Comment: Australia, law enforced |
| Measurement of dependent variable | Low risk | Quote: “We used Krippendorff’s alpha, which is valid for count data, to calculate inter‐rater reliability for numbers of patrons, active smokers, packs and packs orientated face‐up, and the presence of children. The alpha scores for most outcomes were high (patrons: α = 0.998; smokers: α = 0.897; packs: α = 0.895; presence of children: α = 1.000). For face‐up pack orientation, an acceptable alpha of 0.795 was achieved overall, and limiting the analysis to venues with consistent observations for number of packs observed resulted in an alpha of 0.881.“ ….“The strength of this study is that, unlike survey questions on pack display behaviour, our measures are objective and not subject to recall or social desirability biases. Observational methods similar to those used in this study have been shown to be accurate [23–25], and our measures of inter‐rater reliability were acceptable to high.” Comment: Methods for observations appear sound and reliability high |
| Control for confounding | High risk | Comment: Enhanced pictorial warnings were implemented at the same time as standardised packaging so it is difficult to separate the effects. Hence confounding rated high even though other factors had been controlled for. |
| Incomplete outcome data (attrition bias) All outcomes | Low risk | Quote: “Our results were consistent even when limiting the sample to stores that were observed in both phases, suggesting that the findings were not biased by inclusion of slightly different stores before and after plain packaging” Comment: When analyses were restricted to those present in both phases of data collection, the results were consistent. |
| Statistical methods | Low risk | Comment: Appropriate |
Zacher 2015.
| Methods |
Country: Australia Setting: 2 cities: 18 suburbs in Melbourne and 7 Adelaid. Outdoor tables at café, restaurant, and bars Date: January ‐ April 2012 (pre‐ standardised packaging), mid‐October 2012 ‐ mid‐April 2013 (early post‐standardised packaging) and mid‐January ‐ mid‐April 2014 (1 year post‐standardisec packaging). Design: Observational pre‐post standardised packaging study |
|
| Participants | No recruitment of participants: passive observation only. Selection of locations: For the pre‐PP phase, street segments were selected (referred to as ‘café strips’) from a range of socioeconomic areas in Melbourne and Adelaide that were known to have many popular cafés, restaurants and bars. Fieldworkers sampled every venue in their assigned café strip/s which had outdoor seating visible from the footpath. New venues were added to the sample if they had opened between phases. 585 unique venues were observed over the course of the study, of which 519 venues had patrons present at least once. Patrons were present at a total of 3947 observations: pre‐standardised packaging ( n = 1340); early post‐standardised packaging ( n = 1296); 1 year post‐standardised packaging (n = 1311). Fewer venue observations were used in analyses of the rates of packs to active smokers (n = 1195), face‐up and concealed packs to known‐orientation branded (pre‐) or standardised (post‐) packs (n = 1381), and external cases to all packs (n = 1470) | |
| Interventions | Branded = pre‐, branded packs and 30% front‐of‐pack warnings and 90% back‐of‐pack warnings remained. Standardised (plain) = 75% front‐of‐pack warnings and 90% back‐of‐pack warnings. Set of 14 HW. Dark brown‐green colour (Pantone 448C), with the brand name in the same typeface (Lucida Sans) and font size and colour (Pantone Cool Gray 2C). New set of 14 warnings divided into 2 sets to be rotated after 12 months (so 7 new warnings during the post‐ phase of this study) | |
| Outcomes |
[Secondary behavioural]: Rate of pack display on café tables Similar to Zacher 2014 (267), at each venue, fieldworkers recorded observations using notepads/smartphone data collection applications, including counting: the number of seated patrons, patrons smoking, holding or lighting a cigarette (‘active smokers’), and tobacco packs, noting the pack type in the post‐standardised packaging phases (branded, standardised or unknown). They also recorded whether children were present, how many packs were oriented face‐up with the brand name and variant visible, face‐down, standing or on their side or concealed by an object like a wallet or phone (by pack type), and how many packs were in an unknown orientation due to distance or an external case (not recorded by pack type) Analysis summary: Data from the 5 waves in each of the 3 phases that were conducted between January and April. Preliminary analyses confirmed that restricting the pre‐standardised packaging and early post‐standardised packaging periods to the 5 waves of data did not substantially change the results from those previously published for these periods. Multilevel Poisson models were employed in Stata 12.14 to test whether outcomes of interest 1 year post‐standardised packaging were different from pre‐ and early post‐ phases. Bonferroni‐adjusted P values to account for multiple comparisons were carried out. Random intercepts were included for café strip and venue in all models to adjust SEs for correlations among venues within the same café strip and for multiple observations over time within the same venue. All models adjusted for city, area SES using an Index of Relative Disadvantage, presence of children, month, day and time, temperature, and wind speed. To analyse outcomes as rates, offset terms were used. Number of patrons was the offset term for the rates of packs to patrons and smokers to patrons; at least 1 patron had to be recorded for an observation to be analysed. Similarly, number of smokers was the offset for the rate of packs to smokers, and only observations with 1 or more smokers present were included. Rates of face‐up orientation and pack concealment among branded packs pre‐ were compared to rates among standardised packs post‐. Only observations for which at least 1 known‐orientation branded (pre‐) or plain (early or 1‐year post‐standardised packaging) pack was recorded were analysed. The rate of external case use was analysed out of all observed packs; accordingly, at least 1 pack had to be observed to be analysed. Also tested whether declines in pack display and active smoking among patrons between pre‐ and 1‐year post‐ were again greater in venues with children present than in those without. Finally, sensitivity analyses were conducted to assess whether excluding venues which were not observed in all 3 phases altered the results |
|
| Funding source | “This study was funded by Cancer Council Victoria, Cancer Council South Australia, South Australian Health and Medical Research Institute, and Quit Victoria.” | |
| Conflicts of interest | “The authors wish to advise that MW was a member and MS a technical writer for the Tobacco Working Group of the Australian National Preventive Health Task Force and MW was a member of the Expert Advisory Committee on Plain Packaging that advised the Australian Department of Health on research pertaining to the plain packaging legislation. MW, SD and EB hold competitive grant funding from the Australian National Health and Medical Research Council, MW and CM hold such funding from Cancer Council South Australia and MW holds such funding from the US National Institutes of Health, Australian National Preventive Health Agency and BUPA Health Foundation” | |
| Notes | From 1 October 2012, all tobacco packages manufactured in Australia were required to comply with plain packaging legislation. From 1 December 2012 all packs sold had to comply | |
| Risk of bias | ||
| Bias | Authors' judgement | Support for judgement |
| Selective reporting (reporting bias) | Low risk | Comment: This built on 2 previous studies (Wakefield 2013; Zacher 2014) and objectives for this study follow those and as expected |
| Sampling Method | High risk | Quote: "Our results were consistent when when imiting the sample to stores that were observed in both phases, suggsting that the findings were not biased by inclusion of slightly different stores before and after plain packaging" Comment: Convenience sample. Selection of location remained consistent over the pre‐ and post‐ time periods. Findings did not change when new stores were included |
| Measurement of independent variable | Low risk | Comment: Australia, law enforced |
| Measurement of dependent variable | Low risk | Quote: ”Details regarding sample selection and data collection for the pre and early post phases have been described elsewhere and similar methods were used for the 1 year post phase”…”fieldworkers conducted nine waves of observations at approximately 2‐week intervals, achieving high interrater reliability.” Comment: Methods for observations were used in previous studies and Zacher 2014 involved reliability measures using Krippendorff’s alpha which had high scores. Methods for observations appear sound and reliability high, however this was not reported for the final phase of measurement in this study |
| Control for confounding | High risk | Comment: Enhanced pictorial warnings were implemented at the same time as standardised packaging so it is difficult to separate the effects. Hence confounding rated high even though other factors had been controlled for |
| Incomplete outcome data (attrition bias) All outcomes | Low risk | Quote: “Finally, we conducted sensitivity analyses to assess whether excluding venues which were not observed in all three phases altered our results”….” Of the 519 venues observed that had patrons present at least once, 10 were not observed in one or both of the post phases, as they banned smoking in outdoor areas, and an additional 161 venues were not open for business in all three phases. Sensitivity analyses excluding all observations from venues which banned smoking outdoors or which were not open for business in all three phases obtained results similar to those of the main analysis.” Comment: Results were not affected when analyses were restricted to venues included in all phases of the study |
| Statistical methods | Low risk | Comment: Appropriate |
DV: Dependent variable GEE: generalised estimating equation GHW: graphic health warnings HSI: Heaviness of Smoking Index HW: health warning ITC: International Tobacco Control Policy Evaluation Study IV: Intervention
OR: odds ratio PHW: pictorial health warning RYO: roll‐your‐own SD: standard deviation SE: standard error SES: socioeconomic status SLT: smokeless tobacco SP: standardised packaging TPD: Tobacco Products Directive
Characteristics of excluded studies [ordered by study ID]
| Study | Reason for exclusion |
|---|---|
| Bayly 2015 | Did not measure primary or secondary outcomes as described for this review (outcomes) |
| Chester 2013 | Study design excluded (qualitative) |
| Davidson 2014 | Did not measure primary or secondary outcomes as described for this review (outcomes) |
| Fooks 2013 | Study design excluded (qualitative) |
| Ford 2014 | Study design excluded (qualitative) |
| Gallopel‐Morvan 2015c | Study design excluded (qualitative) |
| Gendall 2011 | Study does not assess the impact of changes in tobacco packaging/does not assess plain packs |
| Gendall 2012 | Study design excluded (qualitative) |
| Griffin 2010 | Study design excluded (qualitative) |
| Henriksen 2012 | Study does not assess the impact of changes in tobacco packaging/does not assess plain packs |
| Hoek 2012 | Study design excluded (qualitative) |
| Hoek 2013 | Did not measure primary or secondary outcomes as described for this review (outcomes) |
| Mannocci 2015 | Did not measure primary or secondary outcomes as described for this review (outcomes) |
| Martin 2014 | Study does not assess the impact of changes in tobacco packaging/does not assess plain packs |
| Moodie 2011a | Study design excluded (qualitative) |
| Moodie 2012b | Study design excluded (qualitative) |
| Scheffels 2008 | Study design excluded (qualitative) |
| Scheffels 2013 | Study design excluded (qualitative) |
Characteristics of studies awaiting assessment [ordered by study ID]
Dunlop 2016.
| Methods | Not yet assessed in full (published after search date); not anticipated to impact conclusions |
| Participants | |
| Interventions | |
| Outcomes | |
| Notes |
Gallopel‐Morvan in press.
| Methods | Not yet assessed in full (published after search date); not anticipated to impact conclusions |
| Participants | |
| Interventions | |
| Outcomes | |
| Notes |
Maddox 2016.
| Methods | Not yet assessed in full (published after search date); not anticipated to impact conclusions |
| Participants | |
| Interventions | |
| Outcomes | |
| Notes |
Maynard 2016.
| Methods | Not yet assessed in full (published after search date); not anticipated to impact conclusions |
| Participants | |
| Interventions | |
| Outcomes | |
| Notes |
Mutti 2016.
| Methods | Not yet assessed in full (published after search date); not anticipated to impact conclusions |
| Participants | |
| Interventions | |
| Outcomes | |
| Notes |
Nonnemaker 2016.
| Methods | Not yet assessed in full (published after search date); not anticipated to impact conclusions |
| Participants | |
| Interventions | |
| Outcomes | |
| Notes |
Schuz 2016.
| Methods | Not yet assessed in full (published after search date); not anticipated to impact conclusions |
| Participants | |
| Interventions | |
| Outcomes | |
| Notes |
Skaczkowski 2017.
| Methods | Not yet assessed in full (published after search date); not anticipated to impact conclusions |
| Participants | |
| Interventions | |
| Outcomes | |
| Notes |
Characteristics of ongoing studies [ordered by study ID]
Bogdanovica 2016.
| Trial name or title | Study of the effects of standardised packaging and the 2014 European Union Tobacco Products Directive on tobacco product pricing, consumption and smoking prevalence |
| Methods | |
| Participants | |
| Interventions | |
| Outcomes | |
| Starting date | Fellowship. Finishes 2022 |
| Contact information | |
| Notes |
Diethelm 2016.
| Trial name or title | Re‐analysis of tobacco‐industry funded research on the effect of plain packaging on minors in Australia |
| Methods | |
| Participants | |
| Interventions | |
| Outcomes | |
| Starting date | |
| Contact information | |
| Notes | Similar to Diethelm 2015, planned re‐analysis of industry‐funded research on the effect of plain packaging on minors |
Gilmore 2016.
| Trial name or title | Using Nielsen data to evaluate the impact of standardised packaging of tobacco in the UK |
| Methods | |
| Participants | |
| Interventions | |
| Outcomes | |
| Starting date | 2016 (finishes 2019) |
| Contact information | |
| Notes |
Hitchman/Moodie 2015.
| Trial name or title | Adult Tobacco Policy Survey. An evaluation of standardised packaging in the UK |
| Methods | |
| Participants | |
| Interventions | |
| Outcomes | |
| Starting date | 2014 ‐ 2016 |
| Contact information | |
| Notes |
Differences between protocol and review
We had originally planned to conduct two reviews of standardised packaging, one looking at its impact on current users and one looking at its impact on uptake in non‐users. However, we subsequently decided to merge the two reviews, given that many relevant studies and outcomes addressed both groups of participants. We therefore merged the two protocols and published a new one, namely McNeill 2016.
As set out in McNeill 2016, we had originally planned to assess all outcomes to investigate any differences based on demographics (gender, age, socio‐economic status, ethnicity). However, due to the volume of data and heterogeneity between included studies this was not feasible. Secondary analyses stemming from this review could include such variables. In addition, we made the following changes: deletion of several databases listed in the search methods section (e.g. Conference Papers Index, Index to Theses (UK and Ireland)) which had been erroneously entered into the protocol; providing further detail on our methods for assessing non‐randomized studies; and change in the outcomes presented in the summary of findings table from “all outcomes” to “primary outcomes and change in quit attempts.”
Finally, in the full review, we also clarified some points that were not clear in the initial protocol but which we had planned from the outset. First, we added the statement that studies had to have measured at least one primary or secondary outcome to be included in the review. Secondly, we explicitly list additional types of secondary outcomes (eye tracking; actual purchase or selection of tobacco that participants believed that they would receive; craving). Thirdly, we clarified that outcomes were measured according to methods of individual studies
Contributions of authors
Design of the review was principally led by AM, SH and JHB. Screening was conducted by AM, SH, JHB and SG. All authors conducted data extraction. Analysis and write‐up were led by AM and JHB with contributions from all authors.
Sources of support
Internal sources
-
University of Oxford, UK.
provides salary, office space and library resources for JHB
-
King's College London, UK.
provides salary, office space and library resources for AM and SH
-
University of Waterloo, Canada.
provide salary, office space and library resources for DH and SG
-
University of Stirling, UK.
provides part‐time salary (3 days per week), office space and library resources for LB
-
Cancer Research UK, UK.
provides part‐time salary (2 days per week), office space and library resources for LB
-
Canadian Cancer Society, Canada.
provides partial salary support for SG via a career development award
External sources
-
National Institute of Health Research (NIHR), UK.
supports the Cochrane Tobacco Addiction Group and provides funding for JHB. The NIHR Cochrane Incentive Scheme also provided specific funding for completion of this review [15/81/04]. The views and opinions expressed therein are those of the authors and do not necessarily reflect those of the Cochrane Incentive Scheme, NIHR, NHS or the Department of Health.
Declarations of interest
AM is a trustee of, and receives grants from, various organisations whose goal is to reduce the mortality and morbidity caused by smoking and which support the implementation of a comprehensive tobacco control strategy including measures such as standardised packaging. The opinions of these organisations do not affect this review.
SG receives grants from organisations whose goal is to reduce the mortality and morbidity caused by smoking. The opinions of these organisations do not affect this review.
SCH receives grants from various organisations whose goal is to reduce the mortality and morbidity caused by smoking and which support the implementation of a comprehensive tobacco control strategy including measures such as standardised packaging. SCH has also received grants for the study of cigarette packaging. The opinions of these organisations do not affect this review.
LB receives grants from various organisations whose goal is to reduce the mortality and morbidity caused by smoking and which support the implementation of a comprehensive tobacco control strategy including measures such as standardised packaging. The opinions of these organisations do not affect this review.
DH has received research grants on studies of cigarette packaging. He has also served as a consultant, paid speaker and Advisor to a number of agencies involved in tobacco policy, including Health Canada, the European Commission, the UK Department of Health, and the US Centers for Disease Control and Prevention. He has served as a paid expert witness in several cases associated with the tobacco industry, including on behalf governments in Australia, the UK, and Ireland in plain packaging legal challenges. The opinions of these organisations do not affect this review.
JHB has no known conflicts of interest.
These authors contributed equally to this work
These authors contributed equally to this work
New
References
References to studies included in this review
Adkison 2014 {published data only}
- Adkison SE, Bansal‐Travers M, Smith DM, O'Connor RJ, Hyland AJ. Impact of smokeless tobacco packaging on perceptions and beliefs among youth, young adults, and adults in the U.S: Findings from an internet‐based cross‐sectional survey. Harm Reduction Journal 2014;11:2. [DOI: 10.1186/1477-7517-11-2] [DOI] [PMC free article] [PubMed] [Google Scholar]
Al Hamdani 2013 {published data only}
- Al‐Hamdani M. The effect of cigarette plain packaging on individuals' health warning recall. Healthcare Policy 2013;8(3):68‐77. [PMC free article] [PubMed] [Google Scholar]
Babineau 2015 {published data only}
- Babineau K, Clancy L. Young people's perceptions of tobacco packaging: a comparison of EU Tobacco Products Directive & Ireland's Standardisation of Tobacco Act. BMJ Open 2015;5:e007352. [DOI] [PMC free article] [PubMed] [Google Scholar]
Balmford 2015 {published data only}
- Balmford J, Borland R, Yong HH. Impact of the introduction of standardised packaging on smokers' brand awareness and identification in Australia. Drug and Alcohol Review 2015 Sep 15 [Epub ahead of print]. [DOI: 10.1111/dar.12331] [DOI] [PMC free article] [PubMed]
Bansal‐Travers 2011 {published data only}
- Bansal‐Travers M, Hammond D, Smith P, Cummings KM. The impact of cigarette pack design, descriptors, and warning labels on risk perception in the U.S. American Journal of Preventive Medicine 2011;40(6):674‐82. [DOI] [PMC free article] [PubMed] [Google Scholar]
Borland 2013 {published data only}
- Borland R, Savvas S, Sharkie F, Moore K. The impact of structural packaging design on young adult smokers' perceptions of tobacco products. Tobacco Control 2013;22(2):97‐102. [DOI] [PubMed] [Google Scholar]
Brennan 2015 {published data only}
- Brennan E, Durkin S, Coomber K, Zacher M, Scollo M, Wakefield M. Are quitting‐related cognitions and behaviours predicted by proximal responses to plain packaging with larger health warnings? Findings from a national cohort study with Australian adult smokers. Tobacco Control 2015;24:II33‐41. [DOI] [PMC free article] [PubMed] [Google Scholar]
Brose 2014 {published data only}
- Brose LS, Chong CB, Aspinall E, Michie S, McEwen A. Effects of standardised cigarette packaging on craving, motivation to stop and perceptions of cigarettes and packs. Psychology & Health 2014;29(7):849‐60. [DOI] [PubMed] [Google Scholar]
Chow 2015 {published data only}
- Chow CS, Kaynak E, Mak W. The effect of plain packaging format in cigarette labeling on smoking intent and brand likability among young non‐smokers in Macau. Asia Pacific Journal of Marketing and Logistics 2015;27:23‐39. [Google Scholar]
Diethelm 2015 {published data only}
- Chipty T. Study of the impact of the tobacco plain packaging measure on smoking prevalence in Australia. Appendix A. In: Australian Government Department of Health. Post‐Implementation Review. Tobacco Plain Packaging. 2016. 24 January 2016.
- Diethelm PA, Farley TM. Refuting tobacco‐industry funded research: empirical data shows decline in smoking prevalence following introduction of plain packaging in Australia. www.tobaccopreventioncessation.com/Refuting‐tobacco‐industry‐funded‐research‐empirical‐data‐shows‐decline‐in‐smoking‐prevalence‐following‐introduction‐of‐plain‐packaging‐in‐Australia,60650,0,2.htmlTobacco Prevention & Cessation 2015 November (accessed 7th March 2017); Vol. 1.
- Kaul A, Wolf M. The (possible) effect of plain packaging on smoking prevalence in Australia: a trend analysis. Working paper, available from www.econ.uzh.ch/static/workingpapers.php?id=828 2014 (accessed 7th March 2017).
Doxey 2011 {published data only}
- Doxey J, Hammond D. Deadly in pink: the impact of cigarette packaging among young women. Tobacco Control 2011;20(5):353‐60. [DOI] [PubMed] [Google Scholar]
Dunlop 2015 {published data only}
- Dunlop SM, Dobbins T, Young JM, Perez D, CurrowD C. Impact of Australia's introduction of tobacco plain packs on adult smokers' pack‐related perceptions and responses: results from a continuous tracking survey.[Erratum appears in BMJ Open. 2015;5(8):e005836corr1; PMID: 26243550]. BMJ Open 2014;4:e005836. [DOI] [PMC free article] [PubMed] [Google Scholar]
Durkin 2015 {published data only}
- Durkin S, Brennan E, Coomber K, Zacher M, Scollo M, Wakefield M. Short‐term changes in quitting‐related cognitions and behaviours after the implementation of plain packaging with larger health warnings: findings from a national cohort study with Australian adult smokers. Tobacco Control 2015;24:II26‐32. [DOI] [PMC free article] [PubMed] [Google Scholar]
Ford 2013 {published data only}
- Ford A, MacKintosh AM, Moodie C, Richardson S, Hastings G. Cigarette pack design and adolescent smoking susceptibility: A cross‐sectional survey. BMJ Open 2013;3(9):e003282. [DOI] [PMC free article] [PubMed] [Google Scholar]
Gallopel‐Morvan 2011 {published data only}
- Gallopel‐Morvan K, Béguinot E, Eker F, Martinet Y, Hammond D. Perception de l’efficacité des paquets de cigarettes standardisés. Une étude dans un contexte français. Bulletin Épidémiologique Hebdomadaire 2011;20‐21:244‐247. [Google Scholar]
- Gallopel‐Morvan K, Moodie C, Hammond D, Eker F, Beguinot E, Martinet Y. Consumer perceptions of cigarette pack design in France: a comparison of regular, limited edition and plain packaging. Tobacco Control 2012;21(5):502‐6. [DOI] [PubMed] [Google Scholar]
Gallopel‐Morvan 2012 {published data only}
- Gallopel‐Morvan K, Orvain J, Waelli M, Pino JMR. Demarketing tobacco products: the influence of plain packs on smokers and non‐smokers perceptions and behavioural intentions. Journal de Gestion et d'Économie Médicales 2012;30:322‐31. [Google Scholar]
Gallopel‐Morvan 2015a {published data only}
- Gallopel‐Morvan K, Moodie C, Eker F, Beguinot E, Martinet Y. Perceptions of plain packaging among young adult roll‐your‐own smokers in France: a naturalistic approach. Tobacco Control 2015;24(e1):e39‐44. [DOI] [PubMed] [Google Scholar]
Gallopel‐Morvan 2015b {published data only}
- Gallopel‐Morvan Karine, Moodie Crawford, Eker Figen, Beguinot Emmanuelle, Martinet Yves. Efficacité des paquets de cigarettes neutres sur des fumeuses en France: Une étude dans un contexte réel de consummation. Bulletin épidémiologique hebdomadaire 2015;17:308‐15. [Google Scholar]
Germain 2010 {published data only}
- Germain D, Wakefield MA, Durkin SJ. Adolescents' perceptions of cigarette brand image: does plain packaging make a difference?. Journal of Adolescent Health 2010;46(4):385‐92. [DOI] [PubMed] [Google Scholar]
Goldberg 1999 {published data only}
- Goldberg ME, Liefeld J, Madill J, Vredenburg H. The effect of plain packaging on response to health warnings. American Journal of Public Health 1999;89(9):1434‐5. [DOI] [PMC free article] [PubMed] [Google Scholar]
Guillaumier 2014 {published data only}
- Guillaumier A, Bonevski B, Paul C, Durkin S, D'Este C. Socioeconomically disadvantaged smokers' ratings of plain and branded cigarette packaging: An experimental study. BMJ Open 2014;4(2):e004078. [DOI] [PMC free article] [PubMed] [Google Scholar]
Hammond 2009 {published data only}
- Hammond D, Dockrell M, Arnott D, Lee A, McNeill A. Cigarette pack design and perceptions of risk among UK adults and youth. European Journal of Public Health 2009;19(6):631‐7. [DOI] [PubMed] [Google Scholar]
Hammond 2011 {published data only}
- Hammond D, Doxey J, Daniel S, Bansal‐Travers M. Impact of female‐oriented cigarette packaging in the United States. Nicotine & Tobacco Research 2011;13(7):579‐88. [DOI] [PMC free article] [PubMed] [Google Scholar]
Hammond 2013 {published data only}
- Hammond D, Daniel S, White CM. The effect of cigarette branding and plain packaging on female youth in the United Kingdom. Journal of Adolescent Health 2013;52(2):151‐7. [DOI] [PubMed] [Google Scholar]
Hammond 2014 {published data only}
- Hammond D, White C, Anderson W, Arnott D, Dockrell M. The perceptions of UK youth of branded and standardized, 'plain' cigarette packaging. European Journal of Public Health 2014;24(4):537‐43. [DOI] [PubMed] [Google Scholar]
Hogarth 2015 {published data only}
- Hogarth L, Maynard OM, Munafò MR. Plain cigarette packs do not exert Pavlovian to instrumental transfer of control over tobacco‐seeking. Addiction 2015;110:174‐82. [DOI] [PMC free article] [PubMed] [Google Scholar]
Kotnowski 2015 {published data only}
- Kotnowski K, Fong GT, Gallopel‐Morvan K, Islam T, Hammond D. The impact of cigarette packaging design among young females in Canada: findings from a discrete choice experiment. Nicotine & Tobacco Research 2016;18(5):1348‐56. [DOI] [PubMed] [Google Scholar]
Maynard 2013 {published data only}
- Maynard OM, Munafò MR, Leonards U. Visual attention to health warnings on plain tobacco packaging in adolescent smokers and non‐smokers. Addiction 2013;108(2):413‐9. [DOI] [PubMed] [Google Scholar]
Maynard 2014 {published data only}
- Maynard OM, Attwood A, O'Brien L, Brooks S, Hedge C, Leonards U, et al. Avoidance of cigarette pack health warnings among regular cigarette smokers. Drug and Alcohol Dependence 2014;136:170‐4. [DOI] [PMC free article] [PubMed] [Google Scholar]
- Maynard OM, Leonards U, Attwood AS, Bauld L, Hogarth L, Munafò MR. Plain packaging of cigarettes and smoking behavior: study protocol for a randomized controlled study. Trials 2014;15:252. [DOI] [PMC free article] [PubMed] [Google Scholar]
Maynard 2015 {published data only}
- Maynard OM, Leonards U, Attwood AS, Bauld L, Hogarth L, Munafò MR. Effects of first exposure to plain cigarette packaging on smoking behaviour and attitudes: a randomised controlled study. BMC Public Health 2015;15:240. [DOI] [PMC free article] [PubMed] [Google Scholar]
Mays 2015 {published data only}
- Mays D, Niaura RS, Evans WD, Hammond D, Luta G, Tercyak KP. Cigarette packaging and health warnings: the impact of plain packaging and message framing on young smokers. Tobacco Control 2015;24(e1):e87‐92. [DOI] [PMC free article] [PubMed] [Google Scholar]
Miller 2015 {published data only}
- Miller CL, Ettridge KA, Wakefield MA. “You're made to feel like a dirty filthy smoker when you're not, cigar smoking is another thing all together.” Responses of Australian cigar and cigarillo smokers to plain packaging. Tobacco Control 2015;24:ii58‐65. [DOI] [PMC free article] [PubMed] [Google Scholar]
Moodie 2011 {published data only}
- Moodie C, Mackintosh AM, Hastings G, Ford A. Young adult smokers' perceptions of plain packaging: A pilot naturalistic study. Tobacco Control 2011;20(5):367‐73. [DOI] [PubMed] [Google Scholar]
Moodie 2012 {published data only}
- Moodie C, Ford A, MacKintosh AM, Hastings G. Young people's perceptions of cigarette packaging and plain packing: an online survey. Nicotine & Tobacco Research 2012;14(1):98‐105. [DOI] [PubMed] [Google Scholar]
Moodie 2013 {published data only}
- Moodie CS, Mackintosh AM. Young adult women smokers' response to using plain cigarette packaging: a naturalistic approach. BMJ Open 2013;3(3):e002402. [DOI] [PMC free article] [PubMed] [Google Scholar]
Munafò 2011 {published data only}
- Munafò MR, Roberts N, Bauld L, Leonards U. Plain packaging increases visual attention to health warnings on cigarette packs in non‐smokers and weekly smokers but not daily smokers. Addiction 2011;106:1505‐10. [DOI] [PubMed] [Google Scholar]
Nagelhout 2015 {published data only}
- Nagelhout GE, Osman A, Yong HH, Huang LL, Borland R, Thrasher JF. Was the media campaign that supported Australia's new pictorial cigarette warning labels and plain packaging policy associated with more attention to and talking about warning labels?. Addictive Behaviors 2015;49:64‐7. [DOI] [PMC free article] [PubMed] [Google Scholar]
Nicholson 2015 {published data only}
- Nicholson AK, Borland R, Sarin J, Wallace S, Sterren AE, Stevens M, et al. Recall of anti‐tobacco advertising and information, warning labels and news stories in a national sample of Aboriginal and Torres Strait Islander smokers. Medical Journal of Australia 2015;202:S67‐72. [DOI] [PubMed] [Google Scholar]
Rousu 2013 {published data only}
- Rousu MC, Thrasher JF. Demand reduction from plain and pictorial cigarette warning labels: evidence from experimental auctions. Applied Economic Perspectives and Policy 2013;35:171‐84. [Google Scholar]
- Thrasher JF, Rousu MC, Hammond D, Navarro A, Corrigan JR. Estimating the impact of pictorial health warnings and "plain" cigarette packaging: evidence from experimental auctions among adult smokers in the United States. Health Policy 2011;102(1):41‐8. [DOI] [PubMed] [Google Scholar]
Scollo 2015 {published data only}
- Scollo M, Zacher M, Coomber K, Bayly M, Wakefield M. Changes in use of types of tobacco products by pack sizes and price segments, prices paid and consumption following the introduction of plain packaging in Australia. Tobacco Control 2015;24:II66‐75. [DOI] [PMC free article] [PubMed] [Google Scholar]
Shankleman 2015 {published data only}
- Shankleman M, Sykes C, Mandeville KL, Costa S, Yarrow K. Standardised (plain) cigarette packaging increases attention to both text‐based and graphical health warnings: experimental evidence. Public Health 2015;129(1):37‐42. [DOI] [PMC free article] [PubMed] [Google Scholar]
Wakefield 2008 {published data only}
- Wakefield M, Germain D, Durkin S. How does increasingly plainer cigarette packaging influence adult smokers' perceptions about brand image? An experimental study. Tobacco Control 2008;17(6):416‐21. [DOI] [PMC free article] [PubMed] [Google Scholar]
Wakefield 2012 {published data only}
- Wakefield M, Germain D, Durkin S, Hammond D, Goldberg M. Do larger pictorial health warnings diminish the need for plain packaging of cigarettes?. Addiction 2013;107(6):1159‐67. [DOI] [PubMed] [Google Scholar]
Wakefield 2013 {published data only}
- Wakefield MA, Hayes L, Durkin S, Borland R. Introduction effects of the Australian plain packaging policy on adult smokers: a cross‐sectional study. BMJ Open 2013;3(7):e003175. [DOI] [PMC free article] [PubMed] [Google Scholar]
Wakefield 2015 {published data only}
- Wakefield M, Coomber K, Zacher M, Durkin S, Brennan E, Scollo M. Australian adult smokers’ responses to plain packaging with larger graphic health warnings 1 year after implementation: results from a national cross‐sectional tracking survey. Tobacco Control 2015;24:ii17‐25. [DOI] [PMC free article] [PubMed] [Google Scholar]
White 2012 {published data only}
- White CM, Hammond D, Thrasher JF, Fong GT. The potential impact of plain packaging of cigarette products among Brazilian young women: an experimental study. BMC Public Health 2012;12:737. [DOI] [PMC free article] [PubMed] [Google Scholar]
White 2015a {published data only}
- White V, Williams T, Faulkner A, Wakefield M. Do larger graphic health warnings on standardised cigarette packs increase adolescents' cognitive processing of consumer health information and beliefs about smoking‐related harms?. Tobacco Control 2015;24:II50‐7. [DOI] [PMC free article] [PubMed] [Google Scholar]
- White V, Williams T, Wakefield M. Has the introduction of plain packaging with larger graphic health warnings changed adolescents' perceptions of cigarette packs and brands?. Tobacco Control 2015;24:II42‐9. [DOI] [PMC free article] [PubMed] [Google Scholar]
Yong 2015 {published data only}
- Yong HH, Borland R, Hammond D, Thrasher JF, Cummings KM, Fong GT. Smokers’ reactions to the new larger health warning labels on plain cigarette packs in Australia: findings from the ITC Australia project. Tobacco Control 2015;25(2):181‐7. [DOI] [PMC free article] [PubMed] [Google Scholar]
Young 2014 {published data only}
- Young JM, Stacey I, Dobbins TA, Dunlop S, Dessaix AL, Currow DC. Association between tobacco plain packaging and Quitline calls: a population‐based, interrupted time‐series analysis. Medical Journal of Australia 2014;200(1):29‐32. [DOI] [PubMed] [Google Scholar]
Zacher 2014 {published data only}
- Zacher M, Bayly M, Brennan E, Dono J, Miller C, Durkin S, et al. Personal tobacco pack display before and after the introduction of plain packaging with larger pictorial health warnings in Australia: An observational study of outdoor cafe strips. Addiction 2014;109(4):653‐62. [DOI] [PubMed] [Google Scholar]
Zacher 2015 {published data only}
- Zacher M, Bayly M, Brennan E, Dono J, Miller C, Durkin S, et al. Personal pack display and active smoking at outdoor cafe strips: assessing the impact of plain packaging 1 year postimplementation. Tobacco Control 2015;24:II94‐7. [DOI] [PMC free article] [PubMed] [Google Scholar]
References to studies excluded from this review
Bayly 2015 {published data only}
- Bayly M, Scollo M, Wakefield M. No lasting effects of plain packaging on cigarette pack retrieval time in small Australian retail outlets. Tobacco Control 2015;24(e1):e108‐9. [DOI] [PubMed] [Google Scholar]
Chester 2013 {published data only}
- Chester MM. The answer is in the evidence: plain packaging, graphic health warnings, and the Family Smoking Prevention and Tobacco Control Act. Syracuse Journal of Internationall Law and Commerce surface.syr.edu/cgi/viewcontent.cgi?article=1399&context=jilc 2013 (accessed 8th March 2017); Vol. 41, issue 2:413.
Davidson 2014 {published data only}
- Davidson S, Silva A. The plain truth about plain packaging: An econometric analysis of the Australian 2011 tobacco plain packaging Act. Agenda: A Journal of Policy Analysis and Reform; press‐files.anu.edu.au/downloads/press/p302941/pdf/The‐Plain‐Truth‐about‐Plain‐Packaging‐An‐Econometric‐Analysis‐of‐the‐Australian‐2011‐Tobacco‐Plain‐Packaging‐Act.pdf 2014; Vol. 21, issue 1:27‐43.
Fooks 2013 {published data only}
- Fooks G, Gilmore AB. International trade law, plain packaging and tobacco industry political activity: the Trans‐Pacific Partnership. Tobacco Control 2013;23(1):e1. [DOI] [PMC free article] [PubMed] [Google Scholar]
Ford 2014 {published data only}
- Ford A, Moodie C, MacKintosh AM, Hastings G. Adolescent perceptions of cigarette appearance. European Journal of Public Health 2014;24(3):464‐8. [DOI] [PubMed] [Google Scholar]
Gallopel‐Morvan 2015c {published data only}
- Gallopel‐Morvan K. [Is tobacco plain packaging effective in tobacco control?]. La Revue due Praticien 2015;65(8):1018‐20. [PubMed] [Google Scholar]
Gendall 2011 {published data only}
- Gendall P, Hoek J, Thomson G, Edwards R, Pene G, Gifford H, et al. Young adults' interpretations of tobacco brands: implications for tobacco control. Nicotine & Tobacco Research 2011;13(10):911‐8. [DOI] [PubMed] [Google Scholar]
Gendall 2012 {published data only}
- Gendall P, Hoek J, Edwards R, McCool J. A cross‐sectional analysis of how young adults perceive tobacco brands: implications for FCTC signatories. BMC Public Health 2012;12:796. [DOI] [PMC free article] [PubMed] [Google Scholar]
Griffin 2010 {published data only}
- Griffin B, Murphy M. Thinking outside the box: does packaging on cigarettes work?. Real effectiveness of anti‐drug campaigns. An exploratory analysis in the young. Social Science Research Network 2010:43. [Google Scholar]
Henriksen 2012 {published data only}
- Henriksen L. Comprehensive tobacco marketing restrictions: promotion, packaging, price and place. Tobacco Control 2012;21(2):147‐53. [DOI] [PMC free article] [PubMed] [Google Scholar]
Hoek 2012 {published data only}
- Hoek J, Gendall P, Gifford H, Pirikahu G, McCool J, Pene G, et al. Tobacco branding, plain packaging, pictorial warnings, and symbolic consumption. Qualitative Health Research 2012;22(5):630‐9. [DOI] [PubMed] [Google Scholar]
Hoek 2013 {published data only}
- Hoek J, Healey B, Gendall P, Edwards R, Jaine R. How do adolescents perceive plain packaging?. New Zealand Medical Journal 2013;126(1383):100‐3. [PubMed] [Google Scholar]
Mannocci 2015 {published data only}
- Mannocci A, Colamesta V, Mipatrini D, Messina G, Gualano MR, Gianfagna F, et al. From directive to practice: are pictorial warnings and plain packaging effective to reduce the tobacco addiction?. Public Health 2015;129(12):1563‐70. [DOI] [PubMed] [Google Scholar]
Martin 2014 {published data only}
- Martin Natasha, McHugh Hugh, Murtagh Jono, Oliver‐Rose Connor, Panesar Div, Pengelly Harriet, et al. Observational study of the visibility of branded tobacco packaging and smoking at outdoor bars/cafés in Wellington, New Zealand. The New Zealand Medical Journal (Online) 2014;127:27. [PubMed] [Google Scholar]
Moodie 2011a {published data only}
- Moodie C, Ford A. Young adult smokers' perceptions of cigarette pack innovation, pack colour and plain packaging. Australasian Marketing Journal (AMJ) 2011;19:174‐80. [Google Scholar]
Moodie 2012b {published data only}
- Moodie C, Hastings G, Joossens L. Young adult smokers' perceptions of illicit tobacco and the possible impact of plain packaging on purchase behaviour. European Journal of Public Health 2012;22(2):251‐3. [DOI] [PubMed] [Google Scholar]
Scheffels 2008 {published data only}
- Scheffels J. A difference that makes a difference: young adult smokers' accounts of cigarette brands and package design. Tobacco Control 2008;17(2):118‐22. [DOI] [PubMed] [Google Scholar]
Scheffels 2013 {published data only}
References to studies awaiting assessment
Dunlop 2016 {published data only}
- Dunlop S, Perez D, Dessaix D, Currow D. Australia's plain tobacco packs: anticipated and actual responses among adolescents and young adults 2010‐2013. Tobacco Control 2016 Nov;pii:tobaccocontrol‐2016‐053166 [Epub ahead of print]. [DOI] [PubMed] [Google Scholar]
Gallopel‐Morvan in press {published data only}
- Gallopel‐Morvan K, Hoek J, Rieunier S. Do plain packaging and pictorial warnings affect smokers and non‐smokers' behavioural intentions. Journal of Consumer Affairs (in press).
Maddox 2016 {published data only}
Maynard 2016 {published data only}
- Maynard OM, Brooks JC, Munafò MR, Leonards U. Neural mechanisms underlying visual attention to health warnings on branded and plain cigarette packs. Addiction 2017;112(4):662‐72. [DOI] [PMC free article] [PubMed] [Google Scholar]
Mutti 2016 {published data only}
- Mutti S, Hammond D, Reid JL, White CM, Thrasher JF. Perceptions of branded and plain cigarette packaging among Mexican youth. Health Promotion International 201 Jan 29; Vol. pii:dav117 [Epub ahead of print]. [DOI] [PMC free article] [PubMed]
Nonnemaker 2016 {published data only}
- Nonnemaker J, Kim A, Shafter P, Loomis B, Hill E, Holloway J, et al. Influence of point‐of‐sale tobacco displays and plain black and white cigarette packaging and advertisements on adults: Evidence from a virtual store experimental study. Addictive Behaviours 2016 May;56:15‐22. [DOI] [PubMed] [Google Scholar]
Schuz 2016 {published data only}
Skaczkowski 2017 {published data only}
- Skaczkowski G, Durkin S, Kashima Y, Wakefield M. Influence of premium versus value brand names on the smoking experience in a plain packaging environment: an experimental study. BMJ Open 2017 Jan 16;7(1):e014099. [DOI] [PMC free article] [PubMed] [Google Scholar]
References to ongoing studies
Bogdanovica 2016 {unpublished data only}
- Study of the effects of standardised packaging and the 2014 European Union Tobacco Products Directive on tobacco product pricing, consumption and smoking prevalence. Ongoing study Fellowship. Finishes 2022.
Diethelm 2016 {unpublished data only}
- Re‐analysis of tobacco‐industry funded research on the effect of plain packaging on minors in Australia. Ongoing study Starting date of trial not provided. Contact author for more information.
Gilmore 2016 {unpublished data only}
- Using Nielsen data to evaluate the impact of standardised packaging of tobacco in the UK. Ongoing study 2016 (finishes 2019).
Hitchman/Moodie 2015 {unpublished data only}
- Adult Tobacco Policy Survey.An evaluation of standardised packaging in the UK. Ongoing study 2014 ‐ 2016.
Additional references
Australian Bureau of Statistics 2014
- Australian Bureau of Statistics. ABS responds to “Estimate Household expenditure on tobacco". www.abs.gov.au/websitedbs/d3310114.nsf/4a256353001af3ed4b2562bb00121564/0eef1e81b5623984ca257cfb002688ca!OpenDocument 2014 (accessed 19th February 2017).
Australian Bureau of Statistics 2015
- Australian Bureau of Statistics. National Health Survey: First Results, 2014‐15 (4364.0.55.001, 8 December 2015). www.abs.gov.au/ausstats/abs@.nsf/Lookup/by%20Subject/4364.0.55.001˜2014‐15˜Main%20Features˜Smoking˜24 2015 (accessed 19th February 2017).
Australian Government 2016
- Australian Government Department of Health. Introduction of Tobacco Plain Packaging in Australia. Accessed via http://www.health.gov.au/internet/main/publishing.nsf/Content/tobacco‐plain [accessed 31 March 2017], 2016. [Google Scholar]
Australian Institute of Health and Welfare 2014
- Australian Institute of Health and Welfare. National Drug Strategy Household Survey Detailed Report 2013. Drug Statistics Series No. 28. www.aihw.gov.au/publication‐detail/?id=60129549469 2014 (accessed 18th February 2017).
Badger 2007
- Badger GJ, Bickel WK, Giordano LA, Jacobs EA, Loewenstein G, Marsch L. Altered states: the impact of immediate craving on the valuation of current and future opioids. Journal of Health Economics 2007;26(5):865‐76. [DOI] [PubMed] [Google Scholar]
Chipty 2016
- Chipty T. Study of the impact of the tobacco plain packaging measure on smoking prevalence in Australia. Appendix A. In: Australian Government Department of Health. Post‐Implementation Review. Tobacco Plain Packaging. 2016. 24 January 2016.
EPOC 2013
- Effective Practice, Organisation of Care (EPOC). Interrupted time series (ITS) analyses. EPOC Resources for Review Authors. Oslo: Norwegian Knowledge Centre for the Health Services, 2013. [Google Scholar]
Euromonitor International 2015
- Euromonitor International. Tobacco Packaging in Australia. www.euromonitor.com/tobacco‐packaging‐in‐australia/report June 2015 (accessed 19th February 2017).
Freeman 2008
- Freeman B, Chapman S, Rimmer M. The case for the plain packaging of tobacco products. Addiction 2008;103(4):580‐90. [DOI] [PubMed] [Google Scholar]
French Ministry of Social Affairs 2014
- French Ministry of Social Affairs, Health, Women’s Rights. Programme National de Réduction du Tabagisme [National Program for the Reduction of Tobacco Use]. Accessed via http://www.sante.gouv.fr/IMG/pdf/250914_‐_Dossier_de_Presse_‐_PNRT_2_.pdf [accessed 31 March 2017], 2014. [Google Scholar]
Hammond 2014b
- Hammond D. Standardized packaging of tobacco products: Evidence review. health.gov.ie/blog/publications/standardised‐packaging‐d‐hammond/ 2014 (accessed 8th March 2017).
Hughes 2016
- Hughes N, Arora M, Grills N. Perceptions and impact of plain packaging of tobacco products in low and middle income countries, middle to upper income countries and low‐income settings in high‐income countries: a systematic review of the literature. BMJ Open 2016;6(3):e010391. [DOI] [PMC free article] [PubMed] [Google Scholar]
IARC 2008
- IARC. Measuring Tobacco Use Behaviour. 12. Lyon, France: IARC, 2008. [Google Scholar]
Kaul 2014
- Kaul A, Wolf M. The (possible) effect of plain packaging on smoking prevalence in Australia: a trend analysis. www.econ.uzh.ch/static/workingpapers.php?id=828 2014 (accessed 8th March 2017).
Loewenstein 1996
- Loewenstein G. Out of control: visceral influences on behaviour. Organisational Behaviour and Human Decision Processes 1996;65:272‐92. [Google Scholar]
Lovato 2011
- Lovato C, Watts A, Stead LF. Impact of tobacco advertising and promotion on increasing adolescent smoking behaviours. Cochrane Database of Systematic Reviews 2011, Issue 10. [DOI: 10.1002/14651858.CD003439.pub2] [DOI] [PMC free article] [PubMed] [Google Scholar]
Moodie 2012c
- Moodie C, Stead M, Bauld L, McNeill A, Angus K, Hinds K, et al. Plain Tobacco Packaging: A Systematic Review. phrc.lshtm.ac.uk/project_2011‐2016_006.html (accessed July 8th 2014).
MRC 2011
- Medical Research Council (MRC). Using Natural Experiments to Evaluate Population Health Interventions: Guidance for Producers and Users of Evidence. www.mrc.ac.uk/documents/pdf/natural‐experiments‐guidance/. London: MRC, 2011 (accessed 8th March 2017).
National Cancer Institute 2008
- National Cancer Institute. The Role of Media in Promoting and Reducing Tobacco Use. cancercontrol.cancer.gov/brp/tcrb/monographs/19/m19_complete.pdf 2008 (accessed 8th March 2017).
RevMan 2014 [Computer program]
- The Nordic Cochrane Centre, The Cochrane Collaboration. Review Manager (RevMan). Version 5.3. Copenhagen: The Nordic Cochrane Centre, The Cochrane Collaboration, 2014.
Stead 2013
- Stead M, Moodie C, Angus K, Bauld L, McNeill A, Thomas J, et al. Is consumer response to plain/standardised tobacco packaging consistent with framework convention on tobacco control guidelines? A systematic review of quantitative studies. PLoS One 2013;8(10):e75919. [DOI] [PMC free article] [PubMed] [Google Scholar]
US DHHS 2014
- US Department of Health and Human Services. The Health Consequences of Smoking—50 Years of Progress. A Report of the Surgeon General. Atlanta, GA: US Department of Health and Human Services, Centers for Disease Control and Prevention, National Center for Chronic Disease Prevention and Health Promotion, Office on Smoking and Health, 2014. [Google Scholar]
Wakefield 2002
- Wakefield M, Morley C, Horan JK, Cummings KM. The cigarette pack as image: new evidence from tobacco industry documents. Tobacco Control 2002;11 Suppl 1:173‐80. [DOI] [PMC free article] [PubMed] [Google Scholar]
White 2015b
- White T, Williams T. Australian Secondary School Students’ Use of Tobacco in 2014. www.nationaldrugstrategy.gov.au/internet/drugstrategy/Publishing.nsf/content/BCBF6B2C638E1202CA257ACD0020E35C/$File/Tobacco%20Report%202014.PDF 2015 (accessed 19th February 2017).
World Bank 1999
- World Bank. Curbing the Epidemic, Governments and the Economics of Tobacco Control. Washington DC: World Bank Publications, 1999. [Google Scholar]
World Health Organization 2008
- World Health Organization. Guidelines for Implementation of Article 13 of the WHO Framework Convention on Tobacco Control (decision FCTC/COP3 (12). 2008; www.who.int/fctc/guidelines/article_13.pdf?ua=1. WHO Framework Convention on Tobacco Control, (accessed July 8th 2014). [Google Scholar]
World Health Organization 2015
- World Health Organization. WHO Report on the Global Tobacco Epidemic, 2015. http://www.who.int/tobacco/global_report/2015/report/en/ (accessed July 8th 2014).
References to other published versions of this review
McNeill 2016
- McNeill A, Bauld L, Birken M, Hammond D, Moodie C, Stead M, et al. Tobacco packaging design for preventing tobacco uptake. Cochrane Database of Systematic Reviews 2016, Issue 2. [DOI: 10.1002/14651858.CD011245.pub2] [DOI] [Google Scholar]