

Abstract
OBJECTIVES
Tacrolimus (TAC) is an important immunosuppressant in liver transplantation. Since TAC is mainly metabolized by the liver enzymes CYP3A4 and 5, liver function is crucial for its pharmacokinetics (PK). Liver function is dynamic after liver transplantation; hence the PK of TAC metabolism after pediatric liver transplantation is not well understood. We aimed to investigate the time-dependent changes in TAC metabolism and to find factors influencing TAC PK after pediatric liver transplantation.
METHODS
We retrospectively reviewed the characteristics of the donors and recipients in pediatric living donor liver transplantation and used the TAC concentration-dose (CD) ratio as a surrogate marker of TAC metabolism.
RESULTS
Included were 326 patients with a median age of 13 months. After the liver transplantation, the CD ratio gradually decreased, then plateaued around day 21 to 28. A linear regression analysis demonstrated that a lower graft-to-recipient weight ratio (GRWR) and higher prothrombin time–international normalized ratio (PT-INR) were independently associated with a higher CD ratio in the early period after liver transplantation. However, association between GRWR and TAC CD ratio disappeared around 6 to 12 months after a liver transplantation possibly owing to graft regeneration.
CONCLUSIONS
Tacrolimus metabolism improved within the first month after liver transplantation, and the small graft size was associated with lower TAC metabolism in the early period after pediatric living donor liver transplantation.
Keywords: children, concentration-dose ratio, immunosuppressant, liver function, tacrolimus, time-dependent change
Introduction
Tacrolimus (TAC) is a calcineurin inhibitor widely used as an immunosuppressant to prevent graft rejection after pediatric liver transplantation (LT).1 Tacrolimus is mainly metabolized by cytochrome P450 (CYP) 3A4 and 5 in the liver, and almost none is eliminated through urine.2–4 Its pharmacokinetics (PK) is therefore largely dependent on liver function. Hence TAC clearance may change as the graft regenerates and changes in size after transplantation.5,6
Several studies5,6 have shown that the TAC dose requirement, which indirectly reflects TAC metabolism by the liver, increases gradually after LT as the new liver regenerates and liver function normalizes. The TAC concentration-dose ratio (CD ratio), estimated by dividing the TAC trough concentration (ng/mL) by the corresponding daily TAC dose (mg/day or mg/kg/day), has also been used to estimate TAC pharmacokinetics in several studies.7–11 A high TAC CD ratio represents low metabolic activity of the liver on TAC because small-dose TAC results in a relatively higher TAC concentration and vice versa. Using this parameter as a surrogate marker of liver function after LT, Tholking et al7 divided the transplant recipients into low and high metabolizer groups with the median CD ratio as a cutoff and investigated the relationship between TAC metabolism and nephrotoxicity.
Several factors including time after transplantation, body weight, hematocrit level, and CYP3A5 polymorphisms are known to affect TAC pharmacokinetics after LT8,12,13 and cause large interpatient variability in TAC concentration. Hence identifying the factors affecting the PK of TAC in the early post-LT phase is crucial to designing dosing regimens that can quickly achieve the appropriate TAC concentration. However, most studies on TAC PK after LT were conducted by using the adult population or deceased donor transplantation,5–7 and information on pediatric living donor LT recipients is relatively sparse. The aim of this study was to investigate changes in the CD ratio after pediatric living donor LT and to identify the factors that might influence the CD ratio in the early post pediatric LT phase.
Materials and Methods
Data Collection and Patient Characteristics. We retrospectively reviewed pediatric patients who underwent living donor LT between November 2005 and December 2015 at the National Center for Child Health and Development (NCCHD) in Tokyo, which has the largest pediatric LT program in Japan. Data including donor and recipient characteristics, clinical course, graft survival, and tacrolimus dosing and concentration were obtained from the electronic medical records. Graft loss was defined as the loss of graft liver function requiring a retransplantation or resulting in death. Only pediatric patients (<18 years old) who had undergone living donor LT were included. Cases of deceased donor or domino LT, retransplantation, patients who did not receive tacrolimus as an immunosuppressant, and patients who had received tacrolimus for an underlying disease before LT were excluded. This study was approved by the institutional review board at the NCCHD (H17-152; NCCHD) and performed in compliance with the guidelines published by the Ministry of Education, Culture, Sports, Science and Technology and the Ministry of Health, Labour and Welfare of Japan.
Immunosuppression Protocol and Timing of TAC Concentration Measurement. Tacrolimus and steroids were administered as immunosuppressants after LT in accordance with our institutional protocol. Oral TAC was started on the day of the LT at 0.05 mg/kg/dose every 12 hours (morning and evening), and the trough serum concentration was measured every morning just before administration. Enteral nutrition was generally started 5 days after LT, and TAC was generally administered after meals. The dosage was adjusted according to the trough serum concentration to achieve 10 to 12 ng/mL for the first month and 8 to 10 ng/mL thereafter. Methylprednisolone was tapered from 1 to 0.3 mg/kg/day during the first week and switched to oral prednisolone 0.3 mg/kg/day from day 8 to day 28 and decreased to 0.1 mg/kg/day thereafter.14
Analytic Methods of Calculating TAC Concentration and CD Ratio. Whole blood TAC concentration was measured by using a microparticle enzyme immunoassay (MEIA) (IMX, ABBOTT, Tokyo, Japan) between November 2005 and March 2008, an affinity column–mediated immunoassay (ACMIA) (Dimension, SIEMENS K.K, Tokyo, Japan) between March 2008 and October 2009, and chemiluminescent enzyme assay (CLIA) (ARCHITECT, ABBOTT) from October 2009 at a commercial laboratory. The TAC lower limit of quantification (LLOQ) for these assays was 1.5 ng/mL, 1.2 ng/mL, and 1.5 ng/mL, respectively. The samples that demonstrated concentration below LLOQ were designated as below the limit of quantification (BLQ). For purposes of further analyses, BLQ was assigned 1/2 the LLOQ value. The compatibility of each assay was evaluated in the commercial laboratory (SRL Inc, Tokyo, Japan) by using linear regression analysis. These assays were well correlated but ACMIA and CLIA tended to show slightly lower values than MEIA (n = 50, R = 0.916, y = 0.765x + 0.323, where y = ACMIA, x = MEIA; and n = 33, R = 0.959, y = 0.969x − 1.203, where y = CLIA, x = MEIA, respectively). As previously described, the TAC CD ratio was calculated by applying the total daily TAC dose per patient's body weight (mg/kg/day) as the denominator and the corresponding trough concentration (ng/mL) as the numerator.9
Statistical Analysis. Univariate analysis followed by multivariate analysis was performed in order to identify the factors affecting the TAC CD ratio. Recipient factors included in the analysis were age, weight, underlying disease, sex, alanine aminotransferase (ALT), prothrombin time–international normalized ratio (PT-INR), diarrhea, coadministered medications, and analytic method for tacrolimus concentration. Donor factors were age, sex, and body mass index (BMI), ALT, and total bilirubin before LT. Operation-related factors were graft type, graft-to-recipient weight ratio (GRWR), blood loss at LT, cold and warm ischemic time, and operation time. Variables demonstrating a p value < 0.05 in univariate linear regression analysis were evaluated by multivariate linear regression analysis after assessing multicollinearity via the Pearson correlation coefficient. Statistical significance level in this multivariate analysis was set at 0.05.
The Kaplan-Meier method was performed to estimate survival probability of time-to-graft loss, and the log-rank test was used to evaluate group differences from the quartiles of the CD ratio. To examine the time-dependent change of the relationship between the CD ratio and the GRWR, slopes from linear regression models were evaluated at day 7, day 14, day 28, and at 3 months, 6 months, and 12 months. In the analyses of days 7, 14, and 28, the CD ratio of the day was used, and in the analyses of 3, 6, and 12 months, data allowance ranges were set at ±1 month, ±1 month, and ±2 months, respectively. All statistical analyses were performed by using the SPSS 22.0 software package (SPSS Inc, Chicago, IL).
Results
The breakdown of the study enrollment is shown in Figure 1. Three hundred eighty LTs were performed at our institution during the study period. Among these, 326 pediatric recipients who received their first living donor LT were included in the analysis. The patients' characteristics are summarized in Table 1. The median age of the recipients and donors was 13 months and 35 years, respectively. The most common underlying disease necessitating an LT was biliary atresia (n =170, 52%) followed by metabolic diseases (n = 55, 17%) and acute liver failure (n = 50, 15%). The left lateral segment was most frequently used for the liver graft, and the median GRWR was 2.37.
Figure 1.
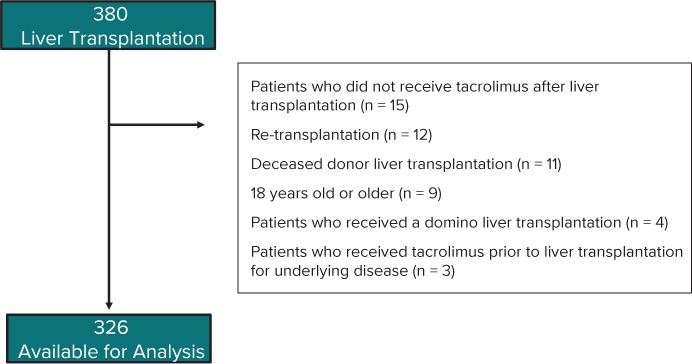
Criteria for study inclusion.
Table 1.
Recipient and Donor Characteristics
| Variables | Numbers |
|---|---|
| Recipient information | |
| Total number of patients | 326 |
| Age, mo, median (IQR) | 13 (7–55) |
| Sex, male, n (%) | 133 (40.8) |
| Body weight, kg, median (IQR) | 9.0 (6.9–15.5) |
| Underlying diseases, n (%) | |
| Biliary atresia | 170 (52.1) |
| Metabolic diseases | 55 (16.9) |
| Acute liver failure | 50 (15.3) |
| Liver fibrosis | 18 (5.5) |
| Hepatic tumor | 17 (5.2) |
| Liver cirrhosis | 8 (2.5) |
| Vascular abnormalities | 8 (2.5) |
| Donor information | |
| Age, yr, median (IQR) | 35 (31–39) |
| Sex, male, n (%) | 125 (38.3) |
| BMI, kg/m2, median (IQR) | 21.1 (19.4–23.1) |
| Graft Information | |
| Graft type, n (%) | |
| LLS | 217 (66.6) |
| Reduced or hyperreduced LLS | 63 (19.3) |
| Left robe | 31 (9.5) |
| Right robe | 4 (1.2) |
| Others | 11 (3.4) |
| Graft-to-recipient weight ratio, % (IQR) | 2.37 (1.65–3.13) |
BMI, body mass index; LLS, left lateral segment
Changes in Time-Dependent TAC CD Ratio After LT. A total of 1906 TAC concentration measurements were used to calculate the CD ratio in the first month after LT. Among these, only 24 measurements were considered BLQ (1.3%). Owing to the large interpatient variability in the CD ratio ranging from 0.4 to 2338 ([ng/mL]/[mg/kg/day]), a semilogarithmic scale was used to draw the graph seen in Figure 2. The CD ratio peaked on day 3 after LT, gradually decreased thereafter, and attained the lowest value around day 21 to 28.
Figure 2.
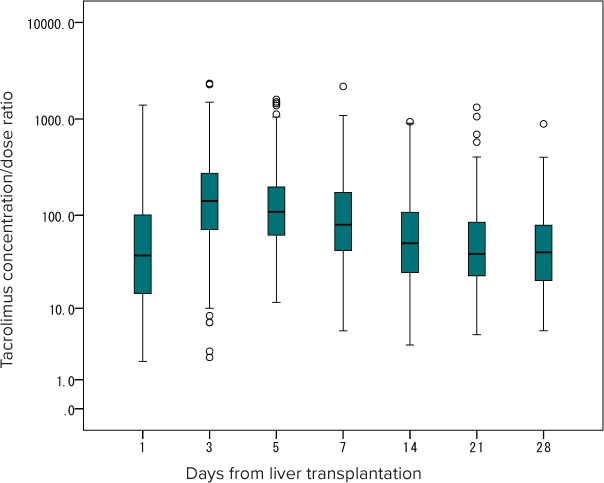
Changes in time-dependent tacrolimus concentration-dose ratio after liver transplantation.
Factors Influencing the TAC CD Ratio After LT. Nineteen patients were excluded from the analysis owing to the lack of the CD values on day 7. Recipient, donor, and operation-related variables were analyzed by linear regression analysis. Among the recipient and donor variables, univariate analyses revealed a significant difference in recipient age (regression coefficient 1.38, p < 0.001) and recipient weight (6.80, p < 0.001), PT-INR (115.3, p = 0.001), donor age (7.13, p < 0.001), and donor BMI (10.01, p = 0.042) (Table 2). Several operation-related variables such as GRWR (−79.45, p < 0.001) and graft type (reduced or hyperreduced left lateral segment 22.89, others 200.88, p < 0.001) and operating time (0.28, p = 0.001) also showed a significant difference. Multivariate linear regression analysis performed for all variables with a p value < 0.05 in univariate analysis, except recipient age (correlation with body weight) and graft type (correlation with GRWR), demonstrated that a higher PT-INR (110.36, p = 0.001) and lower GRWR (−53.80, p = 0.002) were independently associated with a higher CD ratio.
Table 2.
Univariate and Multivariate Linear Regression Analyses of Factors Influencing Tacrolimus Concentration-Dose Ratios on Day 7 After Liver Transplantation
| Variables* | Univariate Analysis | Multivariate Analysis | ||||
|---|---|---|---|---|---|---|
| Median (IQR) or No. (%) | Regression Coefficient, B (95% CI) † | p value† | Regression Coefficient, B (95% CI)‡ | p value‡ | ||
| Recipient variables | ||||||
| Age, mo | 13 (7–55) | 1.381 (0.898, 1.864) | <0.001 | |||
| Weight, kg | 9 (6.9–15.5) | 6.803 (4.621, 8.986) | <0.001 | 1.952 (−1.434, 5.338) | 0.257 | |
| Sex, male | 133 (40.8) | −20.247 (−67.995, 27.501) | 0.405 | |||
| Underlying diseases | ||||||
| Biliary atresia | 170 (52.1) | Reference | 0.570 | |||
| Metabolic diseases | 55 (16.9) | 2.543 (−63.494, 68.580) | ||||
| Acute liver failure | 50 (15.3) | 43.313 (−24.274, 110.899) | ||||
| Others | 51 (15.6) | 28.751 (−39.388, 96.889) | ||||
| ALT (U/L) | 100.5 (61–162) | −0.043 (−0.214, 0.129) | 0.624 | |||
| PT-INR | 1.2 (1.1–1.4) | 115.272 (47.327, 183.217) | 0.001 | 110.359 (46.868, 173.850) | 0.001 | |
| Coadministered drugs | ||||||
| Azole | 6 (1.8) | −23.766 (−209.391, 161.859) | 0.865 | |||
| Macrolides | 0 (0) | - | ||||
| Phenobarbital | 20 (6.1) | 23.765 (−76.244, 123.774) | ||||
| Diarrhea | 8 (2.5) | −45.752 (−192.896, 101.392) | 0.541 | |||
| Analytic method | ||||||
| CLIA | 225 (69) | Reference | 0.442 | |||
| ACMIA | 52 (16) | 3.793 (−62.343, 69.929) | ||||
| MEIA | 49 (15) | −41.845 (−108.567, 24.878) | ||||
| Donor variables | ||||||
| Age, yr | 35.0 (31–39) | 7.131 (3.631, 10.631) | <0.001 | 2.440 (−1.247, 6.127) | 0.194 | |
| Sex, male | 125 (38.3) | −26.513 (−74.639, 21.614) | 0.279 | |||
| BMI, kg/m2 | 21.1 (15–29) | 10.012 (0.349, 19.676) | 0.042 | 2.388 (−7.048, 11.825) | 0.619 | |
| ALT before transplantation, U/L | 15 (2–63) | −0.584 (−3.592, 2.424) | 0.703 | |||
| Total bilirubin before transplantation, mg/dL | 0.81 (0.35–1.03) | 51.947 (−15.213, 119.107) | 0.129 | |||
| Operation-related variables | ||||||
| GRWR (%) | 2.37 (1.65–3.13) | −79.448 (−102.964, −55.933) | <0.001 | −53.795 (−87.226, −20.363) | 0.002 | |
| Graft type | ||||||
| LLS | 217 (66.6) | Reference | <0.001 | |||
| Reduced or hyperreduced LLS | 63 (19.3) | 22.894 (−36.486, 82.275) | ||||
| Others | 46 (14.1) | 200.882 (134.421, 267.343) | ||||
| CIT, min | 31.5 (21–59) | 0.164 (−0.444, 0.771) | 0.596 | |||
| WIT, min | 28.0 (24–33) | −1.366 (−3.948, 1.217) | 0.299 | |||
| Blood volume loss during LT, mL/kg | 60.6 (34.1–107.6) | −0.106 (−0.348, 0.136) | 0.388 | |||
| Operating time, min | 488.5 (424.8–576.3) | 0.278 (0.119, 0.437) | 0.001 | 0.148 (−0.017, 0.314) | 0.079 | |
ACMIA, affinity column–mediated immunoassay; ALT, alanine transaminase; BMI, body mass index; CIT, cold ischemic time; CLIA, chemiluminescent enzyme assay; GRWR, graft-to-recipient body weight ratio; LLS, left lateral segment; LT, liver transplantation; MEIA, microparticle enzyme immunoassay; PT-INR, prothrombin time–international normalized ratio; WIT, warm ischemic time
* Univariate (unadjusted) and multivariate (adjusted) B (regression coefficient) are presented.
† p value and 95% confidence intervals are based on univariate linear regression.
‡ p value and 95% confidence intervals are based on multivariate linear regression.
Table 2.
Univariate and Multivariate Linear Regression Analyses of Factors Influencing Tacrolimus Concentration-Dose Ratios on Day 7 After Liver Transplantation (cont.)
| Variables* | Univariate Analysis | Multivariate Analysis | ||||
|---|---|---|---|---|---|---|
| Median (IQR) or No. (%) | Regression Coefficient, B (95% CI) † | p value† | Regression Coefficient, B (95% CI)‡ | p value‡ | ||
| Recipient variables | ||||||
| Age, mo | 13 (7–55) | 1.381 (0.898, 1.864) | <0.001 | |||
| Weight, kg | 9 (6.9–15.5) | 6.803 (4.621, 8.986) | <0.001 | 1.952 (−1.434, 5.338) | 0.257 | |
| Sex, male | 133 (40.8) | −20.247 (−67.995, 27.501) | 0.405 | |||
| Underlying diseases | ||||||
| Biliary atresia | 170 (52.1) | Reference | 0.570 | |||
| Metabolic diseases | 55 (16.9) | 2.543 (−63.494, 68.580) | ||||
| Acute liver failure | 50 (15.3) | 43.313 (−24.274, 110.899) | ||||
| Others | 51 (15.6) | 28.751 (−39.388, 96.889) | ||||
| ALT (U/L) | 100.5 (61–162) | −0.043 (−0.214, 0.129) | 0.624 | |||
| PT-INR | 1.2 (1.1–1.4) | 115.272 (47.327, 183.217) | 0.001 | 110.359 (46.868, 173.850) | 0.001 | |
| Coadministered drugs | ||||||
| Azole | 6 (1.8) | −23.766 (−209.391, 161.859) | 0.865 | |||
| Macrolides | 0 (0) | - | ||||
| Phenobarbital | 20 (6.1) | 23.765 (−76.244, 123.774) | ||||
| Diarrhea | 8 (2.5) | −45.752 (−192.896, 101.392) | 0.541 | |||
| Analytic method | ||||||
| CLIA | 225 (69) | Reference | 0.442 | |||
| ACMIA | 52 (16) | 3.793 (−62.343, 69.929) | ||||
| MEIA | 49 (15) | −41.845 (−108.567, 24.878) | ||||
| Donor variables | ||||||
| Age, yr | 35.0 (31–39) | 7.131 (3.631, 10.631) | <0.001 | 2.440 (−1.247, 6.127) | 0.194 | |
| Sex, male | 125 (38.3) | −26.513 (−74.639, 21.614) | 0.279 | |||
| BMI, kg/m2 | 21.1 (15–29) | 10.012 (0.349, 19.676) | 0.042 | 2.388 (−7.048, 11.825) | 0.619 | |
| ALT before transplantation, U/L | 15 (2–63) | −0.584 (−3.592, 2.424) | 0.703 | |||
| Total bilirubin before transplantation, mg/dL | 0.81 (0.35–1.03) | 51.947 (−15.213, 119.107) | 0.129 | |||
| Operation-related variables | ||||||
| GRWR (%) | 2.37 (1.65–3.13) | −79.448 (−102.964, −55.933) | <0.001 | −53.795 (−87.226, −20.363) | 0.002 | |
| Graft type | ||||||
| LLS | 217 (66.6) | Reference | <0.001 | |||
| Reduced or hyperreduced LLS | 63 (19.3) | 22.894 (−36.486, 82.275) | ||||
| Others | 46 (14.1) | 200.882 (134.421, 267.343) | ||||
| CIT, min | 31.5 (21–59) | 0.164 (−0.444, 0.771) | 0.596 | |||
| WIT, min | 28.0 (24–33) | −1.366 (−3.948, 1.217) | 0.299 | |||
| Blood volume loss during LT, mL/kg | 60.6 (34.1–107.6) | −0.106 (−0.348, 0.136) | 0.388 | |||
| Operating time, min | 488.5 (424.8–576.3) | 0.278 (0.119, 0.437) | 0.001 | 0.148 (−0.017, 0.314) | 0.079 | |
ACMIA, affinity column–mediated immunoassay; ALT, alanine transaminase; BMI, body mass index; CIT, cold ischemic time; CLIA, chemiluminescent enzyme assay; GRWR, graft-to-recipient body weight ratio; LLS, left lateral segment; LT, liver transplantation; MEIA, microparticle enzyme immunoassay; PT-INR, prothrombin time–international normalized ratio; WIT, warm ischemic time
* Univariate (unadjusted) and multivariate (adjusted) B (regression coefficient) are presented.
† p value and 95% confidence intervals are based on univariate linear regression.
‡ p value and 95% confidence intervals are based on multivariate linear regression.
Time-dependent changes in the correlation between GRWR and the CD ratio are shown in Figure 3. The slope of the regression line gradually diminished from 3 months after LT and flattened at 12 months after LT.
Figure 3.

Time-dependent changes in the correlation between GRWR and the CD ratio.
Graft Liver Prognosis. A total of 9 (2.8%) graft losses were observed during a 1-year period following LT. The causes were chronic rejection (n = 5) and vascular complications (n = 4). Figure 4 shows the Kaplan-Meier curve for graft loss according to the CD ratio quartile range on day 7 after LT. Interestingly, the group with the highest CD ratio ranging from the 75th to the 100th percentile with a median GRWR of 1.65 (interquartile range, 1.19–2.38) showed the lowest graft survival rate (p = 0.002).
Figure 4.
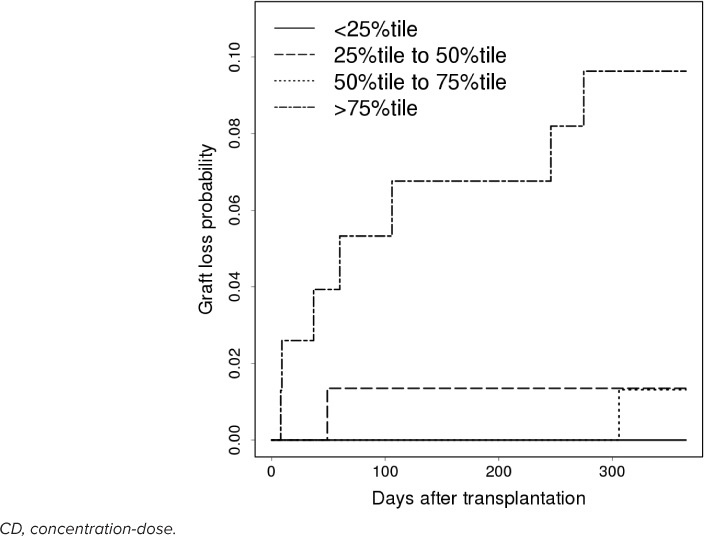
Kaplan-Meier curve for graft loss according to the CD ratio quartile range on day 7 after liver transplantation.
Discussion
This study investigated TAC metabolism after LT in a large pediatric patient population. A gradual decrease of TAC CD ratio, meaning improvement in TAC metabolism, around 1 month after LT was observed. We also found that TAC metabolism was influenced by graft liver size and PT-INR in the early post-LT period. This influence of GRWR gradually diminished from around 6 to 12 months. Importantly, while individual assessments still need to be performed, these results may be applicable to other medications that like TAC, are mainly metabolized by liver enzymes.
The CD ratio has been used in several studies to describe TAC PK after liver and renal transplantation.7–11 For drugs such as TAC, which are eliminated mainly by liver enzymes, the CD ratio indirectly reflects liver activity assuming that TAC is stably absorbed. Goto et al11 reported that the TAC CD ratio decreased over 5 weeks after LT in adult and pediatric living donor LT recipients. This current study reveals a similar trend with the CD ratio during the first month after LT in a large pediatric living donor recipient population. These results may demonstrate that liver function is low immediately after LT but improves gradually during the first month. Similar phenomena were also observed in several studies that used the TAC dose requirement as a surrogate marker in adult living or deceased donor LT recipients.5,6 This may in part be explained by the fact that liver regeneration occurred rapidly in the first month after LT in living donor LT recipients, although the possibility of other contributory factors cannot be excluded.15,16 In addition, several population PK studies12,13,17 have shown that an increase in postoperative days directly improved the metabolism of TAC, as seen in our results. This finding showed that clinicians should keep in mind that the TAC dose requirement may change over time following LT.
This study also revealed that higher GRWR was associated with better TAC metabolism in the early postoperative period. This makes sense physiologically because a larger liver graft contains more metabolic enzymes. In fact, similar phenomena have been observed in previous PK studies.5,11–13 Several studies showed that graft size normalization occurred around 2 to 3 months after LT15,16,18; however, the timing of the normalization of graft liver function has not been studied well. Nadalin et al19 investigated the volumetric and functional recovery of the donor's liver and showed that functional recovery occurred more gradually than volumetric recovery. In the current study, the disappearance of the correlation between the TAC CD ratio and GRWR occurred at 6 to 12 months after LT. This result likely indicates that functional liver volume recovery might be slower than actual liver volume recovery.
Because small graft size is associated with increased graft loss, grafts with a GRWR below 0.8 are generally avoided.20 In fact, only 6 cases (1.8%) in the present study had a GRWR < 0.8, indicating that other surrogate markers are needed to predict graft loss in the early post-LT period. In the current study, a very high CD ratio in the early post-LT period was associated with a higher rate of graft loss. The mechanism underlying the relationship between the TAC CD ratio and graft loss is still unknown. A very elevated TAC CD may indicate poor liver function ultimately associated with graft loss. We believe that the CD ratio may enable clinicians to estimate the risk of graft loss after LT even in the early post-LT period. Further investigation is needed to clarify the relationship between a high TAC CD ratio and graft loss.
Not only GRWR, but also PT-INR was found to be a significant variable that was associated with TAC CD ratio. Prothrombin is a blood coagulation factor produced by the liver. Historically, PT or PT-INR has been used as an indicator of liver disease severity.21 In this study, higher PT-INR, indicating lower liver function, was associated with higher CD ratio. This phenomenon was theoretically reasonable.
This study has several limitations. Three different assays were used to measure the TAC concentration during the study period, possibly biasing TAC concentration. However, approximately 70% of LTs were performed when the TAC concentration was measured by CLIA, which is more accurate and less biased for most concentration ranges than MEIA or ACMIA.22 In addition, the type of analytic method was not found to be significantly associated with CD ratios in univariate linear regression analysis. Therefore, we believe that our results were sufficiently robust. We were unable to include information regarding digestion-related factors in our analyses, such as enteral nutrition, fasting time, and gastrointestinal condition. Tacrolimus was administered orally. Thus these factors may have affected the TAC CD ratio. However, the recipients received enteral nutrition in accordance with an established protocol in the early post-LT period, thereby limiting the interpatient variability in the effect of diet. Finally, we were unable to assess donor and recipient CYP3A4 and 5 polymorphisms, which are reportedly the cause of large interpatient variability in TAC metabolism and absorption affecting the CD ratio.8–10,23 Uesugi et al9 investigated the relationship between the graft liver or the recipients' intestinal CYP3A4 polymorphisms and the TAC CD ratio in a Japanese population, 30% of whom were pediatric LT recipients, and demonstrated that the CYP3A4*1/*1 genotype of the graft liver and intestine correlated with a higher TAC CD ratio than the CYP3A4*1G/*1G genotype in the first month after LT. This finding suggested that our results might have been affected by CYP3A4 polymorphisms as well. Further analysis is needed for clarification.
In conclusion, TAC metabolism gradually improved during the first month after LT and was influenced by graft size in pediatric living donor LT recipients. However, the influence gradually decreased and finally disappeared around 6 to 12 months after LT.
Acknowledgments
Acknowledgments This study was presented in part at the 40th Annual Meeting of Japan Society of Developmental Pharmacotherapy, Tokyo, Japan, November 2016. The authors would like to thank the study participants, transplant surgeons, and the NCCHD coordinators who cared for the LT donors and recipients. We would also like to thank Mr James R. Valera for his assistance in editing this manuscript.
ABBREVIATIONS
- ACMIA
affinity column—mediated immunoassay
- ALT
alanine aminotransferase
- BLQ
below lower limit of quantification
- BMI
body mass index
- CD ratio
concentration-dose ratio
- CIT
cold ischemic time
- CLIA
chemiluminescent enzyme assay
- CYP
cytochrome P450
- GRWR
graft-to-recipient weight ratio
- LLOQ
lower limit of quantification
- LT
liver transplantation
- MEIA
microparticle enzyme immunoassay
- PK
pharmacokinetics
- PT-INR
prothrombin time—international normalized ratio
- TAC
tacrolimus
- WIT
warm ischemic time
Footnotes
Disclosure The authors declare no conflicts or financial interest in any product or service mentioned in the manuscript, including grants, equipment, medications, employment, gifts, and honoraria. The authors had full access to all the data and take responsibility for the integrity and accuracy of the data analysis. This study was supported by NCCHD grants 27-1 and 27-6 awarded to MK and IM, respectively.
REFERENCES
- 1.Kelly DA, Bucuvalas JC, Alonso EM et al. Long-term medical management of the pediatric patient after liver transplantation: 2013 practice guideline by the American Association for the Study of Liver Diseases and the American Society of Transplantation. Liver Transpl. 2013;19(8):798–825. doi: 10.1002/lt.23697. [DOI] [PubMed] [Google Scholar]
- 2.Kamdem LK, Streit F, Zanger UM et al. Contribution of CYP3A5 to the in vitro hepatic clearance of tacrolimus. Clin Chem. 2005;51(8):1374–1381. doi: 10.1373/clinchem.2005.050047. [DOI] [PubMed] [Google Scholar]
- 3.Wallemacq PE, Verbeeck RK. Comparative clinical pharmacokinetics of tacrolimus in paediatric and adult patients. Clin Pharmacokinet. 2001;40(4):283–295. doi: 10.2165/00003088-200140040-00004. [DOI] [PubMed] [Google Scholar]
- 4.Sattler M, Guengerich FP, Yun CH et al. Cytochrome P-450 3A enzymes are responsible for biotransformation of FK506 and rapamycin in man and rat. Drug Metab Dispos. 1992;20(5):753–761. [PubMed] [Google Scholar]
- 5.Liu F, Li Y, Lan X et al. Tacrolimus dosage requirements in living donor liver transplant recipients with small-for-size grafts. World J Gastroenterol. 2009;15(31):3931–3936. doi: 10.3748/wjg.15.3931. [DOI] [PMC free article] [PubMed] [Google Scholar]
- 6.Taber DJ, Dupuis RE, Fann AL et al. Tacrolimus dosing requirements and concentrations in adult living donor liver transplant recipients. Liver Transpl. 2002;8(3):219–223. doi: 10.1053/jlts.2002.30885. [DOI] [PubMed] [Google Scholar]
- 7.Tholking G, Siats L, Fortmann C et al. Tacrolimus concentration/dose ratio is associated with renal function after liver transplantation. Ann Transplant. 2016;21:167–179. doi: 10.12659/aot.895898. [DOI] [PubMed] [Google Scholar]
- 8.Uesugi M, Kikuchi M, Shinke H et al. Impact of cytochrome P450 3A5 polymorphism in graft livers on the frequency of acute cellular rejection in living-donor liver transplantation. Pharmacogenet Genomics. 2014;24(7):356–366. doi: 10.1097/FPC.0000000000000060. [DOI] [PubMed] [Google Scholar]
- 9.Uesugi M, Hosokawa M, Shinke H et al. Influence of cytochrome P450 (CYP) 3A4*1G polymorphism on the pharmacokinetics of tacrolimus, probability of acute cellular rejection, and mRNA expression level of CYP3A5 rather than CYP3A4 in living-donor liver transplant patients. Biol Pharm Bull. 2013;36(11):1814–1821. doi: 10.1248/bpb.b13-00509. [DOI] [PubMed] [Google Scholar]
- 10.Thervet E, Anglicheau D, King B et al. Impact of cytochrome p450 3A5 genetic polymorphism on tacrolimus doses and concentration-to-dose ratio in renal transplant recipients. Transplantation. 2003;76(8):1233–1235. doi: 10.1097/01.TP.0000090753.99170.89. [DOI] [PubMed] [Google Scholar]
- 11.Goto M, Masuda S, Kiuchi T et al. CYP3A5*1-carrying graft liver reduces the concentration/oral dose ratio of tacrolimus in recipients of living-donor liver transplantation. Pharmacogenetics. 2004;14(7):471–478. doi: 10.1097/01.fpc.0000114747.08559.49. [DOI] [PubMed] [Google Scholar]
- 12.Musuamba FT, Guy-Viterbo V, Reding R et al. Population pharmacokinetic analysis of tacrolimus early after pediatric liver transplantation. Ther Drug Monit. 2014;36(1):54–61. doi: 10.1097/FTD.0b013e31829dcbcd. [DOI] [PubMed] [Google Scholar]
- 13.Guy-Viterbo V, Scohy A, Verbeeck RK et al. Population pharmacokinetic analysis of tacrolimus in the first year after pediatric liver transplantation. Eur J Clin Pharmacol. 2013;69(8):1533–1542. doi: 10.1007/s00228-013-1501-0. [DOI] [PubMed] [Google Scholar]
- 14.Shigeta T, Sakamoto S, Uchida H et al. Basiliximab treatment for steroid-resistant rejection in pediatric patients following liver transplantation for acute liver failure. Pediatr Transplant. 2014;18(8):860–867. doi: 10.1111/petr.12373. [DOI] [PubMed] [Google Scholar]
- 15.Haga J, Shimazu M, Wakabayashi G et al. Liver regeneration in donors and adult recipients after living donor liver transplantation. Liver Transpl. 2008;14(12):1718–1724. doi: 10.1002/lt.21622. [DOI] [PubMed] [Google Scholar]
- 16.Kawasaki S, Makuuchi M, Ishizone S et al. Liver regeneration in recipients and donors after transplantation. Lancet. 1992;339(8793):580–581. doi: 10.1016/0140-6736(92)90867-3. [DOI] [PubMed] [Google Scholar]
- 17.Yang JW, Liao SS, Zhu LQ et al. Population pharmacokinetic analysis of tacrolimus early after Chinese pediatric liver transplantation. Int J Clin Pharmacol Ther. 2015;53(1):75–83. doi: 10.5414/CP202189. [DOI] [PubMed] [Google Scholar]
- 18.Humar A, Kosari K, Sielaff TD et al. Liver regeneration after adult living donor and deceased donor split-liver transplants. Liver Transpl. 2004;10(3):374–378. doi: 10.1002/lt.20096. [DOI] [PubMed] [Google Scholar]
- 19.Nadalin S, Testa G, Malago M et al. Volumetric and functional recovery of the liver after right hepatectomy for living donation. Liver Transpl. 2004;10(8):1024–1029. doi: 10.1002/lt.20182. [DOI] [PubMed] [Google Scholar]
- 20.Brown RS., Jr. Live donors in liver transplantation. Gastroenterology. 2008;134(6):1802–1813. doi: 10.1053/j.gastro.2008.02.092. [DOI] [PMC free article] [PubMed] [Google Scholar]
- 21.Robert A, Chazouilleres O. Prothrombin time in liver failure: time, ratio, activity percentage, or international normalized ratio? Hepatology. 1996;24(6):1392–1394. doi: 10.1053/jhep.1996.v24.pm0008938167. [DOI] [PubMed] [Google Scholar]
- 22.Hashi S, Masuda S, Kikuchi M et al. Assessment of four methodologies (microparticle enzyme immunoassay, chemiluminescent enzyme immunoassay, affinity column-mediated immunoassay, and flow injection assay-tandem mass spectrometry) for measuring tacrolimus blood concentration in Japanese liver transplant recipients. Transplant Proc. 2014;46(3):758–760. doi: 10.1016/j.transproceed.2013.11.060. [DOI] [PubMed] [Google Scholar]
- 23.Durand P, Debray D, Kolaci M et al. Tacrolimus dose requirement in pediatric liver transplantation: influence of CYP3A5 gene polymorphism. Pharmacogenomics. 2013;14(9):1017–1025. doi: 10.2217/pgs.13.87. [DOI] [PubMed] [Google Scholar]