Abstract
BACKGROUND. Simultaneous noninvasively recorded skin sympathetic nerve activity (SKNA) and electrocardiogram (neuECG) can be used to estimate cardiac sympathetic tone. We tested the hypothesis that large and prolonged SKNA bursts are associated with temporal clustering arrhythmias.
METHODS. We recorded neuECG in 10 patients (69 ± 10 years old) with atrial fibrillation (AF) episodes and in 6 patients (50 ± 13 years old) with ventricular tachycardia (VT) or fibrillation (VF) episodes. Clustering was defined by an arrhythmic episode followed within 1 minute by spontaneous recurrences of the same arrhythmia. The neuECG signals were bandpass filtered between 500–1000 Hz to display SKNA.
RESULTS. There were 22 AF clusters, including 231 AF episodes from 6 patients, and 9 VT/VF clusters, including 99 VT/VF episodes from 3 patients. A total duration of SKNA bursts associated with AF was longer than that during sinus rhythm (78.9 min/hour [interquartile range (IQR) 17.5–201.3] vs. 16.3 min/hour [IQR 14.5–18.5], P = 0.022). The burst amplitude associated with AF in clustering patients was significantly higher than that in nonclustering patients (1.54 μV [IQR 1.35–1.89], n = 114, vs. 1.20 μV [IQR 1.05–1.42], n = 21, P < 0.001). The SKNA bursts associated with VT/VF clusters lasted 9.3 ± 3.1 minutes, with peaks that averaged 1.13 ± 0.38 μV as compared with 0.79 ± 0.11 μV at baseline (P = 0.041).
CONCLUSION. Large and sustained sympathetic nerve activities are associated with the temporal clustering of AF and VT/VF.
FUNDING. This study was supported in part by NIH grants R42DA043391 (THE), R56 HL71140, TR002208-01, R01 HL139829 (PSC), a Charles Fisch Cardiovascular Research Award endowed by Suzanne B. Knoebel of the Krannert Institute of Cardiology (TK and THE), a Medtronic-Zipes Endowment, and the Indiana University Health-Indiana University School of Medicine Strategic Research Initiative (PSC).
Keywords: Cardiology
Keywords: Arrhythmias
Large and sustained skin sympathetic nerve activity bursts underlie the mechanisms of temporal clustering arrhythmias.
Introduction
While earlier studies described the occurrence of cardiac arrhythmias as random events, data from implanted devices showed strong evidence of temporal clustering of the cardiac arrhythmia episodes (1–3). A more recent study analyzed more than a million paroxysmal atrial fibrillation (AF) episodes (4). The authors reported 2 distinct subtypes: the staccato subtype, characterized by many, short AF episodes; and the legato subtype, characterized by fewer, longer episodes. About 13.0% of that study population averaged 1 paroxysmal AF event every 2 hours, and 6.5% averaged at least 1 event each hour. The clustering of ventricular tachycardia (VT) and ventricular fibrillation (VF) forms the basis of electrical storm, which is associated with significant cardiovascular morbidity (5). Because cardiac electrophysiology is strongly modulated by the autonomic nervous system (ANS) (6, 7), it is reasonable to hypothesize that ANS activation plays a major role in arrhythmic clustering. However, it is difficult to perform heart rate variability (HRV) analyses when patients have ongoing cardiac arrhythmias to test that hypothesis. Microneurography is a standard technique for sympathetic nerve activity (SNA) recording. However, because it is technically difficult to achieve stable long-term impalement, the SNA patterns during arrhythmia clustering remain unclear. We (8) recently invented a potentially new method to simultaneously record electrocardiogram (ECG) and skin SNA (SKNA). This potentially new method (neuECG) has been used to document an association between SNA and the initiation of tachyarrhythmias (9, 10). However, those studies did not determine the mechanisms of arrhythmia clustering. While an electrical storm is usually defined by the occurrence of 3 or more episodes of arrhythmia over a 24-hour period (2, 11), some recurrent arrhythmias may occur within minutes of each other and cause consecutive and futile implantable cardioverter-defibrillator (ICD) therapies. We hypothesize that sustained high-amplitude SNA discharges are responsible for the immediate (within 1 minute) recurrences of cardiac arrhythmias, causing arrhythmia clustering. We prospectively recorded neuECG in patients with recurrent atrial and ventricular arrhythmias to test that hypothesis.
Results
SKNA and Clustering of AF
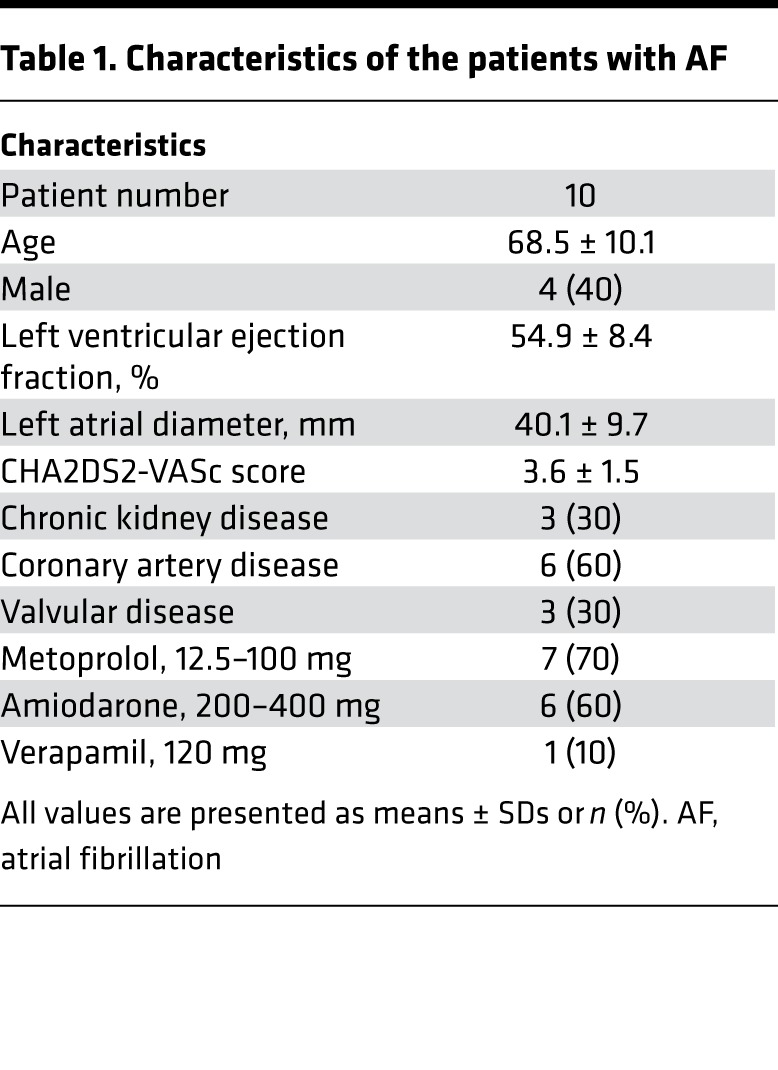
The patient characteristics are shown in Table 1. We studied a total of 10 patients (average age 68.5 ± 10.1 years old, 4 males) with clinical recurrent paroxysmal AF episodes. There were no complications associated with neuECG recording over 25.1 ± 11.6 hours. A total of 301 AF episodes (18.5 per patient [Interquartile range (IQR) 4.8–44.3]) were recorded, including 145 immediate recurrence of AF (IRAF) and 156 non-IRAF episodes. The average duration per episode of IRAF was longer than that of non-IRAF (57.0 seconds [IQR 22.0–332.0] vs. 38.5 seconds [IQR 17.0–118.5], P = 0.018).
Table 1. Characteristics of the patients with AF.
Heightened SKNA and clustering of AF episodes.
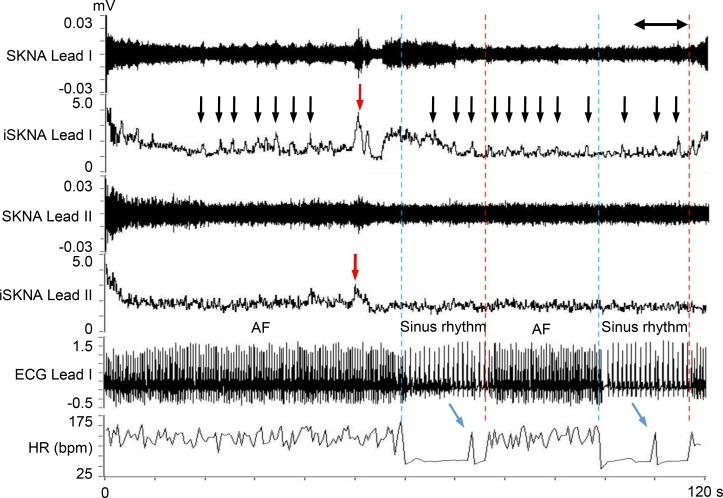
Figure 1 shows a representative neuECG recording of AF. Small bursts of SKNA (black arrows) are seen throughout the recording. A large SKNA burst (red arrow) was observed immediately before AF termination (blue dotted line). After 18 seconds of sinus rhythm, the AF was reinitiated (red dotted line). Because the interval between the AF onset and the prior AF episode was <1 minute, this second AF episode is classified as IRAF. Heightened SKNA and a premature atrial contraction (PAC) were noted prior to IRAF (blue arrows).
Figure 1. Representative neuECG recording of an IRAF episode.
These recordings were performed using standard skin patch electrodes. Consistent with that reported in a previous manuscript (9), large bursts of SKNA (red arrows) were associated with AF termination. There were 2 consecutive IRAF episodes that occurred within 60 seconds (s) of the prior episode of AF. Each episode was preceded by a premature atrial contribution (blue arrows). Small bursts of nerve activities (black arrows) were seen multiple times during the recording. The onsets of AF are indicated by red dotted lines, and the terminations of AF are indicated by blue dotted lines. SKNA, skin sympathetic nerve activity; iSKNA, integrated SKNA; AF, atrial fibrillation; ECG, electrocardiogram; HR, heart rate.
SKNA bursts and AF episodes.
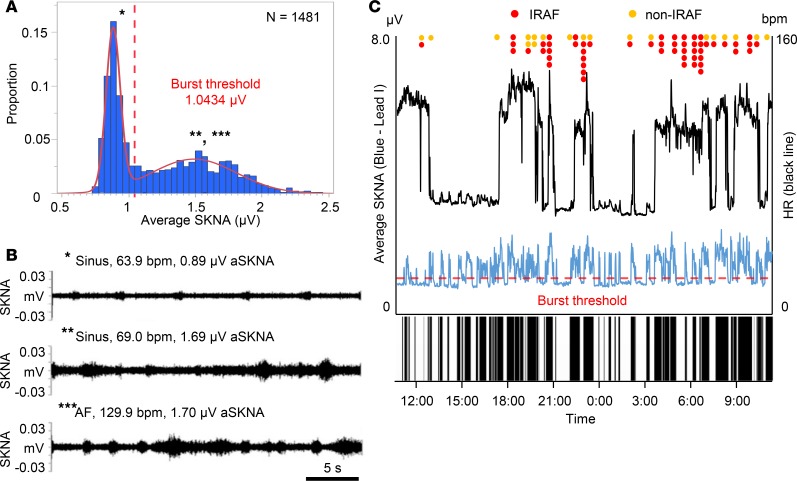
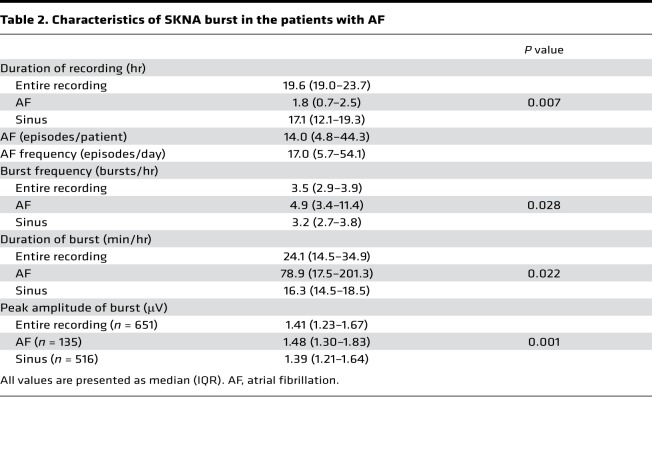
Figure 2 shows the relationship between SKNA bursts and the episodes of spontaneous AF in the same patient as in Figure 1. The recording was 24.7 hours long. We first analyzed the average voltage of SKNA per sample (aSKNA) in each 60-second window. We then plotted the histogram of aSKNA that shows the proportion of windows with a given amplitude (Figure 2A). There are 2 groups of data; each can be fitted with a Gaussian distribution. The first Gaussian distribution represents the baseline nerve discharges, while the second Gaussian distribution represents the burst activity. We used the mean plus 3 times SD of the first Gaussian distribution (1.0434 μV) as the threshold to separate these 2 groups of activities. Figure 2B shows actual recordings at points marked by the single, double, and triple asterisks in Figure 2A. In Figure 2B (top), small SKNA discharges during sinus rhythm occurred regularly. In both the middle and bottom panels of Figure 2B (sinus rhythm and AF, respectively), large SKNA firings were observed irregularly. Figure 2C shows continuous recoding over the same period as shown in Figure 2A. The onsets of AF were indicated by red (IRAF) and orange (non-IRAF) dots. The horizontal dotted red line indicates the threshold for burst determination (1.0434 μV). The leading edge and trailing edge of each burst is automatically determined. Binary time series graph below Figure 2C shows the SKNA burst (black) versus nonbursting period (white). There are a total of 68 SKNA bursts in the entire recording. For identifying the threshold in 10 patients with AF, neuECG recordings were used over a mean of 19.7 ± 5.5 hours (Table 2). There were 14.0 AF episodes per patient (IQR 4.8–44.3). The lower mean of 2 Gaussian distributions was 0.8685 ± 0.1734 μV as the baseline, and the higher one was 1.3245 ± 0.2684 μV as the burst. The mean threshold for the burst determination was 1.0771 ± 0.2293 μV. There were a total of 651 SKNA bursts, including 135 bursts associated with the onset of AF and during AF. More SKNA bursts per recording window occurred at the onset of AF and during AF than that during sinus rhythm (4.9 bursts/hour [IQR 3.4–11.4] vs. 3.2 bursts/hour [IQR 2.7–3.8], P = 0.028). A total duration of burst associated with AF was longer than that during sinus rhythm (78.9 min/hour [IQR 17.5–201.3] vs. 16.3 min/hour [IQR 14.5–18.5], P = 0.022). The peak amplitude of burst associated with AF was higher than that during sinus rhythm (1.48 μV [IQR 1.30–1.83], n = 135 vs. 1.39 μV [IQR 1.21–1.64], n = 516, P = 0.001). The burst amplitude associated with AF positively correlated with the duration of the burst (r = 0.694, P < 0.001), while that during sinus rhythm weakly correlated (r = 0.422, P < 0.001).
Figure 2. Representative SKNA burst in AF patient.
The data came from the same patient as shown in Figure 1. (A) The proportion of aSKNA recorded every 60 s. The aSKNA indicated 2 Gaussian distributions. The burst threshold is indicated by a red dotted line, which was calculated as the mean representing lower amplitude plus 3 times SD. (B) Actual recordings of the SKNA in Lead I in a 30-s window. These recordings correspond to * (sinus), ** (sinus), and *** (AF) in A. Small SKNA discharges occurred regularly (top). Large SKNA bursts were observed irregularly (middle and bottom). (C) Heart rate (black line) and average SKNA (aSKNA) from Lead I (blue) plotted over time. The onsets of AF are indicated by red (IRAF) and orange (non-IRAF) dots. The large and frequent SKNA bursts occurred during AF. There were smaller bursts of nerve activities associated with sinus rate acceleration. Binary time series graph shows the SKNA burst (black) versus nonbursting period (white), indicating that SKNA bursts preceded the AF clustering episodes. SKNA, skin sympathetic nerve activity; AF, atrial fibrillation; HR, heart rate.
Table 2. Characteristics of SKNA burst in the patients with AF.
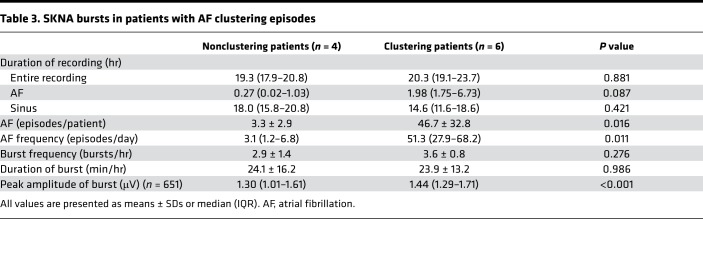
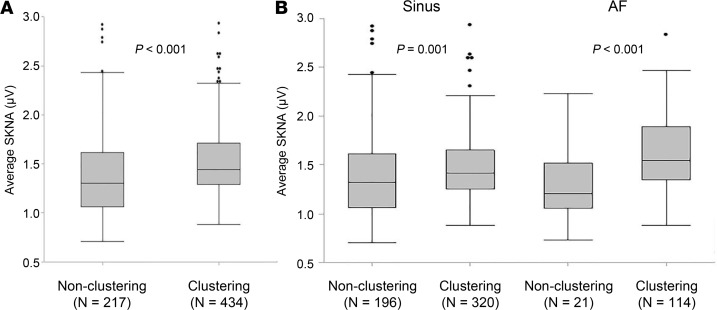
There were 6 patients with clustering episodes (clustering patients) and 4 patients without one (nonclustering patients). Table 3 shows the characteristics of SKNA bursts comparing those patients. More AF episodes were observed in clustering patients than that in nonclustering patients (46.7 ± 32.8/patient vs. 3.3 ± 2.9/patient, P = 0.016; 51.3/day [IQR 27.9–68.2] vs. 3.1/day [IQR 1.2–6.8], P = 0.011). Frequency and duration of SKNA bursts were not significantly different between clustering and nonclustering patients (Table 3). Figure 3 is the box-and-whisker plot indicating the distribution of burst amplitude, which shows a significantly higher range in clustering than nonclustering patients (1.44 μV [IQR 1.29–1.71], n = 434, vs. 1.30 μV [IQR 1.01–1.61], n = 217, P < 0.001) (Figure 3A). Furthermore, the burst amplitude associated with AF in clustering patients is significantly higher than that in nonclustering patients (1.54 μV [IQR1.35–1.89], n = 114, vs. 1.20 μV [IQR 1.05–1.42], n = 21, P < 0.001) (Figure 3B).
Table 3. SKNA bursts in patients with AF clustering episodes.
Figure 3. Distribution of SKNA burst in the patients with clustering versus nonclustering episodes.
The box-and-whisker plots indicate the distribution of peak burst amplitude of average SKNA in a 60-s window. (A) In patients with clustering episodes, SKNA bursts distributed in the higher ranges than in the patients without clustering. (B) The distribution range associated during sinus rhythm are similar in both patients, but median amplitude are higher in the patients with clustering episodes. Furthermore, the distribution of bursts associated with AF in the patients with clustering episodes was much higher than in the patients without one. All box-and-whisker plots show medians and 25th and 75th percentiles, and the whiskers show the minimum and maximum, excluding outlying values. Black dots indicate outlying values. P values shown in A and B were determined by the Mann-Whitney U test. SKNA, skin sympathetic nerve activity; AF, atrial fibrillation; IQR, interquartile range.
SKNA precedes the onset and offset of AF.
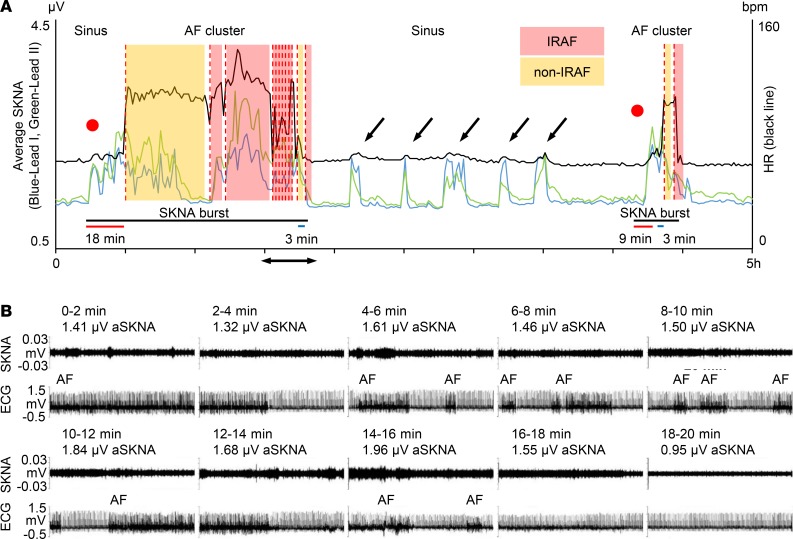
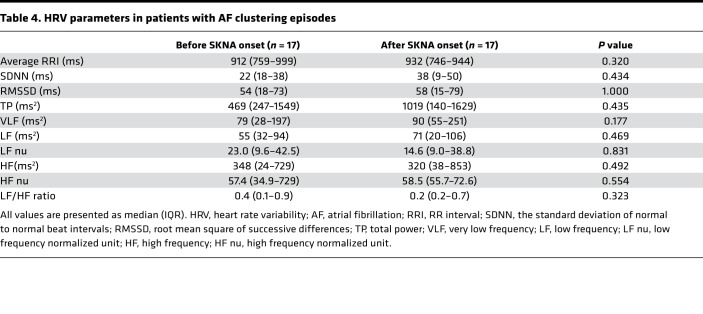
Figure 4 shows a typical example of AF clustering. Figure 4A shows continuous recording in the same patient as shown in Figure 1. The initial rhythm was sinus. A large increase of aSKNA is associated with sinus rate acceleration (red dot), followed by onset of AF (first red dotted line). These consecutive SKNA bursts lasted 96 minutes (black bar), during which multiple episodes of AF were observed. Subsequent short bursts of SKNA were associated with sinus rate acceleration but not AF, until toward the right end of the recording, when a larger and long (21-minute) burst of SKNA resulted in AF episodes. The latency between onset of aSKNA to first episodes of AF was 18 minutes for the first and 9 minutes for the second cluster (red bars). The latency between the last peaks of aSKNA to last episodes of AF was 3 minutes for both clusters (blue bars). There were 22 AF clusters including 231 AF episodes (5.0/cluster [IQR 3.0–12.8]) from 6 patients studied (average 3.7 ± 1.8 per patient). In 22 clusters of AF episodes, peak amplitude of SKNA was 1.97 ± 0.58 μV, which was more than twice the baseline SKNA values taken before the onset of the bursts (0.98 ± 0.33, P < 0.001). The mean duration of nerve bursts associated with AF clustering were 74.0 ± 59.9 minutes. The median of latency between large aSKNA to the onset of AF cluster was 9.0 minutes (IQR 5.0–15.5). The median of latency from the last peak of SKNA bursts to the last AF episode was 6.5 minutes (IQR 2.3–9.8). We performed HRV analyses in 17 AF clustering episodes. As shown in Table 4, there were no differences in HRV parameters in either the time or the frequency domain analyses. In 9 AF clustering episodes, multiple PACs preceded the onset of clustering after SKNA activation. However, there were no differences in peak SKNA amplitude, burst duration, or the latency to the onset of AF cluster, regardless of the presence of preceding PACs. The aSKNA 10 seconds prior to the onset of IRAF were significantly higher than that of non-IRAF (1.61 ± 1.04 μV vs. 1.14 ± 0.37 μV, P < 0.001). Similarly, aSKNA 10 seconds before and after termination of AF were both higher in IRAF than those of non-IRAF (1.53 ± 0.96 μV vs. 1.14 ± 0.35 μV, P < 0.001, and 1.55 ± 0.99 μV vs. 1.16 ± 0.39 μV, P = 0.001, respectively).
Figure 4. Typical examples of AF clustering.
The data came from the same patient as shown in Figure 1. (A) Heart rate (black line) and average SKNA (aSKNA) from Lead I (blue) and Lead II (green) plotted over time. The onsets of AF are indicated by red dotted lines. Color shades indicate the duration of IRAF and non-IRAF episodes. Two red dots indicate the onset of SKNA, which was associated with sinus HR acceleration before the development of AF. There is an onset latency between SKNA to the first AF episode (red bars) and an offset latency between the last peak of aSKNA to the last AF episode (blue bars). The first large SKNA bursts lasted 96 minutes and the second episode lasted 21 minutes (black bars). There were smaller bursts of nerve activities associated with sinus rate acceleration (black arrows). (B) Actual recordings of the SKNA in Lead I (upper tracing) and ECG (lower tracing) in consecutive 2-minute windows showing multiple episodes of IRAF. The time of these recordings correspond to the double-headed arrows in A. High aSKNA level continued between IRAF episodes. The SKNA level reduced to baseline at the end of the 20-minute window, and no AF was observed for the next 2 hours. SKNA, skin sympathetic nerve activity; AF, atrial fibrillation; HR, heart rate; ECG, electrocardiogram.
Table 4. HRV parameters in patients with AF clustering episodes.
Bradycardia and IRAF.
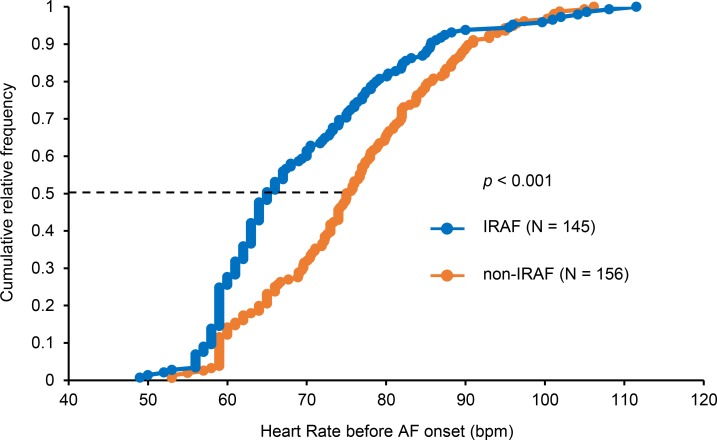
In spite of high sympathetic tone, there was significant bradycardia prior to the onset of IRAF episodes (Figure 1). The sinus heart rate (HR) before onset was significantly lower in IRAF than in non-IRAF episodes (69.6 ± 12.7 beats per minute [bpm] vs. 75.8 ± 11.8 bpm, P < 0.001). The cumulative relative frequency distribution of the HR before IRAF was significantly (P < 0.001) lower than that of non-IRAF (Figure 5). Bradycardia 10 seconds before the onset of AF was observed in 40 IRAF episodes (27.6%) and 22 non-IRAF (14.1%). The odds ratio was 2.32 (95% CI, 1.30–4.14, P = 0.004). Simultaneous sympathovagal discharges are associated with the onset of AF in a canine model (12). However, we do not have vagal nerve recording to test that hypothesis.
Figure 5. Cumulative relative frequency of heart rate 10 s before AF onset.
There was a significant (P < 0.001) difference between heart rate before IRAF (blue line) and that of non-IRAF (orange line). At 50% of the distribution (dotted line), heart rate before onset was 65 bpm in IRAF and 75 bpm in non-IRAF. The P value was determined by the Mann-Whitney U test based on data distribution. AF, atrial fibrillation.
Circadian variation of AF.
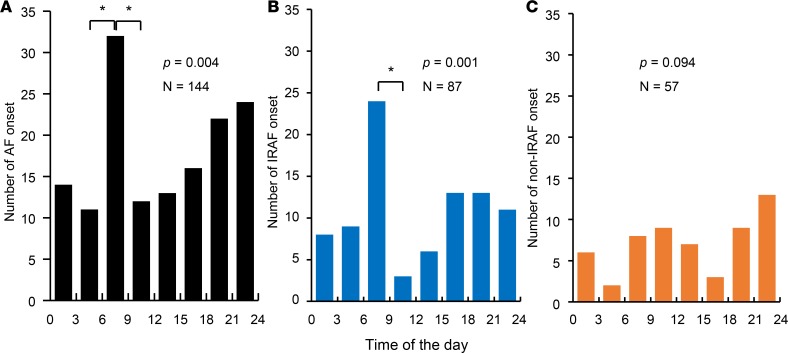
To study the circadian variation of AF onset, 144 AF episodes including 87 IRAF and 57 non-IRAF from 6 patients (24.0 ± 29.7 episodes/patient) with over 24 hours (24.7 hours [IQR 24.5–27.2]) of continuous recording were analyzed. Figure 6A shows that, for all AF episodes studied, the AF onset was not uniformly distributed (P < 0.004). There was a significant increase of AF onsets in early morning as compared with other times of the day (P < 0.00179 after Bonferroni correction). When only IRAF episodes were analyzed (Figure 6B), the same early morning peak was detected (P = 0.001). A total 24 IRAF episodes (27.5%) occurred between 6 a.m. and 9 a.m. The presence of an early morning peak and a second afternoon peak in Figure 6B is similar to the circadian distribution reported for symptomatic AF episodes (13). In contrast, there was no significant differences in the distribution of non-IRAF episodes (Figure 6C).
Figure 6. The distribution of AF episodes in 3-hour bins over a 24-hour period of all patients studied.
(A) The number of AF onset. There were a peak in early morning and another one prior to midnight. Among them, only the early morning peak had significantly (*P < 0.00179) more episodes than other times of the day adjusted by Bonferroni correction. (B) Similar to A, the distribution of IRAF episodes shows a significant peak in early morning. (C) There was no significant difference in the distribution of non-IRAF episodes at different times of the day. P values in A–C were determined by the χ2 goodness-of-fit test, and post hoc pair-wise comparison of the number of AF onset were performed by the exact binomial test with Bonferroni correction. AF, atrial fibrillation.
SKNA and clustering of ventricular arrhythmias
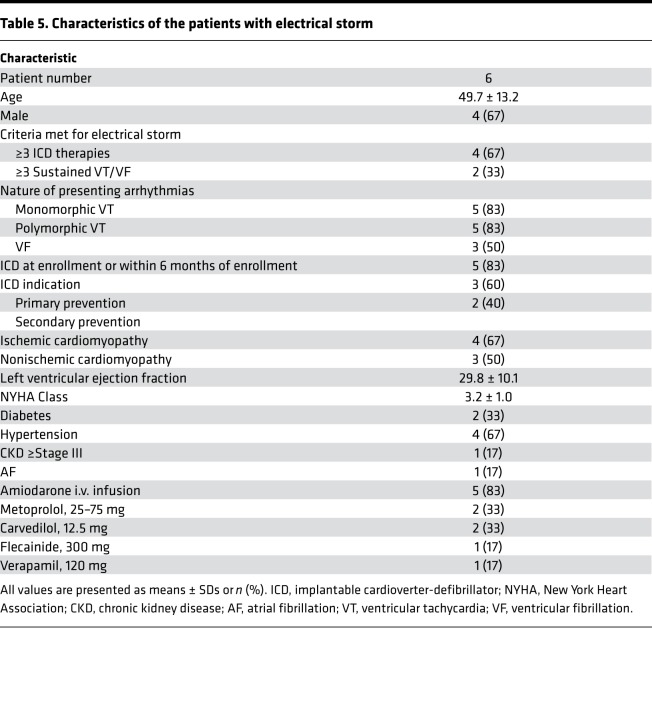
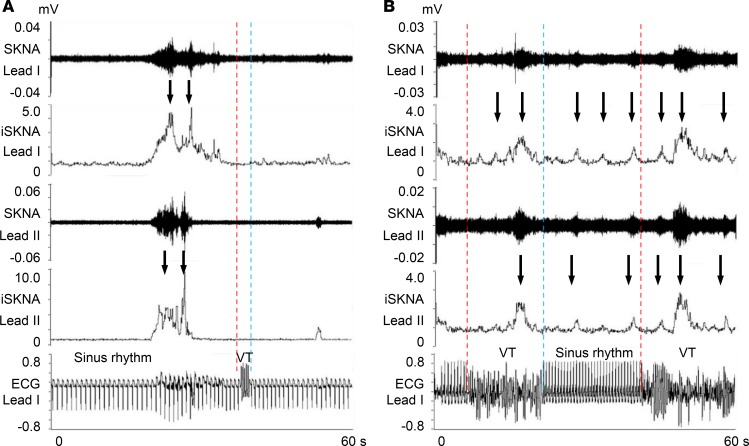
Table 5 shows the clinical characteristics of the patients included in the study. Among a total of 119 episodes, 84 were immediate recurrences of VT/VF (IRVT) and 35 were non-IRVT episodes. Figure 7, A and B, show typical examples of non-IRVT and IRVT episodes, respectively. There were multiple SKNA bursts before the onset of all VT episodes (downward arrows). In these examples, non-IRVT was monomorphic (Figure 7A), while IRVT was polymorphic (Figure 7B). For all episodes studied, IRVT episodes were significantly more likely to be polymorphic than non-IRVT episodes (odds ratio = 9.90; 95% CI, 3.79–25.83, P < 0.001).
Table 5. Characteristics of the patients with electrical storm.
Figure 7. Relationship between SKNA and VT.
(A) Actual recording of the SKNA in Lead I and ECG in the patient with single VT episode. The onsets of VT are indicated by red dotted lines, and the terminations of VT are indicated by blue dotted lines. SKNA discharges (downward arrows) were observed before VT onset. (B) Actual recording in the patient with early recurrence of VT episodes. Multiple SKNA bursts occurred during sinus rhythm between VT episodes and also during VT. SKNA, skin sympathetic nerve activity; iSKNA, integrated SKNA; VT, ventricular tachycardia; ECG, electrocardiogram; HR, heart rate.
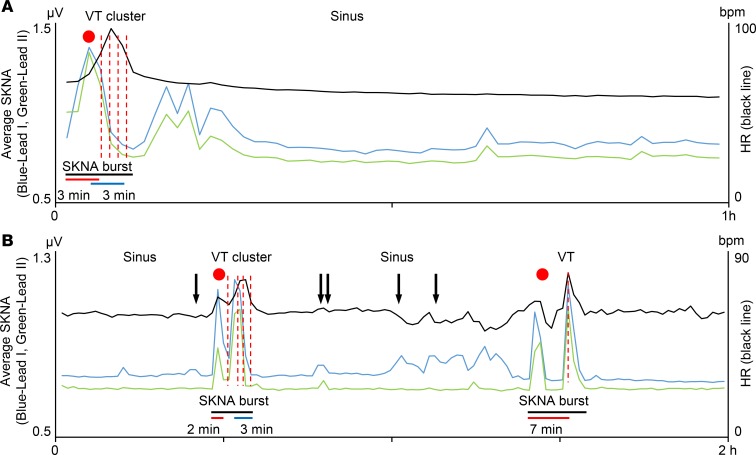
Figure 8 shows that the clustering of the VT episodes were associated with large and long bursts of SKNA in 2 different patients. Figure 8A shows a 1-hour tracing of aSKNA in a patient with 8 episodes of recurrent VT/VF. Following large elevation of SKNA, there was initially sinus rate acceleration (red dot) followed by multiple episodes of VT (red dotted lines). The latency between aSKNA onset and VT was 3 minutes (red bar). The latency between the last peak of aSKNA and last episode of VT was 3 minutes (blue bar). After VT clustering, the smaller aSKNA bursts failed to induce any cardiac arrhythmias. Figure 8B shows a 2-hour tracing of aSKNA in a different patient with 11 recurrent VT/VF episodes. Similar to Figure 8A, the elevation of SKNA preceded VT episodes, and the latency between SKNA onset and VT were 2 minutes and 7 minutes, respectively. The aSKNA returned to baseline after the first cluster. The small bursts of SKNA only resulted in sinus rate variations, while a larger burst of aSKNA resulted in subsequent non-IRVT. Because HR and nerve activities were averaged over 1-minute windows that contain both sinus rhythm and VT, the HR was <100 bpm in these graphs. When we analyzed only the rate of VT episodes, they were 151.5 ± 23.0 bpm (n = 11) for Figure 8A and 175.8 ± 6.6 bpm for Figure 8B (n = 8). Due to the temporal proximity of IRVT episodes, not all VT onsets were represented by a red dotted line in that figure. There were 9 VT clusters including a total of 99 VT/VF episodes (10.0 per cluster [IQR 4.0–13.0]) from 3 patients (3.0 ± 2.0 per patient). The aSKNA bursts associated with VT/VF clustering had peaks that averaged 1.13 ± 0.38 μV, which was greater than the baseline aSKNA taken from the time prior to VT/VF onset (0.79 ± 0.11 μV, P = 0.041). The mean burst duration associated with VT/VF clustering was 9.3 ± 3.1 minutes, which was significantly (P < 0.001) shorter than that of AF clustering. The average latency between large aSKNA and the onset of VT cluster was 2.7 ± 1.5 minutes, which was significantly (P = 0.001) shorter than between the increase of aSKNA to the onset of AF clustering. The latency between the last SKNA peak and the offset of VT cluster (i.e., the final episode of VT/VF) was 2.0 ± 1.3 minutes, which was also significantly (P = 0.010) shorter than the latency between last SKNA peak and the offset of AF clusters. The IRVT episodes were more likely to occur within 1 minute of aSKNA peak (81.3% ± 15.5%) than the IRAF (50.9% ± 18.1%, P = 0.025).
Figure 8. Clustering of VT episodes.
(A) The data came from same patient as shown in Figure 6B. Heart rate (black line) and average SKNA (aSKNA) from Lead I (blue) and Lead II (green) are plotted over time. A total of 8 VT episodes occurred during 1-hour periods of aSKNA. The onsets of VT are indicated by red dotted lines, with each red dotted line representing several individual episodes of VT, which could not be distinguished graphically. A red dot indicates the onset of aSKNA, which is associated with sinus HR acceleration before the development of VT. There is the latency between SKNA activation and the first VT onset (red bar) and deactivation to the last VT episode (blue bar). The large burst lasted 6 minutes (black bar). After VT clustering, smaller aSKNA bursts did not induce VT. (B) The data came from a different patient. A total of 11 VT episodes were observed during 2 hours of recording. Similar to A, large SKNA bursts preceded VT episodes, and the latency between SKNA onset and VT were 2 minutes and 7 minutes, respectively. There were smaller bursts of nerve activities associated with premature ventricular contributions (black arrows).
Discussion
A major finding of this study is that large and sustained SKNA is associated with the temporal clustering of paroxysmal AF and VT/VF episodes. These findings suggest that neuromodulation methods that inhibit or reduce SNA may prevent arrhythmia clustering. However, because bursts of SKNA may also precede the termination of paroxysmal AF episodes (14), it is also possible that neuromodulation may be proarrhythmic in some patients.
SNA and cardiac arrhythmia.
In ambulatory dogs, both extrinsic and intrinsic cardiac nerve activities frequently precede the onset of spontaneous atrial tachycardia and AF (15–17). Ablation of the stellate ganglion (SG) or the ganglionated plexi (GP) reduced or eliminated these atrial arrhythmias, suggesting a causal relationship between SNA and the occurrences of AF (17–19). It is possible that SG ablation or block in humans might also be useful in suppression AF, which is the most common cause of inappropriate shocks in patients with ICDs (20). However, because clustering of AF does not create a medical emergency, it is difficult to justify an invasive and irreversible procedure to control these arrhythmias. On the other hand, recurrent VT/VF (electrical storm) requires immediate and intensive antiarrhythmic management. The most commonly used drugs include amiodarone and β blockers (21, 22). In patients refractory to pharmacological managements, percutaneous SG block and left cardiac sympathetic denervation might be effective (23–25). However, we do not have data in the present study to document a causal relationship between SKNA bursts and arrhythmia clustering. We have previously recorded SKNA in patients with epilepsy but no heart diseases (26). In that study, bursts of SKNA did not induce AF. In contrast, out of a total of 651 SKNA bursts in the present study, 135 were associated with AF. These findings suggest that SKNA bursts may be one of the proarrhythmic influences that play a prominent role in some patients and their arrhythmias and less so in others.
SKNA burst detection.
Taniguchi et al. (27) used unconjugated horseradish peroxidase as a tracer to study the source of skin sympathetic nerves in dogs. The results show that the sympathetic postganglionic fibers from the SG are distributed in the skin area between the third cervical vertebra and the level of the thirteenth rib. The direct communication between the SG and the cervical/thoracic skin provided the physiological basis for the use of SKNA to estimate the SG nerve activity (SGNA) in canine (28, 29) models and in humans (8–10). A prominent characteristic of the electrical activity in the nervous system is the prevalence of spontaneous activity, both at the level of the spatially summed potentials observed with a gross electrode and at the level of the action potentials of a single neuron (30). These spontaneous activities include both single-spike activity and the burst-firing mode (31). The single-spike mode of nerve activity demonstrates a variations of activation frequencies and amplitude with Gaussian distribution (30, 31). The burst mode increases the number of nerve spikes within a unit time, resulting in increased amplitudes and firing frequencies. The burst discharges, therefore, should have a higher integrated or averaged nerve activity per unit time window than single-spike activity. Bursts are important physiological events but are difficult to identify because bursting activities or patterns vary with physiological conditions or external stimuli. One approach is to analyze the interspike interval or spike frequencies and to then use mathematical calculations and statistical analyses to achieve burst detection (32, 33). However, a computer algorithm may not be completely reliable. Thus, manual analyses by blinded observers are needed to detect and count bursts (34). While it is possible to detect spike frequencies of single neurons, the same may not be applicable to recordings made with gross electrodes. One advantage of neuECG recording, over the microelectrode recording, is that neuECG recording uses equipment calibrated for voltage recording rather than using artificial amplitude units. Because true voltage is available for each digitized data point, it is possible to develop an amplitude based automated method for burst detection, as shown in Figure 2. We found that the amplitudes and the duration of the bursts are both associated with the occurrences of AF and VT. Large sustained SNA bursts are responsible for the generation and maintenance of the arrhythmia clusters observed in this study. These findings are consistent with the clinical observation that percutaneous SG block and left cardiac sympathetic denervation are effective in managing patients with drug-resistant ventricular arrhythmias (23–25).
Staccato and the legato types of AF.
Wineinger et al. (4) recently reported that there are 2 types of AF. The AF with short duration and frequent episodes were staccato type, while the ones with longer but less frequent episodes were the legato type. The authors posit that paroxysmal AF progresses over time from the staccato to the legato phenotype, where the shorter events grow longer and begin to link with one another to generate more sustained bouts. The patients in the present study also have 2 distinct phenotypes. The 6 patients with clustering episodes of AF had the extreme staccato types of AF, with an average of 51.3 episodes of AF per day. The remaining 4 patients had much fewer episodes of AF (3.1 episodes/day) but still fell within the spectrum of staccato type of AF. While the frequency and duration of SKNA bursts were not significantly different between these 2 types of AF, the burst amplitude was much higher in clustering than nonclustering patients. These data suggest that these 2 AF phenotypes are determined, at least in part, by the magnitudes of SNA and may be amenable to neuromodulation procedures that reduce sympathetic tone. However, we do not have data on legato type AF for comparison. Prolonged outpatient monitoring will be needed to detect that type of AF.
The latency between onset and offset of large SKNA bursts and the occurrence and termination of cardiac arrhythmia clusters.
We documented a significant latency between the onset and offset of SKNA bursts and the occurrence and termination, respectively, of cardiac arrhythmia clusters. These findings suggest that prolonged large SNA bursts measured in minutes are needed to be arrhythmogenic, and their electrophysiological effects continue for at least a few minutes after termination of the bursts. A possible explanation for these observations is that persistent large-nerve discharges are needed for sufficient neurotransmitters to accumulate in the myocardium, leading to electrophysiological changes needed to induce arrhythmia. Similarly, after the large burst subsides, time is needed for those transmitters to be removed from the myocardium. Before they are removed, the patients are at risk for further arrhythmia episodes. In normal dogs, the myocardial norepinephrine (NE) concentration is over 1000 ng/g of the ventricular tissue, while the plasma NE is only around 200 pg/ml (35). Heart failure massively increases plasma NE but reduces the myocardial NE concentration due to loss of nerve terminals (35) and/or a posttranscriptional downregulation of NE transporter per neuron (36). The VT/VF patients in the present study had low left ventricular ejection fraction and heart failure. The reduced nerve terminal and inefficient NE uptake might partially explain the mechanisms of short latency between onset of SKNA and VT/VF clustering. In contrast, the latency is longer in patients with AF, who mostly do not have heart failure. In addition to NE accumulation, patients with heart failure are prone to arrhythmogenic ion channel remodeling (37). That remodeling process could also account for a shorter latency in VT/VF than in AF.
Differences of IRAF and IRVT.
Our data show that it is less likely for IRAF to be associated with aSKNA peak than IRVT. The weak relationship of IRAF and the peak of aSKNA suggest that, in addition to sympathetic tone, the parasympathetic nerve activity may also play a role in triggering AF. Consistent with the latter hypothesis, we found a high probability of sinus bradycardia prior to the onset of AF. However, we did not perform direct parasympathetic nerve recording to test that hypothesis.
HRV.
An alternative method for noninvasive determination of autonomic tone is the HRV analyses. However, both AF and heart failure can be associated with significant sinoatrial node dysfunction (38, 39). Because sinoatrial node response to autonomic tone may be compromised, the HRV parameters may not reflect the true autonomic tone. We (40) have previously determined HRV parameters in ambulatory dogs with myocardial infarction. The results show that s.c. nerve activity is more accurate than HRV in estimating SGNA in those dogs. Because almost all of our patients had either AF or heart failure, it is not surprising that HRV analyses failed to detect the elevated sympathetic tone immediately prior to the onset of AF clustering episodes.
Limitations of the study.
The data were obtained while the patients were being managed for their arrhythmias. It is unclear if the antiarrhythmic medications have affected the SKNA patterns.
Conclusion.
We conclude that large and sustained SKNA bursts underlie the mechanisms of clustering of cardiac arrhythmias.
Methods
Study population
We reviewed the live telemetry recording of the inpatients to prospectively identify patients with a history of paroxysmal AF for recording. Patients were treated at IU Health Methodist Hospital, Indianapolis, Indiana, USA. Among a total of 13 patients recorded, 10 had paroxysmal AF during neuECG recording and were included in the analyses. The data from 8 of the 10 patients were used in a previous report (9). We also recorded neuECG from 23 patients admitted to the hospital with 3 or more recurrent ventricular tachyarrhythmias over a 24-hour period (electrical storm). Because of medical therapy, only 10 of the 23 patients had documented VT/VF during the recording period. Among them, 6 had clean neuECG recordings and were included in a previous report (10). The data of the same 6 patients were reanalyzed in this study.
Data analysis
Average SKNA amplitude.
We used a modified portable ME6000 Biomonitor (Mega Electronics Ltd.) for data acquisition. Taniguchi et al. (27) showed that sympathetic postganglionic cells of the SG in dogs project to the skin in the cervical, forelimb, and thoracic regions. Therefore, all patients had ECG Lead I recorded with 1 electrode in the right subclavian area and the other electrode in the left subclavian area. A second channel was used to record SKNA from the left arm in patients with AF (9). In patients with VT/VF, the second channel was the ECG Lead II, with 1 electrode located at right subclavian area and the other in the left lower abdomen (8). We analyzed recordings from all channels using custom-written software. The neuECG signals were amplified and bandpass filtered between 0.5 Hz and 150 Hz to display ECG and between 500 Hz and 1000 Hz to show the SKNA. We full-wave rectified and integrated all digitized SKNA signals every 100 ms and displayed the results over time to simulate the display methods of microneurography (41). Furthermore, we divided the total voltage by the number of digitized samples in the same window to obtain the aSKNA (8). The aSKNA was plotted over time to identify the peak of aSKNA, defined by the time point bracketed by >10-second crescendo and >10-second decrescendo of aSKNA values (10).
Burst analyses.
A prominent characteristic of the electrical activity in the nervous system is the prevalence of spontaneous activities that include both single-spike activity and the burst-firing mode (31). The single-spike mode of baseline nerve activity demonstrate variations of activation frequencies and amplitude with Gaussian distribution (30, 31). The burst activity can be distinguished from the single-spike mode by its large amplitudes and durations. Burst detection is an important technique that forms the basis of analyzing SNA recorded with microneurography techniques (34). However, because microneurography recordings are usually of short duration, it is possible to perform manual analyses of the burst activity. The neuECG recordings are much longer; thus, automated methods are needed for burst detection. A primary difference between baseline and burst activities is the amplitude. We plotted the proportion of amplitude distribution of all SKNA recorded from each patient to visualize 2 groups of nerve activities: the baseline (nonbursting) nerve activity and the high-amplitude bursting activity. These 2 groups of nerve activity are then fitted with an expectation-maximization method to identify 2 Gaussian distributions. From the Gaussian representing the lower amplitude activity, the mean plus 3 times SD was used as the threshold amplitude for burst determination in each patient with AF. These bursts were then plotted in a binary series graph to determine whether there is an association between burst discharges and the onset of AF.
Arrhythmia clusters.
Clustering was defined by an arrhythmic episode followed within 1 minute by the spontaneous recurrences of the same arrhythmia. We defined AF as a sudden onset of rapid irregular atrial activations with irregular ventricular responses. All onset and termination of the arrhythmia episodes were spontaneous. IRAF was defined as a reinitiation (recurrence) of AF within 1 minute after the termination of a prior AF episode (42). Bradycardia was defined as a HR less than 60 bpm. To determine the aSKNA and HR before and after termination of AF, all AF episodes lasting at least 10 seconds and separated by ≥10 seconds were identified. Shorter episodes were excluded from the analyses. VT/VF was defined as 3 or more consecutive ventricular beats with rates faster than 100 bpm. Similar to IRAF, we defined IRVT as a reinitiation of VT/VF within 1 minute after the termination of a prior episode. Episodes of arrhythmia were considered separate if there was at least 1 sinus or paced beat in between. We defined polymorphic ventricular arrhythmia as a VT/VF episodes with QRS waves varying in amplitude, axis, and duration. The monomorphic VT was defined by VT with identical QRS complexes.
HRV analyses.
HRV was performed using LabChart-Pro (ADInstruments) 3 minutes before and after the onset of SKNA bursts that preceded arrhythmic episodes. All ectopic beats were excluded from the analyses. For time domain analysis, the SD of NN intervals (SDNN) and the square root of the mean of the squares of the successive differences between adjacent NNs (RMSSD) were included. For the frequency domain analysis, the total power (TP), very low frequency (VLF) (0–0.04 Hz), low frequency (LF) (0.04–0.15 Hz), and high frequency (HF) (0.15–0.45 Hz) components; LF normalized unit (LF nu); HF normalized unit (HF nu); and LF-HF ratio were included. LF nu was calculated as LF/ (TP-VLF) × 100. HF nu was calculated as HF/(TP-VLF) × 100 (40).
Statistics
Continuous variables were summarized by mean and SDs for the normally distributed data or median (IQR) for the nonnormally distributed data. Categorical variables were summarized by frequency and percentage. The unpaired, 2-tailed Student’s t test or the Mann-Whitney U test was used to compare continuous measures and the χ2 test was used for dichotomous variables. The paired, 2-tailed t test or the Wilcoxon signed rank test was used within group comparisons. Kolmogorov-Smirnov test was used to check normality of continuous variables. The distribution of the number of AF onset by 3-hour intervals (0:00 to 2:59, 3:00 to 5:59, 6:00 to 8:59, 9:00 to 11:59, 12:00 to 14:59, 15:00 to 17:59, 18:00 to 20:59, and 21:00 to 23:59) was tested for uniformity by the χ2 goodness-of-fit test. Pair-wise comparison of the number of AF onset was performed by the exact binomial test with Bonferroni correction. Pearson’s or Spearman’s correlation coefficient was used to measure linear correlation between the burst amplitude and the duration of burst. Two-sided P ≤ 0.05 was considered statistically significant.
Study approval
This research protocol was approved by the IRB of the Indiana University School of Medicine. Written and informed consent was obtained from each patient.
Author contributions
TK designed the study, obtained data, conducted statistical analyses, and edited and reviewed the manuscript. JW, AD, and RAK obtained data, and they edited and reviewed the manuscript. GM and SS obtained clinical patient data, and they edited and reviewed the manuscript. JW obtained data, conducted statistical analyses, and edited and reviewed the manuscript. CS provided statistical guidance, conducted statistical analyses, and edited and reviewed the manuscript. PSC designed the study, handled the funding, and edited the manuscript. All authors contributed to the discussion of the study and reviewed and approved the manuscript.
Acknowledgments
We thank Susan Straka, David Adams, and David Wagner for helping with the data collection.
Version 1. 02/21/2019
Electronic publication
Funding Statement
This study was supported in part by NIH Grants R42DA043391 (Dr. Everett), R56 HL71140, TR002208-01, R01 HL139829 (Dr. Chen).
This study was supported in part by a Charles Fisch Cardiovascular Research Award endowed by Dr Suzanne B. Knoebel of the Krannert Institute of Cardiology (Drs Kusayama and Everett).
Footnotes
Conflict of interest: JW and THE had equity interest in Arrhythmotech LLC.
License: Copyright 2019, American Society for Clinical Investigation.
Reference information: JCI Insight. 2019;4(4):e125853. https://doi.org/10.1172/jci.insight.125853.
Contributor Information
Takashi Kusayama, Email: tkusaya@iu.edu.
Juyi Wan, Email: wanjuyi@yeah.net.
Anisiia Doytchinova, Email: doytchat@ucmail.uc.edu.
Johnson Wong, Email: johnwong@iu.edu.
Ryan A. Kabir, Email: ryan.kabir21@gmail.com.
Gloria Mitscher, Email: gmitsche@iu.edu.
Susan Straka, Email: sstraka@iu.edu.
Changyu Shen, Email: cshen1@bidmc.harvard.edu.
Peng-Sheng Chen, Email: chenpp@iu.edu.
References
- 1.Wood MA, Simpson PM, Stambler BS, Herre JM, Bernstein RC, Ellenbogen KA. Long-term temporal patterns of ventricular tachyarrhythmias. Circulation. 1995;91(9):2371–2377. doi: 10.1161/01.CIR.91.9.2371. [DOI] [PubMed] [Google Scholar]
- 2.Gillis AM, Rose MS. Temporal patterns of paroxysmal atrial fibrillation following DDDR pacemaker implantation. Am J Cardiol. 2000;85(12):1445–1450. doi: 10.1016/S0002-9149(00)00792-X. [DOI] [PubMed] [Google Scholar]
- 3.Lunati M, et al. Clustering of ventricular tachyarrhythmias in heart failure patients implanted with a biventricular cardioverter defibrillator. J Cardiovasc Electrophysiol. 2006;17(12):1299–1306. doi: 10.1111/j.1540-8167.2006.00618.x. [DOI] [PubMed] [Google Scholar]
- 4.Wineinger NE, et al. Identification of paroxysmal atrial fibrillation subtypes in over 13,000 individuals. Heart Rhythm. 2019;16(1):26–30. doi: 10.1016/j.hrthm.2018.08.012. [DOI] [PMC free article] [PubMed] [Google Scholar]
- 5.Hohnloser SH, et al. Electrical storm in patients with an implantable defibrillator: incidence, features, and preventive therapy: insights from a randomized trial. Eur Heart J. 2006;27(24):3027–3032. doi: 10.1093/eurheartj/ehl276. [DOI] [PubMed] [Google Scholar]
- 6.Shen MJ, Zipes DP. Role of the autonomic nervous system in modulating cardiac arrhythmias. Circ Res. 2014;114(6):1004–1021. doi: 10.1161/CIRCRESAHA.113.302549. [DOI] [PubMed] [Google Scholar]
- 7.Chen PS, Chen LS, Fishbein MC, Lin SF, Nattel S. Role of the autonomic nervous system in atrial fibrillation: pathophysiology and therapy. Circ Res. 2014;114(9):1500–1515. doi: 10.1161/CIRCRESAHA.114.303772. [DOI] [PMC free article] [PubMed] [Google Scholar]
- 8.Doytchinova A, et al. Simultaneous noninvasive recording of skin sympathetic nerve activity and electrocardiogram. Heart Rhythm. 2017;14(1):25–33. doi: 10.1016/j.hrthm.2016.09.019. [DOI] [PMC free article] [PubMed] [Google Scholar]
- 9.Uradu A, et al. Skin sympathetic nerve activity precedes the onset and termination of paroxysmal atrial tachycardia and fibrillation. Heart Rhythm. 2017;14(7):964–971. doi: 10.1016/j.hrthm.2017.03.030. [DOI] [PMC free article] [PubMed] [Google Scholar]
- 10.Kabir RA, et al. Crescendo Skin Sympathetic Nerve Activity and Ventricular Arrhythmia. J Am Coll Cardiol. 2017;70(25):3201–3202. doi: 10.1016/j.jacc.2017.10.065. [DOI] [PubMed] [Google Scholar]
- 11.Carbucicchio C, et al. Catheter ablation for the treatment of electrical storm in patients with implantable cardioverter-defibrillators: short- and long-term outcomes in a prospective single-center study. Circulation. 2008;117(4):462–469. doi: 10.1161/CIRCULATIONAHA.106.686534. [DOI] [PubMed] [Google Scholar]
- 12.Tan AY, et al. Neural mechanisms of paroxysmal atrial fibrillation and paroxysmal atrial tachycardia in ambulatory canines. Circulation. 2008;118(9):916–925. doi: 10.1161/CIRCULATIONAHA.108.776203. [DOI] [PMC free article] [PubMed] [Google Scholar]
- 13.Viskin S, et al. Circadian variation of symptomatic paroxysmal atrial fibrillation. Data from almost 10 000 episodes. Eur Heart J. 1999;20(19):1429–1434. doi: 10.1053/euhj.1999.1632. [DOI] [PubMed] [Google Scholar]
- 14.Uradu A, et al. Skin sympathetic nerve activity precedes the onset and termination of paroxysmal atrial tachycardia and fibrillation. Heart Rhythm. 2017;14(7):964–971. doi: 10.1016/j.hrthm.2017.03.030. [DOI] [PMC free article] [PubMed] [Google Scholar]
- 15.Choi EK, et al. Intrinsic cardiac nerve activity and paroxysmal atrial tachyarrhythmia in ambulatory dogs. Circulation. 2010;121(24):2615–2623. doi: 10.1161/CIRCULATIONAHA.109.919829. [DOI] [PMC free article] [PubMed] [Google Scholar]
- 16.Ogawa M, et al. Left stellate ganglion and vagal nerve activity and cardiac arrhythmias in ambulatory dogs with pacing-induced congestive heart failure. J Am Coll Cardiol. 2007;50(4):335–343. doi: 10.1016/j.jacc.2007.03.045. [DOI] [PubMed] [Google Scholar]
- 17.Tan AY, et al. Neural mechanisms of paroxysmal atrial fibrillation and paroxysmal atrial tachycardia in ambulatory canines. Circulation. 2008;118(9):916–925. doi: 10.1161/CIRCULATIONAHA.108.776203. [DOI] [PMC free article] [PubMed] [Google Scholar]
- 18.Ogawa M, et al. Cryoablation of stellate ganglia and atrial arrhythmia in ambulatory dogs with pacing-induced heart failure. Heart Rhythm. 2009;6(12):1772–1779. doi: 10.1016/j.hrthm.2009.08.011. [DOI] [PMC free article] [PubMed] [Google Scholar]
- 19.Zhao Y, et al. Ganglionated plexi and ligament of Marshall ablation reduces atrial vulnerability and causes stellate ganglion remodeling in ambulatory dogs. Heart Rhythm. 2016;13(10):2083–2090. doi: 10.1016/j.hrthm.2016.07.014. [DOI] [PMC free article] [PubMed] [Google Scholar]
- 20.Daubert JP, et al. Inappropriate implantable cardioverter-defibrillator shocks in MADIT II: frequency, mechanisms, predictors, and survival impact. J Am Coll Cardiol. 2008;51(14):1357–1365. doi: 10.1016/j.jacc.2007.09.073. [DOI] [PubMed] [Google Scholar]
- 21.Levine JH, et al. Intravenous amiodarone for recurrent sustained hypotensive ventricular tachyarrhythmias. Intravenous Amiodarone Multicenter Trial Group. J Am Coll Cardiol. 1996;27(1):67–75. doi: 10.1016/0735-1097(95)00427-0. [DOI] [PubMed] [Google Scholar]
- 22.Chatzidou S, et al. Propranolol Versus Metoprolol for Treatment of Electrical Storm in Patients With Implantable Cardioverter-Defibrillator. J Am Coll Cardiol. 2018;71(17):1897–1906. doi: 10.1016/j.jacc.2018.02.056. [DOI] [PubMed] [Google Scholar]
- 23.Meng L, Tseng CH, Shivkumar K, Ajijola O. Efficacy of Stellate Ganglion Blockade in Managing Electrical Storm: A Systematic Review. JACC Clin Electrophysiol. 2017;3(9):942–949. doi: 10.1016/j.jacep.2017.06.006. [DOI] [PMC free article] [PubMed] [Google Scholar]
- 24.Vaseghi M, et al. Cardiac Sympathetic Denervation for Refractory Ventricular Arrhythmias. J Am Coll Cardiol. 2017;69(25):3070–3080. doi: 10.1016/j.jacc.2017.04.035. [DOI] [PMC free article] [PubMed] [Google Scholar]
- 25.Bradfield JS, Ajijola OA, Vaseghi M, Shivkumar K. Mechanisms and management of refractory ventricular arrhythmias in the age of autonomic modulation. Heart Rhythm. 2018;15(8):1252–1260. doi: 10.1016/j.hrthm.2018.02.015. [DOI] [PubMed] [Google Scholar]
- 26.Yuan Y, et al. Left cervical vagal nerve stimulation reduces skin sympathetic nerve activity in patients with drug resistant epilepsy. Heart Rhythm. 2017;14(12):1771–1778. doi: 10.1016/j.hrthm.2017.07.035. [DOI] [PMC free article] [PubMed] [Google Scholar]
- 27.Taniguchi T, Morimoto M, Taniguchi Y, Takasaka M, Totoki T. Cutaneous distribution of sympathetic postganglionic fibers from stellate ganglion: A retrograde axonal tracing study using wheat germ agglutinin conjugated with horseradish peroxidase. J Anesth. 1994;8(4):441–449. doi: 10.1007/BF02514624. [DOI] [PubMed] [Google Scholar]
- 28.Jiang Z, et al. Using skin sympathetic nerve activity to estimate stellate ganglion nerve activity in dogs. Heart Rhythm. 2015;12(6):1324–1332. doi: 10.1016/j.hrthm.2015.02.012. [DOI] [PMC free article] [PubMed] [Google Scholar]
- 29.Robinson EA, et al. Estimating sympathetic tone by recording subcutaneous nerve activity in ambulatory dogs. J Cardiovasc Electrophysiol. 2015;26(1):70–78. doi: 10.1111/jce.12508. [DOI] [PMC free article] [PubMed] [Google Scholar]
- 30.Gerstein GL, Mandelbrot B. RANDOM WALK MODELS FOR THE SPIKE ACTIVITY OF A SINGLE NEURON. Biophys J. 1964;4:41–68. doi: 10.1016/S0006-3495(64)86768-0. [DOI] [PMC free article] [PubMed] [Google Scholar]
- 31.Beurrier C, Congar P, Bioulac B, Hammond C. Subthalamic nucleus neurons switch from single-spike activity to burst-firing mode. J Neurosci. 1999;19(2):599–609. doi: 10.1523/JNEUROSCI.19-02-00599.1999. [DOI] [PMC free article] [PubMed] [Google Scholar]
- 32.Kapucu FE, Tanskanen JM, Mikkonen JE, Ylä-Outinen L, Narkilahti S, Hyttinen JA. Burst analysis tool for developing neuronal networks exhibiting highly varying action potential dynamics. Front Comput Neurosci. 2012;6:38. doi: 10.3389/fncom.2012.00038. [DOI] [PMC free article] [PubMed] [Google Scholar]
- 33.Välkki IA, Lenk K, Mikkonen JE, Kapucu FE, Hyttinen JAK. Network-Wide Adaptive Burst Detection Depicts Neuronal Activity with Improved Accuracy. Front Comput Neurosci. 2017;11:40. doi: 10.3389/fncom.2017.00040. [DOI] [PMC free article] [PubMed] [Google Scholar]
- 34.Hart EC, et al. Recording sympathetic nerve activity in conscious humans and other mammals: guidelines and the road to standardization. Am J Physiol Heart Circ Physiol. 2017;312(5):H1031–H1051. doi: 10.1152/ajpheart.00703.2016. [DOI] [PMC free article] [PubMed] [Google Scholar]
- 35.Himura Y, Felten SY, Kashiki M, Lewandowski TJ, Delehanty JM, Liang CS. Cardiac noradrenergic nerve terminal abnormalities in dogs with experimental congestive heart failure. Circulation. 1993;88(3):1299–1309. doi: 10.1161/01.CIR.88.3.1299. [DOI] [PubMed] [Google Scholar]
- 36.Backs J, et al. The neuronal norepinephrine transporter in experimental heart failure: evidence for a posttranscriptional downregulation. J Mol Cell Cardiol. 2001;33(3):461–472. doi: 10.1006/jmcc.2000.1319. [DOI] [PubMed] [Google Scholar]
- 37.Nattel S, Maguy A, Le Bouter S, Yeh YH. Arrhythmogenic ion-channel remodeling in the heart: heart failure, myocardial infarction, and atrial fibrillation. Physiol Rev. 2007;87(2):425–456. doi: 10.1152/physrev.00014.2006. [DOI] [PubMed] [Google Scholar]
- 38.Hocini M, et al. Reverse remodeling of sinus node function after catheter ablation of atrial fibrillation in patients with prolonged sinus pauses. Circulation. 2003;108(10):1172–1175. doi: 10.1161/01.CIR.0000090685.13169.07. [DOI] [PubMed] [Google Scholar]
- 39.Sanders P, Kistler PM, Morton JB, Spence SJ, Kalman JM. Remodeling of sinus node function in patients with congestive heart failure: reduction in sinus node reserve. Circulation. 2004;110(8):897–903. doi: 10.1161/01.CIR.0000139336.69955.AB. [DOI] [PubMed] [Google Scholar]
- 40.Chan YH, et al. Subcutaneous nerve activity is more accurate than heart rate variability in estimating cardiac sympathetic tone in ambulatory dogs with myocardial infarction. Heart Rhythm. 2015;12(7):1619–1627. doi: 10.1016/j.hrthm.2015.03.025. [DOI] [PMC free article] [PubMed] [Google Scholar]
- 41.White DW, Shoemaker JK, Raven PB. Methods and considerations for the analysis and standardization of assessing muscle sympathetic nerve activity in humans. Auton Neurosci. 2015;193:12–21. doi: 10.1016/j.autneu.2015.08.004. [DOI] [PMC free article] [PubMed] [Google Scholar]
- 42.Oral H, et al. Segmental ostial ablation to isolate the pulmonary veins during atrial fibrillation: feasibility and mechanistic insights. Circulation. 2002;106(10):1256–1262. doi: 10.1161/01.CIR.0000027821.55835.00. [DOI] [PubMed] [Google Scholar]


