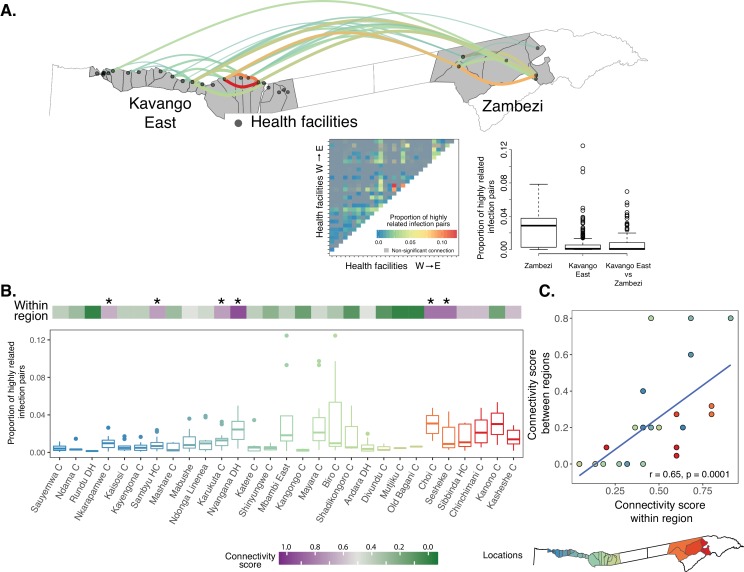
Figure 3. Local genetic connectivity in northeastern Namibia.
(A) Proportion of highly related infections between 29 health facilities in Kavango East and Zambezi regions is shown. The heat map shows 406 pairwise proportions of highly related infections between health facilities. Highly related values are shown in color, all other values are shown in gray. Top 10% of the pairwise connections are shown on the map of the study area. Highly related connections were determined after correcting for multiple comparisons using a Bonferroni correction. The boxplot illustrates that infections within Zambezi were more related to each other than to Kavango East. (B) Health facilities in Kavango East and Zambezi are shown from west to east. The connectivity score (top heatmap) ranges from 0 to 1, where a score of 1 indicates a health facility is highly connected to all other health facilities in the region. The proportions of highly related infections among the health facilities is shown to illustrate the strength of these connections (boxplot). Health facilities with the highest connectivity are indicated by a star (Nkarapamwe, Sambyu, Nyangana, and Karukuta health facilities in Kavango East and Choi and Sesheke health facilities in Zambezi). Scatterplot shows comparison of within region and between region connectivity. Boxplots and points are colored to indicate the geographic location of the health facility catchment on the inset map.

