
Figure 4. PIP2 binding in TRPM8.
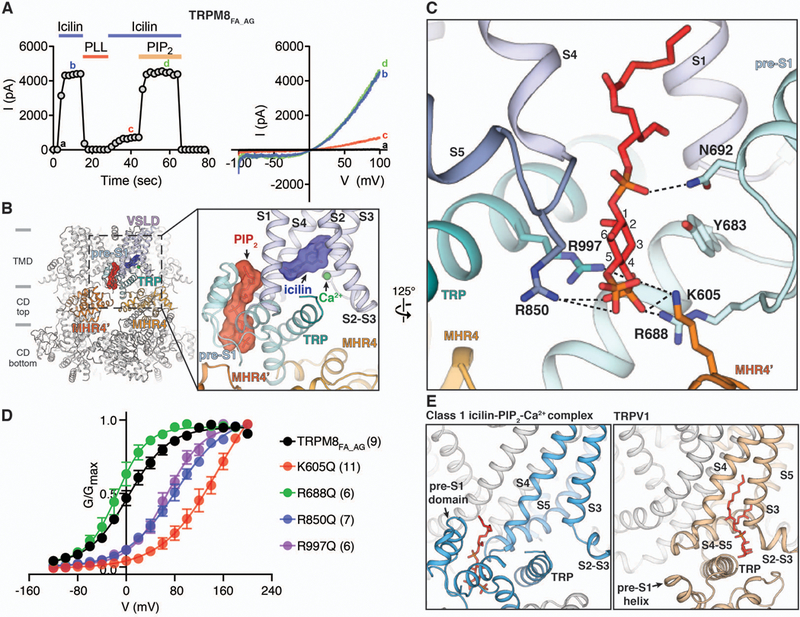
A) Functional characterization of TRPM8FA_AG by icilin and PIP2. 20 µM icilin in the presence of 12.5 µM Ca2+ was used to activate TRPM8FA_AG channels using inside-out patches. Membrane PIP2 was depleted by poly-L-lysine (PLL, 50 µg/ml) in the absence of icilin and Ca2+. 40 µM diC8-PIP2 was applied together with icilin and Ca2+ to recover channel activity. Time course of the peak current amplitudes at +100 mV from the voltage ramp (−100 mV to +100 mV) is shown on the left, and representative current traces are shown on the right. Quantifications of current amplitudes are in fig. S2D. (B) Global and close-up views (inset) of the PIP2 binding site in the class 1 icilin-PIP2-Ca2+ complex structure. PIP2 and icilin molecules are shown as sticks and surfaces. Gray bars indicate division of channel layers. (C) Key residues in the interfacial cavity that interact with PIP2. PIP2 and amino acid side chains are shown as sticks. (D) Conductance-voltage (G-V) relationship of K605Q, R688Q, R850Q, and R997Q mutant TRPM8FA_AG channels in response to 20 µM icilin and 12.5 µM Ca2+, as measured by their normalized peak tail currents (see Methods and fig. S11A for details). Numbers of individual recordings are noted in parentheses. Error bars indicate SEM. (E) Comparison of the PIP2 binding site in TRPM8 (left) and the phosphatidylinositol binding site in TRPV1 (right, PDB 5IRZ). Lipid molecules are shown as red sticks.