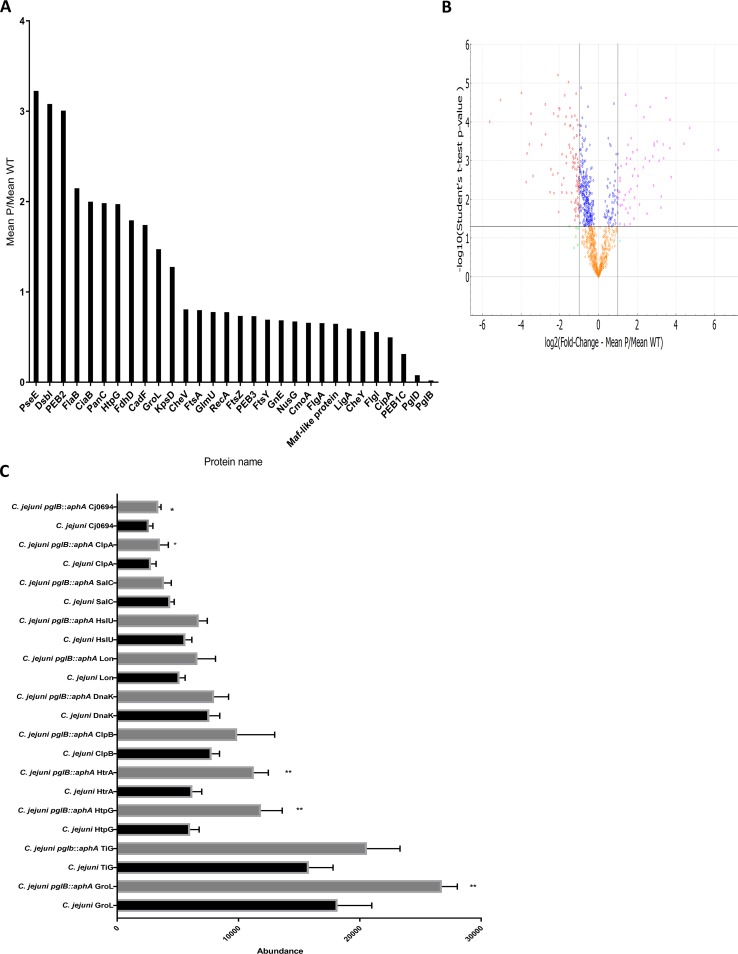
FIG 1.
Quantitative comparison of wild-type C. jejuni and C. jejuni pglB::aphA proteomes. (A) Selected proteins that are statistically differentially expressed in wild-type C. jejuni and C. jejuni pglB::aphA proteomes. Proteins were analyzed by Perseus and presented according to their fold change with 95% CI. (B) Volcano plot analysis of significantly abundant proteins. The −log10 (Student’s t test) is plotted against log2 mean fold change of C. jejuni pglB::aphA,P C. jejuni, WT. The nonaxial horizontal line denotes P = 0.05, while the nonaxial vertical lines denote 0.5- and 2-fold changes, respectively. The volcano plot was generated using PANDA-view (12). (C) Differential expression of chaperones and proteases in wild-type C. jejuni and C. jejuni pglB::aphA. Data are from three biological replicates. The error bars represent standard deviations. Values that are significantly different by Student’s t test are indicated by asterisks as follows: *, P < 0.05; **, P < 0.01.

