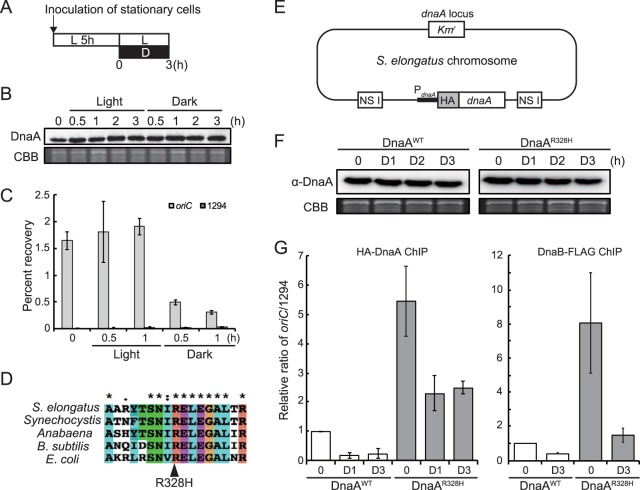
FIG 2.
Effects of light and inhibition of DnaA intrinsic ATPase activity on affinity for the genomic oriC region. (A) Schematic diagram of the culture conditions for panels B, C, F, and G. Mid-log-phase cultures of the S. elongatus wild-type, DnaAWT, or DnaAR328H strains were inoculated into fresh inorganic medium and cultured for 5 h under 70-µE m−2 s−1 illumination. At hour 0, one culture was kept under illumination and another culture was transferred to darkness. Both were cultivated for a further 3 h. (B) Immunoblot analysis showing the DnaA protein level under the light or dark condition. Proteins extracted from wild-type cells at the indicated time points were reacted with the anti-DnaA antibody (upper panel). Coomassie brilliant blue (CBB) staining of protein samples resolved by SDS-PAGE is shown in the lower panel as a gel loading control. (C) ChIP-qPCR analysis showing the affinity of DnaA for the oriC region under light and dark conditions. The DnaA-chromatin complex was immunoprecipitated with the anti-DnaA antibody. The samples were quantified by qPCR using primers specific to the oriC region (oriC, gray bar) and Syf1294 gene (1294, dark gray bar). The percent recovery against the total amount of input DNA is indicated. (D) A partial amino acid sequence alignment of the DnaA proteins from S. elongatus, Synechocystis, Anabaena sp. strain PCC 7120 (Anabaena), Bacillus subtilis 168, and Escherichia col. The conserved arginine residue is indicated by the arrowhead. (E) Schematic diagram of the S. elongatus chromosome expressing HA-DnaAWT (DnaAWT) or HA-DnaAR328H (DnaAR328H). DNA encoding HA-DnaAWT or HA-DnaAR328H under the control of the dnaA promoter was introduced into the chromosomal neutral site I (NS I). The native dnaA gene was then deleted by insertion of the kanamycin resistance gene (Kmr). (F) Immunoblot analysis showing DnaAWT and DnaAR328H protein levels in culture under light and dark conditions. Proteins extracted from respective cells at the indicated time points were reacted with the anti-HA antibody (upper panel). CBB staining of the protein samples resolved by SDS-PAGE is shown in the lower panel as a gel loading control. (G) ChIP-qPCR analysis showing the affinity of DnaA (left) and DnaB (right) protein for the oriC region in DnaAWT and DnaAR328H cells under light and dark conditions. The DnaA (or DnaB)-chromatin complex was immunoprecipitated with anti-HA (or FLAG) antibody. For the DnaB assay, DnaB-FLAG was expressed under the control of the dnaB promoter (44). The samples were quantified by qPCR using primers specific to the oriC region and the Syf1294 gene (1294), which is farthest from oriC in the circular chromosome. The value indicated is the ratio of percent recovery (oriC/1294) normalized to the value of DnaAWT at hour 0 (defined as 1.0).

