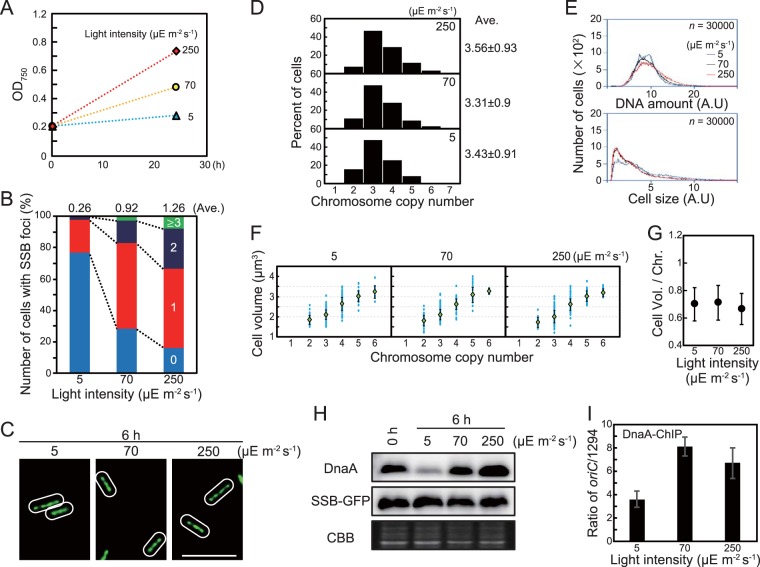
FIG 4.
Effect of growth rate on number of replicating chromosomes, chromosome copy number, and cell size. To prepare cultures with different growth rates, S. elongatus was cultured under different intensities of illumination at 30°C. (A) Growth rate at 5, 70, and 250 µE m−2 s−1. A mid-log-phase SSB-GFP culture was inoculated into fresh inorganic medium (hour 0) and then cultured under the indicated illumination intensity. (B) Frequency of cells exhibiting zero (blue), one (red), two (deep blue), or three or more (green) SSB-GFP foci at hour 6 (n ≥ 300 cells per condition). The average number of SSB foci is indicated above the bars. (C) Fluorescence microscopic images showing SYBR Green staining of nucleoids at hour 6. Phase-contrast and SYBR Green images are shown. Bar, 5 µm. (D) Histograms showing number of chromosomes per cell at hour 6. Number of chromosomes was determined based on micrographs of SYBR Green-stained cells (n ≥ 300 cells per condition). (E) Flow cytometry analysis showing the DNA level (upper panel) and relative cell volume (lower panel) at hour 6. DNA level was calculated by intensity of SYTOX Green fluorescence. Blue line, 5 µE m−2 s−1; black line, 70 µE m−2 s−1; red line, 250 µE m−2 s−1; A.U., arbitrary unit. (F) Distribution of cell volume and chromosomal copy number. The blue points represent single cells. The green diamond represents the mean, and the error bar represents the standard deviation (n ≥ 300 cells per condition). (G) Mean cell volume occupied by one chromosome at hour 6. Error bar represents the standard deviation (n ≥ 300 cells per condition). (H) Immunoblot analysis showing DnaA and SSB-GFP protein levels. Proteins extracted from cells at hours 0 and 6 were reacted with anti-HA antibody (top) and anti-GFP antibody (middle). Coomassie brilliant blue (CBB) staining of the protein samples resolved by SDS-PAGE is shown in the bottom panel as a gel loading control. (I) ChIP-qPCR analysis showing the affinity of DnaA for the oriC region at hour 6. The value indicated is the ratio of percent recovery (oriC/1294). Error bars represent the standard deviation (n = 3). Three independent experiments yielded similar results, and results from one experiment are shown (for panels A to H).

