

Abstract
Objective
The processes underlying sudden unexpected death in epilepsy (SUDEP) remain elusive, but centrally-mediated cardiovascular or respiratory collapse is suspected. Volume changes in brain areas mediating recovery from extreme cardiorespiratory challenges may indicate failure mechanisms and allow prospective identification of SUDEP risk.
Methods
We retrospectively imaged SUDEP cases (n=25), age-, sex-, epilepsy syndrome-, localisation-, and disease duration-comparable high- (n=25), and low-risk (n=23) patients, and age- and sex-matched healthy controls (n=25), with identical high-resolution T1-weighted scans. Regional gray matter volume, determined by voxel-based morphometry, and segmentation-derived structure sizes were compared across groups, controlling for total intracranial volume, age and sex.
Results
Substantial bilateral gray matter loss appeared in SUDEP cases in the medial and lateral cerebellum, less prominently in high-risk, and absent in low-risk subjects. The periaqueductal gray, left posterior and medial thalamus, left hippocampus, and bilateral posterior cingulate also showed volume loss in SUDEP. High-risk subjects showed left thalamic volume reductions to a lesser extent. Bilateral amygdala, entorhinal and parahippocampal volumes increased in SUDEP and high-risk patients, with the subcallosal cortex enlarged in SUDEP only. Disease duration correlated negatively with parahippocampal volume. Volumes of the bilateral anterior insula and midbrain in SUDEP cases were larger the closer to SUDEP from MRI.
Significance
SUDEP victims show significant tissue loss in areas essential for cardiorespiratory recovery, and enhanced volumes in areas which trigger hypotension or impede respiratory patterning. Those changes may shed light on SUDEP pathogenesis, and prospectively detect patterns identifying those at risk.
Keywords: SUDEP, MRI, cerebellum, limbic, midbrain
Introduction
The processes underlying sudden unexpected death in epilepsy (SUDEP) remain elusive. Circumstances surrounding the fatal event suggest a centrally-mediated cardiovascular or respiratory collapse following a generalised tonic-clonic seizure (GTCS).1 Since SUDEP is the leading cause of premature death among people with epilepsy,2 efforts to non-invasively characterise potential underlying neural mechanisms mediating SUDEP and highlight imaging biomarkers are essential.
Brain structural imaging studies of SUDEP have revealed volume changes among key structures involved in autonomic and respiratory regulation in people who succumbed to SUDEP and those at high-risk.3 Individuals with frequent GTCS, who are at highest risk of SUDEP,4 exhibit cortical thickness changes in key areas which are autonomic, somatosensory, and breathing coordination sites.5 Less attention has been directed to structures essential for recovery from compromised breathing or cardiovascular circumstances.
Regional brain volume assessment in patients who succumb may allow determination of processes which contribute to the fatal event, or fail to provide adequate compensatory recovery. Those assessments may prospectively and non-invasively identify biomarkers for individuals at risk, and were the objectives of this study.
Methods
Subjects
Twenty-five individuals who suffered definite (n=12) or probable (n=13) SUDEP6 were retrospectively identified after updating an earlier initial search.3 Living high-(n=25) and low-risk (n=23) patients, and healthy controls (n=25), were identified similarly (see Table 1 for group characteristics). Patients at high-risk of SUDEP were those experiencing more than three GTCS per year, the most significant factor associated with SUDEP,4 and distinguished over 80% of SUDEP cases (21/25) in our data. Low-risk patients were those who did not experience GTCS. All clinical information used for risk stratification was obtained from multi-disciplinary team meeting reports and clinic letters closest to data collection, and confirmed with the most-recent follow-up. Survival of all non-SUDEP subjects was confirmed through examination of clinical records. All scans were obtained within a defined period, ensuring identical imaging protocols: 1) All subjects underwent the same high-resolution 3D-T1-weighted scan; and 2) Individuals with insufficient clinical data, large brain lesions, and/or previous neurosurgery were excluded. High- and low-risk patients, comparable for age, sex, epilepsy syndrome, seizure focus localisation, and duration were identified to account for potential volume changes accompanying these factors. Each SUDEP case was also matched with a comparable healthy control for age and sex. Table 1 shows group characteristics. Supplementary Table S1 outlines individual clinical characteristics of SUDEP, high- and low-risk patients. The study was approved by the UK National Research Ethics Committee under an ongoing database research project into autonomic and imaging biomarkers of SUDEP (04/Q0512/77 and 14/SW/0021), and a local audit into mortality in epilepsy.
Table 1.
Group characteristics of SUDEP cases, high-risk, low-risk and healthy controls. SD=standard deviation, M=male, F=female, /=per, HS = hippocampal sclerosis, AED=anti-epileptic drug, ATOS = at time of scan, HC=healthy control, N.A.=not applicable.
| Characteristics | SUDEP (n=25) |
High-risk (n=25) |
Low-risk (n=23) |
HC (n=25) |
|---|---|---|---|---|
| Age, years (mean±SD) | 34.4±13.5 | 32±7.5 | 30±8.1 | 38±12.1 |
| Gender (M:F) | 18:07 | 18:07 | 16:07 | 18:07 |
| Disease duration, years (mean±SD) | 22.8±14.2 | 21.4±8.6 | 16.6±9.9 | N.A. |
| GTCS/month, last 12 months (mean±SD) | 2.7±2.5 | 2.5±1.5 | N.A. | N.A. |
| Focal: generalised epilepsy | 22:03 | 22:03 | 19:14 | N.A. |
| No. AEDs ATOS (mean±SD) | 2.2±0.8 | 2.7±1.1 | 2.1±0.9 | N.A. |
| No. AEDs historic (mean±SD) | 4.8±3.2 | 8.4±3.2 | 3.4±2.8 | N.A. |
| Number exposed to Phenytoin | 5 | 8 | 3 | N.A. |
| Long term Phenytoin users (>10 yrs) | 2 | 3 | 0 | N.A. |
| Polytherapy (count) | 10 | 15 | 8 | N.A. |
| Duotherapy (count) | 10 | 6 | 9 | N.A. |
| Monotherapy (count) | 5 | 4 | 6 | N.A. |
| Seizure onset zone | ||||
| L temporal (HS) | 1 | 2 | 1 | N.A. |
| L temporal (no HS) | 1 | 1 | 1 | N.A. |
| R temporal (HS) | 0 | 1 | 0 | N.A. |
| R temporal (no HS) | 2 | 1 | 2 | N.A. |
| Frontal | 6 | 5 | 6 | N.A. |
| Temporal+ | 7 | 6 | 2 | N.A. |
| Generalised | 3 | 3 | 4 | N.A. |
| Posterior head regions | 2 | 1 | 2 | N.A. |
| Focal, unknown | 3 | 3 | 5 | N.A. |
Magnetic resonance imaging (MRI) acquisition
Scanning was performed at the Epilepsy Society (Chalfont St Peter, Buckinghamshire, UK) on a 3.0-Tesla Signa HDx, GE Medical Systems scanner, using standard imaging gradients (maximum strength of 40 mT/m, slew rate 150 T/m/s). All subjects underwent the same fast spoiled gradient-echo (FSPGR) 3D-T1 scan (repetition time = 8.3, echo time = 3.1, slices = 170, slice thickness = 1.1 mm, matrix size = 256 × 256, field-of-view = 240 × 240 mm).
Voxel-based morphometry
Voxel-based morphometry (VBM) was implemented using the computational anatomy toolbox (CAT12),7 using SPM12 (Statistical Parametric Mapping; http://www.fil.ion.ucl.ac.uk/spm) and Matlab 2017b (MathWorks, USA), to explore gray matter volume differences across the whole-brain between groups. Images were denoised using the spatial-adaptive non-local means filter and normalised to MNI152 template space, before being segmented into gray matter (GM), white matter (WM), and cerebrospinal fluid (CSF) classes. Modulated images were then smoothed with an 8mm full-width-at-half-maximum Gaussian kernel and entered into a full-factorial model, with group as factor, and age and sex as covariates. An absolute threshold mask of probability 0.2 was applied to account for edge effects between different tissue types. Total intracranial volume (TIV; the sum of WM, GM and CSF), was used to proportionally scale the data to account for differences in whole-brain size across subjects, and results were family-wise error rate (FWER) corrected at p<0.05, unless otherwise stated.
Regional structure parcellation using Geodesic Information Flows (GIF)
Parcellation method
For validation and determination of difference magnitudes, structures showing significantly increased or reduced volume using VBM were segmented in each subject using a whole-brain parcellation scheme based on geodesic information flows (GIF).8 Regional brain volumes were obtained by extracting areas of interest from the parcellation and multiplying the number of voxels in each area by the voxel volume.
Statistical analysis
Permutation t-tests were employed to assess structural differences between groups; for each contrast, members from each group were randomly permuted (10,000 times) to obtain an empirical null distribution. P-values were corrected for multiple comparisons using the false discovery rate (FDR). Data were initially scaled by total intracranial volume, and adjusted for age and sex using linear regression. All processes were carried out in Matlab2017b (Mathworks, USA).
Correlations: brain volume and clinical variables
Partial correlations (IBM SPSS25) examined whether structural sizes from whole-brain parcellation depended on disease duration or GTCS frequency, controlling for age, sex and TIV. Correlations with GTCS frequency were considered in two ways: we first examined correlations with SUDEP and high-risk subjects as one group. We then correlated volume with GTCS frequency in SUDEP and high-risk groups separately.
Further partial correlations assessed relationships between structural size and the time between MRI and SUDEP, controlling for disease duration, seizure frequency, age, sex and TIV. P-values were FDR-corrected.
Contributions to tissue loss from medications
Several anti-epileptic drugs (AEDs) induce structural changes via toxic processes. Medications in all patients were documented and summarized by group in Table S1. We compared the number of AEDs used at scan time, and the total number of AEDs tried across groups with non-parametric tests (IBM SPSS 25). Additionally, we repeated all volumetry analyses having removed individuals with known phenytoin exposure (n=5 SUDEP, n=8 high-risk, n=3 low-risk) due to known cerebellar atrophy related to its use.9
Results
Cerebellar volume loss
Compared with healthy controls (Figure 1A) and low-risk subjects (Supplementary Figure S1A), SUDEP showed major bilateral volume loss of the cerebellum, across medial, lateral and vermal portions (VBM). High-risk subjects also showed reduced gray matter volume compared with healthy controls, but in the vermis only (Supplementary Figure S2A). Sub-analyses, removing those with a history of phenytoin use, revealed similar, but less extensive patterns of cerebellar volume loss (particularly in lateral portions) in SUDEP and high-risk vs healthy controls (Supplementary Figure S3A-B); no other results changed significantly as a consequence of removing these subjects. Regional segmentation comparisons revealed reduced volumes of the bilateral exterior cerebellar gray matter in SUDEP vs healthy controls (Figure 1; Figure 2B–C). High- and low-risk groups did not show reduced volume of segmented cerebellar structures.
Figure 1.

Regional gray matter volume loss in SUDEP compared with healthy controls, found in the bilateral cerebellum and vermis (A, B), PAG (B, C), the left medial and posterior thalamus (C), and the bilateral posterior cingulate (B). VBM contrast maps are overlaid onto a standard (MNI152) brain. The masks of segmented regions exhibiting reduced size in SUDEP<HC (p<0.05, FDR) are overlaid in red.
Figure 2.

Bar graphs showing group volume differences in the thalamus (A, B), exterior cerebellar gray matter (C, D), amygdala (E, F), parahippocampal gyrus (G, H), entorhinal cortex (I, J) and subcallosal cortex (K, L). ** = significant at p<0.05 (FDR) compared with low-risk and healthy controls. * = significant at p<0.05 (FDR) compared with healthy controls only.
Thalamic and limbic alterations
The left posterior and medial thalamus and posterior hippocampus exhibited reduced gray matter volume in SUDEP (Figure 1B–C) and high-risk (Figure S2A) vs healthy controls (VBM). Additionally, SUDEP, but not high-risk, subjects showed volume loss in these areas when compared with low-risk subjects (Figure S1A). VBM also revealed PAG and bilateral posterior cingulate gray matter volume loss in SUDEP vs healthy controls (Figure 1B–C). Regional segmentation analysis showed the left thalamic parcel was smaller in SUDEP vs healthy controls (Figure 1C, 2A).
The bilateral amygdala, entorhinal cortex, parahippocampal gyrus and subcallosal cortex showed increased gray matter volume in SUDEP vs healthy controls (regional segmentation and VBM; Figure 2E–L and Figure 3, respectively). Regional segmentation analysis also revealed that all of these structures were larger in SUDEP vs low-risk patients (Figure 2E–L). High-risk patients showed increased right amygdala gray matter volume vs healthy controls, using VBM (Figure S2C), while regional segmentation analysis showed increased bilateral amygdala and parahippocampal gyrus volume (vs healthy controls and low-risk; Figure 2E–H), and the entorhinal cortex (vs healthy controls only; Figure 2I–J). Compared with low-risk patients, both high-risk and SUDEP groups manifested increased right amygdala gray matter using VBM (p<0.001 uncorrected; Figure S1B-C).
Figure 3.

Regional volume increases in SUDEP compared with healthy controls, in the bilateral amygdala,entorhinal cortex, subcallosal cortex and parahippocampal gyrus (B, D and F). SPM contrast is overlaid in warm colours (red-yellow). Parcellation analyses (A, C, and E) show masks of segmented regions exhibiting increased size in SUDEP>HC (p<0.05, FDR) overlaid in solid colours.
Correlational analyses
Significant partial correlations appeared between disease duration and left (r= −0.325, p= 0.008) and right (r= −0.318, p= 0.009) parahippocampal gyrus size. Significant partial correlations also appeared between time-to-SUDEP from MRI in the left (r= −0.4, p= 0.03) and right (r= −0.55, p= 0.006) anterior insula (Figure 4A–4B), and the left (r= −0.38, p= 0.04) and right (r= −0.47, p= 0.013) midbrain (Figure 4C–4D).
Figure 4.
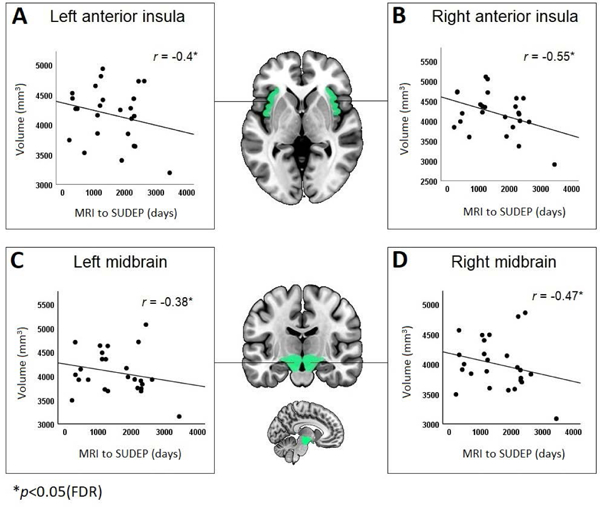
Correlations between brain volumes and disease duration across all epilepsy subjects (A, B) and time from MRI to SUDEP in SUDEP cases only (C, D, E, F). * = significant at p<0.05 (FDR corrected). Covariates were seizure frequency, age, sex and total intracranial volume (and disease duration for C-D).
GTCS frequency correlated positively with the right posterior cingulate (r= 0.37, p= 0.005) and bilateral anterior cingulate (left: r= 0.28, p= 0.029. right: r= 0.26, p= 0.039) volume, when SUDEP and high-risk were analysed in the same group (n=50). When considered separately, high-risk (n=25) showed positive correlations with the bilateral anterior cingulate (left: r= 0.40, p= 0.036. right: r= 0.55, p= 0.005), but insignificant correlations with the right posterior cingulate (r= 0.35, p= 0.057). When analysed alone, SUDEP cases (n=25) showed positive correlations with the right hippocampus (r= 0.54, p= 0.006), but right posterior cingulate correlations were not significant (r= 0.35, p= 0.063). Negative correlations emerged with the left mid cingulate (r= −0.39, p= 0.042) and left anterior insula (r= −0.45, p= 0.02).
Anti-epileptic medication
The number of AEDs used at scan time did not significantly differ across patient groups. High-risk patients had been tried on a significantly greater number of AEDs throughout epilepsy duration vs SUDEP (t=3.97, p<0.001) and low-risk (t=6.1, p<0.001).
Discussion
Summary
The most prominent outcome was a substantial loss of cerebellar volume in subjects who succumbed to SUDEP and, to a lesser extent, those at high-risk, a finding of consequence to the syndrome, since the cerebellum is essential to recover from compromised cardiovascular and breathing circumstances. Other sites which maintain blood pressure integrity and project to the cerebellum – the PAG and bilateral posterior cingulate – also showed tissue loss; critically, these findings were evident only in SUDEP. In addition, volume increases appeared in more-rostral sites which trigger apnea (amygdala) and hypotension (subcallosal cortex), most prominently in SUDEP. Many of the alterations appeared both in comparison to healthy controls, and to patients with epilepsy at low-risk for SUDEP.
Cerebellar volume loss
Extensive volume loss within the cerebellum was apparent in SUDEP, and to a lesser extent in high-risk, compared with healthy controls, but not in low-risk. The cerebellum plays a major role in dampening extreme blood pressure changes,10 chemosensing, recovery from hypercarbia,11 and timing of upper airway and diaphragm action in obstructive and central apnea,12 all relevant issues in the circumstances surrounding SUDEP.13 Cerebellar volume loss occurs commonly in epilepsy, and is associated with poor surgical outcome,14 chronicity,15 GTCS16 and AED use.9 These issues are of major concern, since all, particularly poor surgical outcome17 and GTCS,18 involve cohorts at greatest risk of SUDEP. The substantial cerebellar tissue loss may result from excitotoxic processes following excessive activation of pontine or long climbing fibers of olivary projections. The structural impingement of climbing fibers on Purkinje dendrites is such that excessive activation readily kills Purkinje neurons,19 a process well-known in the neurotoxicity field, but presumably operating similarly with hypoxia or ischemia from prolonged apnea or hypotension during ictal events. Successive ictal episodes accompanying chronic GTCS would lead to repetitive apneic periods or rapid declines in blood pressure, establishing a scenario for Purkinje cell death. The damaged Purkinje cells cannot effectively control the deep fastigial “autonomic” and “breathing” nuclei, reducing the potential for recovery from hypotension or apnea. Profound hypotension often accompanies ictal events in GTCS:20,21 an inability to recover from such blood pressure losses may lead to SUDEP.22
Cerebellar volume loss: breathing implications
The cerebellum is instrumental in recovery from compromised breathing circumstances.23 Cerebellar somatomotor coordination is essential for timely dilation of the upper airway ahead of descent of the diaphragm; such co-ordination prevents airway collapse in obstructive apnea. This coordination is sometimes lost in syndromes with cerebellar injury and compromised breathing such heart failure, as demonstrated by out-of-phase cerebellar fMRI signals to breathing challenges;24 cerebellar injury accompanies heart failure. Cerebellar participation is needed to restore breathing from sustained central apnea; the deep cerebellar nuclei contain chemosensitive neurons to assist recovery from increased hypercarbia.
Descending influences from damaged structures
Altered structures in anterior areas have the potential to exaggerate those descending influences to cardiorespiratory areas, or, in other areas with tissue loss, reduce influences. Volume loss appeared in the PAG and bilateral posterior cingulate in SUDEP, as well as the left posterior thalamus and hippocampus in both SUDEP and high-risk groups; the latter finding has been described earlier,3 with the posterior thalamic damage presumably contributing to failure to sense low oxygen and hypercapnia;25 dysfunctional responses to hypercapnia25 are pronounced in the left posterior thalamus in congenital central hypoventilation syndrome. The PAG receives direct projections from the amygdala central nucleus.26 Both the PAG and posterior cingulate assist respiratory and cardiovascular regulation, showing single neuron discharge related to both breathing and cardiac timing.27 PAG volume loss has been shown earlier in SUDEP.28
Hippocampal tissue loss is common in epilepsy, and, as with cerebellar Purkinje neurons, likely results from excitotoxic processes; in the hippocampal case, presumably from overexcitation of Schaffer collaterals (axonal collaterals from CA3 pyramidal cells which project to the CA1 of hippocampus). These projections are glutamatergic, i.e., excitatory, with the potential for cell destruction with exaggerated hypoxia-induced activation.
The ventrolateral PAG can elicit substantial increases in sustained (i.e. “freezing”) muscle tone via the lateral vermis of the cerebellum, a source of concern when attempting to initiate cyclic breathing during an ictal event.29 Deficient cardio-respiratory compensatory mechanisms mediate by the PAG have been shown to contribute to SUDEP in mice.30
Volume loss of PAG, posterior cingulate and left posterior thalamus and hippocampus raises the possibility that compromised excitatory or timing signals from descending influences on the cerebellum may further blunt central breathing control.
Anterior limbic volume increases
The increased amygdala volume is relevant because of its marked influences on breathing; stimulation elicits apnea in human epilepsy,31 and triggering of respiratory phase changes in animal models.32 Similar amygdala volume increases have been described in SUDEP3 and in the common epilepsies.33 Volume increases may result from multiple processes, including enhanced activation from experience,34 or inflammatory processes.35 Increased bilateral amygdala and hippocampus volume is observed in a sub-type of subjects with mesial temporal lobe epilepsy;36 these subjects also had the poorest surgical outcome, and are at greatest risk of SUDEP.17 Increased amygdala volume may reflect a heightened propensity for processes leading to apnea which, if not corrected by cerebellar recovery sites due to volume loss, could result in an increased potential for a fatal outcome.
A potential explanation, and notable limitation of this study, is that the elevated medial temporal volume may result from tissue sagging from brain atrophy, particularly in the posterior fossa, which can cause tissue accumulation in the medial fossa. Future studies evaluating epilepsy cohorts, particularly those involving subjects with chronic epilepsy, should take this possibility into account.
The subcallosal cortex was enlarged only in SUDEP, and represents a significant concern if enhanced volumes indicate increased influences; electrical stimulation of the structure results in profound hypotension.22 As with amygdala influences, the combination of ineffectual cerebellar dampening of hypotension with enhanced subcallosal-elicited blood pressure declines could be catastrophic.
Antiepileptic drugs
Cerebellar atrophy in patients with epilepsy following use of particular AEDs, such as phenytoin, is well-described.9 We documented medication history of all patients, including exposure to phenytoin. The number of patients with phenytoin exposure in SUDEP, high-risk and low-risk groups was 5, 8 and 3, respectively, with only 2 SUDEP and 3 high-risk having long-term use (>10 years). Sub-analyses of SUDEP and high-risk groups, with removal of those with phenytoin exposure (and controlling for phenytoin use as a binary covariate), showed similar patterns of cerebellar volume loss to those groups before removal, although reduced in extent (particularly in lateral cerebellar areas; Figure 4), suggesting that tissue loss here, specifically in the vermis, a region particularly important in blood pressure control, cannot solely be attributed to phenytoin use. Notably, removing these subjects did not significantly alter other findings of increased or decreased volume. Across groups, the number of AEDs in the treatment regimen of patients at scan time did not significantly differ. However, high-risk patients had, on average, tried a greater number of AEDs throughout their epilepsy duration, which was significantly greater than SUDEP cases and low-risk patients. No significant differences between SUDEP and low-risk appeared with total number of AEDs historically trialled. While high-risk subjects and SUDEP cases had historically tried a greater number of AEDs compared with low-risk subjects, there is currently little evidence to suggest that any individual, or combination of AED(s) is responsible for SUDEP or a significant elevation in risk. Specifically, lamotrigine is not associated with increased SUDEP risk, as was previously thought, and the number of AEDs used is not an independent SUDEP risk factor.37 Rather, additional AEDs reduce the risk of SUDEP in drug refractory patients.38 It should, however, be noted that the precise role of AEDs in SUDEP risk is not entirely clear, and studies exploring this aspect are needed. In summary, the role of seizures or AED use in cerebellar atrophy in epilepsy remains unclear, despite evidence for both.9,39 However, either scenario is concerning, given the cerebellum’s vital roles and the major volume loss in SUDEP. Medication-induced injury remains an important consideration for epilepsy imaging studies.
Correlational analyses with clinical variables
Reduced parahippocampal volume correlated with disease duration across all epilepsy subjects. Progressive atrophy of mesial temporal structures occurs in temporal lobe epilepsy, 40 and reduced volume of sub-cortical structures, including the parahippocampal gyri, is associated with greater disease duration in the common epilepsies.33 Our data reinforce an association between reduced sub-cortical volume and disease duration. It should, however, be noted that, being a cross-sectional design, the current study did not assess progressive changes in structural volumes due to lack of follow-up scans in many subjects. Progressive changes could be assessed with longitudinal imaging studies, which may elucidate the evolution of volumetric alterations and their association with SUDEP risk, a future objective of imaging research into epilepsy and SUDEP.
Bilateral anterior insula and midbrain volumes correlated negatively (p<0.05, FDR) with time-to-SUDEP from MRI, meaning volumes were increased the closer to SUDEP from scan time. This suggests that progressive enlargement of certain structures may accompany processes leading to SUDEP, although this would need to be assessed with longitudinal imaging studies.
Generalized tonic-clonic seizures
Since both people at high-risk and cases of SUDEP experience GTCS, a key aim of imaging studies is to outline their association with regional volume and consider any changes in relation to group comparisons with people not experiencing GTCS (healthy controls and people at low-risk). We assessed the association between GTCS and regional volumes by performing correlational analyses. If regional increases or decreases in volume resulted from GTCS, significant correlations between GTCS frequency and volume changes should occur. However, correlation analyses with GTCS frequency and the size of structures which showed group differences (i.e. the reduced cerebellar, vermal and thalamic volume, or the increased amygdala, entorhinal, parahippocampal or subcallosal volume) were not strong nor significant in SUDEP or high-risk. One structure which showed a significant group difference (SUDEP<healthy control), the right posterior cingulate, showed a weak significant positive correlation with GTCS frequency (only when SUDEP and high-risk were considered in the same group). However, since this was a positive correlation, it may not offer insight into the volume loss of this structure observed in SUDEP. Significant positive correlations between GTCS frequency and volume were also observed for the bilateral anterior cingulate, when combining both SUDEP and high-risk subjects in one group. Cortical thickening of the cingulate has been recently demonstrated in GTCS patients. 5 Volume elevations associated with gliosis resulting from hyperexcitability due to repeated seizures may be operating,41 and may be indicative of limbic network dysfunction linked to GTCS.42
When high risk and SUDEP groups were considered separately, correlations between the right posterior cingulate volume and GTCS frequency became non-significant in both groups, and the finding of increased anterior cingulate volume with GTCS frequency remained the same in high-risk, but became non-significant in SUDEP. In SUDEP cases only, additional significant correlations between volume and GTCS frequency emerged, including a positive correlation with the right hippocampus and negative correlations with the left mid cingulate and left anterior insula. These findings suggest that brain volumetric processes related to elevated GTCS frequency may be manifested differently in high-risk and SUDEP.
Finally, a critical difference between high-risk and SUDEP groups (who had very similar GTCS frequencies) was volume loss in the PAG and posterior cingulate, and increased volume of the subcallosal cortex, which was evident only in SUDEP. If specific to GTCS, such volume alterations would be expected in high-risk subjects as well, but this was not the case, suggesting that these alterations may be separate from GTCS frequency processes. GTCS will remain a critical issue in all studies investigating SUDEP, especially imaging ones, and efforts to take this into account should be made in any future studies.
Stratification of living subjects into high- and low-risk
Living high- and low-risk patients were classified based on experience and frequency of GTCS. High-risk subjects were those experiencing more than three GTCS per year. Although risk-stratification is difficult, we based our classification on the leading SUDEP risk-factor, which also distinguished more than 80% of SUDEP cases here. The only variable to distinguish a greater number of SUDEP cases was presence of GTCS, which is a weaker SUDEP risk factor,18 and its use to define high-risk would only limit interpretation of results. While this may be seen as a limitation, it should also be noted that, in doing so, other factors known to influence volume changes, such as disease duration, could be partially accounted for by attempting to match subjects with similar attributes; thus, we were able to shed light on imaging changes related not only to SUDEP but the greatest risk-factor associated with the fatal event.
Conclusion
SUDEP is accompanied by tissue changes within brain structures which trigger cardiovascular and breathing collapse, and cerebellar and brainstem structures which are protective for recovery from such collapse. High-risk subjects showed alterations within similar regions, suggesting such features could be used to prospectively identify patients at risk. Non-invasive volumetric assessments within identified sites may shed light on failing mechanisms and represent further biomarkers of SUDEP.
Supplementary Material
Key points.
Brain volumes in cortical, sub-cortical, and cerebellar sites which influence blood pressure and breathing patterns are altered in SUDEP
Volumes increased in the amygdala, entorhinal cortex, parahippocampal gyrus and subcallosal cortex, which induce apnea or hypotension
Volumes decreased in the cerebellum, periaqueductal gray, posterior cingulate and posterior thalamus, sites involved in recovery from cardiorespiratory dysfunction
Periaqueductal gray and posterior cingulate volume loss, and increased subcallosal volume, was exclusive to SUDEP
Areas inducing apnea and hypotension may be hyperactive, while recovery sites may be impaired due to tissue loss; structural trends may aid risk assessment
Acknowledgements
We are grateful for support from the NIH—National Institute of Neurological Disorders and Stroke U01-NS090407 (The Center for SUDEP Research). JD and SBV are supported by the National Institute for Health Research University College London Hospitals Biomedical Research Centre (NIHR BRC UCLH/UCL High Impact Initiative). GPW was supported by the Medical Research Council (G0802012, MR/M00841X/1). We are grateful to the Wolfson Foundation and the Epilepsy Society for supporting the Epilepsy Society MRI scanner. This work was supported by the National Institute for Health Research University College London Hospitals Biomedical Research Centre. SB was supported by The Muir Maxwell Trust and Epilepsy Society.
Footnotes
We confirm that we have read the Journal’s position on issues involved in ethical publication and affirm that this report is consistent with those guidelines.
Disclosure
No authors have any conflicts of interest to disclose.
References
- 1.Ryvlin P, Nashef L, Lhatoo SD, et al. Incidence and mechanisms of cardiorespiratory arrests in epilepsy monitoring units (MORTEMUS): a retrospective study. Lancet Neurol 2013;12:966–977. [DOI] [PubMed] [Google Scholar]
- 2.Surges R, Sander JW. Sudden unexpected death in epilepsy: mechanisms, prevalence, and prevention. Curr Opin Neurol 2012;25:201–207. [DOI] [PubMed] [Google Scholar]
- 3.Wandschneider B, Koepp M, Scott C, et al. Structural imaging biomarkers of sudden unexpected death in epilepsy. Brain 2015. [DOI] [PMC free article] [PubMed] [Google Scholar]
- 4.DeGiorgio CM, Markovic D, Mazumder R, et al. Ranking the Leading Risk Factors for Sudden Unexpected Death in Epilepsy. Front Neurol 2017;8:473. [DOI] [PMC free article] [PubMed] [Google Scholar]
- 5.Ogren JA, Tripathi R, Macey PM, et al. Regional cortical thickness changes accompanying generalized tonic-clonic seizures. Neuroimage Clin 2018;20:205–215. [DOI] [PMC free article] [PubMed] [Google Scholar]
- 6.Nashef L, So EL, Ryvlin P, et al. Unifying the definitions of sudden unexpected death in epilepsy. Epilepsia 2012;53:227–233. [DOI] [PubMed] [Google Scholar]
- 7.Gaser C, Dahnke R. CAT - A Computational Anatomy Toolbox for the Analysis of Structural MRI Data 22nd Annual Meeting of the Organization for Human Brain Mapping Geneva, Switzerland 2016. [Google Scholar]
- 8.Cardoso MJ, Modat M, Wolz R, et al. Geodesic Information Flows: Spatially-Variant Graphs and Their Application to Segmentation and Fusion. IEEE Trans Med Imaging 2015;34:1976–1988. [DOI] [PubMed] [Google Scholar]
- 9.De Marcos FA, Ghizoni E, Kobayashi E, et al. Cerebellar volume and long-term use of phenytoin. Seizure 2003;12:312–315. [DOI] [PubMed] [Google Scholar]
- 10.Ramu A, Bergmann F. The role of the cerebellum in blood pressure regulation. Experientia 1967;23:383–384. [DOI] [PubMed] [Google Scholar]
- 11.Calton MA, Howard JR, Harper RM, et al. The Cerebellum and SIDS: Disordered Breathing in a Mouse Model of Developmental Cerebellar Purkinje Cell Loss during Recovery from Hypercarbia. Front Neurol 2016;7:78. [DOI] [PMC free article] [PubMed] [Google Scholar]
- 12.Henderson LA, Woo MA, Macey PM, et al. Neural responses during Valsalva maneuvers in obstructive sleep apnea syndrome. J Appl Physiol 2003;94:1063–1074. [DOI] [PubMed] [Google Scholar]
- 13.Massey CA, Sowers LP, Dlouhy BJ, et al. Mechanisms of sudden unexpected death in epilepsy: the pathway to prevention. Nat Rev Neurol 2014;10:271–282. [DOI] [PMC free article] [PubMed] [Google Scholar]
- 14.Marcian V, Marecek R, Koritakova E, et al. Morphological changes of cerebellar substructures in temporal lobe epilepsy: A complex phenomenon, not mere atrophy. Seizure 2018;54:51–57. [DOI] [PubMed] [Google Scholar]
- 15.Oyegbile TO, Bayless K, Dabbs K, et al. The nature and extent of cerebellar atrophy in chronic temporal lobe epilepsy. Epilepsia 2011;52:698–706. [DOI] [PMC free article] [PubMed] [Google Scholar]
- 16.Szabo CA, Lancaster JL, Lee S, et al. MR imaging volumetry of subcortical structures and cerebellar hemispheres in temporal lobe epilepsy. AJNR Am J Neuroradiol 2006;27:2155–2160. [PMC free article] [PubMed] [Google Scholar]
- 17.Tomson T, Nashef L, Ryvlin P. Sudden unexpected death in epilepsy: current knowledge and future directions. Lancet Neurol 2008;7:1021–1031. [DOI] [PubMed] [Google Scholar]
- 18.Harden C, Tomson T, Gloss D, et al. Practice guideline summary: Sudden unexpected death in epilepsy incidence rates and risk factors: Report of the Guideline Development, Dissemination, and Implementation Subcommittee of the American Academy of Neurology and the American Epilepsy Society. Neurology 2017;88:1674–1680. [DOI] [PubMed] [Google Scholar]
- 19.Welsh JP, Yuen G, Placantonakis DG, et al. Why do Purkinje cells die so easily after global brain ischemia? Aldolase C, EAAT4, and the cerebellar contribution to posthypoxic myoclonus. Adv Neurol 2002;89:331–359. [PubMed] [Google Scholar]
- 20.Lhatoo S, Noebels J, Whittemore V, et al. Sudden unexpected death in epilepsy: Identifying risk and preventing mortality. Epilepsia 2015;56:1700–1706. [DOI] [PMC free article] [PubMed] [Google Scholar]
- 21.Bozorgi A, Chung S, Kaffashi F, et al. Significant postictal hypotension: expanding the spectrum of seizure-induced autonomic dysregulation. Epilepsia 2013;54:e127–130. [DOI] [PMC free article] [PubMed] [Google Scholar]
- 22.Lacuey N, Hampson JP, Theeranaew W, et al. Cortical Structures Associated With Human Blood Pressure Control. JAMA Neurol 2018;75:194–202. [DOI] [PMC free article] [PubMed] [Google Scholar]
- 23.Xu F, Frazier DT. Role of the cerebellar deep nuclei in respiratory modulation. Cerebellum 2002;1:35–40. [DOI] [PubMed] [Google Scholar]
- 24.Ogren JA, Macey PM, Kumar R, et al. Impaired cerebellar and limbic responses to the valsalva maneuver in heart failure. Cerebellum 2012;11:931–938. [DOI] [PubMed] [Google Scholar]
- 25.Harper RM, Macey PM, Woo MA, et al. Hypercapnic exposure in congenital central hypoventilation syndrome reveals CNS respiratory control mechanisms. J Neurophysiol 2005;93:1647–1658. [DOI] [PubMed] [Google Scholar]
- 26.Hopkins DA, Holstege G. Amygdaloid projections to the mesencephalon, pons and medulla oblongata in the cat. Exp Brain Res 1978;32:529–547. [DOI] [PubMed] [Google Scholar]
- 27.Ni HF, Zhang JX, Harper RM. Cardiovascular-related discharge of periaqueductal gray neurons during sleep-waking states. Brain Res 1990;532:242–248. [DOI] [PubMed] [Google Scholar]
- 28.Mueller SG, Bateman LM, Laxer KD. Evidence for brainstem network disruption in temporal lobe epilepsy and sudden unexplained death in epilepsy. Neuroimage Clin 2014;5:208–216. [DOI] [PMC free article] [PubMed] [Google Scholar]
- 29.Koutsikou S, Crook JJ, Earl EV, et al. Neural substrates underlying fear-evoked freezing: the periaqueductal grey-cerebellar link. J Physiol 2014;592:2197–2213. [DOI] [PMC free article] [PubMed] [Google Scholar]
- 30.Kommajosyula SP, Tupal S, Faingold CL. Deficient post-ictal cardiorespiratory compensatory mechanisms mediated by the periaqueductal gray may lead to death in a mouse model of SUDEP. Epilepsy Res 2018;147:1–8. [DOI] [PubMed] [Google Scholar]
- 31.Dlouhy BJ, Gehlbach BK, Kreple CJ, et al. Breathing Inhibited When Seizures Spread to the Amygdala and upon Amygdala Stimulation. J Neurosci 2015;35:10281–10289. [DOI] [PMC free article] [PubMed] [Google Scholar]
- 32.Harper RM, Frysinger RC, Trelease RB, et al. State-dependent alteration of respiratory cycle timing by stimulation of the central nucleus of the amygdala. Brain Res 1984;306:1–8. [DOI] [PubMed] [Google Scholar]
- 33.Whelan CD, Altmann A, Botia JA, et al. Structural brain abnormalities in the common epilepsies assessed in a worldwide ENIGMA study. Brain 2018;141:391–408. [DOI] [PMC free article] [PubMed] [Google Scholar]
- 34.Lazar SW, Kerr CE, Wasserman RH, et al. Meditation experience is associated with increased cortical thickness. Neuroreport 2005;16:1893–1897. [DOI] [PMC free article] [PubMed] [Google Scholar]
- 35.Vezzani A, Granata T. Brain inflammation in epilepsy: experimental and clinical evidence. Epilepsia 2005;46:1724–1743. [DOI] [PubMed] [Google Scholar]
- 36.Bernhardt BC, Hong SJ, Bernasconi A, et al. Magnetic resonance imaging pattern learning in temporal lobe epilepsy: classification and prognostics. Ann Neurol 2015;77:436–446. [DOI] [PubMed] [Google Scholar]
- 37.Hesdorffer DC, Tomson T, Benn E, et al. Do antiepileptic drugs or generalized tonic-clonic seizure frequency increase SUDEP risk? A combined analysis. Epilepsia 2012;53:249–252. [DOI] [PubMed] [Google Scholar]
- 38.Ryvlin P, Cucherat M, Rheims S. Risk of sudden unexpected death in epilepsy in patients given adjunctive antiepileptic treatment for refractory seizures: a meta-analysis of placebo-controlled randomised trials. Lancet Neurol 2011;10:961–968. [DOI] [PubMed] [Google Scholar]
- 39.Hagemann G, Lemieux L, Free SL, et al. Cerebellar volumes in newly diagnosed and chronic epilepsy. J Neurol 2002;249:1651–1658. [DOI] [PubMed] [Google Scholar]
- 40.Caciagli L, Bernasconi A, Wiebe S, et al. A meta-analysis on progressive atrophy in intractable temporal lobe epilepsy: Time is brain? Neurology 2017;89:506–516. [DOI] [PMC free article] [PubMed] [Google Scholar]
- 41.Binder DK, Steinhäuser C. Functional changes in astroglial cells in epilepsy. Glia. 2006;54:358–68. [DOI] [PubMed] [Google Scholar]
- 42.Bernhardt BC, Worsley KJ, Besson P, et al. Mapping limbic network organization in temporal lobe epilepsy using morphometric correlations: insights on the relation between mesiotemporal connectivity and cortical atrophy. Neuroimage. 2008;42:515–24. [DOI] [PubMed] [Google Scholar]
Associated Data
This section collects any data citations, data availability statements, or supplementary materials included in this article.