Abstract
An Nb-silicide based alloy will require some kind of coating system. Alumina and/or SiO2 forming alloys that are chemically compatible with the substrate could be components of such systems. In this work, the microstructures, and isothermal oxidation at 800 °C and 1200 °C of the alloys (at.%) Si-23Fe-15Cr-15Ti-1Nb (OHC1) and Si-25Nb-5Al-5Cr-5Ti (OHC5) were studied. The cast microstructures consisted of the (TM)6Si5, FeSi2Ti and (Fe,Cr)Si (OHC1), and the (Nb,Ti)(Si,Al)2, (Nb,Cr,Ti)6Si5, (Cr,Ti,Nb)(Si,Al)2 (Si)ss and (Al)ss (OHC5) phases. The same compounds were present in OHC1 at 1200 °C and the (Nb,Ti)(Si,Al)2 and (Nb,Cr,Ti)6Si5 in OHC5 at 1400 °C. In OHC1 the (TM)6Si5 was the primary phase, and the FeSi and FeSi2Ti formed a binary eutectic. In OHC5 the (Nb,Ti)(Si,Al)2 was the primary phase. At 800 °C both alloys did not pest. The scale of OHC1 was composed of SiO2, TiO2 and (Cr,Fe)2O3. The OHC5 formed a very thin and adherent scale composed of Al2O3, SiO2 and (Ti(1−x−y),Crx,Nby)O2. The scale on (Cr,Ti,Nb)(Si,Al)2 had an outer layer of SiO2 and Al2O3 and an inner layer of Al2O3. The scale on the (Nb,Cr,Ti)6Si5 was thin, and consisted of (Ti(1−x−y),Crx,Nby)O2 and SiO2 and some Al2O3 near the edges. In (Nb,Ti)(Si,Al)2 the critical Al concentration for the formation of Al2O3 scale was 3 at.%. For Al < 3 at.% there was internal oxidation. At 1200 °C the scale of OHC1 was composed of a SiO2 inner layer and outer layers of Cr2O3 and TiO2, and there was internal oxidation. It is most likely that a eutectic reaction had occurred in the scale. The scale of OHC5 was α-Al2O3. Both alloys exhibited good correlations with alumina forming Nb-Ti-Si-Al-Hf alloys and with non-pesting and oxidation resistant B containing Nb-silicide based alloys in maps of the parameters δ, Δχ and VEC.
Keywords: coatings, intermetallics, silicides, pest oxidation, high temperature oxidation, Nb-silicide based alloys
1. Introduction
The search for structural materials with improved ultra-high temperature capabilities beyond those of Ni-based superalloys has concentrated on refractory metal intermetallic composites (RMICs), among which Nb-silicide based alloys (also known as Nb silicide in situ composites) continue to attract much attention because of their desirable densities, high liquidus temperatures and their offering of a balance of properties. These new alloys, like the Ni-based superalloys, will require a coating system to reduce the temperature of the metal surface (substrate) and enhance resistance to oxidation in the environments where they will operate.
A coating system on Nb-silicide based alloys could be of the thermal barrier type consisting of bond coat (BC), thermally grown oxide (TGO) and top coat (TC). In a materials system consisting of the substrate, BC, TGO, TC and the environment, a systems approach is needed to establish design methodologies (approaches) and to control and improve the performance. A multi-material BC could be used, where the BC components should enable the adherence of other components of the coating system and protect the substrate from interstitial contamination. The BC could include a silicide coating alloy and other components, for example a diffusion barrier consisting of a Laves phase containing layer and/or a platinum group metal layer [1] and/or alumina forming alloy(s) [2,3]. The temperature-time history of the TGO could be the dominant factor governing the life of the coating system. The selection of silicide coating alloys for Nb-silicide based alloys could benefit from earlier research on coatings for Nb alloys.
Nb alloys (not Nb-silicide based alloys) have been considered for advanced aerospace vehicles, flight propulsion systems and advanced gas turbines owing to the high melting point of Nb, their strength potential to 1650 °C and their density. Because of the severe degradation of Nb alloys at elevated temperatures, coatings were developed to provide resistance to oxidation, thermal fatigue, hot gas erosion, particle abrasion, impact damage and strain induced cracking [4]. Techniques used to form protective coatings utilised vapour transport and diffusion (e.g., pack cementation) and liquid-solid diffusion (e.g., fused slurry, hot dipping). Chemical vapour deposition, plasma spraying techniques and cladding were also used [4].
The Nb alloy development research confirmed the effectiveness of Ti and Al in improving the oxidation resistance of Nb. These elements also enhance the oxidation resistance of Nb-silicide based alloys [5]. The coating development research demonstrated that plasma sprayed Si-Mo-Al-Cr-B (LM-5) coating with a Nb-Ti-Cr-Al-Ni intermediate layer provided excellent oxidation protection to Nb alloys at 1150 °C (for about 1000 h) and 1480 °C (≈ 100 h). Aluminide coatings on Nb alloys offered oxidation protection for shorter times and at lower temperatures compared with silicide coatings, and also were susceptible to pest oxidation [4].
The oxidation of alloyed MoSi2 at intermediate and high temperatures depends on alloying additions [6,7]. Silicide coatings based on the Mo disilicide were considered for Nb alloys [4]. Silicide coatings (not just MoSi2 based) on Nb alloys could provide oxidation protection below 1370 °C. Pack cementation Si-Cr-Al silicide based coating alloys with the addition of Ti gave duplex coating systems with excellent oxidation resistance up to 1425 °C, no pesting and no rapid oxidation of the substrate at the base of cracks of the silicide coating. The low ductility of silicide coatings was addressed with coating systems that included ductile layer(s) to absorb strain induced by impact, deformation or thermal stress. Ductile layers based on Fe-Cr-Al alloys were considered but their use was not pursued owing to their catastrophic oxidation in the range 1315 °C to 1370 °C. Instead Nb-Cr-Ti layers were used [4].
The compositions near the top surface and mid-thickness of an Al free silicide coating about 60 μm thick on a Nb-10W-1Zr-0.1C (wt.%) alloy (D-43) respectively were 65Si-19Cr-15Ti-1Nb and 62Si-18Cr-10Ti-10Nb (at.%). Complex silicide alloys were the most effective coatings for Nb alloys, they did not suffer from pest oxidation and could offer oxidation protection for over 1000 h at 1200 °C. Examples are the Si-20Cr-20Ti (R-512A) and Si-20Cr-20Fe (R-512E) coatings (wt.%) that were developed by Sylvania Electric Products, Inc., Hicksville, N.Y (often referred to as Sylvania coatings and also known as HITEMCO coatings). In oxidation-erosion, silicides of the Si-Cr-Ti type proved most protective, while in thermal fatigue R-512E type silicides were superior [4].
Dense, continuous and adherent Al2O3 or SiO2 oxides protect alloys from oxidation at high temperatures (T > 1000 °C). These oxides are the most protective because of their high thermodynamic stability and the low diffusivities for anions and cations. An understanding of the microstructures that govern the performance of materials used in coatings is needed to provide a sound basis for developing advanced coating systems for a particular family of substrates.
An alumina or silica forming BC alloy applied on a substrate could consist of three parts after oxidation. The oxide on the top (primary barrier), the coating alloy which acts as a reservoir for the oxide formation and a diffusion zone [8]. Diffusion barrier(s) can minimise interdiffusion between coating and substrate. The time to failure of the materials system (substrate + BC) would depend on how the three parts perform as oxygen barriers and its mechanical performance would be affected (i) by reservoir ductility, (ii) coating/substrate interdiffusion and (iii) craze cracks in the reservoir because of coefficient of thermal expansion (CTE) mismatch. Further, (ii) and (iii) can also have a significant effect on the oxidation performance [9].
The metallurgy of refractory metal alloys also has been interested in combining either silicide or other reservoirs and controlled composition silica glasses (primary barrier). The composition of the glass formed on a silicide coating is a function of the composition of the reservoir, temperature and pressure, and varies within these three parameters. Research on coatings for Nb-silicide based alloys has exploited silicide based coatings (e.g., [8,10,11]). The knowledge gained from earlier research on coatings for refractory metal alloys (not RMICs) and from recent research on Nb-silicide based alloys was used in the research presented in this paper.
Type, number and distribution of defects and interdiffusion profiles are interrelated respectively with the coating process and the substrate used. In the absence of defects, coating life is limited by diffusional processes at low and high temperatures, and by evaporation or melting at ultra-high temperatures. At temperatures above approximately 1650 °C, the evaporation rate of SiO2 becomes significant, as do the vapour pressures of SiO in equilibrium with Si and SiO2 and of Si in equilibrium with the Si rich (i.e., the higher) silicides. With alumina forming coatings the vapour pressure of AI is appreciable at higher temperatures.
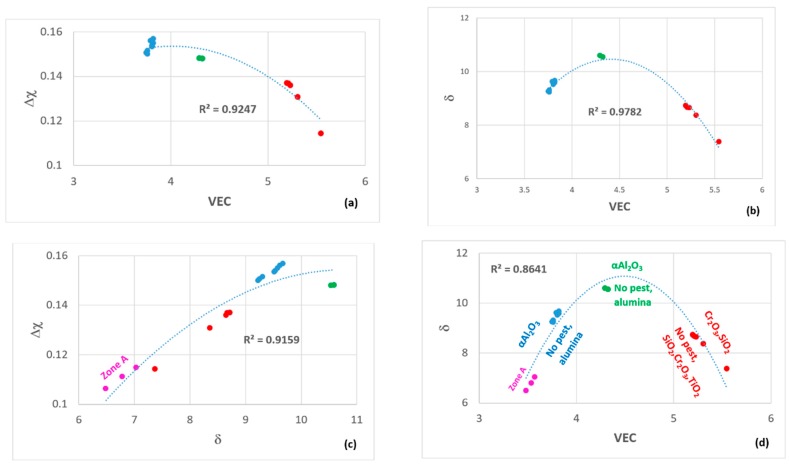
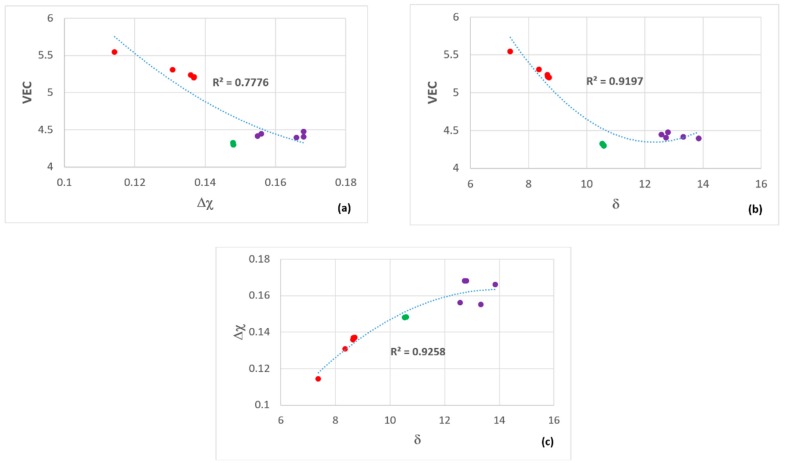
The aims of the research presented in this paper were (a) to provide an insight into the design and selection of metallic materials for a coating system for Nb-silicide based alloys, (b) to highlight issues that require new levels of understanding and (c) to find out if alloys based on Si-Cr-Ti-X (X = Al, Fe, Nb) systems are worthy of further research to ascertain their application as BC alloys for Nb-silicide based alloys. Two alloys have been chosen for consideration in this paper. The objectives of the research were (i) to study the microstructures of the cast and heat treated alloys, (ii) to evaluate their isothermal oxidation at 800 and 1200 °C and (iii) to “define” pathway(s) for alumina and/or silica forming BC alloys for Nb-silicide based alloys in maps of the parameters VEC, δ and Δχ.
In this paper, we report for the first time our research on two new alloys of the aforementioned system. The alloys were not studied as coatings applied on a Nb-silicide based substrate in order to eliminate the effects of substrate and coating process on microstructures and isothermal oxidation [2,3].
The structure of the paper is as follows. First, we discuss how the alloy compositions were selected. This section is followed by a brief description of the experimental techniques that were used. The results for the cast and heat-treated microstructures of the alloys, and their isothermal oxidation at 800 °C and 1200 °C are then presented. In the discussion, we deliberate on the microstructures of the alloys before we consider their oxidation. The alloys are then compared with the alumina forming Nb-Ti-Si-Al-Hf alloys and Nb-silicide based alloys. Suggestions for future work are given before the summary and conclusions.
2. Design of Alloys
Our goal was to design and develop SiO2 and/or αAl2O3 scale forming silicide alloys. These alloys should not pest. The design of the alloys benefited from the research reported in [2,3], the design methodology NICE [5] and knowledge about the oxidation of silicides (see below). The alloys were designed to have (i) no stable Nb solid solution in their microstructures and (ii) Si rich and/or Al and Si rich transition metal silicides.
2.1. Why Silicide Coating Alloys?
The research on refractory metals and their alloys has shown that effective primary barriers for use below 1370 °C are silica and silica glasses. Silicide coatings on Nb alloys (not Nb-silicide based alloys) have withstood multiple thousands of cycles from room temperature to 1200 °C to 1370 °C without reservoir spallation [4]. Strains due to the differential expansion between oxide (primary barrier), reservoir or substrate, oxide growth stresses and cracking of the oxide due to differences in temperature could lead to the rapid consumption of the reservoir in the case of alumina [12]. The fact that the elastic moduli of alumina (215 to 413 GPa) and silica (66 to 75 GPa) [13] are different is important. The low elastic modulus of silica minimises the effects of strains. Silica can be vitreous and readily vitrified below 1370 °C by minor additions that can also lower the softening temperature of the glass to about 650 °C, almost completely eliminating strain in the primary oxide as a cause of coating failure. Cristobalite and tridymite form as the scales devitrify. The growth rate of the scale and the activation energy for diffusion through SiO2 depend on whether the scale is crystalline or amorphous [14].
Silicide coatings can be modified with B or Ge. Both elements are important additions in Nb-silicide based alloys [15,16] because they contribute to the suppression of pest oxidation and also improve high temperature oxidation resistance [17]. B2O3 or GeO2 solute in SiO2 results in a glass with higher fluidity at a lower temperature to heal cracks. The CTE values of B2O3-SiO2 and GeO2-SiO2 are significantly higher than pure SiO2 [18].
The low softening temperature is advantageous because there might be a marked expansion mismatch between silicide coating and Nb-silicide based alloy substrate. Craze cracks would develop in the reservoir during cyclic oxidation. During every thermal cycle, oxide would build up in these craze cracks. Unless the oxide can be extruded on heat-up, shear failure would eventually occur between the reservoir and the substrate. Alumina, which does not soften until above 1650 °C, cannot be extruded from craze cracks. This limits the cycle performance of aluminide reservoirs.
2.2. Which Silicide(s)?
The MSi2 has the highest Si activity. When MSi2 oxidises the lower MSi or M5Si3 silicides can form (M is transition metal). The CrSi2 and NbSi2 have the same crystal structure (C40 compounds) [19]. The structures of these disilicides and the C54-TiSi2 are closely related and can be regarded as alternative stackings of layers that are topologically similar to bcc (110) planes [20]. The nearest neighbour environments in the C40 and C54 structures are fully equivalent. The face centred orthorhombic C54 structure of TiSi2 is the stable one, but there exists a base centred orthorhombic C49 structure that is metastable. The C49 → C54 transformation temperature of TiSi2 decreases with alloying additions and the decrease depends on the electronegativity of the ternary addition. Nb decreases this transformation temperature by 50 °C [21]. The FeSi and CrSi have the same crystal structure (B20 compounds) [19].
At 800 °C the NbSi2 fails catastrophically but the disilicides of Cr and Ti, and the (Ti,Cr)Si2 and (Ti,Cr,Nb)Si2 have excellent oxidation resistance. The FeSi2 forms SiO2 in the range 500 °C to 1000 °C [22,23] but has been reported to be susceptible to pest oxidation [24]. The FeSi also forms SiO2 [25]. At temperatures above 1000 °C, the CrSi2 forms Si containing scales that tend to be non-adherent. As temperature increases there is a volatilisation of CrO3. At 1315 °C the NbSi2 has very poor oxidation resistance compared with the outstanding resistance of TiSi2 and the CrSi2 losses weight and the scale spalls off on thermal cycling. The (Ti,Cr)Si2 gains weight rapidly but the addition of Nb in (Ti,Cr,Nb)Si2 greatly slows down the oxidation. [12]. The literature points to the fact that tolerance for Nb by disilicides is extremely important in coatings formed by diffusion into Nb alloys.
The oxidation resistance of Nb5Si3 at 800 °C and 1315 °C is poor. This silicide exhibits solubility for transition metals, simple metals and metalloid elements [26] but is likely to suffer from environmental embrittlement [27]. At 800 °C the oxidation of Cr5Si3 is better than that of Ti5Si3. The (Ti,Cr)5Si3 has good oxidation resistance at 800 °C and 1315 °C where its weight gain is small. At both temperatures the (Ti,Cr)5Si3 and (Ti,Cr,Nb)5Si3 have equal or superior oxidation resistance compared with the disilicides containing these elements. A tolerance for Nb is particularly lacking in silicides that do not contain Cr and Ti. The significance of having comparable oxidation performances for both M5Si3 and MSi2 is quite marked. According to Metcalfe and Stetson, “two mils of NbSi2 would convert to four mils of Nb5Si3 at 1315 °C in about 51 h”. Only Cr-Si-Ti compositions forming (Ti,Cr,Nb)5Si3 would be expected to have reliable oxidation performance beyond the time necessary for conversion of all the MSi2 to M5Si3 [12]. The Fe5Si3 forms Fe2O3 with linear oxidation kinetics, and the sulfidation resistance of the scale is better than that of Cr2O3 or Al2O3 scales.
Nb behaves well in sulfidation conditions [28]. Combining an oxidation resistant element like Cr with a sulfidation resistant element like Nb has led to Cr-Nb alloys (e.g., Cr-40Nb (wt.%)) with oxidation and sulfidation resistance [29]. The addition of Al in Nb at concentrations exceeding 5 at.% also increased sulfidation resistance compared with pure Nb [30]. Resistance to sulfidation was also exhibited by Nb-38Al-4Si and Nb-35Al-6Si (at.%) alloys [31].
2.3. Selection of Alloys
The aforementioned literature guided us to consider coatings containing the elements Al, Cr, Fe, Nb, Si, Ti. We were interested in Fe because of the earlier research on Sylvania type coatings (see introduction) and because Fe as an addition with Cr in Nb-silicide based alloys [32] promotes the formation of C14 Laves phase [33] that enhances their oxidation resistance. The design of the αAl2O3 forming Nb-Ti-Si-Al-Hf alloys [2,3] was guided by the design methodology NICE [5] and showed that three key parameters based on electronegativity (Δχ), atomic size (δ) and the number of valence electrons per atom filled into the valence band (VEC) described well their alloying behavior. We wanted to explore other areas in the maps of the parameters Δχ,δ and VEC that were published in Figure 11 in [3] with silicide coating alloys with microstructures with MSi2, M5Si3 and M6Si5 type silicides, the latter because it can be in equilibrium with the former two [34,35]. Keeping in mind the requirements (i) and (ii) (see the start of this section) the compositions of Sylvania silicide coating alloys (see introduction), the oxidation of silicides (see previous two sections), the alloying elements of interest and available phase equilibria data for the Cr-Si-Ti [34], Fe-Si-Ti [36], Cr-Fe-Si [37] and Cr-Nb-Si [35] systems, we selected the Si concentrations of about 45 at.% and 60 at.%, and designed alloys to be located (1) in the right hand side in the Δχ versus VEC map of alumina forming Nb-Ti-Si-Al-Hf alloys [3] with (a) Δχ in-between the values corresponding to Zone A of the alloy MG7 (Nb1.3Si2.4Ti2.4Al3.5Hf0.4) [2] and the alloys MG5 (Nb1.45Si2.7Ti2.25Al3.25Hf0.35), MG6 (Nb1.35Si2.3Ti2.3Al3.7Hf0.35) and MG7 [3] and inside the “forbidden” range of Δχ values of the Nb solid solution [38], (b) VEC higher than the values of the alloys MG5, MG6 and MG7 [3] and (c) δ lower than the alloys MG5, MG6 and MG7 but higher than the Zone A of the alloy MG7 [2], and (2) in the top part in the Δχ versus VEC map of alumina forming Nb-Ti-Si-Al-Hf alloys [3] with (d) Δχ “similar” to the bulk and top of the alloys MG5, MG6 and MG7 [2,3] and inside the “forbidden” range of Δχ values of the Nb solid solution [38] and (e) VEC and δ higher than the alloys MG5, MG6 and MG7. We designed a number of coating alloys. In this paper we report on two of these alloys, the nominal compositions (at.%) of which respectively were 46Si-23Fe-15Cr-15Ti-1Nb (OHC1) and 60Si-25Nb-5Al-5Cr-5Ti (OHC5).
3. Experimental
Small buttons of the alloys were prepared from pure elements (≥99.9 wt.% purity) in a Ti gettered Ar atmosphere using arc melting with a water cooled copper crucible, a non-consumable tungsten electrode, a voltage of 50 V and a current of 650 A. Each alloy was melted five times to homogenize its composition. The heat treatments were carried out in an alumina tube furnace in a Ti gettered Ar atmosphere. The alloys were wrapped in Ta foil to minimize contamination by oxygen and were placed in an alumina crucible. The heat treated alloys were furnace cooled.
Conventional metallographic preparation of specimens was used. This involved mounting in bakelite, grinding with SiC paper (from 120–1200 grit) and then to grade 4000 and cashmere cloth polishing with 1μm diamond suspension. The microstructures were characterised using scanning electron microscopy (SEM) and X-ray diffraction (XRD). A Philips PSEM 500 SEM (SEM, Philips-ThermoFisher Scientific, Hillsboro, OR, USA), Jeol JSM 6400 and Inspect F FEG SEM (SEM, Jeol, Tokyo, Japan) were used. The back scatter electron (BSE) mode was mainly used to study the microstructures with qualitative and quantitative energy dispersive X-ray spectroscopy analysis of the alloys and phases. EDS standardization was performed using specimens of high purity Nb, Ti, Cr, Fe, Si, Al, and Co standards that were polished to 1 μm finish. The EDS was calibrated prior to analysis with the Co standard. At least five large area analyses were performed in the top, bulk and bottom of the button and at least ten analyses were obtained from each phase (spot analyses) with size ≥5 μm to determine actual compositions.
A Siemens D500 XRD diffractometer (XRD, Hiltonbrooks Ltd, Crew, UK) with CuKα radiation (λ = 1.540562 Å), 2θ from 20°–120° and a step size of 0.02° was used. For glancing angle XRD (GXRD) a Siemens D5000 diffractometer (Hiltonbrooks Ltd, Crew, UK) with Cu Kα1 and Kα2 radiation (λ = 1.54178 Å), 2θ from 10°–100° and a step size of 0.02° was used. Peaks in the XRD diffractograms were identified by correlating data from the experiments with that from the JCPDS data (International Centre for Diffraction Data). The scan type used for GXRD was detector scan while for regular specimens it was locked coupled. Prior to GXRD experiments the glancing angle was selected with the aid of the AbsorbDX software which evaluates the X-ray penetration depth for particular glancing angle conditions.
The isothermal oxidation of the alloys was studied at 800 °C and 1200 °C for 100 h using a Netzsch STA F3 TG/DSC analyser (Netzch Gmbh, Waldkraiburg, Germany) with a SiC furnace with air flow rate of 20 mL/min and with heating and cooling rates of 3 °C/min. Cubic specimens of size 3 mm × 3 mm × 3 mm and polished to 800 grit SiC finish were used for the thermo-gravimetry (TGA, SEM) experiments. For the DSC experiments a Rh/Pt furnace was used in the Netzsch STA F3 TG/DSC analyser with an Ar flow rate of 20 mL/min. The specimens for thermal analysis were selected from the bulk of the cast buttons.
4. Results
4.1. Cast Alloys
OHC1: The actual composition (at.%) of the cast alloy (OHC1-AC) was Si-23Fe-14.5Cr-15Ti-1Nb, close to the nominal one. This composition was the average of the analyses taken from the top, center and bottom of the button. There was macrosegregation of Ti, Cr and Fe in the button. The concentrations of Ti, Cr and Fe were respectively in the range 8.7–15.7 at.%, 8.1–15.6 at.% and 22–35.5 at.%, with the bottom of the button rich in Fe and lean in Ti and Cr. The parts of the button in direct contact with the water cooled copper crucible (“chill zones”) were richer in Fe (average value 34.0 at.%) and leaner in Cr, Ti and Nb with average values of 8.9, 9.6 and 0.4 at.%, respectively. A “layered” microstructure like the one reported for the alloy MG7 in [2] was not observed.
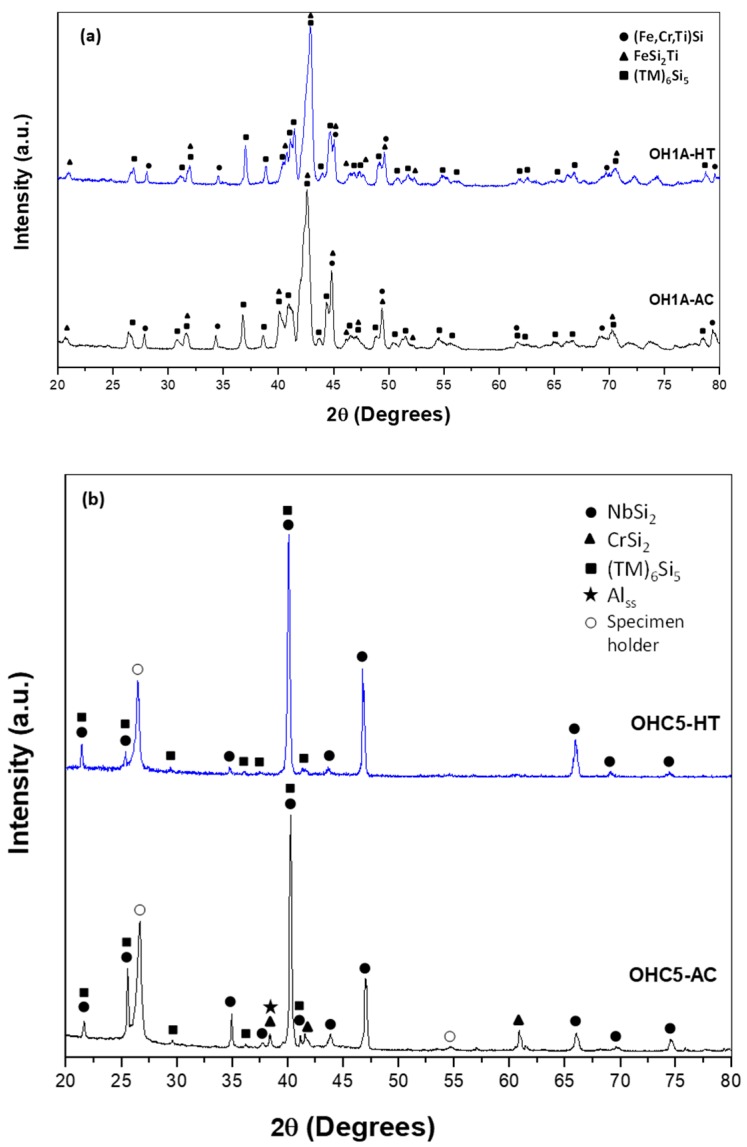
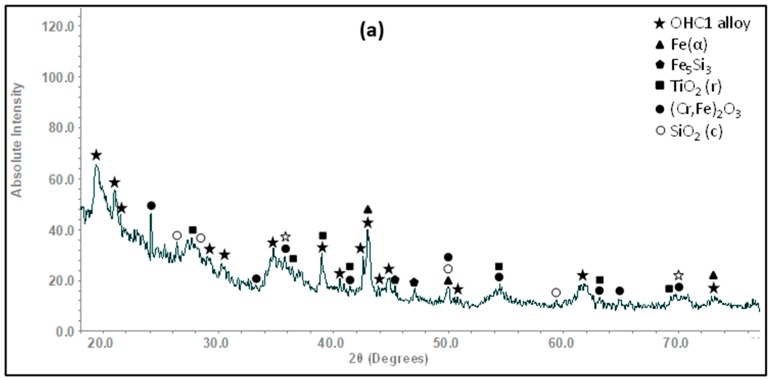
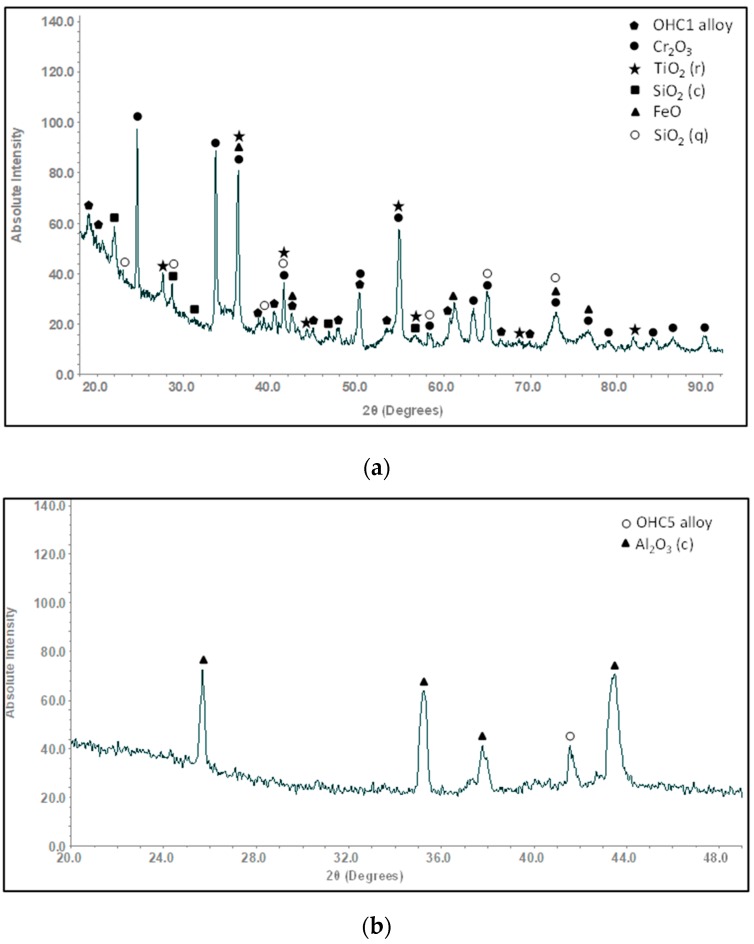
The XRD (Figure 1a) and EDS data confirmed that the microstructure of the alloy consisted of the (TM)6Si5, FeSi2Ti and (Fe,Cr,Ti)Si compounds, where TM = Nb, Ti, Fe, Cr. The (TM)6Si5 compound is also known as the T phase in the Ti-Cr-Si system [34]. It crystallizes in the orthorhombic system with the V6Si5 as its prototype and has space group Ibam [34]. Its average composition was 45.9(0.3)Si-23.5(4.3)Fe-13.8(2.7)Cr-15.9(1.4)Ti-0.8(0.3)Nb, where in parenthesis is given the standard deviation. The FeSi2Ti compound is the τ1 phase in the Fe-Si-Ti system with MnSi2Ti prototype. It is orthorhombic with the Pbam space group. Its composition (47(0.5)Si-31.2(1)Fe-7(1.3)Cr-14.1(1.1)Ti-0.2Nb) matched with the composition of the τ1 phase reported by Weitzer et al. [39], particularly when the data for the heat treated alloy (OHC1-HT) was taken into account (see below). The FeSi phase with the B20 structure crystallizes in the cubic system with the P213 space group [19]. The composition of the (Fe,Cr,Ti)Si phase was 51.4(0.2)Si-41.7(0.6)Fe-5.9(0.6)Cr-0.9Ti-0.1Nb.
Figure 1.
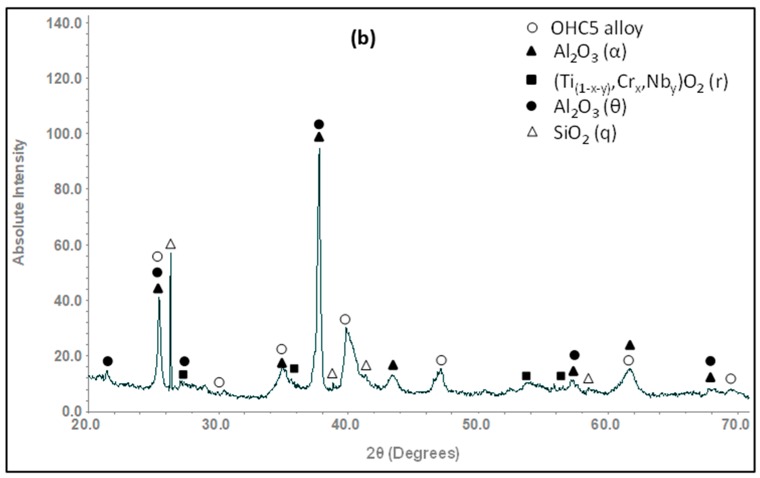
X-ray diffractograms of the alloys (a) OHC1 and (b) OHC5 in the cast and heat-treated conditions.
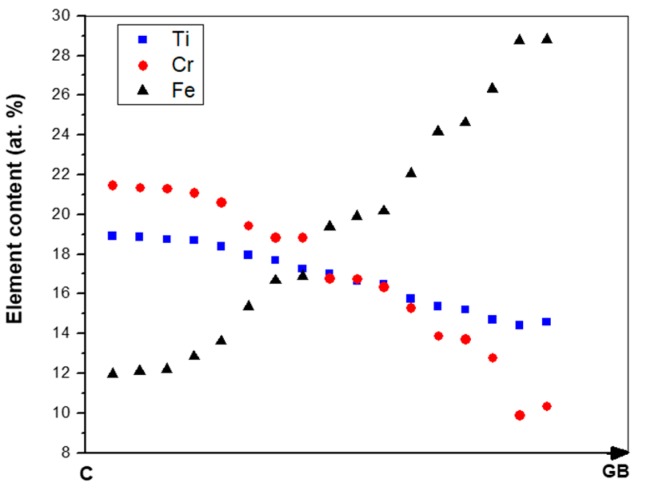
The microstructure in the top and bulk of the button was the same. The facetted dendrites of (TM)6Si5 were severely cracked and the transition metal (TM) content varied with location. Figure 2 shows the EDS data for Cr, Fe and Ti for one such dendrite.
Figure 2.
Average Fe, Cr and Ti concentrations from the center (C) of a (TM)6Si5 dendrite towards its edge (GB).
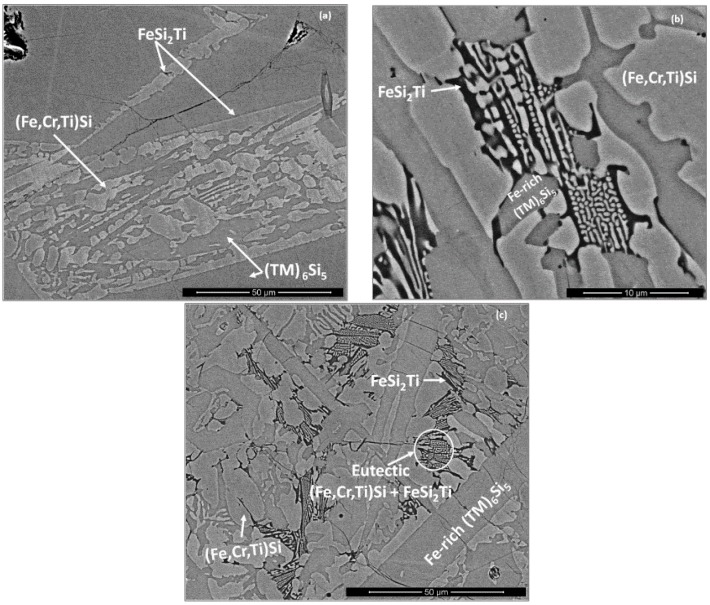
The (Fe,Cr,Ti)Si compound exhibited an elongated facetted morphology and surrounded a thin dark grey layer of the FeSi2Ti phase (Figure 3a). In the lower part of the bulk towards the bottom of the button a very fine lamellar eutectic was observed (Figure 3b,c). This eutectic (50.2(0.2)Si-35.6(0.4)Fe-3.7(0.2)Cr-10.4(0.4)Ti-0.1Nb) consisted of the (Fe,Cr,Ti)Si (bright contrast) and FeSi2Ti (dark contrast) phases, the average compositions of which respectively were 50.8(0.4)Si-36.9(1.5)Fe-4(0.5)Cr-8.2(2)Ti-0.1Nb and 50(0.2)Si-31(1.1)Fe-3.4(0.3)Cr-15.3(1.3)Ti-0.2Nb. In the “chill zone” a higher volume fraction of the (Fe,Cr,Ti)Si and FeSi2Ti phases was observed. The aforementioned eutectic was also present. In contrast to the results obtained for the (TM)6Si5 silicide that was observed in the bulk of the alloy, the microsegregation in the (TM)6Si5 phase was not detected in the “chill zone” and instead only Fe-rich (TM)6Si5 was observed.
Figure 3.
BSE images of the microstructure in (a) bulk, ×2000 (b) bottom, ×8000 and (c) the “chill zone” (×2000) of OHC1-AC.
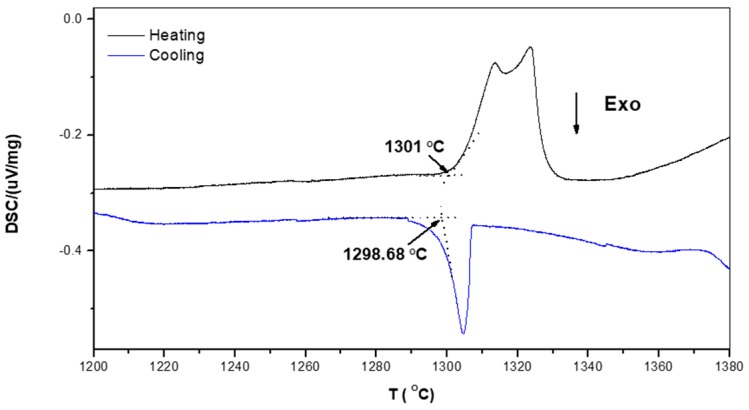
According to the Fe-Si binary phase diagram [19], the melting point of the FeSi phase is 1410 °C. The Cr and Ti additions will increase the melting temperature of (Fe,Cr,Ti)Si. According to Du and Shuster [40] and Weitzer et al. [39], the melting points of the (TM)6Si5 and FeSi2Ti phases should be above 1500 °C. The DSC trace of the alloy OHC1 (Figure 4) showed a thermal event on heating at about 1300 °C that consisted of a double peak. On cooling there was a single peak at about 1298 °C that could correspond to the crystallization of the previous. The endothermic signal showed a double peak that could be due to heterogeneities in the participating phases. The peaks could correspond to the eutectic FeSi + FeSi2Ti observed in the bottom of the alloy and the eutectic reported by Weitzer et al. [39] at 1328 °C (L → FeSi + FeSi2Ti). However, they also assigned a peak at 1298 °C to the invariant reaction L + FeSi2Ti → FeSi + τ4 where τ4 = Fe28.1Ti26.3Si45.6. The τ4 compound was not observed in the alloy OHC1.
Figure 4.
DSC trace of the alloy OHC1.
OHC5: The actual composition (at.%) of the as cast alloy (OHC5-AC) was Si-25.6Nb-4.6Cr-5.2Ti-5.1Al, very close to the nominal composition. This was the average of the analyses taken from all parts of the button. There was macrosegregation of all the elements. The highest Nb and Si and lowest Al, Cr and Ti concentrations were observed in the bulk of the button. The concentrations of Al, Cr, Nb, Si and Ti respectively were in the range 2.4–6.9, 1.8–6.4, 23.2–29.9, 57.1–63.4 and 2.6–7.6 at.%.
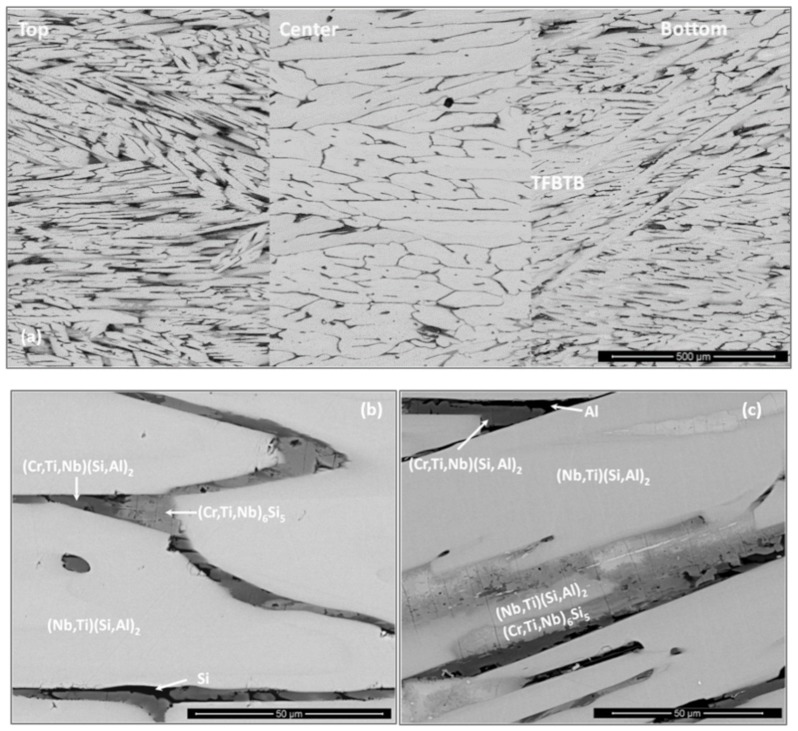
According to the XRD data (Figure 1b) the microstructure of OHC5-AC contained the hexagonal C40 phases NbSi2 (JCPDS card 8-450) and CrSi2 (JCPDS card 01-079-3529), the orthorhombic (Cr,Ti,Nb)6Si5 phase (JCPDS card 89-4813), and possibly Al (JCPDS card 4-787). The XRD data and the EDS analyses confirmed the following phases (Nb,Ti)(Si,Al)2, (Cr,Ti,Nb)6Si5, (Cr,Ti,Nb)(Si,Al)2, and Si and Al solid solutions (Figure 5b,c) with compositions, respectively 64.2(0.5)Si-31.6(0.6)Nb-2(0.5)Ti-2(0.6)Al-0.4Cr, 45.3(0.4)Si-14.6(5.7)Nb-18(1.2)Ti-20.8(4.8)Cr-1.2(0.5)Al, 58.6(1.6)Si-3.8(1)Nb-10.4(1)Ti-19.3(1.5)Cr-8(1.5)Al, 88.7(5.5)Si-2.5(1.4)Nb-2.4(1.2)Ti-3.6(2.3)Cr-2.8(0.8)Al, and 97(0.8)Al-2.4(0.7)Si-0.3Cr-0.2Ti-0.1Nb. The (Si)ss was not confirmed by XRD owing to its low volume fraction in the alloy.
Figure 5.
BSE images of the microstructure of the alloy OHC5-AC, (a) cross section, ×200 (b) bulk, ×2500 and (c) bottom (×2000) of the button.
The bulk microstructure was coarser than those in the bottom and top of the button and there was a transition from the bottom to the bulk (TFBTB), see Figure 5. The OHC5-AC could be considered to have a “layered” structure. Elongated facetted dendrites were formed and there was some porosity. The typical microstructure in the bulk of the button is shown in the Figure 5a,b. It consisted of facetted (Nb,Ti)(Si,Al)2 dendrites with small inter-dendritic regions that were composed of the (Cr,Ti,Nb)6Si5, and (Cr,Ti,Nb)(Si,Al)2 compounds and a very low volume fraction of (Si)ss that exhibited black contrast. The microstructures in the top and TFBTB were similar. Details of the microstructure in the bottom of the button are shown in the Figure 5c. The (Nb,Ti)(Si,Al)2, (Cr,Ti,Nb)6Si5, (Cr,Ti,Nb)(Si,Al)2 compounds were still present but in this part of the button the (Si)ss was not found, instead the (Al)ss was observed. The (Nb,Ti)(Si,Al)2 dendrites were thinner and the inter-dendritic regions larger than in the bulk. There was microsegregation in (Cr,Ti,Nb)6Si5 in which the concentrations of Nb and Cr were the highest respectively in the bulk (about 23 at.%) and edge (about 27 at.%) and the lowest respectively in the edge (about 6 at.% Nb) and centre (about 13 at.% Cr) of grains. There was also microsegregation in (Nb,Ti)(Si,Al)2 in the top and bottom of the button but not in the bulk. The DSC trace (not shown) exhibited an endothermic peak starting at 569 °C. This was attributed to the melting of the (Al)ss.
4.2. Heat Treated Alloys
OHC1: The actual composition (at.%) of the heat treated alloy (OHC1-HT, 1200 °C/48 h) was Si-22.1Fe-15.1Cr-15.8Ti-1.1Nb. This was the average value of the large area analyses taken from all parts of the button. The microstructure had coarsened and consisted of the same phases as OHC1-AC (Figure 1a). The volume fraction of (Fe,Cr,Ti)Si had decreased and the volume fractions of the FeSi2Ti and (TM)6Si5 had increased. In OHC1-HT it was more noticeable that the (Fe,Cr,Ti)Si phase surrounded (enveloped) a thin layer of the FeSi2Ti. The Si and Ti contents of the FeSi2Ti increased by 9% and 49% respectively, bringing its average composition (50.2Si-25Fe-3.3Cr-20.9Ti-0.6Nb) very close to that reported in [39]. The compositions of (Fe,Cr,Ti)Si and (TM)6Si5 essentially were the same as in OHC1-AC. The (TM)6Si5 had cracks and pores, and chemical inhomogeneity was still present.
OHC5: After the heat treatment at 1400 °C for 100 h, the actual composition of OHC5-HT was Si-26.2Nb-4.9Cr-5.2Ti-3.8Al. This was the average of the analyses taken from all parts of the button. Chemical inhomogeneity was still present. Liquation in the specimen or staining of the crucible after the heat treatment were not observed. By liquation it is meant that there was no noticeable distortion of the shape of the heat treated cube. The (Al)ss observed in OHC5-AC would be expected to melt at this temperature.
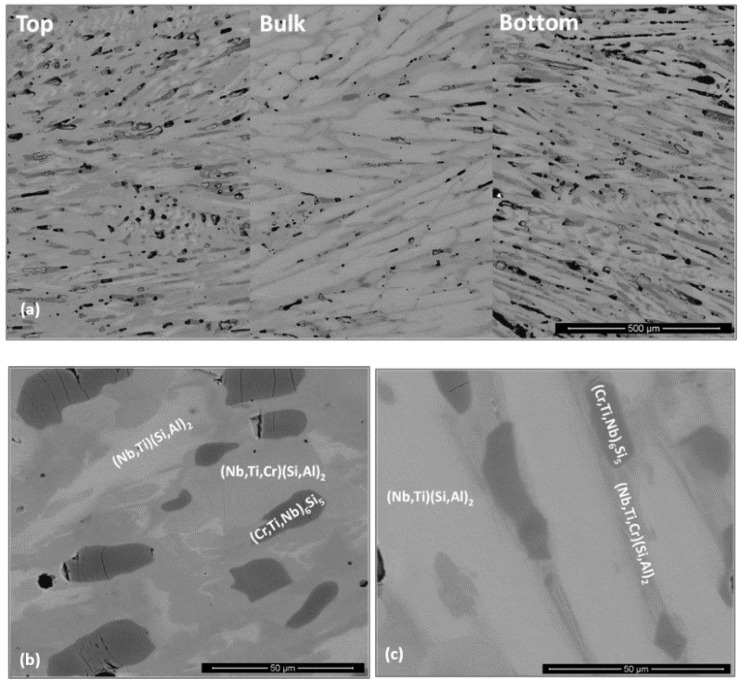
The microstructure (Figure 6) consisted only of two phases, namely the (Cr,Ti,Nb)6Si5 embedded in a matrix of (Nb,Ti)(Si,Al)2. This was confirmed by the XRD (Figure 1b). Owing to the dissolution of the (Cr,Ti,Nb)(Si,Al)2, two compositions were identified for the Nb rich disilicide, namely (Nb,Ti)(Si,Al)2 (62.1(0.5)Si-31.1(0.9)Nb-2.1(0.6)Ti-3.9(0.5)Al-0.9Cr) and (Nb,Ti,Cr)(Si,Al)2 (62(0.5)Si-26(1.1)Nb-5.6(0.8)Ti-2.3(0.4)Cr-4.1(0.5)Al. In the (Cr,Ti,Nb)6Si5 (45.3(0.2)Si-10.7(1.3)Nb-15.1(1)Ti-28.3(1.7)Cr-0.7Al) cracks were observed, its Cr concentration had increased to 28 at.% Cr and its Al content was practically negligible.
Figure 6.
BSE images of the microstructure of the alloy OHC5-HT, (a) cross section, ×200 (b) top, ×2000 and (c) bulk (×2500) of the button.
The chemical inhomogeneity in the (Nb,Ti)(Si,Al)2 compound was more evident in the top and bottom than in the bulk, and its darker contrast areas were Cr-rich. There was an increase of the volume fraction of (Nb,Ti,Cr)(Si,Al)2 and (Cr,Ti,Nb)6Si5. The concentration of transition metals in the latter had slightly changed compared with OHC5-AC. In the top of the button its Ti content was essentially fixed at 14 at.%, but in the bottom it was in the range 15.3 at.% to 17 at.%. The typical microstructure in the bulk of the heat treated button (Figure 6c) consisted of (Nb,Ti)(Si,Al)2 matrix with coarsened (Cr,Ti,Nb)6Si5 and a very low volume fraction of (Nb,Ti,Cr)(Si,Al)2.
4.3. Oxidation
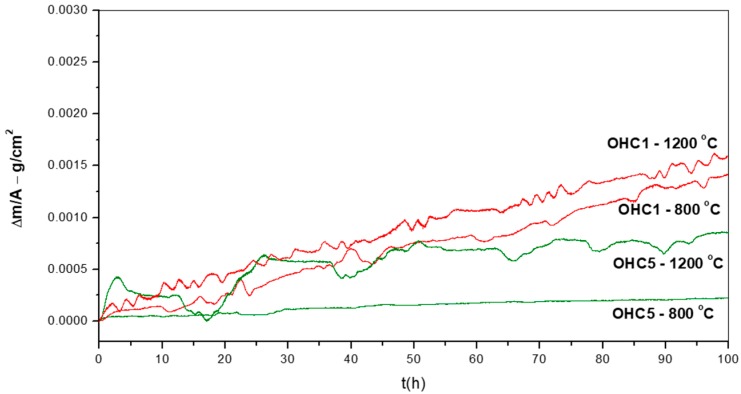
The TGA data was analysed using the equation ln(Δw) = lnK + nlnt, where and Δw is the weight change per unit area, K is the reaction rate constant that embodies the sum of reaction rates, Δm is the weight change, A is the surface area before exposure and t is the exposure time. This equation was used to determine the mechanism that controlled the oxidation. The oxidation kinetics are regarded as linear (n = 1), parabolic (n = 0.5), sub-parabolic or cubic (n ≤ 0.3). If there was more than one mechanism involved, the corresponding section was evaluated to determine the oxidation kinetics from the equation for linear oxidation and for parabolic oxidation, where kl is the linear rate constant and kp is the parabolic rate constant [41]. The oxidation data of the two alloys (Figure 7) is summarised in Table 1. The alloy OHC1 gained more weight than OHC5 (Table 1). Both alloys did not pest at 800 °C.
Figure 7.
Weight change versus time data for isothermal oxidation at 800 °C and 1200 °C of the alloys OHC1 and OHC5.
Table 1.
Total weight gain, n values and oxidation rate constants of the alloys OHC1 and OHC5 after isothermal oxidation at 800 °C and 1200 °C.
| Alloy and Temperature | n | kl (g·cm−2·s−1) | kp (g2·cm−4·s−1) | Weight Gain (mg/cm2) |
|---|---|---|---|---|
| OHC1-800 °C | 0.89 | 3.9 × 10⁻⁹ > 10 h | 5.47 × 10⁻¹³ (0–10 h) | 1.42 |
| OHC1-1200 °C | 0.68 | 3.74 × 10⁻⁹ > 40 h | 4.13 × 10⁻¹¹ (0–40 h) | 1.60 |
| OHC5-800 °C | 0.54 | - | 3.4 × 10⁻¹³ (0–1.3 h) 3.8 × 10⁻¹⁴ (1.3–24 h) 1.5 × 10⁻¹³ (>24 h) |
0.22 |
| OHC5-1200 °C | - | 4.4 × 10⁻⁸ (0–4.5 h) 2.1 × 10⁻⁸ (17–21.5 h) |
1.41 × 10⁻¹² (>21.5 h) | 0.85 |
OHC1-800 °C: The cubic specimen had retained its shape and had sharp edges; its surface was slightly lustrous with some greenish and golden tones. In the early stages of the oxidation and before the isothermal temperature was reached red rust like staining was found on the contact surface of the alumina crucible with the specimen and remained until the experiment was finished. This suggested that a chemical reaction of fast growing oxide(s) with alumina occurred at the beginning of the experiment but did not continue during the isothermal oxidation. The oxidation data gave n = 0.89, in the first 10 h the oxidation was parabolic and for the rest of the experiment linear (Table 1). Figure 7 shows repeated periods of weight loss after gain weight. The total time of weight loss was 19 h. The total time that the sample gained weight was 81 h of which 71 h was with linear and 10 h with parabolic oxidation kinetics. In the first 10 h the oxidation was parabolic. This was attributed to the formation of SiO2 (see below), which is the most protective oxide that this alloy could form. No oxide spallation was observed but there were some cracks on the surface of the scale. These cracks could have been caused by volume changes resulting from phase transformations due to the selective oxidation of the alloy’s components and/or stresses arising from the growth of oxide(s).
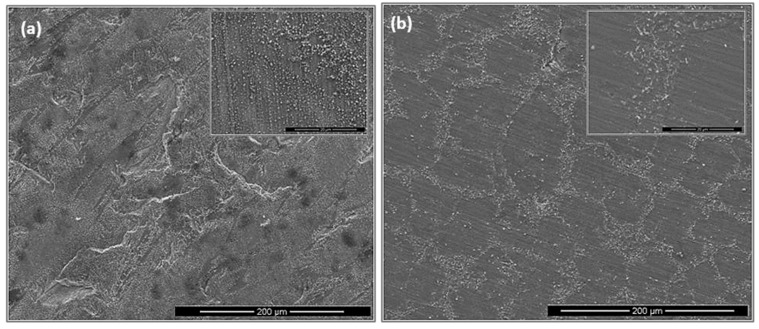
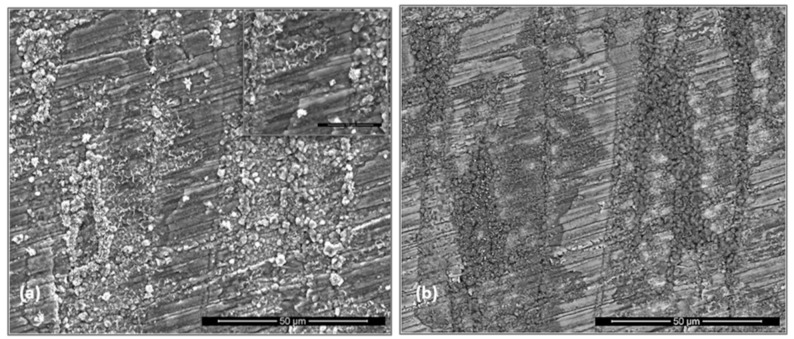
The scale was very thin, brittle and easy to spall off during sample preparation, which made difficult the characterization of cross sections. Figure 8 shows the scale on two sides (facets) of the cubic specimen after oxidation. On both sides an adherent and continuous scale were formed that consisted of a continuous glassy like layer, and regions with a dispersion of fine faceted particles (see inserts). Also, cavities were observed. The scale exhibited different characteristics in the two sides that were attributed to the orientation of the underlying phases in the alloy (substrate). One side of the specimen presented higher volume fraction of fine granular particles in the continuous glassy oxide over the TM6Si5 phase (Figure 8a) while the (Fe,Cr,Ti)Si phase was covered by the continuous glassy oxide layer (Figure 8a). The other side of the specimen (Figure 8b) shows the oxide that formed perpendicular to the dendrites of the (TM)6Si5 phase and had a lower volume fraction of the granular particles.
Figure 8.
SEM images of alloy OHC1 after isothermal oxidation in air at 800 °C for 100 h, scale (a) parallel, ×500 and (b) normal (×600) to the dendritic growth of the (TM)6Si5.
The scale over the (TM)6Si5 phase depended on the microsegregation of Fe in this phase (Figure 2). Indeed, the granular oxide formed on this phase was coarser in the Fe rich areas (edges). Some porosity also was observed in the scale in the centre of the (TM)6Si5 phase that could be attributed to oxide evaporation; these areas were richer in Nb, Cr and Ti (Figure 2). Black areas in Figure 8 were due to excess C deposition for sample preparation.
In the diffusion zone there was Si depletion in all the phases owing to the growth of SiO2. Near the substrate/scale interface this Si depletion was more noticeable leading to transformation(s) to phase(s) richer in transition metals. In the GXRD data (Figure 9a), some peaks from the alloy (substrate) were present. These were mainly from the FeSi2Ti and (TM)6Si5 phases. There were also peaks corresponding to the Fe5Si3 and Fe(α) phases. The latter were the result of phase transformation(s). The oxide peaks corresponded to SiO2 in the form of cristobalite (JCPDS 39-14250), (Cr,Fe)2O3 (JCPDS 02-1357) and TiO2 (rutile) (JCPDS 89-4920). According to the EDS data, (Ti,Cr)O2 and/or (Ti,Cr,Nb)O2 could be present in the scale depending on the composition of the underlying phase in the substrate.
Figure 9.
GXRD data of the scale formed on the alloys (a) OHC1 (θ = 1°) and (b) OHC5 (θ = 5°) at 800 °C.
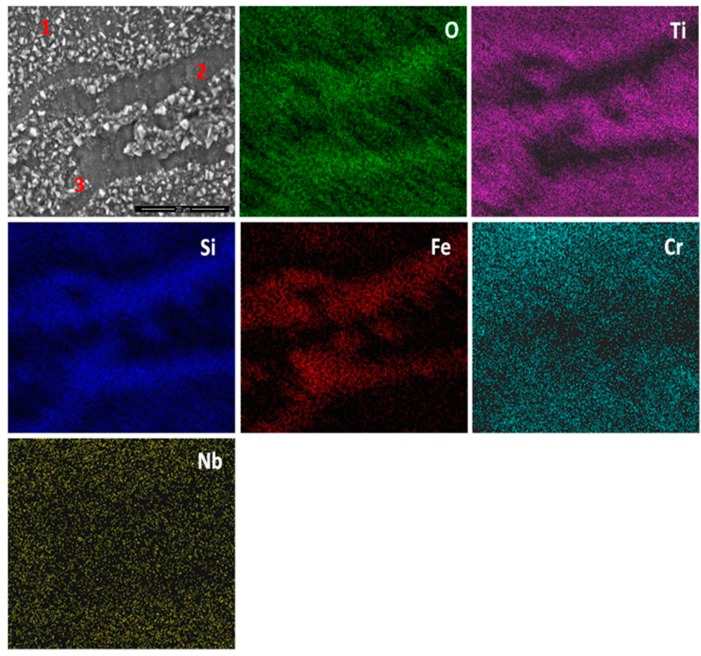
The elemental X-ray maps of the scale are shown in Figure 10. Considering the GXRD data in Figure 9a and the Figure 10, SiO2 and possibly some Fe2O3 formed over the (Fe,Cr,Ti)Si phase, coarse granular particles over the FeSi2Ti phase were composed of a Ti-rich oxide enriched by Cr, perhaps with some Si, and over the (TM)6Si5 some SiO2 formed together with Ti rich-oxide with some Cr and Nb enrichment and some (Cr,Fe)2O3 oxides.
Figure 10.
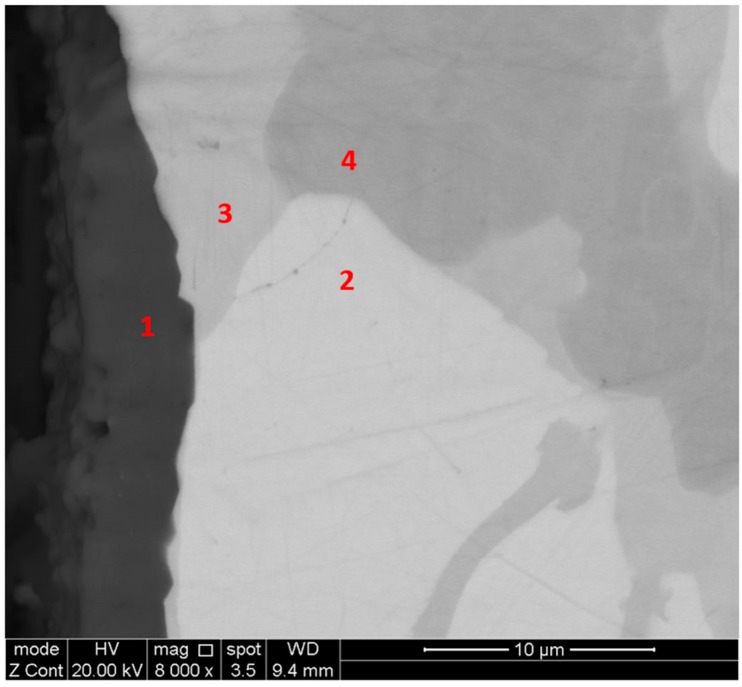
EDS X-ray elemental maps of the scale of the alloy OHC1 after isothermal oxidation at 800 °C for 100 h. BSE image ×4000. The EDS spectra of qualitative point analyses at 1, 2 and 3 were, respectively Si rich with Ti,Cr,Nb and Fe, Si rich with Fe and Cr, and Ti rich with Si.
The qualitative chemical analysis (Figure 10) confirmed that continuous SiO2 was present all over the alloy but at different volume fractions depending on the oxidised phase and the dominant oxide. This analysis was not conclusive because it also included data from phase(s) that were beneath the scale. The cross section shown in Figure 11a depicts the thickness of the scale and shows that there was a minimum alloy recession. There were some areas in the substrate/scale interface that showed cracks possibly due to embrittlement. The scale was composed of different oxides. The thickness of the scale was in the range 1 to 6 μm because of the different oxidation rates of the phases of this alloy. Figure 11b shows the scale integrity. While some areas were covered by a continuous oxide that enveloped granular particles, some other areas presented cavities in the substrate/scale interface (Figure 11c).
Figure 11.
SEM images of the cross section of the alloy OHC1 after isothermal oxidation at 800 °C for 100 h, (a) BSE, ×1000 and (b) SE (×12,000) images of the scale/metal interface, (c) SE image (×20,000) showing cavity and porosity in the scale.
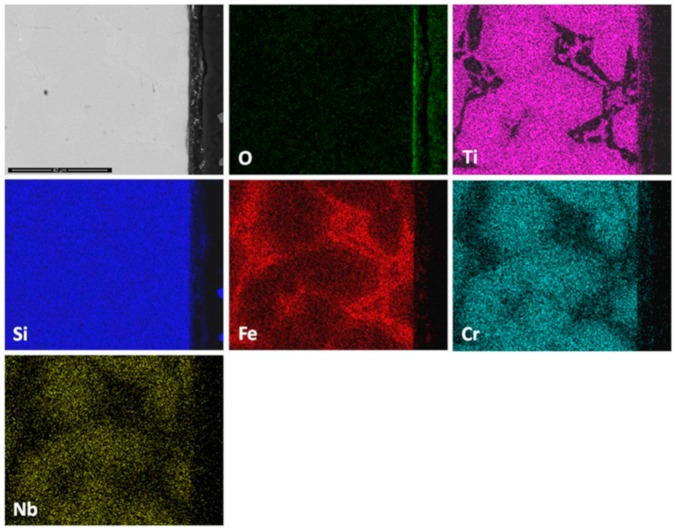
There was no evidence of internal oxidation in the alloy. In Figure 12 can be seen the facetted hexagonal cross section of (TM)6Si5 dendrites with edges defined by the (Fe,Cr,Ti)Si phase, and the latter surrounding the FeSi2Ti phase (Figure 3). The scale was Si rich and contained Ti, Fe and Cr. It is not easy to reproduce the contrast from the Si pixels in the Si map. The contrast of the phases did not change significantly near the substrate/scale interface, and the elemental X-ray map did not show changes in Si concentration. In the diffusion zone there was some Si depletion in all the phases due to oxidation that resulted to the (Fe,Cr,Ti)Si and FeSi2Ti compounds becoming richer in Fe. The Si depletion of the (Fe,Cr,Ti)Si led to the formation of Fe5Si3 and Fe(α) at the substrate/scale interface, and in the case of FeSi2Ti led to the formation of τ3 (Fe52Si36Ti12 or Fe4Si3Ti [42]) and Fe(α). There was also Si depletion from the (TM)6Si5, but not enough to trigger a phase transformation. The Si depletion at the substrate/scale interface and the mechanical damage to the SiO2 layer as a result of the development of strains from volume changes due to phase transformations could have led to further oxidation and the formation of mixed oxides. It is possible that within the scale more strains could arise as oxides with different volumes formed, and that further variations in chemistry affected their volume during growth.
Figure 12.
EDS X-ray elemental maps of a cross section of the alloy OHC1 after isothermal oxidation at 800 °C for 100 h, BSE image ×3500.
OHC5-800 °C: Figure 7 shows the isothermal oxidation data. There were three oxidation stages, the first lasted 1.3 h, the second 22.7 h and the third to the end of the experiment. The oxidation was parabolic (n = 0.54) and was composed of slightly different parabolic oxidation rates (Table 1) that could be attributed to the nature of the oxides and any phase transitions that could have occurred during oxidation. This behaviour could be associated with some type of transient oxidation in the first 24 h giving a slow growth scale that possibly cracked and spalled off before a more protective scale was stablished. Phase transitions and chemical reactions have been linked with changes of oxidation rate [43].
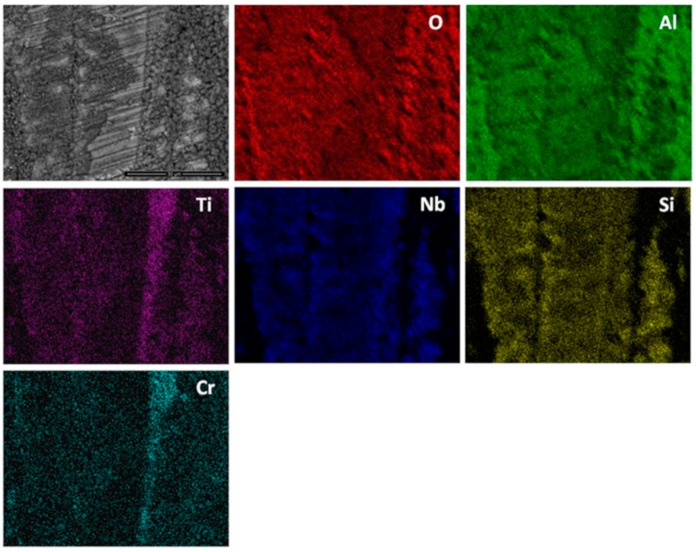
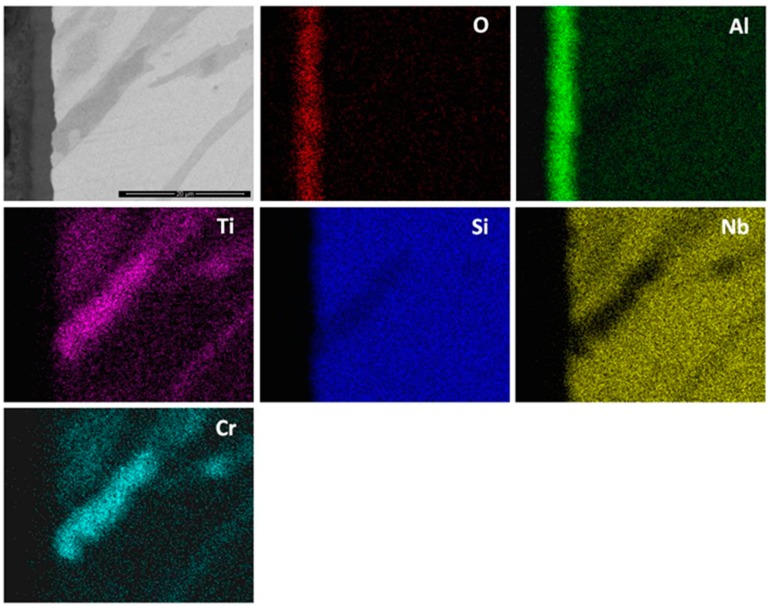
The cubic specimen remained intact with well-defined sharp edges; its surface was covered by a black oxide layer. An adherent scale had formed and different microstructures had resulted from the oxidation of the underlying phases in the substrate (Figure 13). The lumpy areas were composed of clusters of angular oxide particles, ridge network like areas were formed over the Al rich areas in the substrate, and thin, flat and continuous oxide was observed over the rest of the alloy giving bright contrast over the (Nb,Ti)(Si,Al)2 and grey contrast over the (Cr,Ti,Nb)6Si5 phases. The GXRD data in Figure 9b suggested that the scale consisted of α-Al2O3 (JCPDS No. 10-173), θ-Al2O3 (JCPDS No. 50-1496), quartz SiO2 (JCPDS No. 47-1144), and rutile TiO2 (JCPDS No. 21-1276). Rutile type complex oxides like (Ti(1−x−y),Crx,Nby)O2 could be present in the scale. Although the scale was mainly composed of Al and O, some strong signals from the transition metals were also visible. Figure 14 shows the Al2O3 in different regions and the regions where the Cr, Nb and Ti were the main components suggesting the formation of a scale of Al2O3 and some SiO2.
Figure 13.
SEM images of the scale formed on the alloy OHC5 after isothermal oxidation at 800 °C for 100 h, (a) SE image, ×2000 with insert at ×8000 (b) BSE image, ×2000.
Figure 14.
EDS X-ray elemental maps of the scale of the alloy OHC5 after isothermal oxidation at 800 °C for 100 h, BSE image ×4000.
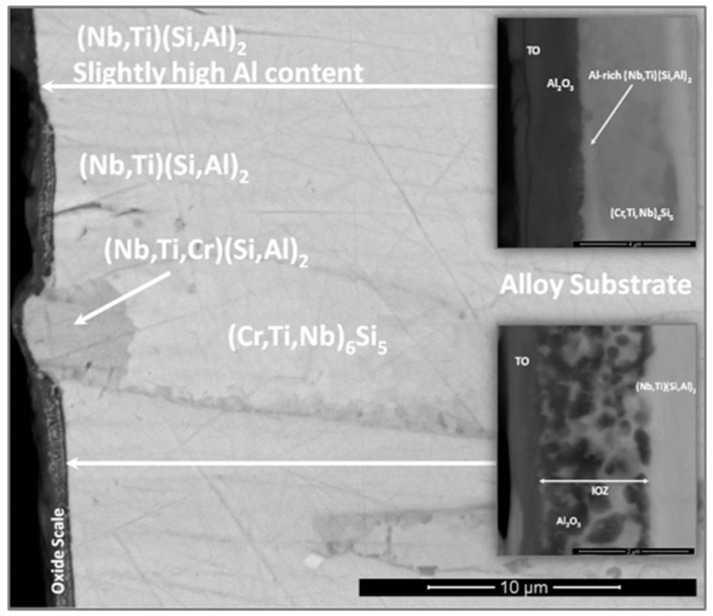
The thickness of the scale was in the range of 1 μm to 4 μm (Figure 15) and depended on the underlying phase. The scale that formed on top of the (Nb,Ti)(Si,Al)2 was characterised by two different microstructures, both presented a transition oxide (TO) at the oxide/gas interface, which, according to chemical analyses, was composed of all the components, one presented an internal oxidation zone (IOZ) composed of Al2O3 particles dispersed in the (Nb,Ti)(Si,Al)2 followed by a thin and continuous layer of Al2O3 at the scale/substrate interface, and another that did not present an IOZ but a continuous Al2O3 layer up to the substrate/scale interface. The latter was also slightly enriched in Al at grain boundaries, which is consistent with the microsegregation in the (Nb,Ti)(Si,Al)2 phase, that was richer and leaner in Ti, Al and Cr respectively at the grain boundaries and in the middle of the grains. The IOZ in the (Nb,Ti)(Si,Al)2 phase was formed in the areas where the Al content at the substrate/scale interface was below 3 at.% Al. The (Cr,Ti,Nb)(Si,Al)2 was detected in the ridges at the substrate/scale interface. The scale formed on top of these areas was thinner with high Al and Si content. The (Nb,Cr,Ti)6Si5 phase formed a very thin oxide (Figure 15).
Figure 15.
BSE images of a cross section of the alloy OHC5 after isothermal oxidation at 800 °C for 100 h. Main image, ×7000, top insert, ×30,000 and bottom insert, ×60,000.
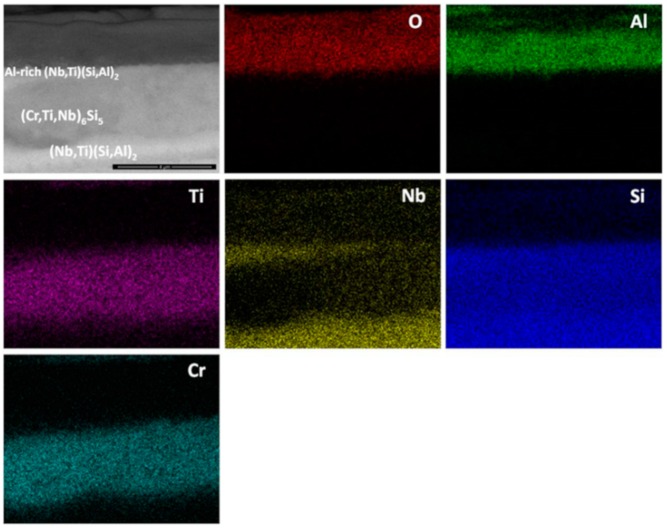
Al and O were the main components of the scale (Figure 16). Some Nb, Ti, Cr and Si were also found at the gas/oxide interface. Considering Figure 14 and Figure 16, it is possible to locate the rutile type oxides which were mostly found at the scale/gas interface with a significant Al2O3 content. In particular, Figure 16 shows that Al2O3 was the oxide that formed on top of the (Nb,Ti)(Si,Al)2 phase.
Figure 16.
EDS X-ray elemental maps of a cross section of the alloy OHC5 after isothermal oxidation at 800 °C for 100 h, BSE image ×30,000.
OHC1-1200 °C: Overall the oxidation was para-linear, as both parabolic and linear mechanisms had occurred [41]; in the first 40 h the oxidation was parabolic and after this time it changed to linear. It was not possible to get the n value. However, it was possible to evaluate the rate constants for different periods during the isothermal oxidation (Table 1). The oxidised specimen had retained its shape and had sharp edges. The scale had good adherence. Layering, voids and discontinuities were visible in the scale. The latter was mainly composed of agglomerated particles of Cr2O3 of different sizes that did not form a continuous scale, showing discontinuities, possibly as a result of oxide evaporation, porosity and cracks resulting from the formation of different oxides. The areas where SiO2 was formed with a glassy like appearance were mostly found at the grain boundaries between the (Fe,Cr,Ti)Si and FeSi2Ti phases.
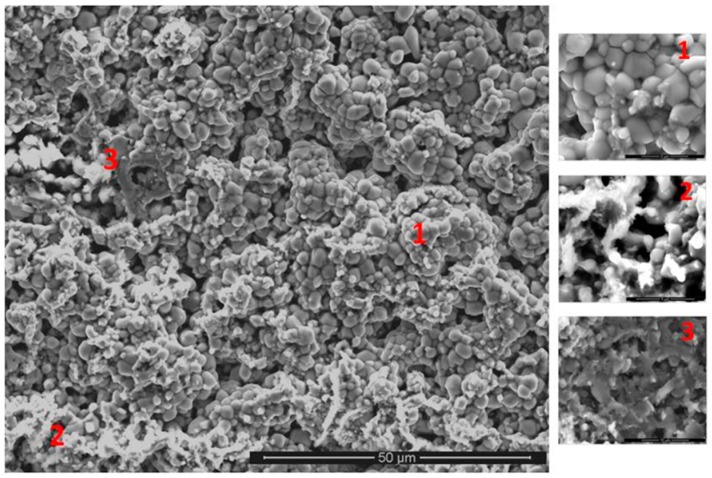
The GXRD data (Figure 17a) confirmed the presence of Cr2O3 (JCPDS 38-1479), at least two crystalline forms of SiO2 (cristobalite JCPDS 39-1425, and quartz JCPDS 70-2537), TiO2 (JCPDS 84-1284) and FeO (JCPDS 06-0615). Figure 18 shows the three typical morphologies of the oxides that composed the scale. The insert image 1 shows the regions composed of granular oxide particles with different sizes that formed on top of the (TM)6Si5 phase. These were present with a higher volume fraction. The regions that corresponded to the image 2 were found in contact with areas covered by finer particles of an oxide with a glassy appearance on the top. The insert image 3 is typical of some areas in which the microstructure looked more like a network formed by the melting of some oxide, this was mainly observed on top of the (Fe,Cr,Ti)Si phase.
Figure 17.
GXRD data of the scale formed on the alloys (a) OHC1 (θ = 10°) and (b) OHC5 (θ = 5°) at 1200 °C.
Figure 18.
SE images of the scale of the alloy OHC1 after isothermal oxidation at 1200 °C for 100 h, ×1500. In the right-hand side are shown the microstructures of different areas of the scale (1) ×8000, (2) ×16,000 and (3) ×20,000.
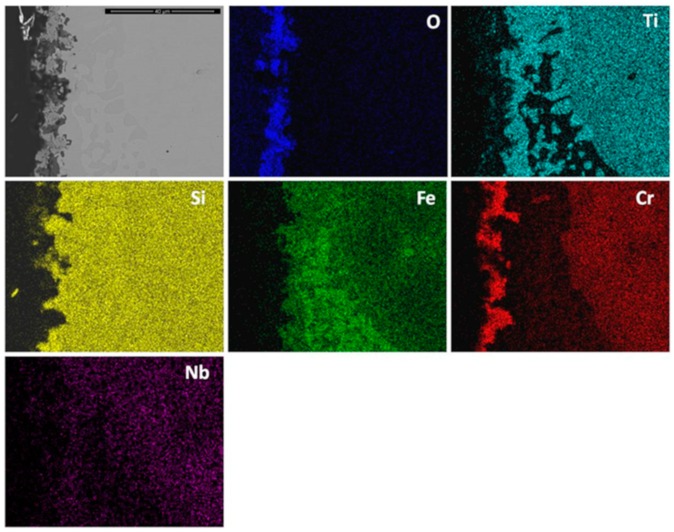
Cross sections of the scale showed that it was mainly composed of two layers, namely the Cr2O3 that was mostly found in the outer part of the scale and the SiO2 in the inner part (Figure 19). (Cr,Ti)2O3 was also found at the substrate/scale interface. In these areas there were some voids possibly due to metal transport through the scale. The substrate below the scale was composed of the FeSi2Ti and (Fe,Cr,Ti)Si phases, which would suggest that the (TM)6Si5 phase had transformed to FeSi2Ti when the Cr was preferentially oxidized and the (Fe,Cr,Ti)Si phase was oxidized and formed Si and Fe oxides. There was also evidence of internal oxidation with Si rich oxide particles distributed not randomly. The presence of Ti, Fe and Nb (if any) in the scale was weak (Figure 19), suggesting that Ti and Fe could be in solution in Cr2O3 (Fe2O3 and Cr2O3 have the same crystal structure). The Nb could be in solution in the TiO2 phase [5].
Figure 19.
EDS X-ray elemental maps of a cross section of the alloy OHC1 after isothermal oxidation at 1200 °C for 100 h, BSE image ×3500.
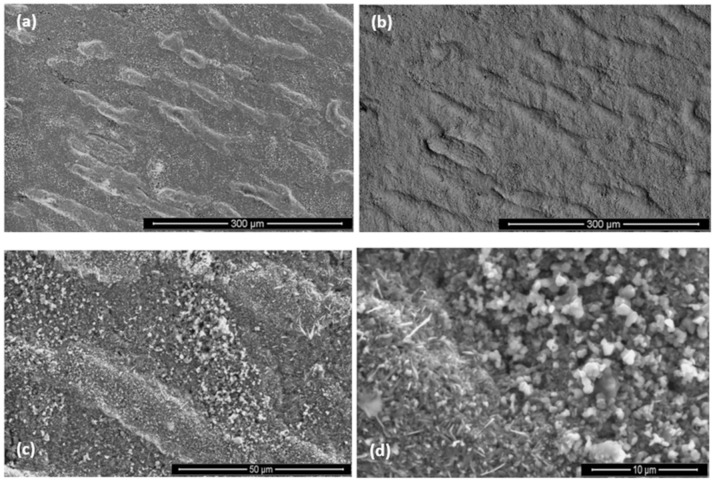
OHC5-1200 °C: The cubic specimen had remained intact with well-defined and sharp edges; its surface was covered by a light green colour scale. In the scale there was porosity (Figure 20a) and partial spallation that did not expose the substrate. There were also ridges on the scale surface. The scale spallation was mostly found next to oxide lumps. Figure 20b would suggest that the scale consisted of only one oxide, since an even contrast was observed under BSE imaging conditions. The secondary electron (SE) images in Figure 20c and d illustrate an adherent scale that was composed of a mixture of needle-like and facetted granular particles. Under BSE imaging these oxide particles did not show different contrasts. The GXRD data in Figure 17b suggested that the scale consisted of Al2O3 corundum (JCPDS 10-173). The different morphologies of the alumina particles in the scale could be the result of a sluggish transformation from some of its metastable forms. The corundum type of Al2O3 is the stable form above 1100 °C. However, it is possible that some trace amounts of transition aluminas could have been retained. The peaks from the substrate corresponded to the (Cr,Nb,Ti)6Si5 phase (JCPDS 54-0381).
Figure 20.
SEM images of the surface of the scale of the alloy OHC5 after isothermal oxidation at 1200 °C for 100 h, (a) SE image, ×200, (b) BSE image, ×200, (c) SE image, ×1000 and (d) SE image, ×3500.
As was the case for the oxidized alloy at 800 °C, the oxide lumps were located where the transformation from (Cr,Ti,Nb)(Si,Al)2 to (Nb,Ti,Cr)(Si,Al)2 had occurred. It is possible that this transformation influenced the size of the oxide particles, and resulted to a finer grain size in these areas compared with the rest of the alloy. Some scale spallation occurred mainly over the inter-dendritic areas. The excess of Al and Cr in such areas could promote a faster scale growth increasing the strain in the scale.
The scale was continuous and compact and its thickness was in the range 5 to 10 μm depending on the underlying phase (Figure 21). At 1200 °C only the (Nb,Ti)(Si,Al)2, (Nb,Ti,Cr)(Si,Al)2 and (Cr,Nb,Ti)6Si5 phases were stable. The scale over all the phases of the substrate was composed of Al and O (Figure 22). Even the (Cr,Nb)6Si5 phase with its low Al content was able to form some Al2O3. There was no significant Al depletion in the (Nb,Ti)(Si,Al)2 silicide, instead this phase was found to be richer in Al and Cr at the substrate/scale interface, possibly due to the dissolution of the (Cr,Ti,Nb)(Si,Al)2 phase. The grain boundary areas were richer in Al and Cr in the places where the (Cr,Ti,Nb)(Si,Al)2 phase could have dissolved and in these areas the (Cr,Nb,Ti)6Si5 phase was found to be richer in Cr by 63%. A thicker Al2O3 scale was also observed in these areas. This would suggest that the grain boundaries played an important role in the oxidation of the alloy OHC5 at this temperature.
Figure 21.
BSE image (×8000) of a cross section of the alloy OHC5 after isothermal oxidation at 1200 °C for 100h. The EDS qualitative analyses spectra for 1 to 4 indicated (1) Al2O3, (2) (Nb,Ti)(Si,Al)2, (3) (Nb,Ti,Cr)(Si,Al)2 and (4) (Nb,Cr,Ti)6Si5.
Figure 22.
BSE image (×6000) and EDS X-ray elemental maps of a cross section of the alloy OHC5 after isothermal oxidation at 1200 °C for 100 h.
5. Discussion
5.1. Microstructures
OHC1: In the top and bulk of OHC1-AC the T ((TM)6Si5), τ1 (FeSi2Ti) and (Fe,Cr,Ti)Si compounds were observed. The latter two were formed in-between the T phase dendrites, but it was not clear whether the τ1 (FeSi2Ti) was surrounded by the (Fe,Cr,Ti)Si, which would be consistent with a peritectic reaction, or formed lamellae next to the (Fe,Cr,Ti)Si, which would be consistent with the eutectic L → τ1 (FeSi2Ti) + (Fe,Cr,Ti)Si that was observed in the bottom and chill zone of the button (Figure 3b,c).
A peritectic reaction would explain some of the microstructures shown in the Figure 3a but not the peritectic reaction L + τ1 (FeSi2Ti) → FeSi + τ4 (Fe28.1Ti26.3Si45.6) suggested by Weitzer et al. [39] because the presence of the τ4 (Fe28.1Ti26.3Si45.6) was not confirmed by XRD. Some of the analyses that were designated to the T phase corresponded to the composition of the τ4 phase. It could be argued that, owing to the partitioning of solutes, some τ4 was actually present near the (Fe,Cr,Ti)Si. However, if the aforementioned peritectic reaction had occurred one would expect it to move towards completion upon heat treatment, which means that the size and volume fraction of the τ1 (FeSi2Ti) would decrease and the size and volume fraction of (Fe,Cr,Ti)Si would increase after the heat treatment. Exactly the opposite was observed.
In the Cr-Ti-Si system [40] the T phase is stable below 1565 °C and in the Fe-Ti-Si system [39] the τ1 (FeSi2Ti) is stable below 1532 °C and the FeSi below 1328 °C. Alloying the latter with Cr would be expected to increase only slightly the above temperature. The alloying with Ti would not raise the melting temperature of (Fe,Cr,Ti)Si above 1532 °C (in the Si rich region of the Fe-Ti-Si system the TiSi is stable below 1450 °C).
The formation of the T phase was accompanied by the partitioning of Fe and Cr, Nb and Ti. Iron was rejected into the melt, while the other elements partitioned in the solid, see Figure 2. Thus, as the T phase was formed the surrounding melt became richer in Fe and leaner in Cr, Nb and Ti. The τ1 (FeSi2Ti) + (Fe,Cr,Ti)Si eutectic that was formed in-between T phase dendrites was richer in Fe and lean in Nb, Ti and Cr compared with the alloy composition.
The formation sequence, in terms of decreasing temperature, of the intermetallic phases in OHC1-AC should be T, then τ1 (FeSi2Ti) and finally (Fe,Cr,Ti)Si. It is suggested that the solidification path was L → L + T → T + {τ1 + (Fe,Cr,Ti)Si}eutectic with a very small volume fraction of τ1 in the top and bulk of the button owing to the composition of the inter-dendritic melt relative to the eutectic composition. According to the data in [39], the solubility range of τ1 (FeSi2Ti) is very narrow, which could be another reason for its difficulty to form in the top and bulk of OHC1-AC. Indeed, the composition of this phase moved closer to the one reported by Weitzer et al. [39] after the heat treatment, owing to the partitioning of solutes in the microstructure.
In the areas near to the bottom and the chill zone of the button, the solidification path was essentially the same as described above but because the melt was richer in Fe and leaner in Cr, Nb and Ti (owing to the macrosegregation in OHC1-AC) the inter-dendritic melt was closer to the eutectic composition and thus the volume fraction of the eutectic was higher in these areas of the button.
In the T phase the partitioning of Ti and Cr was opposite to that of Fe (Figure 2), for the former two elements the partitioning coefficient koTM (TM = Cr, Ti) was greater than one and for Fe it was less than one. Use of the Scheil equation and the concentration profiles of Fe, Cr and Ti in Figure 2 gave koFe = 0.522, koCr = 1.482 and koTi = 1.267. The Ti concentration in (Fe,Cr,Ti)Si was in agreement with Weitzer et al. [39] who reported that the solubility of Ti in FeSi is about 1 at%.
OHC5: In this alloy there was macrosegregation of Al, Cr, Nb, Si and Ti with different profiles of Nb and Si compared with Al, Cr and Ti, and also there was microsegregation, particularly in the (Cr,Ti,Nb)(Si,Al)2 and (Cr,Ti,Nb)6Si5 compounds. The (Nb,Ti)(Si,Al)2 was formed at the highest volume fraction and the other intermetallics and solid solutions formed from the liquid between the (Nb,Ti)(Si,Al)2 grains. Considering the crystal structures of the binary disilicides NbSi2, CrSi2 and TiSi2 (see Section 2), the former two could form a continuous solution phase. Nakano et al. [44] suggested that very small substitutions of Nb and Si by Ti and Al in NbSi2 (with up to 1.7 at.% Ti substituting Nb and up to 2 at.% Al substituting Si) would stabilize the C54 crystal structure. This was not confirmed by our results. Indeed, the TiSi2 was not detected in OHC5-AC and OHC5-HT by EDS and XRD. However, the CrSi2 was confirmed by XRD (Figure 1) and its Nb, Ti and Al contents were up to 6 at.%, 12.3 at.% and 10 at.%, respectively. The solubility of these elements in the CrSi2 based (Cr,Ti,Nb)(Si,Al)2 was in agreement with the solubilities reported in the Ti-Cr-Si and Cr-Si-Al ternary systems [40,45].
The ranking of the unalloyed disilicides according to their melting temperatures is TmNbSi2 = 1935 °C, TmTiSi2 = 1480 °C and TmCrSi2 = 1450 °C [19]. The melting temperature of (TM)6Si5 is higher than 1500 °C (see above). Thus, it would be expected that the primary phase to form from the melt was the intermetallic based on NbSi2, namely the (Nb,Ti)(Si,Al)2 followed by the (TM)6Si5 and then the (Cr,Ti,Nb)(Si,Al)2 and finally the solid solutions of Si and Al. The primary (Nb,Ti)(Si,Al)2 phase formation is supported by the Nb-Cr-Si liquidus projection [46] when the alloy is considered as Cr-(Nb,Ti)-(Si,Al). The formation of the (TM)6Si5 after the aforementioned primary phase is also in agreement with the liquidus projection. Thus, the solidification path of the alloy OHC5-AC was L →L + (Nb,Ti)(Si,Al)2 →L + (Nb,Ti)(Si,Al)2 + (TM)6Si5 → L + (Nb,Ti)(Si,Al)2 + (TM)6Si5 + (Cr,Ti,Nb)(Si,Al)2 → (Nb,Ti)(Si,Al)2 + (TM)6Si5 + (Cr,Ti,Nb)(Si,Al)2 + (Si)ss or (Al)ss (depending on the solidification conditions and the composition of the last to solidify melt).
After the heat treatment the (Cr,Ti,Nb)(Si,Al)2 and the (Al)ss and (Si)ss were not stable and the Cr concentration in the TM6Si5 silicide had increased significantly. The former is in agreement with the 1500 °C isothermal section of Cr-Nb-Si [46] when the heat treated alloy is considered as Cr-(Nb,Ti)-(Si,Al) and the latter is attributed to the dissolution of the (Cr,Ti,Nb)(Si,Al)2.
5.2. Oxidation
OHC1-800 °C: The alloy did not pest. The scale was composed of SiO2, TiO2 and (Cr,Fe)2O3. In the substrate below the scale α-Fe, τ3 (Fe40Si31Ti13) and Fe5Si3 were formed owing to the depletion of the elements that formed the oxides in the scale. The location of the oxides in the scale was linked with the underlying phases in the substrate. The microsegregation in the (TM)6Si5 (Figure 2) affected its oxidation. On top of the (TM)6Si5 grains the scale was composed of fine granular particles of TiO2 engulfed by SiO2. The TiO2 contained other elements that were in solution in the (TM)6Si5 (Figure 10); the Cr and Nb concentrations were higher in the centre of the grains and gave the rutile type structure (Ti,Cr,Nb)O2 oxide while over the Fe-rich edges of the (TM)6Si5 no Fe was observed in the oxide owing to the low solubility of Fe in the TiO2. The low solubilities of Fe and Cr in TiO2, respectively about 1 at.% and 4 at.% [47,48], and the fact that Fe can be transported through SiO2 towards the surface of the scale [49] suggested that some (Cr,Fe)2O3 + TiO2 could have formed on top of the Fe-rich areas of the (TM)6Si5 compound.
The same oxidation behaviour was observed along (TM)6Si5 dendrites but in this case the TiO2 particles were coarser. The EDS analysis of cross sections of the interface of (TM)6Si5 with the scale showed a depletion of about 3.5 at.% Si and 2.5 at.% Ti at the substrate/scale interface. Considering the above, and the fact that the volume fraction of (TM)6Si5 was the highest in the alloy, GXRD was performed at different angles to search for other phases. None was found.
The X-ray maps (Figure 10) showed Si, Fe and O over the (Fe,Cr,Ti)Si compound. Fe-Si alloys form a sequence of oxide layers depending on their Si content. At low Si concentrations FeO forms next to the bare metal, and engulfs a dispersion of Fe2SiO4 particles, then follows a layer of Fe3O4, and finally a layer of Fe2O3 is formed as the outermost layer. Some internal oxidation of Si has been observed in these alloys [50]. A reduction in the volume fraction of Fe oxides was found in the scale formed on Fe-Si alloys with high Si content in which an inner layer of SiO2 and an outer layer of Fe2O3 were observed [49]. Considering the high Si content of the (Fe,Cr,Ti)Si phase, the latter would be expected to form an inner SiO2 layer and Fe2O3 as the top oxide at 800 °C. It is suggested that these two oxides were formed over the (Fe,Cr,Ti)Si phase since they were confirmed by GXRD (Figure 9a) and Fe, Si and O were present over the (Fe,Cr,Ti)Si phase in the X-ray maps (Figure 10). The EDS analyses revealed that there was mainly Si depletion from the (Fe,Cr,Ti)Si phase that caused the formation of consecutive layers of Fe5Si3 and α-Fe underneath the scale. The Si depletion was the result of the formation of the SiO2 layer. The α-Fe was found at the substrate/scale interface with Si and Cr contents, respectively 17.3 at.% and 3.7 at.%. According to Adachi and Meier [49], this Si concentration is enough to form a continuous SiO2 film over this phase. However, they also found some Fe2O3 at the scale/gas interface that was attributed to Fe transport through the SiO2 layer to form Fe2O3. It is likely that a thin film of (Fe,Cr)2O3 formed on top of the SiO2 that formed on the (Fe,Cr,Ti)Si phase.
The X-ray maps (Figure 10) showed that on the FeSi2Ti phase mainly formed coarse grains of TiO2. This is in agreement with the depletion of Ti and Si near the substrate/scale interface and the formation of the τ3 (Fe40Si31Ti13) and α-Fe below the scale. The τ3 phase was not detected by the GXRD for all the studied glancing angles because the volume fraction of the FeSi2Ti phase in the alloy was the lowest.
A comparison of our results with the oxidation of Si-rich Ti containing silicides is reasonable since on the FeSi2Ti phase only TiO2 and SiO2 formed. According to Kofstad [41], the Ti oxidizes more rapidly than Si, thus it is possible that at 800 °C the mobility of metal ions to the surface of this phase was higher that the mobility of Si and this caused the formation of coarse granular TiO2 engulfed by a glassy-like SiO2 network, see Figure 10. The EDS spectrum (not shown) for point 3 in Figure 10 showed the analysis to be rich in Ti, Si, O and N. In the GXRD diffractograms no nitride peaks were found. However, it is possible that in the earliest stage of oxidation both Ti nitride and TiO2 formed, and the N was then released and reacted again with the silicide or trapped under the scale [51,52]. This could explain the formation of pores and cavities beneath and across the scale (Figure 11). The high Fe content of the complex silicides could have increased the mobility of Ti to the surface because coarse grains of TiO2 were observed on top of the FeSi2Ti phase and the same was observed near the grain boundaries of the (TM)6Si5 phase, where the Fe content was the highest (Figure 10).
There was some oxidation of the sample before the isothermal oxidation temperature was reached. Some uneven reddish mark was observed on the crucible. It is likely that Fe oxides had reacted with the alumina crucible. The Fe2O3 has a red colour and the XRD data confirmed the presence of this oxide in the scale. It is unlikely that the reaction with the alumina crucible contributed to the isothermal oxidation because the initial staining on the crucible did not change with time.
The oxidation data (Figure 7) showed a parabolic weight gain in the first ten hours (Table 1). This may be attributed to the formation of SiO2 for which oxidation rates about 10−13 g−2cm−4s−1 at 800 °C and about 10−12 g−2cm−4s−1 at 950 °C have been reported. The predominant oxidation behaviour was linear after the first 10 h. It is not clear why this was the case, as no oxide spallation was observed, and evaporation of CrO3 (in dry conditions) is not expected at this temperature. No significant Cr depletion at the substrate/scale interface was found and there was no extensive Cr2O3 formation in the scale. It is possible, however, that time-dependent structural changes occurred in the scale that resulted in a linear rate even though diffusion controlled the oxidation. The oxidation of Ti above 700 °C first follows parabolic kinetics (due to oxygen dissolution in the base metal) then changes to linear (after TiO0.35 forms as an outer layer where O diffusion is faster) due to a change in the diffusion controlling oxidation mechanism [53]. Moreover, in the temperature range 800–1000 °C, the growth of TiO2 scales is characterised by the diffusion of Ti in the inner layer and by the diffusion of oxygen in the outer layer, which creates stress and cracks. TiO2 formed at a high volume fraction in the scale, thus it is suggested those changes in the oxidation behaviour of Ti could have had strong influence in the overall oxidation of the alloy.
The coarsening of oxides in the scale could also have been a factor that had an effect on the oxidation behaviour of this alloy. The growth of different oxides of different volumes would give rise to internal stresses and strains in the scale. The strain was released by cracking the scale, thus exposing the substrate to further oxidation. Besides, the depletion of some elements in the alloy near the scale/substrate interface due to oxidation could lead to a phase transformation in these regions, increasing the mismatch at the interphase interfaces, and resulting in strains that changed the adhesion of the scale at the scale/substrate interface.
OHC5-800 °C: The alloy did not pest, instead it followed parabolic oxidation kinetics with n = 0.54 (Table 1) and formed a very thin adherent scale that mainly consisted of Al2O3. The EDS and GXRD suggested that SiO2 and rutile type oxides (Ti(1−x−y),Crx,Nby)O2 were also present in the scale. These did not appear to be detrimental to the oxidation resistance of the alloy. Oxides with different morphology and composition (Figure 13 and Figure 14) formed in the scale, which would suggest that it is likely that the oxidation of phase(s) was influenced by their chemical inhomogeneity.
The phases that were present in the alloy oxidised differently forming a scale of uneven thickness (1–4 μm), Figure 15. The thinner scale was formed on the (Cr,Nb,Ti)6Si5. The thickness of the scale formed on the (Nb,Ti)(Si,Al)2 depended on its Al content, was thinner in those areas where the Al content was above 3 at. % while in the areas with a low Al content (less than 3 at.%) an IOZ formed. In this context not only the scale thickness was affected by the Al content in the (Nb,Ti)(Si,Al)2 but also the oxidation mechanism since the development of a different microstructure in the scale was seen (Figure 15). It is highly likely that the local composition of this phase dramatically affected its oxidation. Chemical analyses showed that in areas of Al lean (Nb,Ti)(Si,Al)2, the scale consisted of an external layer of transient complex oxides which might not be protective. Thus, Al was possibly internally oxidised until a continuous Al2O3 layer formed below the IOZ hindering further oxidation. According to Meier and Petit [54], alloys with low solute contents oxidise by inner diffusion of oxygen. On the other hand, near the (Nb,Ti)(Si,Al)2 grain boundaries (Al-rich areas) the activity of Al and Si was higher and a scale formed that consisted of an outer layer (transient oxides) mainly composed of Al and Si and an inner layer very rich in Al. The ridges (lumps) at the substrate/scale interface were related to the (Cr,Ti,Nb)(Si,Al)2 phase but it is not clear if they had formed as a result of the substrate recession presented by the (Nb,Ti)(Si,Al)2 phase (internally oxidised), or by coarsening caused by the loss of Al and Cr from the (Nb,Ti)(Si,Al)2 phase or by both phenomena.
Thus, considering the microstructure of the scale, it is suggested that the oxidation of (Nb,Ti)(Si,Al)2 depended on the availability of Al with about 3 at.% Al possibly being the critical content (in the presence of Ti and Cr). Aluminium contents below the critical one would promote a faster inward diffusion of oxygen oxidising Al preferentially inside the phase. This mechanism is consistent with a parabolic behaviour. Above 3 at.% Al, the (Nb,Ti)(Si,Al)2 would form an external oxide. The X-ray elemental maps showed Al, O, Nb and Si as the main components of the scale.
It was expected to find Nb and Si oxides from the oxidation of the (Nb,Ti)(Si,Al)2 phase, as it was observed by Zhang et al. [55] and Murakami et al. [56]. The data from our work suggests that the scale formed on this phase was mainly composed of Al2O3 and that Si and Nb presented a minor contribution but with the same 1:2 ratio as in the NbSi2 phase, which suggests that their oxidation in those areas is unlikely to have occurred. Thus, it is proposed that the internal oxidation started from an initial oxidation of all the components where complex rutile oxides with different compositions formed along with SiO2 and Al2O3, the rutile type oxides could have served as a pathway allowing the inward diffusion of oxygen that reacted with Al (not being sufficient to establish a continuous Al2O3 layer). The scale/substrate interface receded up to an Al2O3 compact layer that was established below the IOZ. The increase of the oxidation rate could be related to a rapid Al transport through the scale. According to Prescott and Graham [57] θ-Al2O3 presents a faster Al transport. However, preferential orientation could also influence the Al diffusion towards the substrate/scale interface.
The thickness of the scale formed on top of the (Nb,Ti)(Si,Al)2 compound was dependent on the Cr concentration, as the latter affects the Al activity. It is known that the addition of Cr reduces the concentration of Al required to grow and sustain an alumina scale in Ni-Cr-Al and Fe-Cr-Al alloys during oxidation. Previous studies have shown that a mixed oxide composed by SiO2 and Nb2O5 formed at 750 °C when 8 at.% Cr was added to NbSi2, while the addition of 20 at.% Cr improved the oxidation behaviour via the formation of a scale composed by an inner layer of SiO2 and an outer layer of Cr2O3. The underlying substrate alloy was depleted in Cr [58]. According to Murakami et al. [59], a thin SiO2 layer was formed on Nb-66.7Si alloys with 10 at.%, 20 at.%, 33.3 at.% Cr additions after oxidation in flowing air at 750 °C. Al additions may not have a beneficial effect on the oxidation of NbSi2 at low temperature. The Nb-56Si-11Al alloy exhibited scale spallation when it was exposed to dry air at 750 °C [56]. The alloys Nb-56Si-11Al-3Cr (Cr-doped alloy) and Nb-48Si-19Al-29Cr (Cr-rich alloy) showed very good oxidation resistance at low temperature but the Cr doped alloy had very good oxidation resistance in the range of 500 °C to 1400 °C, and the Cr-rich alloy had very poor oxidation resistance at high temperatures [56].
Based on the microstructure observed in the scale/substrate interface, it is suggested that the (Cr,Ti,Nb)(Si,Al)2 compound presented higher Al and Si activities that made possible the formation of an outer SiO2 +Al2O3 scale, and an inner layer of Al2O3.
The EDS analysis of the oxidation products of the (Nb,Cr,Ti)6Si5 phase was limited owing to the very thin scale that formed on top of this phase. Images of the scale surface suggested that the oxidation products were complex rutile type oxides, SiO2 and some Al2O3. EDS analyses of the (Nb,Ti)(Si,Al)2 at the substrate/scale interface did not reveal elemental depletion, especially of Al, which was actually slightly enriched at the substrate/scale interface. Murakami et al. [59] observed a similar behaviour in the alloy Nb-47Si-20Al with the Nb3Si5Al2 phase as the matrix. The (Cr,Ti,Nb)(Si,Al)2 compound presented some Al depletion of about 50% less of the initial Al content. There is no data to compare with the (Nb,Cr,Ti)6Si5 phase.
The α-Al2O3 is not expected to form at 800 °C. However, the GXRD indicated its presence. The EDS analyses of the scale showed that there were two microstructures in the areas that were Al and O rich, one consisting of spherical clusters of angular particles which were mostly located in the Al rich areas of the alloy, and ridge networks that spread over the Al-rich areas of the (Nb,Ti)(Si,Al)2 phase. According to Brumm and Grabke [43], the ridge network microstructure is related to the transformation of θ-Al2O3 to α-Al2O3. If this transformation had occurred, the oxidation rate should have decreased. Instead it increased, which suggests that another contribution to the formation of less protective oxides influenced the slight increase of the oxidation rate. Thus, the above could suggest that Cr promoted a faster stabilization of α-Al2O3 at the scale/substrate interface, while at the scale/gas interface θ-Al2O3 whiskers were formed. Cr promotes the transformation of θ-Al2O3 to α-Al2O3 [43]. The oxide surface formed over some Al-rich areas in the alloy presented a network-like structure Al2O3 that extended over the scale of (Nb,Ti)(Si,Al)2, which suggests a lateral growth that had resulted from the transformation of θ-Al2O3 to α-Al2O3.
The oxidation of the alloy OHC5 was different from those of Nb-Si-Al based alloys reported in the literature. Although the Nb-Al-Si-Cr alloys studied by Murakami et al. [59] did not suffer from pest oxidation at 750 °C and followed parabolic oxidation, they did not form Al2O3 at low temperature, instead mixed oxides of all the components were formed. This would suggest that the presence of Ti in the alloy OHC5 was beneficial for the establishment of an Al2O3 oxide scale on top of the (Nb,Ti)(Si,Al)2 and (Cr,Ti,Nb)(Si,Al)2 phases, and that the rutile type oxides were not detrimental at 800 °C.
OHC1-1200 °C: The alloy showed para-linear oxidation kinetics (Table 1). According to the EDS and GXRD data, the scale was composed of the Cr2O3, SiO2 and TiO2 oxides. The Cr2O3 was the predominant oxide in the scale. The composition of this oxide was affected by the composition of the (TM)6Si5 phase and its different Ti, Fe and Cr contents (Figure 2). The Fe2O3 and Cr2O3 oxides with rhombohedral crystal structure show a continuous series of solid solutions in the Fe-Cr-O ternary system. The Fe2O3, Cr2O3 and Ti2O3 are isostructural, thus it is not surprising to find different ranges of solubility according to the availability of Fe, Cr and Ti in the (TM)6Si5. The oxidation of the complex silicide (Ti,Fe,Cr)7Si6 was reported by Portebois et al. [60]. Its oxidation products were similar to those formed on the (TM)6Si5 in OHC1 at 1200 °C except for the formation of Cr2TiO5 which seems not to be in equilibrium with Cr2O3 below 1660 °C [61].
According to Kosftad [62], during the growth of Cr2O3 internal strains arise in the scale as a result of oxygen and Cr transport through the scale with the Cr diffusion being much faster than that of the O. The Cr2O3 layer presented a granular morphology. It is likely that grain boundaries allowed the transport of oxygen further in the alloy to oxidize the FeSi2Ti and form SiO2 and some TiO2 at this temperature. This would explain why the SiO2 was mainly found below the Cr2O3. Some areas of the scale were still in contact with the Cr2O3 layer. The protectiveness of the scale formed on the alloy OHC1 would rely on the establishment of a more continuous SiO2 layer underneath the Cr2O3 that could act as a barrier for further metal and oxygen transport.
The thickness of the scale was in the range 10 to 30 μm. The Cr2O3 was mostly found in the outermost layer, and the SiO2 in the inner part of the scale. The distribution of these oxides in the scale was irregular and was the reason for the variation in thickness. The scale was adherent, but could not be considered as protective. Cr2O3 in the scale has been linked with para-linear oxidation at high temperatures [50].
The insert number 1 in the Figure 18 shows coarse and fine grains of Cr2O3 in the top of the scale where the oxygen partial pressure was higher than at the scale/substrate interface. The para-linear behaviour is attributed to the fact that Cr2O3 can be further oxidised at high oxygen pressures and high temperatures to form CrO3, which is volatile at 1200 °C. It is likely that the mixture of coarse and fine grained Cr2O3 in the scale was the result of the reaction Cr2O3 (s) + 3/2 O2 (g) = 2 CrO3 (g), which could be responsible for the change in the oxidation of this alloy from parabolic to linear after 40 h at 1200 °C. According to Kofstad [41], the oxidation of Cr2O3 into CrO3 is enhanced as the thickness of Cr2O3 increases. The EDS analyses performed on Cr2O3 at different distances from the scale/substrate interface showed some Ti and Fe in solution in this oxide.
The insert number 2 in Figure 18 shows an oxide with a glassy-like appearance. Qualitative EDS showed that this was SiO2. These areas were mostly observed on top of the FeSi2Ti phase in the underlying microstructure. As was the case for the oxidation of this phase at 800 °C, TiO2 and SiO2 were its oxidation products. The EDS showed some Ti dissolved in the SiO2. The GXRD showed peaks that corresponded to TiO2. Becker et al. [63] suggested that the solubility of TiO2 in SiO2 is increased with temperature. This would be the reason why it was possible to find TiO2 dissolved in SiO2 instead of coarse particles of TiO2 dispersed in a SiO2 network. Despite the high Fe content of the FeSi2Ti phase, no Fe oxides were detected. This was attributed to the preferential oxidation of Si and Ti, and is in agreement with Tsirlin et al. [64]. One of the possible reasons for this behaviour is that the low Fe solubility in TiO2 allowed a mixture of TiO2 and SiO2 to be stabilised at 1200 °C. Indeed, according to Wittke [47] the solid solubility of Fe in TiO2 is about 1 at.% in the range of 800 °C to 1200 °C.
Oxide melting could be responsible for the network-like oxide microstructure observed in the insert number 3 in Figure 18. This feature was observed on the oxide formed on top of the (Fe,Cr,Ti)Si phase. It is suggested that this melting could be the result of the eutectic reaction L → FeO + Cr2O3 + SiO2 at 1155 °C reported by Kainarskii and Degtyareva [65]. EDS analyses from this area confirmed the presence of Si, Cr and some Fe and thus it is possible that some FeO formed. Its volume fraction could have been low to be detected by GXRD but enough to react with the SiO2 and Cr2O3 that were the dominant oxides.
In the cross sections of the substrate/scale interface voids were observed in the (Fe,Cr,Ti)Si phase and some Cr depletion in the substrate underneath the scale. The solid solutions formed by Fe2O3-Cr2O3 are converted at high temperatures to the ternary FeO-Fe2O3-Cr2O3 by the dissociation of Fe2O3 [65]. According to the Fe-Cr-O system, at 1200 °C the FeO dissolves Cr before some spinels are stabilized. Thus, if FeO was formed this could suggest that this phase could transport some Cr towards the oxide surface. There was some Cr in the SiO2 that formed on top of the (Fe,Cr,Ti)Si phase, which would suggest that there was some Cr transport from the substrate/scale interface towards the oxide/scale surface through the SiO2 network. The diffusion zone beneath the scale was 30–40 μm thick.
It is likely that the oxidation of this alloy in the first 40 hours at 1200 °C involved the formation of Cr2O3 layer along with SiO2 layer underneath and some evaporation of CrO3. When the Cr2O3 reached a certain thickness the CrO3 evaporation became more important leading to a change in oxidation from parabolic to linear. There should have also been some contribution to the oxidation kinetics from the other minor oxides that were formed in the scale at this temperature. The overall oxidation could be considered as para-linear even though n = 0.68 (Table 1). According to Kosftad [62], para-linear oxidation occurs when a compact and protective scale forms at the scale/gas interface and becomes non-protective owing to the formation of pores caused by oxide evaporation. Then the oxidation kinetics changes from parabolic to linear.
OHC5-1200 °C: The EDS and GXRD data indicated that the scale was composed of α-Al2O3, see Figure 20b, the analysis for number (1) in Figure 21 and the aluminium and oxygen X-ray maps in Figure 22. All the phases in the alloy must had contributed to α-Al2O3 formation at 1200 °C including the (Nb,Cr,Ti)6Si5 that had very low Al solubility. Figure 7 would suggest that initially some transient oxides might have had also formed.
As it is often observed in alumina scales, the Al2O3 scale formed on the alloy OHC5 had uneven thickness, oxide lumps and lace-like ridges. The growth of Al2O3 ridges is the result of the transformation of transient alumina(s) to α-Al2O3. According to Prescott et al. [66], the transformation of transient alumina to α-Al2O3 starts and grows laterally until grain boundaries meet. The last areas to convert to α-Al2O3 are the grain boundaries where ridges form as a result of the outward diffusion of Al ions thickening the oxide formed at the grain boundaries. On the oxide surface there were particles with the same composition but different morphologies, which would suggest that some deformation that resulted from the build-up of compressive stress from the oxide growth had affected the supply of Al and O for the continuous growth of Al2O3. Grain orientation and the composition of the oxidised phase may have also contributed to the different morphology presented by the Al2O3 particles. The cross sections showed that the scale was continuous and adherent and presented the classical morphology of a α-Al2O3 scale with coarsened grains at the substrate/scale interface.
5.3. Comparison with Alumina Scale Forming Nb-Ti-Si-Al-Hf Alloys and Nb-Silicide Based Alloys
The alloys OHC1 and OHC5 are shown in the maps of the parameters VEC, Δχ and δ in Figure 23 where the Nb-Ti-Si-Al-Hf alloys studied in [2,3] are included. The data for the Zone A in the alloy MG7, where a “layered” microstructure was observed, is included in the Figure 23c,d. The correlations are remarkably good in the Δχ versus VEC and δ versus VEC maps respectively in the Figure 23a,b. When the data for Zone A is included, the correlations are also good, particularly in the Δχ versus δ map in Figure 23c. The δ versus VEC map in Figure 23d indicates the scales formed at 800 °C and 1200 °C and the non-pesting behaviour at 800 °C.
Figure 23.
(a) Δχ versus VEC and (b) δ versus VEC maps without data for Zone A of the alloy MG7, (c) Δχ versus δ and (d) δ versus VEC maps with data for Zone A of the alloy MG7. Types of scale formed at 800 and 1200 °C are shown in (d). Colours: OHC1 (red), OHC5 (green), Zone A MG7 [2] (purple), MG5, MG6, MG7 [3] (blue).
The VEC, Δχ and δ values of the alloys OHC1 and OHC5 are compared with those of Nb-silicide based alloys [67] and the Nb-Ti-Si-Al-Hf alloys MG5, MG6 and MG7 [2,3] in Table 2. The two alloys of this study had Δχ and δ within the range of Nb-silicide based alloys, as was the case for the MG series of alloys, and their VEC values were lower and higher than the Nb-silicide based alloys. Furthermore, the VEC values of the non pesting and alumina forming alloy OHC5 were lower than those of Nb-silicide based alloys, like the VEC values of the non pesting and alumina forming Nb-Ti-Si-Al-Hf alloys.
Table 2.
Values of the parameters Δχ, δ and VEC for Nb-silicide based alloys and the alloys OHC1, OHC5, MG5, MG6 and MG7.
| Alloy | VEC | Δχ | δ | Ref |
|---|---|---|---|---|
| OHC1 | 5.23 * | 0.135 * | 8.57 * | This work |
| OHC5 | 4.3 * | 0.148 * | 10.54 * | This work |
| MG5 | 3.84 + | 0.157 + | 9.75 + | [3] |
| MG6 | 3.75 + | 0.15 + | 9.25 + | [3] |
| MG7 | 3.77 + | 0.157 + | 9.7 + | [2] |
| MG7 zone A | 3.53 + | 0.11 + | 6.77 + | [2] |
| Nb-silicide based alloys | 4.37 to 4.9 | 0.12 to 0.237 | 8.1 to 14.3 | [67] |
* for nominal composition, + average value.
Figure 24 shows maps of the parameters VEC, Δχ and δ where the alloys OHC1 and OHC5 correlate well with those of non-pesting and oxidation resistant B containing Nb-silicide based alloys. It should be noted that the alloys MG5, MG6 and MG7 also exhibited a good correlation with B containing Nb-silicide based alloys but only in the VEC versus δ map (see Figure 12c in [3]) and that the trend in better correlation (increase in R2 value) is the same as in the Figure 23.
Figure 24.
(a) VEC versus Δχ, (b) VEC versus δ and (c) Δχ versus δ maps of the alloys OHC1 (red), OHC5 (green) and non-pesting and oxidation resistant B containing Nb-Silicide based (purple) alloys [67].
Pathways for alumina and/or silica forming BC alloys for Nb-silicide based alloys could be selected using Figure 23 and Figure 24 and Table 2 and the data in [3]. Note that the alumina scale forming alloys MG7 [2] and OHC5 formed “layered” structures in their cast buttons.
5.4. Suggestions for future work
The research reported in this paper and in [2,3] presented a vision about coating alloys for BC for Nb-silicide based alloys and together with [2,3] drew attention to matters that require better understanding. Si-Fe-Cr-Ti-Nb silicide coating alloys with/out Al addition might be worth further investigation for specific families of Nb-silicide based alloys, perhaps those with C14 Laves phases in their microstructures.
The isothermal oxidation behaviour of the alloys OHC1 and OHC5 is not enough to “guarantee” their suitability for application in coatings. The evaluation of oxidation resistance must also consider the ability of the scales formed on the alloys to resist the thermally induced stresses associated with cyclic behaviour. Future research should evaluate whether the alloys OHC1 and OHC5 have good oxidation under cyclic conditions.
A substrate alloy with inherent oxidation resistance and a balance of mechanical properties should be selected, as well as a coating process to evaluate the oxidation of the substrate/coating system under cyclic conditions. This would allow one to get an understanding of the mechanism(s) of the interaction between each coating alloy and the chosen substrate, and thus to appraise the stability of the substrate/coating interface and the contamination of the substrate by interstitials. It is hoped that the work presented in this paper will inspire new research on the development of coatings for Nb-silicide based alloys.
6. Summary and Conclusions
The microstructures and isothermal oxidation of the silicide based alloys 46Si-23Fe-15Cr-15Ti-1Nb (OHC1) and 60Si-25Nb-5Al-5Cr-5Ti (OHC5) were studied. The cast microstructures consisted of the (TM)6Si5, FeSi2Ti and (Fe,Cr)Si (OHC1), and the (Nb,Ti)(Si,Al)2, (Nb,Cr,Ti)6Si5, (Cr,Ti,Nb)(Si,Al)2 (Si)ss and (Al)ss (OHC5) phases. The same compounds were in equilibrium in OHC1 at 1200 °C. The (Nb,Ti)(Si,Al)2 and (Nb,Cr,Ti)6Si5 compounds were in equilibrium in OHC5 at 1400 °C. In OHC1 the (TM)6Si5 was the primary phase in which the Fe, Cr and Ti partitioned with koFe = 0.522, koCr = 1.482 and koTi = 1.267, respectively. The FeSi and FeSi2Ti silicides formed a binary eutectic. In OHC5 the (Nb,Ti)(Si,Al)2 was the primary phase.
At 800 °C both alloys did not pest. The alloy OHC1 followed parabolic oxidation kinetics during the first 10 h, followed by linear kinetics and gained 1.42 mg/cm2 after 100 h. Its scale was composed of SiO2, TiO2 and (Cr,Fe)2O3 oxides. The FeSi2Ti formed SiO2 and TiO2, the (Fe,Cr)Si formed SiO2 with a thin layer of (Fe,Cr)2O3 on top and the (TM)6Si5 formed SiO2 and TiO2 over the centre of its dendrites and SiO2, TiO2 and (Cr,Fe)2O3 over its Fe-rich edges. The alloy OHC5 followed parabolic oxidation kinetics, gained 0.22 mg/cm2 after 100 h and formed a very thin and adherent scale composed of Al2O3, SiO2 and (Ti(1−x−y),Crx,Nby)O2 oxides. The scaled formed on (Cr,Ti,Nb)(Si,Al)2 consisted of an outer layer that was composed of SiO2 and Al2O3 oxides and an inner layer of Al2O3. The scale formed on the (Nb,Cr,Ti)6Si5 was thin, consisted of (Ti(1−x−y),Crx,Nby)O2 and SiO2 (main oxides) and some Al2O3 near the edges of the compound. In the (Nb,Ti)(Si,Al)2 compound the critical Al concentration for the formation of a continuous and adherent Al2O3 scale was 3 at.%. Below this Al concentration an internal oxidation zone formed below the scale/substrate interface.
At 1200 °C the alloy OHC1 followed para-linear oxidation kinetics and gained 1.60 mg/cm2 after 100 h. The scale was composed of a SiO2 inner layer and outer layers of Cr2O3 and TiO2. There was internal oxidation and CrO3 evaporation. Most likely the eutectic reaction L → FeO + Cr2O3 + SiO2 had occurred in the scale. The weight gain of the alloy OHC5 was 0.85 mg/cm2 after 100 h. The scale was composed of α-Al2O3.
Both alloys exhibited good correlations with alumina forming Nb-Ti-Si-Al-Hf alloys and with B containing Nb-silicide based alloys in maps of the parameters δ (related to atomic size), Δχ (related to electronegativity) and number of valence electrons per atom filled into the valence band (VEC).
The alloy OHC1 could not be used in a coating system above 1100 °C because, even though it had good oxidation resistance at 800 °C and 1200 °C, and formed a SiO2 sublayer, it would suffer from insipient melting at about 1300 °C, melting in the scale at about 1155 °C and the evaporation of CrO3. Future research could address the effects of alloying on microstructure stability and oxidation resistance of variants of the alloy OHC1. Compared with the alloy OHC1, the alloy OHC5 could be a candidate coating alloy worthy of further consideration regarding alloy development for a BC application owing to its ability to form alumina scales even at such a low Al concentration in the alloy.
Acknowledgments
The support of this work by the University of Sheffield, Rolls-Royce Plc and EPSRC (EP/H500405/1, EP/L026678/1) is gratefully acknowledged. Financial support to O.H-N by the National Research and Technology Council of Mexico (CONACyT) and the Robert Rocca Education Programme is also gratefully acknowledged.
Author Contributions
Experimental work. O.H.-N., Formal analysis of data O.H.-N., P.T., Writing-original draft preparation O.H.-N., Writing, review and editing, O.H.-N., P.T., supervision, P.T.
Funding
This research was supported by the University of Sheffield, Rolls-Royce Plc and the EPSRC (EP/H50045/1, EP/L026678/1).
Conflicts of Interest
The authors declare no conflict of interest.
References
- 1.Jackson M., Surmamanian P., Zhao J.-C., Bewlay B., Darolia R., Schafrik R. Turbine Blade for Extreme Temperature Conditions. 7,189,459 B2. U.S. Patent. 2007 Mar 13;
- 2.Ghadyani M., Utton C., Tsakiropoulos P. Microstructures and isothermal oxidation of the alumina scale forming Nb1.7Si2.4Ti2.4Al3Hf0.5 and Nb1.3Si2.4Ti2.4Al3.5Hf0.4 alloys. Materials. 2019;12:222. doi: 10.3390/ma12020222. [DOI] [PMC free article] [PubMed] [Google Scholar]
- 3.Ghadyani M., Utton C., Tsakiropoulos P. Microstructures and isothermal oxidation of the alumina scale forming Nb1.45Si2.7Ti2.25Al3.25Hf0.35 and Nb1.35Si2.3Ti2.3Al3.7Hf0.35 alloys. Materials. 2019;12:759. doi: 10.3390/ma12050759. [DOI] [PMC free article] [PubMed] [Google Scholar]
- 4.Committee on Coatings. National Materials Advisory Board. Division of Engineering. National Research Council . High-Temperature Oxidation-Resistant Coatings: Coatings for Protection from Oxidation of Superalloys, Refractory Metals, and Graphite. National Academy of Sciences; Washington, DC, USA: 1970. [DOI] [Google Scholar]
- 5.Tsakiropoulos P. On Nb silicide based alloys: Alloy design and selection. Materials. 2018;11:844. doi: 10.3390/ma11050844. [DOI] [PMC free article] [PubMed] [Google Scholar]
- 6.Stergiou A., Tsakiropoulos P., Brown A. The intermediate and high-temperature oxidation behaviour of Mo(Si1−xAlx)2 intermetallic alloys. Intermetallics. 1997;5:69–81. doi: 10.1016/S0966-9795(96)00068-4. [DOI] [Google Scholar]
- 7.Stergiou A., Tsakiropoulos P. The intermediate and high-temperature oxidation behaviour of (Mo,X)Si2 (X = W,Ta) intermetallic alloys. Intermetallics. 1997;5:117–126. doi: 10.1016/S0966-9795(96)00074-X. [DOI] [Google Scholar]
- 8.Mueller A., Wang G., Rapp R.A., Courtright E.L. Deposition and Cyclic Oxidation Behaviour of a Protective (Mo,W)(Si,Ge)2 Coating on Nb-Base Alloys. J. Electrochem. Soc. 1992;139:1266–1275. doi: 10.1149/1.2069395. [DOI] [Google Scholar]
- 9.Perkins R.A., Packer C.M. Coatings for Refractory Metals in Aerospace Environments. USA: Sep 19, 1965. AFMC TR-65-351. [Google Scholar]
- 10.Zhang P., Guo X. A comparative study of two kinds of Y and Al modified silicide coatings on a Nb-Ti-Si based alloy prepared by pack cementation technique. Corros. Sci. 2011;53:4291–4299. doi: 10.1016/j.corsci.2011.08.040. [DOI] [Google Scholar]
- 11.Chen C., Zhou C., Gong S., Li S., Zhang Y., Xu H. Deposition of Cr-modified silicide coatings on Nb-Si system intermetallics. Intermetallics. 2007;15:805–809. doi: 10.1016/j.intermet.2006.10.033. [DOI] [Google Scholar]
- 12.Metcalfe A.G., Stetson A.R. Interactions in coated refractory metal systems. In: Machlin I., Begley R.T., Weisert E.D., editors. Refractory Metal Alloys: Metallurgy and Technology. Plenum Press; New York, NY, USA: 1968. pp. 121–163. [Google Scholar]
- 13.Wachtman J.B. Mechanical Properties of Ceramics. Wiley; New York, NY, USA: 1996. [Google Scholar]
- 14.Kircher T.A. Engineering limitations of MoSi2 coatings. Mater. Sci. Eng. 1992;A155:67–74. doi: 10.1016/0921-5093(92)90313-P. [DOI] [Google Scholar]
- 15.Thandorn T., Tsakiropoulos P. Study of the role of B addition on the microstructure of the Nb-24Ti-18Si-8B alloy. Intermetallics. 2010;18:1033–1038. doi: 10.1016/j.intermet.2010.01.033. [DOI] [Google Scholar]
- 16.Li Z., Tsakiropoulos P. Study of the effects of Ge addition on the microstructure of Nb–18Si in situ composites. Intermetallics. 2010;18:1072–1078. [Google Scholar]
- 17.Jackson M.R., Bewlay B.P., Zhao J.-C. Niobium-Silicide Based Composites Resistant to High Temperature Oxidation. 6,913,655 B2. U.S. Patent. 2005 Jul 5;
- 18.Cavillon M., Dragic P.D., Ballato J. Additivity of the coefficient of thermal expansion in silicate optical fibres. Opt. Lett. 2017;42:3650–3653. doi: 10.1364/OL.42.003650. [DOI] [PubMed] [Google Scholar]
- 19.Villars P., Okamoto H., Cenzual K., editors. ASM Alloy Phase Diagram Database. ASM International; Novelty, OH, USA: 2006–2019. [Google Scholar]
- 20.Pearson W.D. The Crystal Chemistry and Physics of Metals and Alloys. Wiley; New York, NY, USA: 1972. [Google Scholar]
- 21.Hashimoto T., Inui H., Tanaka K., Yamaguchi M. Reduction of the C49 → C54 phase transformation temperature in co-sputtered TiSi2 thin films by ternary alloying. Intermetallics. 2003;11:417–424. doi: 10.1016/S0966-9795(03)00022-0. [DOI] [Google Scholar]
- 22.Nanko M., Chang S.H., Matsumaru K., Ishizaki K., Takeda M. Isothermal Oxidation of Sintered β-FeSi2 in Air. Mater. Sci. Forum. 2006;522–523:641–648. doi: 10.4028/www.scientific.net/MSF.522-523.641. [DOI] [Google Scholar]
- 23.Kurokawa K., Yamauchi A. Classification of Oxidation Behaviour of Disilicides. Solid State Phenom. 2007;127:227–232. doi: 10.4028/www.scientific.net/SSP.127.227. [DOI] [Google Scholar]
- 24.Aitken E.A. In: Intermetallic Compounds. Westbrook J.H., editor. Wiley; New York, NY, USA: 2000. pp. 491–516. [Google Scholar]
- 25.Swart H.C., Berning G.L.P. The influence of sputtering on FeSi. J. Mater. Sci. 1993;28:1617–1621. doi: 10.1007/BF00363357. [DOI] [Google Scholar]
- 26.Tsakiropoulos P. On the alloying and properties of tetragonal Nb5Si3 in Nb-silicide based alloys. Materials. 2018;11:69. doi: 10.3390/ma11010069. [DOI] [PMC free article] [PubMed] [Google Scholar]
- 27.Uz M., Wittenauer J.P. The environmental durability of refractory metals and alloys. JOM. 1992;44:25–28. doi: 10.1007/BF03222298. [DOI] [Google Scholar]
- 28.Strafford K.N., Bird J.R. The kinetics of sulfidation of niobium. J. Less Common Met. 1979;68:223–228. doi: 10.1016/0022-5088(79)90060-2. [DOI] [Google Scholar]
- 29.Zhou C. Ph.D. Thesis. MIT; Cambridge, MA, USA: 1991. Growth, Structures, and Properties of Cr2O3 and NbS Corrosion Scales. [Google Scholar]
- 30.Grzesik Z., Mitsui H., Asami K., Hashimoto K., Mrowec S. The sulfidation of sputter deposited niobium base aluminium alloys. Corros. Sci. 1995;37:1045–1058. doi: 10.1016/0010-938X(95)00013-A. [DOI] [Google Scholar]
- 31.Lee D.B., Mitsui H., Habazaki H., Kawashima A., Hashimoto K. The high temperature sulfidation behaviour of Nb-Al-Si coatings sputter deposited on a stainless steel. Corros. Sci. 1996;38:2031–2042. doi: 10.1016/S0010-938X(96)00095-9. [DOI] [Google Scholar]
- 32.Vellios N., Tsakiropoulos P. Study of the role of Fe and Sn additions in the microstructure of Nb–24Ti–18Si–5Cr silicide based alloys. Intermetallics. 2010;18:1729–1736. doi: 10.1016/j.intermet.2010.05.012. [DOI] [Google Scholar]
- 33.Tsakiropoulos P. Alloying and properties of C14-NbCr2 and A15-Nb3X (X = Al,Ge,Si,Sn) in Nb-silicide based alloys. Materials. 2018;11:395. doi: 10.3390/ma11030395. [DOI] [PMC free article] [PubMed] [Google Scholar]
- 34.Lysenko L.A., Markiv V.Y., Tsybukh O.V., Gladyshevskii E.I. The system titanium-chromium-silicon. Inorg. Mater. (Neorg. Mater.) 1971;7:157–159. [Google Scholar]
- 35.David N., Cartigny Y., Belmonte T., Fiorani J.M., Vilasi M. Thermodynamic description of the Cr-Nb-Si isothermal section at 1473 K. Intermetallics. 2006;14:464–473. doi: 10.1016/j.intermet.2005.08.013. [DOI] [Google Scholar]
- 36.Raghavan V. The Fe-Si-Ti (iron-silicon-titanium) system, Phase Diagrams Ternary Iron Alloys. Indian Inst. Met. 1987;1:65–72. [Google Scholar]
- 37.Raghavan V. The Cr-Fe-Si (chromium-iron-silicon) system, Phase Diagrams Ternary Iron Alloys. Indian Inst. Met. 1987;1:31–42. [Google Scholar]
- 38.Tsakiropoulos P. On the Nb silicide based alloys: Part I—The bcc Nb solid solution. J. Alloys Compd. 2017;708:961–971. doi: 10.1016/j.jallcom.2017.03.070. [DOI] [Google Scholar]
- 39.Weitzer F., Schuster J.C., Naka M., Stein F., Palm M. On the reaction scheme and liquidus surface in the ternary system Fe-Si-Ti. Intermetallics. 2008;16:273–282. doi: 10.1016/j.intermet.2007.10.006. [DOI] [Google Scholar]
- 40.Du Y., Schuster J.C. Experimental investigation and thermodynamic description of the Cr-Si-Ti system. Scand. J. Metall. 2002;31:25–33. doi: 10.1034/j.1600-0692.2002.310105.x. [DOI] [Google Scholar]
- 41.Kofstad P. High Temperature Oxidation of Metals. Wiley; New York, NY, USA: 1966. Chapter: Formation of Compact Scales at High Temperatures. (Corrosion Monographs Series). [Google Scholar]
- 42.Markiv V.Y. The crystal structures of the compounds R(MX)2 and RMX2 in Zr-Ni-Al, Ti-Fe-Si and related systems. Acta Crystallogr. 1966;21:84–85. [Google Scholar]
- 43.Brumm M.W., Grabke H.J. The oxidation behaviour of NiAl-I. Phase transformations in the alumina scale during oxidation of NiAl and NiAl-Cr alloys. Corros. Sci. 1992;33:1677–1690. doi: 10.1016/0010-938X(92)90002-K. [DOI] [Google Scholar]
- 44.Nakano T., Kishimoto M., Furuta D., Umakoshi Y. Effect of substitutional elements on plastic deformation behaviour of NbSi2-based silicide single crystal with C40 structure. Acta Mater. 2000;48:3465–3475. doi: 10.1016/S1359-6454(00)00135-X. [DOI] [Google Scholar]
- 45.Chen H., Weitzer F., Schuster J.C., Du Y., Xu H. The isothermal section of the Al–Cr–Si system at 800 °C and the crystal structure of τ2 (Cr3Al9Si) J. Alloys Compd. 2007;436:313–318. doi: 10.1016/j.jallcom.2006.07.038. [DOI] [Google Scholar]
- 46.Shao G. Thermodynamic modelling of the Cr-Nb-Si system. Intermetallics. 2005;13:69–78. doi: 10.1016/j.intermet.2004.06.003. [DOI] [Google Scholar]
- 47.Wittke J.P. Solubility of iron in TiO2 (Rutile) J. Am. Ceram. Soc. 1967;50:586–588. doi: 10.1111/j.1151-2916.1967.tb15004.x. [DOI] [Google Scholar]
- 48.Koohpayeh S.M., Williams A.J., Abell J.S., Lim J., Blackburn E. Cr doped TiO2 (rutile): Ferromagnetism in bulk form? J. Appl. Phys. 2010;108:073919. doi: 10.1063/1.3490997. [DOI] [Google Scholar]
- 49.Adachi T., Meier G.H. Oxidation of Iron-Silicon Alloys. Oxid. Met. 1987;27:347–366. doi: 10.1007/BF00659276. [DOI] [Google Scholar]
- 50.Birks N., Meier G.H., Pettit F.S. Introduction to the High-Temperature Oxidation of Metals. 2nd ed. Cambridge University Press; Cambridge, UK: 2006. Chapter 4. [Google Scholar]
- 51.Strydom W.J., Lombaard J.C. Thermal oxidation of the silicides CoSi2, CrSi2, NiSi2, PtSi2, TiSi2, and ZrSi2. Thin Solid Film. 1985;131:215–231. doi: 10.1016/0040-6090(85)90142-7. [DOI] [Google Scholar]
- 52.Chirkin A.D., Lavrenko V.O., Talash V.M. High-temperature and electrochemical oxidation of transition metal silicides. Powder Metall. Met. Ceram. 2009;48:330–345. doi: 10.1007/s11106-009-9124-9. [DOI] [Google Scholar]
- 53.Kofstad P., Kjollesdal H. Oxidation of Niobium (columbium) in the temperature range 500 to 1200 °C. Trans. Metall. Soc. Aime. 1961;221:285–294. [Google Scholar]
- 54.Meier G.H., Pettit F.S. The oxidation behaviour of intermetallic compounds. Mater. Sci. Eng. A. 1992;153:548–560. doi: 10.1016/0921-5093(92)90250-5. [DOI] [Google Scholar]
- 55.Zhang F., Zhang L.T., Shan A.D., Wu J.S. Microstructural effect on oxidation kinetics of NbSi2 at 1023 K. J. Alloys Compd. 2006;422:308–312. doi: 10.1016/j.jallcom.2005.12.015. [DOI] [Google Scholar]
- 56.Murakami T., Sasaki S., Ito K. Oxidation behaviour and thermal stability of Cr-doped Nb(Si,Al)2 and Nb3Si5Al2 matrix compacts prepared by spark plasma sintering. Intermetallics. 2003;11:269–278. doi: 10.1016/S0966-9795(02)00250-9. [DOI] [Google Scholar]
- 57.Prescott R., Graham M.J. The formation of Aluminium Oxide Scales on High-Temperature Alloys. Oxid. Met. 1992;38:233–254. doi: 10.1007/BF00666913. [DOI] [Google Scholar]
- 58.Pitman S.H., Tsakiropoulos P. Study of the microstructure and oxidation of NbSi2 base alloys. Mater. Res. Soc. Symp. Proc. 1995;364:1321–1326. doi: 10.1557/PROC-364-1321. [DOI] [Google Scholar]
- 59.Murakami T., Sasaki S., Ichikawa K., Kitahara A. Oxidation resistance of powder compacts of the Nb–Si–Cr system and Nb3Si5Al2 matrix compacts prepared by spark plasma sintering. Intermetallics. 2001;9:629–635. doi: 10.1016/S0966-9795(01)00043-7. [DOI] [Google Scholar]
- 60.Portebois L., Mathieu S., Knittel S., Aranda L., Vilasi M. Protective Coatings for Niobium Alloys: Manufacture, Characterization and Oxidation Behaviour of (TiXCr)7Si6 with X = Fe, Co and Ni. Oxid. Met. 2013;80:243–256. doi: 10.1007/s11085-013-9376-0. [DOI] [Google Scholar]
- 61.Kamiya S., Hirano S., Somiya S. The Compound Cr2TiO5 in the System Cr2O3-TiO2. J. Solid State Chem. 1979;28:21–28. doi: 10.1016/0022-4596(79)90054-9. [DOI] [Google Scholar]
- 62.Kofstad P. High-Temperature Oxidation. Elsevier; London, UK: 1988. p. 558. [Google Scholar]
- 63.Becker S., Rahmel A., Schutze M. Oxidation of TiSi2 and MoSi2. Solid State Ion. 1992;56:280–289. doi: 10.1016/0167-2738(92)90391-2. [DOI] [Google Scholar]
- 64.Tsirlin M.S., Anurova G.M., Aliev A.D. Structure and oxidation resistance of a slurry-diffusion coating on Nb. Poroshkovaya Metallurgiya. 1981;11:69–73. [Google Scholar]
- 65.Kainarskii I.S., Degtyareva E.V. Chromic oxide as refractory material. Ukrainian scientific-research institute of refractories. Ogneupory. 1977;1:42–47. [Google Scholar]
- 66.Prescott R., Mitchell D.F., Graham M.J. A study of the growth of α-Al2O3 scales using high resolution imaging secondary ion mass spectrometry. Corros. Sci. 1994;50:62–71. doi: 10.5006/1.3293495. [DOI] [Google Scholar]
- 67.Tsakiropoulos P. On Nb silicide based alloys: Part II. J. Alloys Compd. 2018;748:569–576. doi: 10.1016/j.jallcom.2018.03.124. [DOI] [Google Scholar]


