

Abstract
Objective
Understanding the signaling mechanisms that control brown adipose tissue (BAT) development is relevant to understanding energy homeostasis and obesity. The AKT kinases are insulin effectors with critical in vivo functions in adipocytes; however, their role in adipocyte development remains poorly understood. The goal of this study was to investigate AKT function in BAT development.
Methods
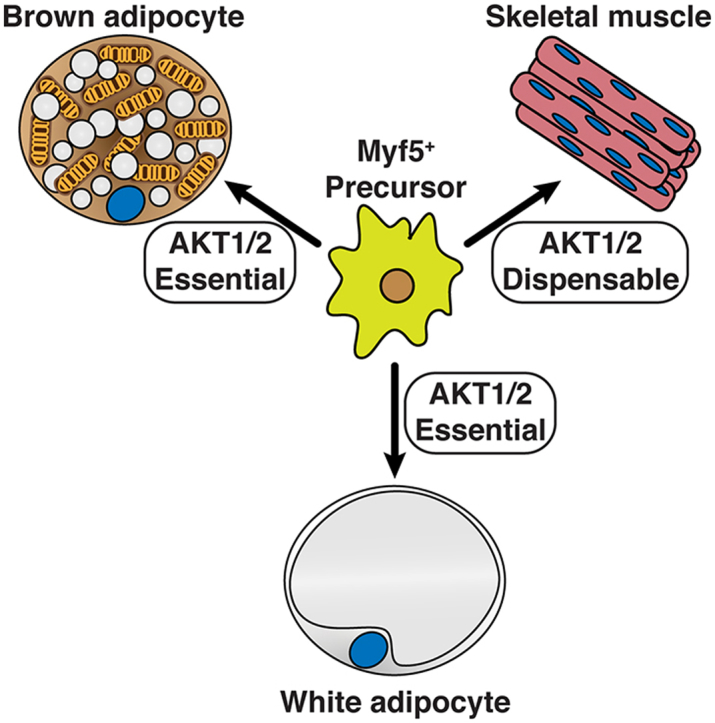
We conditionally deleted Akt1 and Akt2 either individually or together with Myf5-Cre, which targets early mesenchymal precursors that give rise to brown adipocytes. Because Myf5-Cre also targets skeletal muscle and some white adipocyte lineages, comparisons were made between AKT function in BAT versus white adipose tissue (WAT) and muscle development. We also deleted both Akt1 and Akt2 in mature brown adipocytes with Ucp1-Cre or Ucp1-CreER to investigate AKT1/2 signaling in BAT maintenance.
Results
AKT1 and AKT2 are individually dispensable in Myf5-Cre lineages in vivo for establishing brown and white adipocyte precursor cell pools and for their ability to differentiate (i.e. induce PPARγ). AKT1 and AKT2 are also dispensable for skeletal muscle development, and AKT3 does not compensate in either the adipocyte or muscle lineages. In contrast, AKT2 is required for adipocyte lipid filling and efficient downstream AKT substrate phosphorylation. Mice in which both Akt1 and Akt2 are deleted with Myf5-Cre lack BAT but have normal muscle mass, and doubly deleting Akt1 and Akt2 in mature brown adipocytes, either congenitally (with Ucp1-Cre), or inducibly in older mice (with Ucp1-CreER), also ablates BAT. Mechanistically, AKT signaling promotes adipogenesis in part by stimulating ChREBP activity.
Conclusions
AKT signaling is required in vivo for BAT development but dispensable for skeletal muscle development. AKT1 and AKT2 have both overlapping and distinct functions in BAT development with AKT2 being the most critical individual isoform. AKT1 and AKT2 also have distinct and complementary functions in BAT maintenance.
Keywords: Brown adipose tissue, White adipose tissue, Development, Adipogenesis, Insulin signaling, AKT, mTORC2, Obesity, Lipodystrophy
Graphical abstract
Highlights
-
•
AKT1 is dispensable for the differentiation of Myf5-lineage adipocytes.
-
•
AKT2 regulates adipocyte cell size and body fat distribution.
-
•
AKT1 and AKT2 exhibit some compensatory functions in BAT development and maintenance.
-
•
AKT1 and AKT2 are dispensable in the Myf5-lineage for muscle development.
-
•
ChREBP may function downstream of Akt1/Akt2 in brown adipocyte differentiation.
1. Introduction
Adipose tissue maintains systemic metabolic homeostasis through metabolic and endocrine pathways. In obesity or lipodystrophy, dysfunctional adipose tissue causes insulin resistance, type 2 diabetes, and many other serious comorbidities [1], [2]. In overweight or obesity, white adipose tissue (WAT) distribution of subcutaneous versus visceral fat, rather than total fat, is often a stronger predictor of associated comorbidities [3], [4], [5], [6]. Moreover, increased brown adipose tissue (BAT) abundance is associated with improved metabolic fitness and strategies to increase BAT amount and/or function are being considered as therapeutic strategies to fight metabolic diseases [3], [4], [5], [6], [7], [8], [9], [10], [11], [12], [13], [14], [15]. Thus, understanding BAT development is of high clinical relevance.
Lineage tracing in mice has revealed that adipose tissue development is complex, and the emerging view is that adipocytes are heterogeneous both developmentally and functionally [16], [17]. For example, early mesenchymal precursor cells expressing Myf5 (i.e. marked with Myf5-Cre) give rise to the brown adipocytes in the interscapular and subscapular BAT, or iBAT and sBAT, respectively, but to only about half of the brown adipocytes in the cervical BAT depot, and to no brown adipocytes in the peri-renal or peri-aortic BAT depots. Some WAT depots (e.g. the anterior-subcutaneous (asWAT) and retroperitoneal WAT (rWAT), but not posterior subcutaneous (psWAT), mesenteric, or peri-gonadal WAT (pgWAT) depots) also contain many Myf5-Cre lineage adipocytes, as do skeletal muscles and their associated satellite cells [18], [19], [20], [21], [22], [23]. Other studies have identified Wt1 and Prrx1 as markers of different precursor pools that heterogeneously give rise to adipocytes in other depots [24], [25], [26]. Notably, Cre-mediated recombination can be exploited in these multi-potential lineages to distinguish pathways specifically required for adipocyte development.
Genetic studies using Myf5-Cre highlight the role of insulin signaling in establishing and distributing adipose tissue. For example, deleting insulin receptor beta with Myf5-Cre (IRmyf5cKO) does not affect total body weight or muscle mass but results in selective lipodystrophy of the dorsal-anterior BAT and WAT depots with corresponding hypertrophy of the ventral-posterior WAT depots [18], [21]. The regionalized lipodystrophy in IRmyf5cKO mice is not due to a defect in establishing adipocyte precursor cells, for which IRβ is dispensable but rather to IRβ′s critical role in lipid filling of the adipocytes. In contrast, deleting Pten with Myf5-Cre (PTENmyf5cKO), which encodes the major negative regulator of PI3-kinase, redistributes body fat in the opposite direction, resulting in hypertrophy of dorsal-anterior BAT and WAT depots and the complete disappearance of all Myf5-Cre lineage negative fat depots [19]. In this model, Pten loss also expands the Myf5+ precursor cell population. Interestingly, PTENmyf5cKO mice additionally have partial muscle atrophy and phenotypically resemble humans that suffer from a rare and devastating body fat distribution disorder called Multiple Symmetric Lipomatosis or Madelung's disease [27]. These findings suggest that biochemical differences in insulin signaling or metabolism between adipocyte lineages can determine body fat patterning.
The mechanistic Target of Rapamycin (mTOR) is a major intracellular effector of insulin and has also been studied genetically with Myf5-Cre. The functions of mTOR are split between two complexes called mTOR complex 1 (mTORC1) and mTORC2 [28], [29]. mTORC1 contains the essential Raptor subunit and phosphorylates the AGC-family kinase S6K and several non-AGC family substrates to promote anabolic growth. mTORC2 uniquely contains the essential Rictor subunit, phosphorylates the AGC-family kinases AKT and SGK, and regulates glucose and lipid metabolism; however, its downstream mechanisms of action remain more elusive [28], [30], [31], [32], [33], [34], [35]. Consistent with mTORC1's broad role in anabolic metabolism, Myf5-cre;Raptor mice (Raptormyf5cKO) die in late embryonic development with severe muscle and BAT development defects [30]. In contrast, Myf5-cre;Rictor mice (Rictormyf5cKO) are viable, have no obvious defects in muscle development or repair, but have severe localized lipoatrophy similar to IRmyf5cKO mice [18], [30]. Moreover, while mTORC2-dependent AKT phosphorylation is ablated in in the BAT of Rictormyf5cKO mice, many AKT substrates are still phosphorylated normally. Thus, mTORC2 is uniquely essential in the Myf5-Cre lineage for adipose tissue growth, but its mechanism of action remains to be elucidated.
AKT (also known as PKB) mediates many aspects of cell growth, metabolism, and survival downstream of insulin signaling [36]. The AKT kinase family comprises three isoforms expressed from different genes, called AKT1, AKT2, and AKT3 (or PKBα, PKBβ, and PKBγ). mTORC2 phosphorylates the AKT hydrophobic motif site (HM; S473 in AKT1, S474 in AKT2, and S472 in AKT3), which is required for full activation [28], [31]. However, as in Rictormyf5cKO mice, several studies show that AKT HM phosphorylation is not essential for many AKT signaling events [30], [32], [37], [38], [39]. This is likely due in part to the fact that PDK1 can phosphorylate AKT in the T-loop kinase domain motif (T308 in AKT1; T309 in AKT2; T305 in AKT3) independently of HM phosphorylation [40], [41], [42], and is sufficient for many AKT functions. Thus, the exact in vivo function of mTORC2 in AKT signaling has not been fully resolved.
Here, we investigate the role of the AKT isoforms in BAT and muscle development by combining Akt1 and/or Akt2 floxed alleles with Myf5-Cre with or without whole body Akt3 deletion. Although previous studies modeling adipogenesis in vitro suggest an essential role for AKT1 [30], [43], [44], AKT1 is dispensable in vivo in the Myf5-lineage for adipose tissue development, and AKT3 does not compensate. In contrast, AKT2 is essential for adipose tissue growth, not because it controls differentiation per se, but because it promotes lipid accumulation, and its loss results in body fat redistribution. We additionally find that deleting both Akt1 and Akt2, either in precursors or mature brown adipocytes, causes severe BAT lipodystrophy without having any obvious effect on muscle development. These findings contribute significantly to understanding the complex relationship between the AKT isoforms and their regulators in adipose tissue development and maintenance.
2. Material and methods
2.1. Mice and mice housing
Akt1 and Akt2 floxed mice and Akt3 knockout mice were generously provided by Morrie Birnbaum (UPenn, Pfizer). Other lines are described elsewhere; R26R-mTmG mice (JAX stock 007676); Myf5-Cre mice (JAX stock 007893); Ucp1-CreERT2 mice [45]; UCP1-Cre (JAX stock 024670). The control mice used in each set of experiments are indicated in the appropriate figures legends. All mice were on the C57BL/6J background. Mice were housed in the Animal Medicine facilities of UMMS in a room set at 22 °C and 45% humidity under daily 12h light/dark cycles. All animals were sacrificed in the morning and fed ad libitum unless otherwise noted in the figure legends. For fasting and refeeding experiments, the food (standard chow diet) was deprived starting at 6–7 pm until the next morning at 9 am. At that time, a subgroup of mice was given chow and allowed to feed ad libitum for 45 min prior to tissue harvest. All procedures were approved by the University of Massachusetts Medical School Institutional Animal Care and Use Committee.
2.2. Cell culture
The cell lines used here are described in [46]. Briefly, brown preadipocytes were isolated from Ubc-CreERT2;Akt1floxedAkt2floxed P1 neonates and immortalized with pBabe-SV40 Large T. The gender of the neonates was not determined. Cells were maintained in high-glucose DMEM medium in incubators at 37 °C and 5% CO2. Cells stably expressing recombinant proteins were obtained by using lentiviral systems. Deletion of the Akt1 and Akt2 genes was obtained by treating the cells with one dose of 4-hydroxytamoxifen (4-OHT, 1 μM) 4 days before seeding them for differentiation assays. Control cells received equivalent dose of vehicle (ethanol). Cell were allowed to differentiate for 12 days [46]. Briefly, cells were seeded at medium density and allowed to proliferate to confluence in the presence of high-glucose DMEM medium supplemented with 10% FBS, 1% antibiotics, 20 nM insulin, and 1 nM T3. After 4 days, the cells were induced to differentiate by adding induction media (high-glucose DMEM with 10% FBS, 1% antibiotics, 20 nM insulin, 1 nM T3, 0.125 mM indomethacin, 2 μg/mL dexamethasone and 0.5 mM 3-isobutyl-1-methylxanthine (IBMX)) for 2 days. Subsequently, the medium (high-glucose DMEM, 10% FBS,1% antibiotics) with insulin and T3 was changed every 2 days until day 12. For C75 inhibitor treatment, C75 was added to the appropriate concentration in the media starting at day 6 of differentiation and changed every other day while the controls received the equivalent dose of vehicle (DMSO). Fresh media was added to the cells one hour before harvest.
2.3. In vivo tamoxifen treatment
6-week-old mice were treated I.P. with 100uL/day/mouse of Tamoxifen (at 20 mg/mL in corn oil/ethanol (9:1 vol/vol)) for 5 times in a period of seven days. Mice treated with tamoxifen and fed standard chow ad libitum were sacrificed one or three weeks post tamoxifen treatment in the morning. Note that tamoxifen treatment in vivo has been reported to cause temporary lipoatrophy and induce browning [47], [48], [49]. In control mice treated I.P. with tamoxifen, we did not observe any differences in total body weight or individual fat depot weights one week after the first tamoxifen treatment (two days after the last) compared to age/gender/strain matched mice treated with vehicle.
2.4. Tissue histology
Tissue pieces were fixed in 10% formalin. Embedding, sectioning and Hematoxylin and Eosin (H&E) staining was done by the UMMS Morphological Core facility.
2.5. Gene expression and western blot analysis
Total isolated RNA (Qiazol and RNeasy kit (Qiagen)), was used for retrotranscription (High Capacity cDNA reverse transcription kit (#4368813, Applied Biosystems)) and analyzed by qPCR (StepOnePlus real-time PCR machine, Applied Biosystems) using specific primers. Primer sequences are shown in Supplementary Table 1. Counts per million (cpm) of Akt isoforms in BAT were obtained from our previously published dataset GEO: GSE96681. For western blot analysis, protein lysates (typically 10 μg per lane) were run in SDS acrylamide/bis-acrylamide gels (typically 10%), transferred to PVDF membranes, and detected with specific antibodies as specified in Supplementary Table 2.
2.6. Adipocyte precursor cell (APC) isolation and FACS analysis
Precursor isolation is described in [18]. Briefly, stromal-vascular fraction (SVF) was prepared from each fat pad by collagenase treatment. Cells were then pelleted by centrifugation, cleared, and suspended in staining media (HBSS + 2% FBS), and labeled with appropriate antibodies (Supplementary Table 2). After staining, cells were filtered through a 35-μm cell-strainer capped tube to ensure single cell suspension and stained with live/dead Blue. Live single cells were gated according to the expression of surface markers (CD31-CD45-CD29 + CD34 + Sca1+) in a BD LSRII analyser. Data were analyzed with FlowJo.
2.7. Whole mount confocal microscopy
Whole mount confocal microscopy is described in [18]. Briefly, small pieces of adipose tissues were mounted with Fluoromount-G (Southern Biotech) and imaged in a LSM 5 Pa (Zeiss) point scanner confocal system using a 40× oil immersion objective. eGFP was excited at 488 nm and detected from 515 to 565 nm tdTomato was excited at 543 nm and detected from 575 to 640 nm. Images were processed in Adobe Phostoshop and ImageJ.
2.8. Statistical analysis
Data are presented as mean + s.e.m., unless stated otherwise. Student t-test or analysis of variance (one or two ways, follow by Tukey posthoc analysis), as appropriate, were used to determine statistical significance, which is indicated in each figure legend. P-values are indicated as follows: *, p-value<0.005, **, p-value<0.01 and ***, p-value>0.001. No pre-test was used to choose sample size. Statistical analysis was done using GraphPad Prism. The number of mice used per experiment is stated in each figure legend.
3. Results
3.1. Deleting Akt2, but not Akt1, with Myf5-Cre redistributes body fat
To investigate the in vivo role AKT1 and AKT2 in Myf5-Cre+ cells and their descendants, we crossed the Myf5-Cre knock-in driver with Akt1 or Akt2 floxed mice to generate Akt1myf5cKO and Akt2myf5cKO conditional knockout mice. Total body mass is unaffected in both models (Figure 1A,B). Individual fat and lean tissues were analyzed at 6 weeks of age as done previously for IRmyf5cKO, PTENmyf5cKO and Rictormyf5cKO mice [18], [19], [30]. Akt1myf5cKO mice have normal brown and white adipose tissue mass when normalized to total body weight (Figure 1A), or when expressed as total BAT weight (Figure S1A). All other tissues examined were normal sized except the kidneys, which were slightly enlarged when normalized to total body weight (Figure S1A, S2A). This indicates that Akt1 is dispensable in the Myf5-Cre lineage for adipose tissue and muscle growth.
Figure 1.

Deleting Akt2, but not Akt1, with Myf5-Cre redistributes body fat. (A) Body weight and fat weights of Akt1myf5cKO and littermate controls (Akt1 floxed) at 6 weeks old (n = 6, t-test). (B) Body weight and fat weights of Akt2myf5cKO and littermate controls (Akt2 floxed) at 6 weeks old (n = 11, t-test). (C) Representative H&E images of the indicated fat depots of Akt1myf5cKO, Akt2myf5cKO and respective control littermates (Akt1 floxed and Akt2 floxed, respectively) at 6 weeks old (n = 4).
In contrast to the Akt1myf5cKO mice, Akt2myf5cKO mice exhibit significant changes in body fat distribution. In particular, Akt2myf5cKO mice show significant lipoatrophy of iBAT and sBAT, which are almost completely derived from Myf5-Cre+ precursors (Figure 1B, Figure S1B) [18]. The cBAT is also decreased but to a lesser degree consistent with only about 50% of the brown adipocytes in this depot descending from Myf5-Cre+ precursors (Figure 1B, Figure S1B) [18]. The retroperitoneal WAT (rWAT) of Akt2myf5cKO mice, which is nearly completely derived from Myf5-Cre lineage precursors, also exhibits significant lipoatrophy (Figure 1B, Figure S1B). In contrast, the Myf5-Cre lineageneg posterior subcutaneous and peri-gonadal WAT depots (psWAT and pgWAT, respectively) increase in mass (Figure 1B, Figure S1B) suggesting compensatory expansion by these Cre-negative (i.e. Akt2 wild type) adipocytes. The asWAT, which is only partially derived from Myf5-Cre lineage precursors, shows no differences in mass (Figure 1B, Figure S1B), which is likely due to compensatory expansion of the Myf5-Cre negative asWAT fraction as was previously observed in IRmyf5cKO mice [18]. No other tissues examined including skeletal muscles (i.e. quadriceps, gastrocnemius and triceps) show any differences in mass in the Akt2myf5cKO mice (Figure S1B, S2B). This indicates that Akt2 is required in the Myf5-Cre lineage for normal brown and white adipose tissue growth but not for skeletal muscle growth.
3.2. AKT2 regulates adipocyte cell size
Adipocyte morphology was next examined by histology. There is no size difference between control and Akt1myf5cKO brown or white adipocytes in any depot examined. In contrast, Akt2myf5cKO brown adipocytes have reduced lipid content consistent with their small BAT mass (Figure 1C). In Myf5-Cre lineage rWAT, deleting Akt2 causes the formation of two morphologically distinct populations of adipocytes; one that is very small in size and another that is similar in size or larger than control adipocytes (Figure 1C). Moreover, the increase in psWAT and pgWAT total mass observed in Akt2myf5cKO mice associates with adipocyte hypertrophy in these depots (Figure 1C). Thus, adipocyte lineages deleted for Akt2 generate smaller adipocytes resulting in tissue atrophy, while the non-targeted lineages give rise to larger adipocytes resulting in oversized depots.
The heterogeneous mix of small and large adipocytes observed in the rWAT of Akt2myf5cKO mice is reminiscent of previous results obtained in the rWAT of IRmyf5cKO and Rictormyf5cKO mice [18], [30]. In these models, the larger adipocytes resulted from the compensatory expansion of Myf5-Cre lineage negative adipocytes. To test if this is also the case in the Akt2myf5cKO mice and to examine how Akt loss affects lineage distribution, we incorporated the membrane-targeted Tomato fluorescent protein (mTFP) - membrane targeted green fluorescent protein (mGFP) dual fluorescent (or mTmG) reporter into both the Akt1myf5cKO and Akt2myf5cKO models generating Akt1myf5cKO;R26R-mTmG and Akt2myf5cKO;R26R-mTmG mice. In mice carrying the mTmG reporter, Cre recombinase induces the expression of mGFP in all Cre expressing cells and their descendants, while all Cre-negative cells express mTFP [18], [50].
Using confocal imaging, we find no difference in labeling between control (myf5-Cre;R26R-mTmG) and Akt1myf5cKO;R26R-mTmG mice. That is, all iBAT and rWAT adipocytes are mGFP+, indicating Cre targeting, while all psWAT and pgWAT adipocytes are mTFP+ (Figure 2A). In contrast, imaging of the Akt2myf5cKO;R26R-mTmG mice confirms that all brown adipocytes are mGFP+, consistent with their uniformly small size, and there is no compensation from Cre-negative (mTFP+) lineages (Figure 2A). Moreover, all of the small adipocytes in the rWAT of Akt2myf5cKO;R26R-mTmG mice are also mGFP+ and contain multi-locular lipid droplets, while all of the large adipocytes are mTFP+, also consistent with previous studies (Figure 2A) [18], [30]. Thus, while most early rWAT adipocytes normally originate from Myf5-Cre marked precursors, Myf5-Cre negative precursors can partially compensate when the Myf5-Cre+ lineage is compromised. Quantification of adipocyte size based on lineage shows that the Crenegative adipocytes in Akt2myf5cKO;R26R-mTmG rWAT of (i.e. mTFP+) are the same size as Myf5-lineage adipocytes in both the control mice (myf5-Cre;R26R-mTmG) and the Akt1myf5cKO;R26R-mTmG mice, while the Akt2-deleted adipocytes in the Akt2myf5cKO;R26R-mTmG mice (which are mGFP+) are significantly smaller (Figure S3A). As expected, the adipocytes in the psWAT and pgWAT of Akt2myf5cKO;R26R-mTmG mice are uniformly mTFP+ (Myf5-Cre lineage negative). These data indicate that AKT2 regulates the size of Myf5-Cre lineage brown and white adipocytes.
Figure 2.

Akt2 is required for brown adipocyte lipid filling, but not for differentiation. (A) Representative images of whole-mount preparations of the indicated fat depots of 6 weeks old myf5-Cre; R26R-mTmG, Akt1myf5cKO;R26R-mTmG and Akt2myf5cKO;R26R-mTmG mice (n = 3 for myf5-Cre; R26R-mTmG, 2 for Akt1myf5cKO;R26R-mTmG and 4 for Akt2myf5cKO;R26R-mTmG). (B) Average percentage of mTFP+ (Red) and mGFP+ (Green) APCs isolated from the indicated depots from 6 weeks old myf5-Cre; R26R-mTmG, Akt1myf5cKO;R26R-mTmG and Akt2myf5cKO;R26R-mTmG mice (n = 3 for myf5-Cre; R26R-mTmG, 2 for Akt1myf5cKO;R26R-mTmG and 4 for Akt2myf5cKO;R26R-mTmG; no statistical analysis was used). (C) qPCR analysis of the iBAT of Akt1myf5cKO, Akt2myf5cKO and respective control littermates (Akt1 floxed and Akt2 floxed, respectively) at 6 weeks old (n = 6 for Akt1 floxed and Akt1myf5cKO and n = 8 for Akt2 floxed and Akt2myf5cKO; t-test).
3.3. AKT2 is required for adipocyte lipid filling
Myf5-cre targets early in development in mesenchymal precursor cells that are not yet committed to becoming adipocytes. Thus, the small adipocyte and tissue mass phenotype caused by deleting akt2 could be linked to defects in establishing adipocyte precursor pools, or alternatively, to their ability to differentiate. On the other hand, we recently showed that both Akt2Ucp1CreER and Akt2AdipoqCre mice, in which akt2 is deleted late in differentiation, also have a small brown and white adipocytes, respectively, that correspond with decreased overall tissue size [46]. Thus, the size phenotype could alternatively be caused by a lipid filling or storage defect. To distinguish between these possibilities, we next asked whether deleting Akt2 affects establishment of Myf5-lineage adipocyte precursor pools. Myf5-Cre heterogeneously marks adipocyte precursors in the stromal vascular fractions (SVFs) of all major fat depots but must abundantly in the dorsal-anterior depots (e.g. iBAT, asWAT, and rWAT) [18], [23]. Using fluorescence activated cell sorting with well-established cell surface markers that enrich for adipocyte precursor cells (APC) [51], we find no difference in Myf5-Cre lineage contribution to the APC pool in either Akt1myf5cKO;R26R-mTmG mice or of Akt2myf5cKO;R26R-mTmG mice (Figure 2B). The total number of cells analyzed is shown in Figure 3B. Thus, AKT2 is not required in the Myf5-lineage to establish normal precursor pools.
We also analyzed several adipocyte differentiation markers. We find no differences in pparγ1, c/ebpa, c/ebpb, c/ebpd, pgc1a, or ucp1 expression in Akt1myf5cKO or Akt2myf5cKO BAT, slight increases in pparγ2 and sgk2, and a slight decrease in cidea expression, but only in Akt2myf5cKO BAT (Figure 2C). No differences were found in the white fat markers dpt and retn (Figure 2C). In contrast, only Akt2myf5cKO BAT and not Akt1myf5cKO BAT show dramatic (>90%) reduction acly, acaca, and fasn expression, which encode regulators of de novo lipogenesis (Figure 2C). Thus, the small cell size and tissue mass phenotype in Akt2myf5cKO BAT is not caused by an inability to express differentiation and/or identity markers, but could relate at least in part to a lipid synthesis defect.
Collectively, these data support a model in which AKT1 and AKT2 individually are dispensable in the Myf5-lineage for muscle development, for establishing adipocyte precursor pools, and for adipocyte differentiation, but that AKT2 specifically is required for lipid filling during adipogenesis.
3.4. Most downstream AKT signaling in BAT depends upon AKT2
Next, we examined how Akt loss early in BAT development affects downstream signaling. By mRNA expression levels, Akt2 is the most abundant isoform in BAT accounting for 65% of total Akt expression; Akt1 expresses at about half the levels of Akt2 while Akt3 expresses nearly 10 and 20-fold less than Akt1 and Akt2, respectively (Figure 3A). We confirmed ablation of Akt1 and Akt2 in the BAT of Akt1myf5cKO and Akt2myf5cKO mice using isoform specific antibodies (Figure 3B). The residual AKT1 expression likely reflects the fact that it is this most abundant isoform in the non-brown adipocyte population, which makes up nearly half of the depot [45]. Deleting Akt1 had only a minor effect on total T-loop (T308) phosphorylation and no effect on total HM (S473) phosphorylation, as determined with pan-phospho-specific antibodies, while, in contrast, deleting Akt2 results in attenuation of both (Figure 3B). Interestingly, deleting Akt2 also dramatically decreases P-AKT-T450 levels, which is a growth-factor insensitive site, and no effect is observed in the Akt1 knockout (Figure 3B) consistent with AKT2 being the most abundant isoform in BAT. Moreover, the AKT substrates P-GSK3β-S9, P-PRAS40-T246, and P-AS160-T642, and the downstream mTORC1 substrates P-S6K-T389 and P-4EBP1-T37/46, are largely unaffected by deleting Akt1 but attenuated by deleting Akt2 (Figure 3B). We made similar observations when comparing Akt1ucp1CreER and Akt2ucp1CreER mice in which Akt1 and Akt2 are deleted only in mature brown adipocytes [46]. Thus, whether targeting BAT early in development or in mature brown adipocytes, AKT2 is most essential for establishing normal downstream AKT signaling.
Figure 3.

Most downstream AKT signaling in BAT depends upon AKT2. (A) Total counts per million (cpm) in BAT of wildtype mice of each akt isoform (Left) (n = 4, one-way ANOVA). Contribution of each isoform to the total akt levels (Right) (n = 4; no statistical analysis was used). (B) Western blots of the iBAT of Akt1myf5cKO, Akt2myf5cKO and respective control littermates (Akt1 floxed and Akt2 floxed, respectively) at 6 weeks old after overnight fasting with or without refeeding for 45 min.
Next, we verified the effect of AKT2 loss in the rWAT and skeletal muscles, which are targeted by Myf5-Cre. Consistent with the above results showing an increase in the number of Myf5-Creneg lineage adipocytes in the rWAT of Akt2myf5cKO mice, we observe only a small decrease in total AKT2 protein in whole rWAT lysates (Figure S3C). On the contrary, lysates of Akt2myf5cKO quadriceps show loss of AKT2 total protein and the corresponding decrease in P-T308 and P-S473 phosphorylation (Figure S3D) confirming that Myf5-Cre targets skeletal muscle. However, this has only modest effect on downstream signaling to P-PRAS40-T246 and little effect if any on P-S6K1-T389 or 4EBP1 laddering (Figure S3D), suggesting tissue-specific requirements for AKT2 in Myf5-lineages.
3.5. AKT3 does not compensate for AKT1 in BAT development
Although AKT3 is expressed at the lowest level of the three isoforms in BAT (Figure 3A), other studies have shown that it is functionally redundant with AKT1, but not AKT2, during thymus, skin, and cardiovascular and nervous system development [52], [53], [54]. To test if AKT3 can compensate for AKT1 in BAT development we generated Akt1myf5cKO mice on an Akt3 null background (i.e. Akt3−/−;Akt1myf5cKO mice). Both Akt3−/− and Akt3−/−;Akt1myf5cKO mice are indistinguishable from control mice with respect to body weight, tissue mass, and lipid content (Figure 4A,B, Figure S1C, S2C). Western blot confirmed Akt1 and Akt3 deletion (Figure 4B). We conclude that AKT3 is not compensating for AKT1 in Akt1myf5cKO mice.
Figure 4.

AKT3 does not compensate for AKT1 in BAT development. (A) Body weight and fat weights of Akt3−/− (n = 9), Akt3−/−;Akt1myf5cKO (n = 12) and littermate controls (Akt1 floxed) (n = 3) at 6 weeks old (one-way ANOVA). (B) Representative H&E images of the indicated fat depots of Akt3−/−, Akt3−/−;Akt1myf5cKO and littermate controls (Akt1 floxed) at 6 weeks old (n = 3–4). (C) Western blots of the iBAT of Akt3−/−, Akt3−/−;Akt1myf5cKO and littermate controls (Akt1 floxed) at 6 weeks old.
3.6. AKT1 and AKT2 exhibit compensatory functions in BAT development
Although AKT1 loss alone has no obvious phenotype, we wondered if AKT1 and AKT2 might partially compensate for each other in the Myf5-Cre lineages as other studies have shown that co-deleting both is more severe than deleting either isoform alone [55], [56], [57], [58]. Indeed, unlike either single deletion, Akt1/Akt2 myf5cKO (conditional double knockout) mice are viable but 29% smaller than controls (Figure 5A). Tissue mass is dramatically decreased by 84% in the iBAT, 66% in sBAT, and 88% in the rWAT (Figure 5A). The morphology of the few remaining adipocytes in iBAT and rWAT is relatively unaffected (Figure 5B) likely reflecting a Myf5-Cre negative origin. Interestingly, psWAT is proportionally larger in the double knockout, like in the Akt2 single knockout mice, and contains many hypertrophic adipocytes (Figure 5A,B). The pgWAT mass is unchanged although there are many smaller than normal adipocytes; liver mass also increases (Figure 5A,B, Figure S1D, S2D). Moreover, the mass of the triceps and quadriceps was proportionally normal while only the gastrocnemius muscle is slightly reduced (Figure S1D). The increased relative kidney mass present in Akt1myf5cKO is also present in Akt1/Akt2myf5cKO (Figure S1D, S2D). Western blot analysis on total tissue lysates did not show loss of AKT1 or AKT2 protein in the remaining BAT consistent with the AKT protein present in total lysates being largely from non-brown adipocytes and from the few brown adipocytes that did not originate from the Myf5-Cre precursors (as seen previously when the IR is deleted with Myf5-Cre) (Figure 5C) [18], [21]. In contrast, deletion efficiency is high in quadriceps (Figure 5C). These data indicate (1) that AKT1 and AKT2 have compensatory functions during BAT development, (2) that a threshold of AKT signaling is required for BAT to develop normally, and (3) that Myf5-lineage AKT signaling is more essential for adipose tissue development than skeletal muscle development.
Figure 5.

Additional effects of double AKT1/AKT2 deletion in BAT development. (A) Body weight and fat weights of Akt1/2myf5cKO and littermate controls (Akt1/2 floxed) at 6 weeks old (n = 5, t-test). (B) Representative H&E images of the indicated fat depots of Akt1/2myf5cKO and littermate controls (Akt1/2 floxed) at 6 weeks old (n = 4). (C) Western blots of BATs and quadriceps (Quad) of Akt1/2myf5cKO and littermate controls (Akt1/2 floxed) at 6 weeks old.
3.7. AKT1 and AKT2 also exhibit compensatory functions in BAT maintenance
We wondered if a compensatory relationship between Akt1 and Akt2 also exists in mature brown adipocytes. To test this, we generated ucp1-cre;Akt1;Akt2 mice (i.e. Akt1/Akt2ucp1cKO mice) to doubly delete Akt1 and Akt2 in mature brown adipocytes. This caused the complete ablation of all major BAT depots we examined (iBAT, sBAT, cBAT) but did not affect total body weight or WAT mass and morphology (Figure 6A,B). Of all the other tissues examined, only the heart exhibited a slight but significant decrease in Akt1/Akt2ucp1cKO mice (Figure S4A, S5A). Notably, neither adipocyte morphology, nor the expression of the browning markers ucp1, elovl3, dio2, cpt1b, cidea and cox7a change in the psWAT of Akt1/Akt2ucp1cKO mice (Figure 6C). The WAT-selective markers retn and dpt also do not change (Figure 6C). Consistently, no asWAT, rWAT, or psWAT adipocytes are labeled with ucp1-cre when combined with the mTmG reporter (Figure 6E) and no multi-locular adipocytes are detectable (Figure 6B,E). Similar results were found in pgWAT (Figure 6B,D and E). Thus, AKT signaling is also essential for the maintenance of BAT, but despite the loss of BAT caused by doubly deleting Akt1 and Akt2 in mature brown adipocytes, widespread "compensatory browning" is not observed under these conditions.
Figure 6.

Double AKT1/AKT2 deletion in mature brown adipocytes ablates BAT. (A) Body weight and fat weights of Akt1/2ucp1cKO and littermate controls (Akt1/2 floxed) at 9 weeks old (n = 9, t-test) (NF, Not Found). (B) Representative H&E images of the indicated fat depots of Akt1/2ucp1cKO and littermate controls (Akt1/2 floxed) at 9 weeks old (n = 4). (C) qPCR analysis of the psWAT of Akt1/2ucp1cKO (green squares) and littermate controls (Akt1/2 floxed, black dots) at 9 weeks old (n = 8, t-test). (D) qPCR analysis of the pgWAT of Akt1/2ucp1cKO and littermate controls (Akt1/2 floxed) at 9 weeks old (n = 8, t-test)). (E) Representative images of whole-mount preparations of the indicated fat depots of 9 weeks old Ucp1-Cre;R26R-mTmG and Akt1/2ucp1cKO;R26R-mTmG mice (n = 3).
Because Ucp1-cre is expressed before birth, we also checked if inducibly deleting Akt1 and Akt2 in the mature adipocytes of older mice would also result in BAT lipoatrophy. To test this, we generated ucp1-CreERT2;Akt1;Akt2 mice (Akt1/Akt2ucp1ERcKO) and treated them and their Cre-negative control littermates with tamoxifen at 6 weeks of age. Tissues were analyzed at one and three weeks after the first tamoxifen injection. A dramatic decrease in BAT mass was detectable even at one week post-tamoxifen treatment (more than 60% reduction for iBAT, 50% for sBAT, and 40% for cBAT), which was sustained to at least three-weeks post treatment (Figure 7A). Total body weight and the mass of individual non-BAT tissues was unaffected (Figure 7A,B and Figure S3B). Histological examination reveals a complete lack of BAT lipid droplets in Akt1/Akt2ucp1ERcKO mice at one-week post-deletion (Figure 7C) that correlates with reduced UCP1 mRNA and protein expression (Figure 7D,E). Consistently, Akt1 is reduced and Akt2 ablated at this time point (Figure 7D). Several other brown adipocyte markers including prdm16, pparγ1, pparγ2, sgk2, and dio2, and the white fat marker retn, mRNAs were not negatively affected at this time-point (Figure 7E) indicating that despite the profound loss of lipid and reduced UCP1 expression the cells present in the depot retain their identity as differentiated brown adipocytes. At three-weeks post-deletion, lipid-filled brown adipocytes reappear and UCP1 expression increases to near normal levels and importantly this correlates with the re-emergence of non-deleted cells (Figure 7C–E). Thus, AKT1 and AKT2 also exhibit compensatory functions required to maintain BAT in adult mice.
Figure 7.

Acutely inducing AKT1/AKT2 deletion triggers rapid turnover of brown adipocytes. (A) Body weight and BAT fat weights of Akt1/2ucp1ERcKO and littermate controls (Akt1/2 floxed) 1 or 3 weeks after tamoxifen treatment (1 week post tamoxifen: Akt1/2 floxed n = 11, Akt1/2ucp1ERcKO n = 10. 3 weeks post tamoxifen: Akt1/2 floxed n = 8, Akt1/2ucp1ERcKO n = 10; t-test by time point). (B) WAT fat weights of Akt1/2ucp1ERcKO and littermate controls (Akt1/2 floxed) 1 or 3 weeks after tamoxifen treatment (1 week post tamoxifen: Akt1/2 floxed n = 11, Akt1/2ucp1ERcKO n = 10. 3 weeks post tamoxifen: Akt1/2 floxed n = 8, Akt1/2ucpERcKO n = 10; t-test by time point). (C) Representative H&E images of iBAT of Akt1/2ucp1ERcKO and littermate controls (Akt1/2 floxed) 1 or 3 weeks after tamoxifen treatment (n = 4). (D) Western blots of the iBAT of Akt1/2ucp1ERcKO and littermate controls (Akt1/2 floxed) 1 or 3 weeks after tamoxifen treatment. (E) qPCR analysis of the iBAT of Akt1/2ucp1ERcKO and littermate controls (Akt1/2 floxed) 1 or 3 weeks after tamoxifen treatment (n = 8; t-test by time point).
3.8. Expressing ChREBPβ in Akt1/Akt2 double knockout brown preadipocytes partially rescues differentiation
Finally, we sought to better understand mechanistically how AKT1/2 signaling promotes brown adipocyte differentiation using an in vitro system. To do this, we generated inducible knockout brown preadipocytes in which the tamoxifen-inducible CreERT2 driver is expressed in Akt1/Akt2 floxed brown adipocyte precursor cells in culture (hereafter Akt1/Akt2iKO cells) [46]. Briefly treating Akt1/Akt2iKO proliferating precursors with 4-hydroxy tamoxifen (4-OHT) prior to differentiation efficiently ablates both AKT1 and AKT2 compared to their isogenic (ethanol-treated) brown preadipocyte controls (Figure S6A). Akt1/Akt2iKO precursors were then induced to differentiate. Western blot using Raptor as a loading control indicates that Akt1/Akt2iKO brown preadipocytes fail to induce the differentiation markers PPARγ1, PPARγ2, ACLY, ACC1/2, FASN, and Perilipin1, C/EBPα, prdm16, and adiponectin (Figure 8A, S6D). Neutral lipid staining with Oil Red O confirms that Akt1/Akt2iKO brown preadipocytes cannot differentiate into lipid accumulating brown adipocytes (Figure 8B).
Figure 8.

AKT signaling drives brown adipocyte differentiation in part by stimulating ChREBPβ expression. (A) Western blot analysis of differentiated Akt1/Akt2iKO-cells treated with 4-OHT before differentiation overexpressing plasmids containing ChREBP isoforms (pMSCV-Chα and pMSCV-Chβ). (B) Oil Red O staining of differentiated Akt1/Akt2iKO-cells treated with 4-OHT before differentiation overexpressing plasmids containing ChREBP isoforms (pMSCV-Chα and pMSCV-Chβ). (C) Western blot analysis of differentiated Akt1/Akt2iKO-cells treated with 4-OHT before differentiation overexpressing plasmids containing pMSCV-Chβ treated with vehicle (DMSO) o C75 at the indicated doses starting at day 8 of differentiation.
AKT signaling regulates insulin stimulated glucose uptake; thus, a defect in glucose uptake may prevent Akt1/Akt2iKO cells from differentiating. To test this, we overexpressed mouse glut1 in Akt1/Akt2iKO brown preadipocytes which we recently showed increases glucose uptake in wild type and Akt1 and Akt2 single knockout cells 8-fold [46]. After twelve days of differentiation, glut1 overexpression did not rescue the expression of ACLY, FASN, or perilipin (Figure S6B) or increase lipid accumulation (Figure S6C) in Akt1/Akt2iKO cells. Thus, under these conditions, a defect in glucose uptake does not appear to be the primary, or only, defect preventing Akt1/Akt2iKO brown preadipocytes from differentiating.
We recently reported that AKT2 stimulates the activity of the ChREBPα transcription factor to induce the more potent ChREBPβ isoform in mature brown adipocytes to promote de novo lipogenesis [46]. It has also been reported that ChREBP might have a role in promoting adipogenesis [59]. Following the differentiation assay, Akt1/Akt2iKO cells have 50% less chrebpα, consistent with a differentiation defect, and greater than >95% reduction in chrebpβ (Figure S6D). Thus, we next expressed recombinant ChREBPα or ChREBPβ in Akt1/Akt2iKO precursors and asked whether either ChREBP isoform could rescue differentiation. Overexpressing ChREBPα does not rescue any marker of differentiation (Figure 8A). However, expressing ChREBPβ partially restores PPARγ, ACLY, ACC, FASN, and PLIN1 expression (Figure 8A) and lipid accumulation (Figure 8B) suggesting ChREBPβ may be one AKT effector required for adipogenesis, but that additional factors exist.
To test whether ChREBPβ might promote differentiation by driving de novo lipogenesis, we treated Akt1/Akt2iKO cells expressing either empty vector or ChREBPβ with the FASN inhibitor C75 [60], [61], which blocks adipogenesis [62], [63]. Accordingly, C75 (20 μM) blocks the differentiation of wild type (ethanol treated) cells in a dose dependent manner using Perilipin as an independent (of the DNL pathway) indicator of differentiation (Figure 8C). Interestingly, ChREBPβ overexpression antagonizes the effect of C75 treatment on ACLY, ACC1/2, FASN, and Perilipin levels in control cells (Figure 8C). Moreover, the partial rescue of Akt1/2 knockout cells by ChREBPβ overexpression is not inhibited by C75 treatment (Figure 8C). Thus, inhibiting FASN might block differentiation by a mechanism indirectly related to its role in synthesizing palmitate, which can be compensated for by forcing ACLY and/or ACC1/2 expression, and is positively regulated by AKT2.
4. Discussion
The in vivo roles of the Akt isoforms are incompletely understood. Until recently, most in vivo studies in adipose tissue relied on whole body Akt deletion models, for which specificity is difficult to interpret. Here, we took advantage of the fact that Myf5-Cre expresses in early mesenchymal precursors that give rise to brown adipocytes to investigate the AKT isoforms in BAT development. Because Myf5 precursors also give rise to some white adipocytes and skeletal muscle, the role of AKT signaling in WAT and skeletal muscle development was compared. We report that AKT2 is crucial for BAT growth, specifically for lipid filling, but not for expressing differentiation markers. In contrast, AKT1 is dispensable. WAT development shows similar dependencies. Moreover, AKT1 and AKT2 have partial overlapping functions because deleting both is more severe that deleting either isoform individually. In contrast, AKT1 and AKT2 are dispensable for skeletal muscle development. It should be noted that Myf5-Cre can target additional lineages, including a few neuronal lineages in the hypothalamus [64], [65] and this could influence certain phenotypes. However, the fact that deleting the AKT isoforms in vivo with Myf5-Cre, Ucp1-Cre, and Ucp1-CrER drivers, or in vitro in brown preadipocytes with CreER, has similar phenotypes favors the model that these phenotypes are BAT-specific. We conclude that AKT signaling, and in particular AKT2, is uniquely essential for adipose tissue growth.
Clinical data indicate that excessive visceral fat increases risk of insulin resistance, while subcutaneous fat accumulation can be protective [66], [67], [68], [69]. However, the genetic determinants of body fat patterning remain unknown. Here, we show that deleting Akt2 in the Myf5-lineage redistributes body fat by reducing the size of Myf5-lineage depots and enlarging Myf5-lineage negative depots, consistent with the hypothesis that signaling or metabolic variation between lineages may affect body fat patterning [18], [19], [21], [30]. Notably, mice studied here were young (six weeks old) and living in standard conditions (i.e. 22 °C and chow diet); further research is needed to understand the role of adipocyte AKT signaling in adult fat distribution at thermoneutrality and on different diets.
Conditional knockouts of AKT1 and/or AKT2 in skeletal muscle or satellite cells have not previously been described [70] and their skeletal muscle functions have been largely inferred from transgenic, whole-body knockout, or small molecule inhibitor studies [71], [72], [73], [74], [75]. Moreover, AKT1 rather than AKT2 (the most prevalent isoform in muscle), has been more extensively studied in muscle likely because AKT1 whole body knockout mice have a whole-body growth defect including decreased muscle mass [56], [57], [76]. Data here indicate that AKT1 and AKT2 are dispensable in the Myf5-Cre lineage for skeletal muscle development. However, the role of each isoform in muscle metabolic control remains understudied especially under non-standard laboratory conditions.
4.1. AKT isoform functions in fat
Previous in vitro studies suggest that AKT1 is required for brown adipocyte differentiation [30], [44], [77], [78], [79] and whole body Akt1 deletion results in a global growth defect [56], [57]. In contrast, we find that deleting Akt1 with Myf5-Cre has no obvious brown or white adipogenesis, myogenesis, or whole body growth defect in vivo. One possible reason for the discrepancy regarding brown adipocyte differentiation is that in vitro cell culture conditions lack an alternative mechanism present in vivo that can overcome the AKT1 deficiency. In support, deleting Rictor/mTORC2 with Myf5-Cre shows the same discrepancy, but the in vitro differentiation defect caused by inhibiting mTORC2 can be partially rescued by adding BMP7 to the differentiation medium [30]. Another possibility is that AKT2 can compensate for AKT1 in vivo, but not in vitro. Thus, while AKT1 does not appear to be required for brown adipocyte differentiation in vivo, a more detailed biochemical analysis will be required before concluding that differentiation proceeds by the normal mechanism when AKT1 is absent.
Whole body Akt2−/− mice reportedly have a diabetic phenotype but normal adipose tissue mass [56], [80]. In addition, deleting Akt2 with PDGFRα-Cre (which targets many cell types including adipocyte precursors) does not affect normal adipose tissue mass, although HFD-induced adipose expansion appears to require Akt2 [80].
Finally, in cell culture, deleting Akt2 does not impair adipocyte differentiation [30], [44], [77], [78], [79], collectively suggesting that Akt2 regulates adipose tissue metabolism but not development or growth. However, another study using a different mouse strain found that Akt2−/− mice have diabetes associated with a decreased whole-body growth deficiency, including decreased adipocyte cell number [81]. Moreover, adiponectin-cre;akt2 mice (C57BL6/J) have less adipose tissue mass due in part to reduced adipocyte size [46]. In addition, Akt2ucp1ERcKO mice (C57BL6/J) have reduced BAT mass due to depleted lipid storage [46], and here, we show that deleting akt2 with Myf5-cre reduces both BAT and WAT mass without affecting differentiation markers. Taken together, these data argue that, with some strain and/or lineage dependent variation, adipocytes require AKT2 to accumulate lipids, which may be due in part to its role in controlling glucose uptake and de novo lipogenesis (DNL) enzyme expression. Notably, familiar partial lipodystrophy is associated with Akt2 mutations in humans [82] indicating AKT2's role in regulating fat mass is conserved.
Doubly deleting Akt1 and Akt2 with Myf5-cre, Ucp1-cre, or Ucp1-creER, results in severe BAT lipoatrophy in vivo suggesting that AKT1 and AKT2 have some partial overlapping functions. This is consistent with recent studies showing that adiponectin-cre;Akt1;Akt2 mice have severe lipodystrophy while adiponectin-cre;Akt2 mice have only moderately less fat [46], [58]. Surprisingly, skeletal muscle mass in Akt1/Akt2 myf5cKO mice is mostly normal (this study) and loss of Akt1/Akt2 in hepatocytes does not ablate them [83], and while global Akt1−/−;Akt2−/− deletion causes a severe growth deficiency, many tissues develop as some viable Akt1−/−;Akt2−/− mice are born (though they die shortly after) [55]. One note regarding our tamoxifen-inducible double knockout model; it has been shown that tamoxifen administration alone can cause transient lipoatrophy in mice, and additionally can synergize with certain adipocyte-specific gene deletions to cause a synthetic lethal like phenotype in adipose tissue [47], [48], [49]. Though we did not observe obvious lipoatrophy in tamoxifen-treated control mice at the time points examined, we cannot rule out that there is a synergy between tamoxifen and Akt1/Akt2 loss in the double knockout. Nevertheless, the conditional targeting of AKT in adipocytes using an assortment of Cre drivers indicates a uniquely essential function for AKT in adipose tissue growth and likely its maintenance. Sorting out the overlapping and distinct in vivo functions of each AKT isoform remains an important and challenging goal.
4.2. The mTOR complexes, AKT and ChREBP
Conventional models place mTORC2 upstream of all AKT functions. However, this view is oversimplified given the fact that doubly deleting akt1 and akt2 in brown or white fat is far more severe than deleting the essential mTORC2 subunit Rictor (this study) [30], [32], [58]. Moreover, downstream AKT substrate phosphorylation is largely normal in Rictor-deficient adipocytes [30], [32]. Yet, there is phenotypic similarity between Rictormyf5cKO and Akt2myf5cKO mice (which is also apparent when comparing RictoradipoqcKO and Akt2adipoqcKO mice) as both BAT knockouts have reduced Chrebpβ, DNL gene expression, and lipid content [32], [46]. One possibility is that an unidentified AKT pathway linked to DNL may be uniquely dependent upon mTORC2 in adipocytes. Alternatively, mTORC2 and AKT2 loss could converge on DNL and lipid regulation through different mechanisms. Resolving the acute and prolonged effects of mTORC2 loss is important because AKT hydrophobic motif phosphorylation by mTORC2 is a major biomarker of cellular insulin resistance.
Conventional models also place mTORC1 downstream of AKT because AKT can phosphorylate and inhibit TSC2 and PRAS40, both of which negatively regulate mTORC1. Consistently, deleting AKT2 with Myf5-Cre impairs mTORC1 signaling in BAT. However, deleting the essential mTORC1 subunit Raptor with Myf5-Cre results in a severe developmental defect and late embryonic lethality [30] suggesting a broader requirement for mTORC1 in Myf5 lineages. Interestingly, congenitally deleting Raptor with Adiponectin-Cre or Ucp1-Cre reduces WAT and BAT tissue mass, respectively, but not as severely as deleting Akt1/Akt2 [46], [84]. Moreover, AKT2 loss impairs de novo lipogenesis gene expression, while Raptor loss increases de novo lipogenesis gene expression, likely by relieving negative feedback inhibition on AKT signaling [46], [84]. Thus, there are complex relationships between the mTOR complexes, AKT, and metabolism, and our suspicion is that conventional models do not yet depict important pathway, cell, or tissue-specific idiosyncrasies.
The downstream transcriptional targets of AKT action in adipocytes have not been fully defined. In mature brown adipocytes, AKT2 promotes Chrebpβ expression and do novo lipogenesis [46]. Data here and elsewhere also identify ChREBP as a candidate AKT effector in adipocyte differentiation, although other factors are likely involved [59]. One of the other factors could be SREBP [85], [86]. Chrebp whole-body knockout mice show reduced total adiposity [87], consistent with a role for CHREBP in fat growth. However, adipocyte-specific Chrebp deletion has only minor effects on fat mass but reduces glucose uptake and causes insulin resistance [88]. Thus, AKT may regulate glucose transport and insulin sensitivity at least in part through ChREBP, but it may regulate adipocyte cell size through other pathways, such as lipid uptake, TAG synthesis, lipolysis and/or thermogenesis [32], [46], [89], [90]. A BAT-specific ChREBP knockout model has not yet been reported. The continued elucidation of how mTORC2 and AKT signaling control ChREBP activity is essential to fully understanding the mechanisms of adipose tissue growth and insulin resistance.
5. Conclusions
Resolving the tissue-specific biochemical functions of AKT signaling in development and metabolism is important to understanding many human diseases. Using mouse genetics, we define distinct and overlapping functions for AKT1 and AKT2 in brown and white adipose tissue development and show that they are largely dispensable for skeletal muscle development. These findings are particularly relevant to understanding the pathogenesis and prevention of obesity and insulin resistance; thus, future experiments aimed at deciphering the critical AKT targets in fat growth are warranted.
Grants and support
This work was supported by grants from the NIH (R01DK094004 and R01CA196986) and a Leukemia and Lymphoma Society Career Development Award to DAG, and grants by the American Heart Association (15POST25550079and 18CDA34080527) to JSG. CMC was supported by a postdoctoral fellowship from the American Diabetes Association (1-16-PMF-008). SMJ is supported by a postdoctoral fellowship from the American Diabetes Association (1-18-PDF-128).
Author contributions
JSG and DAG conceptualized the study, interpreted data and wrote the manuscript. JSG performed most of the experiments. SMJ performed microscopy for Figure 4, Figure 5. CMC made AKT-iKO-cell lines. HL performed animal colony genotyping and maintenance. All authors approved of the manuscript.
Acknowledgements
The authors thank the following scientists for generously sharing reagents: Dr. Michael Schupp for ChREBP plasmids, Dr. Morrie Birnbaum for Akt1 and 2 floxed mice and Akt3 knockout mice. We would like to thank the Guertin lab for valuable discussions.
Footnotes
Supplementary data to this article can be found online at https://doi.org/10.1016/j.molmet.2019.02.004.
Contributor Information
Joan Sanchez-Gurmaches, Email: juan.sanchezgurmaches@cchmc.org.
David A. Guertin, Email: david.guertin@umassmed.edu.
Conflicts of interest
The authors declare no conflicts of interest.
Appendix A. Supplementary data
The following are the Supplementary data to this article:
figs1.

Figure S1. (A) Tissue weights of Akt1myf5cKO and littermate controls (Akt1 floxed) at 6 weeks old (n = 6, t-test). (B) Tissue weights of Akt2myf5cKO and littermate controls (Akt2 floxed) at 6 weeks old (n = 11, t-test). (C) Tissue weights of Akt3−/− (n = 9), Akt3−/−;Akt1myf5cKO (n = 12) and littermate controls (Akt1 floxed) (n = 3) at 6 weeks old (one-way ANOVA). (D) Tissue weights of Akt1/2myf5cKO and littermate controls (Akt1/2 floxed) at 6 weeks old (n = 5, t-test).
figs2.

Figure S2. Relative muscles and organs weights of Akt1myf5cKO (n = 6) (A), Akt2myf5cKO (n = 11) (BAT), Akt3−/− (n = 9) (C), Akt3−/−;Akt1myf5cKO (n = 12) (C), and Akt1/2myf5cKO (n = 5) (D) and littermate controls (Akt1 floxed, Akt2 floxed, Akt1 floxed, and Akt1/2 floxed, respectively) at 6 weeks old (t-test).
figs3.

Figure S3. (A) Cell size quantification of adipocytes in rWAT from of 6 weeks old myf5-Cre;R26R-mTmG (grey circles), Akt1myf5cKO;R26R-mTmG (blue squares) and Akt2myf5cKO;R26R-mTmG mice (Akt2 deficient as green triangles and Akt2 wildtype as red circles). The number of adipocytes analyzed are: n = 187 for myf5-Cre;R26R-mTmG, n = 152 for Akt1myf5cKO;R26R-mTmG and n = 219 GFP+ and 82 Tomato+ for Akt2myf5cKO;R26R-mTmG. One-way ANOVA was used for statistical analysis. (B) Percentage (average ± SD) of mTFP+ (Red) and mGFP+ (Green) APCs isolated from the indicated depots from 6 weeks old myf5-Cre; R26R-mTmG, Akt1myf5cKO;R26R-mTmG and Akt2myf5cKO;R26R-mTmG mice (n = 3 for myf5-Cre; R26R-mTmG, 2 for Akt1myf5cKO;R26R-mTmG and 4 for Akt2myf5cKO;R26R-mTmG; no statistical analysis was used). A total of 50000 singles were used for this analysis. (C) Western blot of Akt2myf5cKO and control (Akt2 floxed) rWAT after overnight fasting with or without refeeding. (D) Western blot of Akt1myf5cKO, Akt2myf5cKO and control (Akt1 floxed and Akt2 floxed, respectively) quadriceps after overnight fasting with or without refeeding.
figs4.

Figure S4. Relative muscles and organs weights of Akt1/2ucp1cKO and littermate controls (Akt1/2 floxed) at 9 weeks old (n = 9; t-test)) (A), and Akt1/2ucp1ERcKO and littermate controls (Akt1/2 floxed) (n = 10; t-test) (B) at 7 and 9 weeks old.
figs5.

Figure S5. (A) Tissue weights of Akt1/2ucp1cKO and littermate controls (Akt1/2 floxed) at 9 weeks old (n = 9; t-test). (B) Tissue weights of Akt1/2ucp1ERcKO and littermate controls (Akt1/2 floxed) at 7 and 9 weeks old (n = 10; t-test).
figs6.

Figure S6. (A) Western blot analysis of undifferentiated Akt1/Akt2iKO-cells treated with one dose of 4-OHT two days before. (B) Western blot analysis of differentiated Akt1/Akt2iKO-cells treated with 4-OHT before differentiation overexpressing plasmids containing mouse glut1. (C) Oil Red O staining of differentiated Akt1/Akt2iKO-cells treated with 4-OHT before differentiation overexpressing plasmids containing mouse glut1. (D) qPCR analysis of differentiated Akt1/Akt2iKO-cells treated with 4-OHT before differentiation (n = 3; t-test).
References
- 1.Czech M.P. Insulin action and resistance in obesity and type 2 diabetes. Nat Med. 2017;23(7):804–814. doi: 10.1038/nm.4350. [DOI] [PMC free article] [PubMed] [Google Scholar]
- 2.Gonzalez-Muniesa P., Martinez-Gonzalez M.A., Hu F.B., Despres J.P., Matsuzawa Y., Loos R.J.F. Obesity. Nat Rev Dis Primers. 2017;3:17034. doi: 10.1038/nrdp.2017.34. [DOI] [PubMed] [Google Scholar]
- 3.Betz M.J., Enerback S. Targeting thermogenesis in brown fat and muscle to treat obesity and metabolic disease. Nature Reviews Endocrinology. 2018;14(2):77–87. doi: 10.1038/nrendo.2017.132. [DOI] [PubMed] [Google Scholar]
- 4.Blondin D.P., Labbe S.M., Tingelstad H.C., Noll C., Kunach M., Phoenix S. Increased brown adipose tissue oxidative capacity in cold-acclimated humans. Journal of Clinical Endocrinology & Metabolism. 2014;99(3):E438–E446. doi: 10.1210/jc.2013-3901. [DOI] [PMC free article] [PubMed] [Google Scholar]
- 5.Hanssen M.J., Hoeks J., Brans B., van der Lans A.A., Schaart G., van den Driessche J.J. Short-term cold acclimation improves insulin sensitivity in patients with type 2 diabetes mellitus. Nature Medicine. 2015;21(8):863–865. doi: 10.1038/nm.3891. [DOI] [PubMed] [Google Scholar]
- 6.Ouellet V., Labbe S.M., Blondin D.P., Phoenix S., Guerin B., Haman F. Brown adipose tissue oxidative metabolism contributes to energy expenditure during acute cold exposure in humans. Journal of Clinical Investigation. 2012;122(2):545–552. doi: 10.1172/JCI60433. [DOI] [PMC free article] [PubMed] [Google Scholar]
- 7.Pfannenberg C., Werner M.K., Ripkens S., Stef I., Deckert A., Schmadl M. Impact of age on the relationships of brown adipose tissue with sex and adiposity in humans. Diabetes. 2010;59(7):1789–1793. doi: 10.2337/db10-0004. [DOI] [PMC free article] [PubMed] [Google Scholar]
- 8.Saito M., Okamatsu-Ogura Y., Matsushita M., Watanabe K., Yoneshiro T., Nio-Kobayashi J. High incidence of metabolically active brown adipose tissue in healthy adult humans: effects of cold exposure and adiposity. Diabetes. 2009;58(7):1526–1531. doi: 10.2337/db09-0530. [DOI] [PMC free article] [PubMed] [Google Scholar]
- 9.van der Lans A.A., Hoeks J., Brans B., Vijgen G.H., Visser M.G., Vosselman M.J. Cold acclimation recruits human brown fat and increases nonshivering thermogenesis. Journal of Clinical Investigation. 2013;123(8):3395–3403. doi: 10.1172/JCI68993. [DOI] [PMC free article] [PubMed] [Google Scholar]
- 10.Vijgen G.H., Bouvy N.D., Teule G.J., Brans B., Schrauwen P., van Marken Lichtenbelt W.D. Brown adipose tissue in morbidly obese subjects. PLoS One. 2011;6(2) doi: 10.1371/journal.pone.0017247. [DOI] [PMC free article] [PubMed] [Google Scholar]
- 11.Yoneshiro T., Aita S., Matsushita M., Kameya T., Nakada K., Kawai Y. Brown adipose tissue, whole-body energy expenditure, and thermogenesis in healthy adult men. Obesity (Silver Spring) 2011;19(1):13–16. doi: 10.1038/oby.2010.105. [DOI] [PubMed] [Google Scholar]
- 12.Yoneshiro T., Aita S., Matsushita M., Kameya T., Nakada K., Kawai Y. Brown adipose tissue, whole-body energy expenditure, and thermogenesis in healthy adult men. Obesity. 2011;19(1):13–16. doi: 10.1038/oby.2010.105. [DOI] [PubMed] [Google Scholar]
- 13.Yoneshiro T., Aita S., Matsushita M., Kayahara T., Kameya T., Kawai Y. Recruited brown adipose tissue as an antiobesity agent in humans. Journal of Clinical Investigation. 2013;123(8):3404–3408. doi: 10.1172/JCI67803. [DOI] [PMC free article] [PubMed] [Google Scholar]
- 14.Yoneshiro T., Saito M. Activation and recruitment of brown adipose tissue as anti-obesity regimens in humans. Annals of Medicine. 2015;47(2):133–141. doi: 10.3109/07853890.2014.911595. [DOI] [PubMed] [Google Scholar]
- 15.Harms M., Seale P. Brown and beige fat: development, function and therapeutic potential. Nat Med. 2013;19(10):1252–1263. doi: 10.1038/nm.3361. [DOI] [PubMed] [Google Scholar]
- 16.Lynes M.D., Tseng Y.H. Deciphering adipose tissue heterogeneity. Annals of the New York Academy of Sciences. 2018;1411(1):5–20. doi: 10.1111/nyas.13398. [DOI] [PMC free article] [PubMed] [Google Scholar]
- 17.Sanchez-Gurmaches J., Hung C.M., Guertin D.A. Emerging complexities in adipocyte origins and identity. Trends in Cell Biology. 2016;26(5):313–326. doi: 10.1016/j.tcb.2016.01.004. [DOI] [PMC free article] [PubMed] [Google Scholar]
- 18.Sanchez-Gurmaches J., Guertin D.A. Adipocytes arise from multiple lineages that are heterogeneously and dynamically distributed. Nature Communications. 2014;5:4099. doi: 10.1038/ncomms5099. [DOI] [PMC free article] [PubMed] [Google Scholar]
- 19.Sanchez-Gurmaches J., Hung C.M., Sparks C.A., Tang Y., Li H., Guertin D.A. PTEN loss in the Myf5 lineage redistributes body fat and reveals subsets of white adipocytes that arise from Myf5 precursors. Cell Metabolism. 2012;16(3):348–362. doi: 10.1016/j.cmet.2012.08.003. [DOI] [PMC free article] [PubMed] [Google Scholar]
- 20.Berry D.C., Jiang Y., Graff J.M. Mouse strains to study cold-inducible beige progenitors and beige adipocyte formation and function. Nature Communications. 2016;7:10184. doi: 10.1038/ncomms10184. [DOI] [PMC free article] [PubMed] [Google Scholar]
- 21.Lynes M.D., Schulz T.J., Pan A.J., Tseng Y.H. Disruption of insulin signaling in Myf5-expressing progenitors leads to marked paucity of brown fat but normal muscle development. Endocrinology. 2015;156(5):1637–1647. doi: 10.1210/en.2014-1773. [DOI] [PMC free article] [PubMed] [Google Scholar]
- 22.Seale P., Bjork B., Yang W., Kajimura S., Chin S., Kuang S. PRDM16 controls a brown fat/skeletal muscle switch. Nature. 2008;454(7207):961–967. doi: 10.1038/nature07182. [DOI] [PMC free article] [PubMed] [Google Scholar]
- 23.Wang W., Kissig M., Rajakumari S., Huang L., Lim H.W., Won K.J. Ebf2 is a selective marker of brown and beige adipogenic precursor cells. Proceedings of the National Academy of Sciences of the United States of America. 2014;111(40):14466–14471. doi: 10.1073/pnas.1412685111. [DOI] [PMC free article] [PubMed] [Google Scholar]
- 24.Chau Y.Y., Bandiera R., Serrels A., Martinez-Estrada O.M., Qing W., Lee M. Visceral and subcutaneous fat have different origins and evidence supports a mesothelial source. Nature Cell Biology. 2014;16(4):367–375. doi: 10.1038/ncb2922. [DOI] [PMC free article] [PubMed] [Google Scholar]
- 25.Krueger K.C., Costa M.J., Du H., Feldman B.J. Characterization of Cre recombinase activity for in vivo targeting of adipocyte precursor cells. Stem Cell Reports. 2014;3(6):1147–1158. doi: 10.1016/j.stemcr.2014.10.009. [DOI] [PMC free article] [PubMed] [Google Scholar]
- 26.Sanchez-Gurmaches J., Hsiao W.Y., Guertin D.A. Highly selective in vivo labeling of subcutaneous white adipocyte precursors with Prx1-Cre. Stem Cell Reports. 2015;4(4):541–550. doi: 10.1016/j.stemcr.2015.02.008. [DOI] [PMC free article] [PubMed] [Google Scholar]
- 27.Enzi G., Busetto L., Sergi G., Coin A., Inelmen E.M., Vindigni V. Multiple symmetric lipomatosis: a rare disease and its possible links to brown adipose tissue. Nutrition, Metabolism, and Cardiovascular Diseases. 2015;25(4):347–353. doi: 10.1016/j.numecd.2015.01.010. [DOI] [PubMed] [Google Scholar]
- 28.Lee P.L., Jung S.M., Guertin D.A. The complex roles of mechanistic target of rapamycin in adipocytes and beyond. Trends in Endocrinology and Metabolism. 2017;28(5):319–339. doi: 10.1016/j.tem.2017.01.004. [DOI] [PMC free article] [PubMed] [Google Scholar]
- 29.Saxton R.A., Sabatini D.M. mTOR signaling in growth, metabolism, and disease. Cell. 2017;169(2):361–371. doi: 10.1016/j.cell.2017.03.035. [DOI] [PubMed] [Google Scholar]
- 30.Hung C.M., Calejman C.M., Sanchez-Gurmaches J., Li H., Clish C.B., Hettmer S. Rictor/mTORC2 loss in the Myf5 lineage reprograms brown fat metabolism and protects mice against obesity and metabolic disease. Cell Reports. 2014;8(1):256–271. doi: 10.1016/j.celrep.2014.06.007. [DOI] [PMC free article] [PubMed] [Google Scholar]
- 31.Sarbassov D.D., Guertin D.A., Ali S.M., Sabatini D.M. Phosphorylation and regulation of Akt/PKB by the rictor-mTOR complex. Science. 2005;307(5712):1098–1101. doi: 10.1126/science.1106148. [DOI] [PubMed] [Google Scholar]
- 32.Tang Y., Wallace M., Sanchez-Gurmaches J., Hsiao W.Y., Li H., Lee P.L. Adipose tissue mTORC2 regulates ChREBP-driven de novo lipogenesis and hepatic glucose metabolism. Nature Communications. 2016;7:11365. doi: 10.1038/ncomms11365. [DOI] [PMC free article] [PubMed] [Google Scholar]
- 33.Albert V., Svensson K., Shimobayashi M., Colombi M., Munoz S., Jimenez V. mTORC2 sustains thermogenesis via Akt-induced glucose uptake and glycolysis in brown adipose tissue. EMBO Molecular Medicine. 2016;8(3):232–246. doi: 10.15252/emmm.201505610. [DOI] [PMC free article] [PubMed] [Google Scholar]
- 34.Hagiwara A., Cornu M., Cybulski N., Polak P., Betz C., Trapani F. Hepatic mTORC2 activates glycolysis and lipogenesis through Akt, glucokinase, and SREBP1c. Cell Metabolism. 2012;15(5):725–738. doi: 10.1016/j.cmet.2012.03.015. [DOI] [PubMed] [Google Scholar]
- 35.Lamming D.W., Demirkan G., Boylan J.M., Mihaylova M.M., Peng T., Ferreira J. Hepatic signaling by the mechanistic target of rapamycin complex 2 (mTORC2) The FASEB Journal. 2014;28(1):300–315. doi: 10.1096/fj.13-237743. [DOI] [PMC free article] [PubMed] [Google Scholar]
- 36.Gonzalez E., McGraw T.E. The Akt kinases: isoform specificity in metabolism and cancer. Cell Cycle. 2009;8(16):2502–2508. doi: 10.4161/cc.8.16.9335. [DOI] [PMC free article] [PubMed] [Google Scholar]
- 37.Moore S.F., Hunter R.W., Hers I. mTORC2 protein complex-mediated Akt (Protein Kinase B) Serine 473 Phosphorylation is not required for Akt1 activity in human platelets [corrected] Journal of Biological Chemistry. 2011;286(28):24553–24560. doi: 10.1074/jbc.M110.202341. [DOI] [PMC free article] [PubMed] [Google Scholar]
- 38.Kumar A., Harris T.E., Keller S.R., Choi K.M., Magnuson M.A., Lawrence J.C., Jr. Muscle-specific deletion of rictor impairs insulin-stimulated glucose transport and enhances Basal glycogen synthase activity. Molecular and Cellular Biology. 2008;28(1):61–70. doi: 10.1128/MCB.01405-07. [DOI] [PMC free article] [PubMed] [Google Scholar]
- 39.Kumar A., Lawrence J.C., Jr., Jung D.Y., Ko H.J., Keller S.R., Kim J.K. Fat cell-specific ablation of rictor in mice impairs insulin-regulated fat cell and whole-body glucose and lipid metabolism. Diabetes. 2010;59(6):1397–1406. doi: 10.2337/db09-1061. [DOI] [PMC free article] [PubMed] [Google Scholar]
- 40.Guertin D.A., Stevens D.M., Thoreen C.C., Burds A.A., Kalaany N.Y., Moffat J. Ablation in mice of the mTORC components raptor, rictor, or mLST8 reveals that mTORC2 is required for signaling to Akt-FOXO and PKCalpha, but not S6K1. Developmental Cell. 2006;11(6):859–871. doi: 10.1016/j.devcel.2006.10.007. [DOI] [PubMed] [Google Scholar]
- 41.Shiota C., Woo J.T., Lindner J., Shelton K.D., Magnuson M.A. Multiallelic disruption of the rictor gene in mice reveals that mTOR complex 2 is essential for fetal growth and viability. Developmental Cell. 2006;11(4):583–589. doi: 10.1016/j.devcel.2006.08.013. [DOI] [PubMed] [Google Scholar]
- 42.Jacinto E., Facchinetti V., Liu D., Soto N., Wei S., Jung S.Y. SIN1/MIP1 maintains rictor-mTOR complex integrity and regulates Akt phosphorylation and substrate specificity. Cell. 2006;127(1):125–137. doi: 10.1016/j.cell.2006.08.033. [DOI] [PubMed] [Google Scholar]
- 43.Bae S.S., Cho H., Mu J., Birnbaum M.J. Isoform-specific regulation of insulin-dependent glucose uptake by Akt/protein kinase B. Journal of Biological Chemistry. 2003;278(49):49530–49536. doi: 10.1074/jbc.M306782200. [DOI] [PubMed] [Google Scholar]
- 44.Baudry A., Yang Z.Z., Hemmings B.A. PKBalpha is required for adipose differentiation of mouse embryonic fibroblasts. Journal of Cell Science. 2006;119(Pt 5):889–897. doi: 10.1242/jcs.02792. [DOI] [PubMed] [Google Scholar]
- 45.Rosenwald M., Perdikari A., Rulicke T., Wolfrum C. Bi-directional interconversion of brite and white adipocytes. Nature Cell Biology. 2013;15(6):659–667. doi: 10.1038/ncb2740. [DOI] [PubMed] [Google Scholar]
- 46.Sanchez-Gurmaches J., Tang Y., Jespersen N.Z., Wallace M., Martinez Calejman C., Gujja S. Brown fat AKT2 is a cold-induced kinase that stimulates ChREBP-mediated de novo lipogenesis to optimize fuel storage and thermogenesis. Cell Metabolism. 2018;27(1):195–209 e6. doi: 10.1016/j.cmet.2017.10.008. [DOI] [PMC free article] [PubMed] [Google Scholar]
- 47.Ye R., Wang Q.A., Tao C., Vishvanath L., Shao M., McDonald J.G. Impact of tamoxifen on adipocyte lineage tracing: inducer of adipogenesis and prolonged nuclear translocation of Cre recombinase. Molecular metabolism. 2015;4(11):771–778. doi: 10.1016/j.molmet.2015.08.004. [DOI] [PMC free article] [PubMed] [Google Scholar]
- 48.Liu L., Zou P., Zheng L., Linarelli L.E., Amarell S., Passaro A. Tamoxifen reduces fat mass by boosting reactive oxygen species. Cell Death & Disease. 2015;6:e1586. doi: 10.1038/cddis.2014.553. [DOI] [PMC free article] [PubMed] [Google Scholar]
- 49.Zhao L., Wang B., Gomez N.A., de Avila J.M., Zhu M.J., Du M. Even a low dose of tamoxifen profoundly induces adipose tissue browning in female mice. International Journal of Obesity (Lond) 2019 doi: 10.1038/s41366-019-0330-3. [DOI] [PMC free article] [PubMed] [Google Scholar]
- 50.Muzumdar M.D., Tasic B., Miyamichi K., Li L., Luo L. A global double-fluorescent Cre reporter mouse. Genesis. 2007;45(9):593–605. doi: 10.1002/dvg.20335. [DOI] [PubMed] [Google Scholar]
- 51.Berry R., Rodeheffer M.S. Characterization of the adipocyte cellular lineage in vivo. Nature Cell Biology. 2013;15(3):302–308. doi: 10.1038/ncb2696. [DOI] [PMC free article] [PubMed] [Google Scholar]
- 52.Dummler B., Hemmings B.A. Physiological roles of PKB/Akt isoforms in development and disease. Biochemical Society Transactions. 2007;35(Pt 2):231–235. doi: 10.1042/BST0350231. [DOI] [PubMed] [Google Scholar]
- 53.Dummler B., Tschopp O., Hynx D., Yang Z.Z., Dirnhofer S., Hemmings B.A. Life with a single isoform of Akt: mice lacking Akt2 and Akt3 are viable but display impaired glucose homeostasis and growth deficiencies. Molecular and Cellular Biology. 2006;26(21):8042–8051. doi: 10.1128/MCB.00722-06. [DOI] [PMC free article] [PubMed] [Google Scholar]
- 54.Yang Z.Z., Tschopp O., Di-Poi N., Bruder E., Baudry A., Dummler B. Dosage-dependent effects of Akt1/protein kinase Balpha (PKBalpha) and Akt3/PKBgamma on thymus, skin, and cardiovascular and nervous system development in mice. Molecular and Cellular Biology. 2005;25(23):10407–10418. doi: 10.1128/MCB.25.23.10407-10418.2005. [DOI] [PMC free article] [PubMed] [Google Scholar]
- 55.Peng X.D., Xu P.Z., Chen M.L., Hahn-Windgassen A., Skeen J., Jacobs J. Dwarfism, impaired skin development, skeletal muscle atrophy, delayed bone development, and impeded adipogenesis in mice lacking Akt1 and Akt2. Genes. 2003;Dev17(11):1352–1365. doi: 10.1101/gad.1089403. [DOI] [PMC free article] [PubMed] [Google Scholar]
- 56.Cho H., Mu J., Kim J.K., Thorvaldsen J.L., Chu Q., Crenshaw E.B., 3rd Insulin resistance and a diabetes mellitus-like syndrome in mice lacking the protein kinase Akt2 (PKB beta) Science. 2001;292(5522):1728–1731. doi: 10.1126/science.292.5522.1728. [DOI] [PubMed] [Google Scholar]
- 57.Cho H., Thorvaldsen J.L., Chu Q., Feng F., Birnbaum M.J. Akt1/PKBalpha is required for normal growth but dispensable for maintenance of glucose homeostasis in mice. Journal of Biological Chemistry. 2001;276(42):38349–38352. doi: 10.1074/jbc.C100462200. [DOI] [PubMed] [Google Scholar]
- 58.Shearin A.L., Monks B.R., Seale P., Birnbaum M.J. Lack of AKT in adipocytes causes severe lipodystrophy. Molecular metabolism. 2016;5(7):472–479. doi: 10.1016/j.molmet.2016.05.006. [DOI] [PMC free article] [PubMed] [Google Scholar]
- 59.Witte N., Muenzner M., Rietscher J., Knauer M., Heidenreich S., Nuotio-Antar A.M. The glucose sensor ChREBP links de novo lipogenesis to PPARgamma activity and adipocyte differentiation. Endocrinology. 2015;156(11):4008–4019. doi: 10.1210/EN.2015-1209. [DOI] [PubMed] [Google Scholar]
- 60.Kuhajda F.P., Pizer E.S., Li J.N., Mani N.S., Frehywot G.L., Townsend C.A. Synthesis and antitumor activity of an inhibitor of fatty acid synthase. Proceedings of the National Academy of Sciences of the United States of America. 2000;97(7):3450–3454. doi: 10.1073/pnas.050582897. [DOI] [PMC free article] [PubMed] [Google Scholar]
- 61.Thupari J.N., Kim E.K., Moran T.H., Ronnett G.V., Kuhajda F.P. Chronic C75 treatment of diet-induced obese mice increases fat oxidation and reduces food intake to reduce adipose mass. American Journal of Physiology. Endocrinology and Metabolism. 2004;287(1):E97–E104. doi: 10.1152/ajpendo.00261.2003. [DOI] [PubMed] [Google Scholar]
- 62.Schmid B., Rippmann J.F., Tadayyon M., Hamilton B.S. Inhibition of fatty acid synthase prevents preadipocyte differentiation. Biochemical and Biophysical Research Communications. 2005;328(4):1073–1082. doi: 10.1016/j.bbrc.2005.01.067. [DOI] [PubMed] [Google Scholar]
- 63.Liu L.H., Wang X.K., Hu Y.D., Kang J.L., Wang L.L., Li S. Effects of a fatty acid synthase inhibitor on adipocyte differentiation of mouse 3T3-L1 cells. Acta Pharmacologica Sinica. 2004;25(8):1052–1057. [PubMed] [Google Scholar]
- 64.Tajbakhsh S., Buckingham M.E. Lineage restriction of the myogenic conversion factor myf-5 in the brain. Development. 1995;121(12):4077–4083. doi: 10.1242/dev.121.12.4077. [DOI] [PubMed] [Google Scholar]
- 65.Daubas P., Tajbakhsh S., Hadchouel J., Primig M., Buckingham M. Myf5 is a novel early axonal marker in the mouse brain and is subjected to post-transcriptional regulation in neurons. Development. 2000;127(2):319–331. doi: 10.1242/dev.127.2.319. [DOI] [PubMed] [Google Scholar]
- 66.Zhang C., Rexrode K.M., van Dam R.M., Li T.Y., Hu F.B. Abdominal obesity and the risk of all-cause, cardiovascular, and cancer mortality - sixteen years of follow-up in US women. Circulation. 2008;117(13):1658–1667. doi: 10.1161/CIRCULATIONAHA.107.739714. [DOI] [PubMed] [Google Scholar]
- 67.Baik I., Ascherio A., Rimm E.B., Giovannucci E., Spiegelman D., Stampfer M.J. Adiposity and mortality in men. American Journal of Epidemiology. 2000;152(3):264–271. doi: 10.1093/aje/152.3.264. [DOI] [PubMed] [Google Scholar]
- 68.Pischon T., Boeing H., Hoffmann K., Bergmann M., Schulze M.B., Overvad K. General and abdominal adiposity and risk of death in Europe. New England Journal of Medicine. 2008;359(20):2105–2120. doi: 10.1056/NEJMoa0801891. [DOI] [PubMed] [Google Scholar]
- 69.Kloting N., Fasshauer M., Dietrich A., Kovacs P., Schon M.R., Kern M. Insulin-sensitive obesity. American Journal of Physiology. Endocrinology and Metabolism. 2010;299(3):E506–E515. doi: 10.1152/ajpendo.00586.2009. [DOI] [PubMed] [Google Scholar]
- 70.Schiaffino S., Mammucari C. Regulation of skeletal muscle growth by the IGF1-Akt/PKB pathway: insights from genetic models. Skeletal Muscle. 2011;1(1):4. doi: 10.1186/2044-5040-1-4. [DOI] [PMC free article] [PubMed] [Google Scholar]
- 71.Stitt T.N., Drujan D., Clarke B.A., Panaro F., Timofeyva Y., Kline W.O. The IGF-1/PI3K/Akt pathway prevents expression of muscle atrophy-induced ubiquitin ligases by inhibiting FOXO transcription factors. Molecular Cell. 2004;14(3):395–403. doi: 10.1016/s1097-2765(04)00211-4. [DOI] [PubMed] [Google Scholar]
- 72.Bodine S.C., Stitt T.N., Gonzalez M., Kline W.O., Stover G.L., Bauerlein R. Akt/mTOR pathway is a crucial regulator of skeletal muscle hypertrophy and can prevent muscle atrophy in vivo. Nature Cell Biology. 2001;3(11):1014–1019. doi: 10.1038/ncb1101-1014. [DOI] [PubMed] [Google Scholar]
- 73.Blaauw B., Canato M., Agatea L., Toniolo L., Mammucari C., Masiero E. Inducible activation of Akt increases skeletal muscle mass and force without satellite cell activation. The FASEB Journal. 2009;23(11):3896–3905. doi: 10.1096/fj.09-131870. [DOI] [PubMed] [Google Scholar]
- 74.Lai K.M., Gonzalez M., Poueymirou W.T., Kline W.O., Na E., Zlotchenko E. Conditional activation of akt in adult skeletal muscle induces rapid hypertrophy. Molecular and Cellular Biology. 2004;24(21):9295–9304. doi: 10.1128/MCB.24.21.9295-9304.2004. [DOI] [PMC free article] [PubMed] [Google Scholar]
- 75.Izumiya Y., Hopkins T., Morris C., Sato K., Zeng L., Viereck J. Fast/Glycolytic muscle fiber growth reduces fat mass and improves metabolic parameters in obese mice. Cell Metabolism. 2008;7(2):159–172. doi: 10.1016/j.cmet.2007.11.003. [DOI] [PMC free article] [PubMed] [Google Scholar]
- 76.Chen W.S., Xu P.Z., Gottlob K., Chen M.L., Sokol K., Shiyanova T. Growth retardation and increased apoptosis in mice with homozygous disruption of the Akt1 gene. Genes & Development. 2001;15(17):2203–2208. doi: 10.1101/gad.913901. [DOI] [PMC free article] [PubMed] [Google Scholar]
- 77.Yun S.J., Kim E.K., Tucker D.F., Kim C.D., Birnbaum M.J., Bae S.S. Isoform-specific regulation of adipocyte differentiation by Akt/protein kinase Balpha. Biochemical and Biophysical Research Communications. 2008;371(1):138–143. doi: 10.1016/j.bbrc.2008.04.029. [DOI] [PubMed] [Google Scholar]
- 78.Kajno E., McGraw T.E., Gonzalez E. Development of a new model system to dissect isoform specific Akt signalling in adipocytes. Biochemical Journal. 2015;468(3):425–434. doi: 10.1042/BJ20150191. [DOI] [PMC free article] [PubMed] [Google Scholar]
- 79.Yao Y., Suraokar M., Darnay B.G., Hollier B.G., Shaiken T.E., Asano T. BSTA promotes mTORC2-mediated phosphorylation of Akt1 to suppress expression of FoxC2 and stimulate adipocyte differentiation. Science Signaling. 2013;6(257):ra2. doi: 10.1126/scisignal.2003295. [DOI] [PMC free article] [PubMed] [Google Scholar]
- 80.Jeffery E., Church C.D., Holtrup B., Colman L., Rodeheffer M.S. Rapid depot-specific activation of adipocyte precursor cells at the onset of obesity. Nature Cell Biology. 2015;17(4):376–385. doi: 10.1038/ncb3122. [DOI] [PMC free article] [PubMed] [Google Scholar]
- 81.Garofalo R.S., Orena S.J., Rafidi K., Torchia A.J., Stock J.L., Hildebrandt A.L. Severe diabetes, age-dependent loss of adipose tissue, and mild growth deficiency in mice lacking Akt2/PKB beta. Journal of Clinical Investigation. 2003;112(2):197–208. doi: 10.1172/JCI16885. [DOI] [PMC free article] [PubMed] [Google Scholar]
- 82.George S., Rochford J.J., Wolfrum C., Gray S.L., Schinner S., Wilson J.C. A family with severe insulin resistance and diabetes due to a mutation in AKT2. Science. 2004;304(5675):1325–1328. doi: 10.1126/science.1096706. [DOI] [PMC free article] [PubMed] [Google Scholar]
- 83.Lu M., Wan M., Leavens K.F., Chu Q., Monks B.R., Fernandez S. Insulin regulates liver metabolism in vivo in the absence of hepatic Akt and Foxo1. Nat Med. 2012;18(3):388–395. doi: 10.1038/nm.2686. [DOI] [PMC free article] [PubMed] [Google Scholar]
- 84.Lee P.L., Tang Y., Li H., Guertin D.A. Raptor/mTORC1 loss in adipocytes causes progressive lipodystrophy and fatty liver disease. Molecular metabolism. 2016;5(6):422–432. doi: 10.1016/j.molmet.2016.04.001. [DOI] [PMC free article] [PubMed] [Google Scholar]
- 85.Krycer J.R., Sharpe L.J., Luu W., Brown A.J. The Akt-SREBP nexus: cell signaling meets lipid metabolism. Trends in Endocrinology and Metabolism. 2010;21(5):268–276. doi: 10.1016/j.tem.2010.01.001. [DOI] [PubMed] [Google Scholar]
- 86.Kim J.B., Spiegelman B.M. ADD1/SREBP1 promotes adipocyte differentiation and gene expression linked to fatty acid metabolism. Genes & Development. 1996;10(9):1096–1107. doi: 10.1101/gad.10.9.1096. [DOI] [PubMed] [Google Scholar]
- 87.Iizuka K., Bruick R.K., Liang G., Horton J.D., Uyeda K. Deficiency of carbohydrate response element-binding protein (ChREBP) reduces lipogenesis as well as glycolysis. Proceedings of the National Academy of Sciences of the United States of America. 2004;101(19):7281–7286. doi: 10.1073/pnas.0401516101. [DOI] [PMC free article] [PubMed] [Google Scholar]
- 88.Vijayakumar A., Aryal P., Wen J., Syed I., Vazirani R.P., Moraes-Vieira P.M. Absence of carbohydrate response element binding protein in adipocytes causes systemic insulin resistance and impairs glucose transport. Cell Reports. 2017;21(4):1021–1035. doi: 10.1016/j.celrep.2017.09.091. [DOI] [PMC free article] [PubMed] [Google Scholar]
- 89.DiPilato L.M., Ahmad F., Harms M., Seale P., Manganiello V., Birnbaum M.J. The role of PDE3B phosphorylation in the inhibition of lipolysis by insulin. Molecular and Cellular Biology. 2015;35(16):2752–2760. doi: 10.1128/MCB.00422-15. [DOI] [PMC free article] [PubMed] [Google Scholar]
- 90.Koren S., DiPilato L.M., Emmett M.J., Shearin A.L., Chu Q., Monks B. The role of mouse Akt2 in insulin-dependent suppression of adipocyte lipolysis in vivo. Diabetologia. 2015;58(5):1063–1070. doi: 10.1007/s00125-015-3532-9. [DOI] [PMC free article] [PubMed] [Google Scholar]
Associated Data
This section collects any data citations, data availability statements, or supplementary materials included in this article.