

Abstract
Background
Despite revascularisation, a large proportion of acute coronary syndrome (ACS) patients continue to experience major adverse cardiovascular events (MACEs), which are worsened by diabetes mellitus (DM). Fibrinogen (FIB) is a risk factor for MACEs in coronary artery disease and often elevated in DM. However, the relationships between FIB, glucose metabolism (haemoglobin A1c [HbA1c] and fasting blood glucose [FBG]) and MACEs following percutaneous coronary intervention (PCI) in DM, non-DM or whole patients with ACS remains unknown.
Methods
A total of 411 ACS patients undergoing PCI were enrolled in this study. We compared baseline FIB levels between DM (n = 103) and non-DM (n = 308) patients and divided participants into three groups according to FIB level, i.e. FIB-L, FIB-M and FIB-H, to compare baseline characteristics and MACEs. Linear regression analysis of the relationship between glucose metabolism and FIB, Cox regression, survival and landmark analyses of MACEs were also performed over a median of 27.55 months of follow-up.
Results
Patients with DM had higher FIB levels than non-DM patients (3.56 ± 0.99 mg/dL vs. 3.34 ± 0.80 mg/dL, P < 0.05). HbA1c and FBG were significantly positively correlated with FIB in whole and DM patients but not in non-DM patients (all P < 0.05). Compared with the FIB-L group, the FIB-M (hazard ratio [HR] 1.797, 95% CI 1.117–2.892, P = 0.016) and FIB-H (HR 1.664, 95% CI 1.002–2.763, P = 0.049) groups were associated with higher MACEs in whole; the FIB-M (HR 7.783, 95% CI 1.012–59.854, P = 0.049) was associated with higher MACEs in DM patients. FIB was not associated with MACEs in non-DM patients. During landmark analysis, FIB showed better predictive value for MACEs after PCI in the first 30 months of follow up than in the subsequent period.
Conclusion
In this study from China, FIB was positively associated with glucose metabolism (HbA1c and FBG) in whole and DM populations with ACS. Moreover, elevated baseline FIB levels may be an important and independent predictor of MACEs following PCI, especially amongst those with DM. However, as the follow-up period increased, the baseline FIB levels lost their ability to predict MACEs.
Keywords: Fibrinogen, Diabetes mellitus, HbA1c, Fasting blood glucose, Percutaneous coronary intervention, Acute coronary syndromes, Major adverse cardiovascular events
Background
Coronary artery disease (CAD) is the leading cause of morbidity and mortality in developed countries. At present, the global burden of cardiovascular disease has shifted toward low- and middle-income countries (including China), wherein over 80% of global cardiovascular deaths occur [1, 2]. Revascularisation and antithrombotic strategies have achieved great success in reducing mortality from acute coronary syndromes (ACS), but the results remain unsatisfactory, especially amongst diabetic patients [3–7].
Fibrinogen (FIB) is an important part of the coagulation pathway and combines with receptors on the platelet membrane to form acute coronary thrombosis [8, 9]. As an acute phase reactant of inflammation, FIB is associated with long-term major adverse cardiovascular events (MACE) after percutaneous coronary intervention (PCI) [10, 11]. Previous studies show that FIB levels are higher in patients with diabetic mellitus (DM) than in controls, which may contribute to the higher thrombotic status of patients with the disease relative to those without [12, 13]. Amongst patients with acute myocardial infarction (AMI), admission haemoglobin A1c (HbA1c) is an important predictor of the severity of coronary artery stenosis in non-DM and DM patients [14]. However, few reports have investigated the relationship between baseline FIB levels, glucose metabolism (HbA1c and fasting blood glucose [FBG]) and MACEs in the ACS population after PCI with or without DM; of the studies available, very few originate in China.
The present study was performed to determine the relationship between baseline FIB levels and HbA1c or FBG and explore the role of baseline FIB levels with 2-year MACEs following PCI in ACS patients with or without DM in China.
Materials and methods
Study design and participants
This report presents a single-centre, prospective, observational, non-randomised and non-blind cohort study. Consecutive patients who were diagnosed with ACS and underwent PCI in the First Affiliated Hospital of Medical College of Xi’an Jiaotong University between January 2013 and February 2014 were enrolled in this investigation. The inclusion criteria were a diagnosis of ACS, including unstable angina (UA), non-ST-segment elevation myocardial infarction (NSTEMI) and STEMI. The exclusion criteria were as follows: severe renal and liver diseases, severe infections, immune system diseases, malignant tumours, blood system diseases, pregnancy, severe cerebrovascular diseases and prior history of surgical treatment within 2 weeks of this study.
ACS and DM were defined based on the criteria by the American Cardiology College and the American Diabetes Association [15, 16]. Composite end points, including all-cause death, non-fatal AMI, urgent coronary revascularisation, UA and cerebrovascular events (including cerebral bleeding or ischemic stroke), were defined as MACEs [17]. Patients underwent follow-up through personal or telephone interviews or reviews of medical records in our hospital until March 31, 2016; follow-up ended on the date of the first MACE occurrence. A total of 411 subjects who completed the follow-up were enrolled in the current study (median follow-up time, 27.55 months). Written informed consent was obtained from all study participants, and the study was approved by the ethics committee of the First Affiliated Hospital of Xi’an Jiaotong University (Ethical approval number: XJTU1AF2012LSK-312).
Assessment of HbA1c and FIB
Peripheral blood samples were obtained from patients in a fasting state early in the morning after admission to the hospital prior to PCI. Baseline laboratory measurements, including complete blood count, creatinine, complete lipid panel, FIB, FBG and HbA1c, were performed at the biochemistry centre of our hospital by using standard biochemical techniques. The principle of Clauss coagulation was used to measure FIB levels: when the concentration of thrombin is high, the clotting time of the diluted plasma to be tested is inversely proportional to the level of FIB.
Statistical analysis
Statistical analyses were performed by using SPSS 18.0 (SPSS Inc, Chicago, IL) and EmpowerStats (http://www.empowerstats.com/). Data are presented as frequencies and percentages for categorical variables and as mean ± SD for continuous variables. Variables of interest were compared using Student’s t-test, one-way ANOVA or the Chi squared test as appropriate. Linear regression analysis was used to calculate the correlation between HbA1c (or FBG) and FIB. We used Cox regression analysis to calculate HRs and 95% confidence intervals (CIs) for MACE comparisons. Landmark analyses (EmpowerStats) were performed according to a landmark point of the 30th month. HRs and 95% CIs were calculated separately for events occurring up to 30 months and those between the 31st month and the end of follow-up. A value of P < 0.05 was considered statistically significant.
Results
Basic characteristics of patients with and without DM
A total of 411 subjects who completed the follow-up were enrolled in the current study (median follow-up time, 27.55 months). The baseline characteristics of the DM, non-DM and whole patients are shown in Table 1.
Table 1.
Basic characteristics for patients with DM, without DM and whole
| Variable | Whole (n = 411) | Non-DM (n = 308) | DM (n = 103) | P value |
|---|---|---|---|---|
| FIB, mg/dL | 3.39 ± 0.94 | 3.34 ± 0.99 | 3.56 ± 0.80 | 0.03 |
| Age, year | 60.6 ± 10.4 | 60.07 ± 10.38 | 62.41 ± 10.23 | 0.048 |
| Male sex, % | 77.1 | 79.2 | 70.9 | 0.081 |
| BMI, kg/m2 | 24.78 ± 3.25 | 24.87 ± 3.32 | 24.65 ± 3.01 | 0.580 |
| Past PCI or CABG, % | 19.2 | 18.5 | 21.4 | 0.525 |
| Past MI, % | 15.8 | 15.3 | 17.5 | 0.594 |
| Smoking, % | 56.7 | 58.8 | 50.5 | 0.142 |
| Hypertension, % | 53.0 | 52.9 | 53.4 | 0.933 |
| Family history, % | 40.1 | 40.3 | 39.8 | 0.935 |
| Ejection fraction, (%) | 58.4 ± 12.3 | 58.73 ± 11.78 | 57.33 ± 13.80 | 0.371 |
| HGB, g/L | 139.3 ± 17.0 | 139.9 ± 18.0 | 137.84 ± 13.88 | 0.230 |
| Platelet, 103 cells/dL | 191.30 ± 66.24 | 194.21 ± 67.85 | 186.10 ± 61.83 | 0.262 |
| Creatinine, mg/dL | 71.15 ± 33.76 | 71.28 ± 36.51 | 71.06 ± 22.51 | 0.942 |
| HbA1c, % | 6.43 ± 1.40 | 5.76 ± 0.38 | 8.36 ± 1.51 | < 0.001 |
| FBG, mmol/L | 6.38 ± 2.43 | 5.55 ± 1.38 | 8.77 ± 3.16 | < 0.001 |
| LDL-C, mg/dL | 2.22 ± 0.82 | 2.20 ± 0.82 | 2.28 ± 0.79 | 0.410 |
| hsCRP, mg/dL | 2.33 ± 2.30 | 2.22 ± 2.25 | 2.67 ± 2.42 | 0.181 |
| CKMB, U/L | 37.88 ± 555.93 | 37.12 ± 54.5 | 39.34 ± 58.94 | 0.739 |
| Pro-BNP, pg/mL | 837.36 ± 2076.66 | 805.19 ± 2097.0 | 970.62 ± 1960.9 | 0.474 |
| Medication at discharge | ||||
| Aspirin, % | 100 | 100 | 100 | a |
| Clopidogrel | 100 | 100 | 100 | a |
| Statin, % | 97.8 | 98.1 | 97.1 | 0.563 |
| ACEI/ARB, % | 92.5 | 92.5 | 92.2 | 0.921 |
| CCB, % | 24.3 | 24.4 | 24.3 | 0.974 |
| β-blocker | 88.6 | 89.0 | 87.4 | 0.662 |
| ACS type | 0.307 | |||
| UA, n (%) | 230 (55.9) | 179 (58.1) | 51 (49.5) | |
| STEMI, n (%) | 122 (29.7) | 86 (27.9) | 36 (35.0) | |
| NSTEMI, n (%) | 59 (14.4) | 43 (14.0) | 16 (15.5) | |
| MACE, % | 39.2 | 41.6 | 32.0 | 0.087 |
Data are presented as mean ± SD or number (%)
FIB fibrinogen, BMI body mass index, Past PCI or CABG past percutaneous coronary intervention or coronary artery bypass grafting, Past MI past myocardial infarction, HGB hemoglobin, HbA1c hemoglobin A1c, FBG fasting blood glucose, CKMB creatine kinase isoenzymes MB, Pro-BNP pro-B-type natriuretic peptide, LDL-C low-density lipoprotein cholesterol, PLT platelets, ACEI angiotensin-converting enzyme inhibition, ARB angiotensin receptor blocker, CCB calcium channel blocker, ACS acute coronary syndromes, UA unstable angina, STEMI ST-segment elevation myocardial infarction, NSTEMI non-ST-segment elevation myocardial infarction, MACE major adverse cardiovascular events
“a” represents P value = 1
Comparison of clinical data between groups with different FIB levels
Patients were divided into three groups based on FIB level, and a comparison of the clinical data of these groups is shown in Table 2. The proportions of diabetics, baseline FBG and HbA1c levels, platelet count, hypersensitive C-reactive protein and pro-B-type natriuretic peptide increased as FIB level increased (all P < 0.05). Moreover, the higher the FIB level, the higher the proportion of patients with STEMI and the lower the proportion of patients with UA or NSTEMI (P = 0.045). The incidence of MACEs in the FIB-M (44.5%) and FIB-H (41.6%) groups was higher than that in the FIB-L (31.4%) group (P = 0.019); all-cause death showed the same result (FIB-L to FIB-M to FIB-H: 2.92% to 4.38% to 9.49%, P = 0.032). No significant difference in other risk factors and medication use at discharge was observed amongst the three groups.
Table 2.
Basic characteristics for patients with different FIB levels
| Fibrinogen, mg/dL | P value | |||
|---|---|---|---|---|
| FIB-L (1.76–2.91) N = 137 |
FIB-M (2.93–3.62) N = 137 |
FIB-H (3.63–8.14) N = 137 |
||
| FIB, mg/dL | 2.53 ± 0.27 | 3.28 ± 0.20 | 4.21 ± 0.55 | < 0.001 |
| Age, year | 60.0 ± 10.0 | 60.2 ± 10.0 | 61.7 ± 11.2 | 0.348 |
| Male sex, % | 75.2 | 81.0 | 75.2 | 0.414 |
| BMI, kg/m2 | 24.83 ± 3.17 | 25.02 ± 3.17 | 24.4 ± 3.45 | 0.446 |
| Past PCI or CABG, % | 16.8 | 17.5 | 23.4 | 0.319 |
| Past MI, % | 13.9 | 14.6 | 19.0 | 0.456 |
| Smoking, % | 54.7 | 58.4 | 56.9 | 0.828 |
| Diabetes, % | 16.1 | 27.7 | 31.4 | 0.009 |
| Hypertension, % | 59.9 | 49.6 | 49.6 | 0.147 |
| Family history, % | 45.3 | 46.7 | 28.5 | 0.003 |
| Ejection fraction, % | 59.6 ± 11.3 | 57.1 ± 13.7 | 58.6 ± 11.7 | 0.247 |
| HGB, g/L | 139.6 ± 17.2 | 139.7 ± 17.6 | 138.5 ± 16.3 | 0.828 |
| Platelet, 103 cells/dL | 181.92 ± 71.51 | 182.89 ± 51.07 | 210.04 ± 71.01 | < 0.001 |
| Creatinine, mg/dL | 69.89 ± 24.97 | 68.74 ± 18.56 | 75.07 ± 50.39 | 0.271 |
| HbA1c, % | 6.08 ± 1.06 | 6.51 ± 1.50 | 6.72 ± 1.55 | 0.001 |
| FBG, mmol/L | 6.02 ± 2.28 | 6.36 ± 2.16 | 6.77 ± 2.80 | 0.043 |
| LDL-C, mg/dL | 2.27 ± 0.79 | 2.26 ± 0.78 | 2.14 ± 0.89 | 0.376 |
| hsCRP, mg/dL | 1.48 ± 1.78 | 2.19 ± 2.18 | 3.50 ± 2.51 | < 0.001 |
| CKMB, U/L | 33.06 ± 48.26 | 38.48 ± 54.07 | 42.35 ± 64.79 | 0.809 |
| Pro-BNP, pg/mL | 473.09 ± 967.43 | 724.36 ± 1221.05 | 1343.61 ± 3244.03 | < 0.001 |
| Medication at discharge | ||||
| Aspirin, % | 100 | 100 | 100 | a |
| Clopidogrel, % | 100 | 100 | 100 | a |
| Statin, % | 96.4 | 98.5 | 98.5 | 0.360 |
| ACEI/ARB, % | 94.9 | 94.2 | 88.3 | 0.078 |
| CCB, % | 26.3 | 19.0 | 27.7 | 0.278 |
| ACS type | 0.045 | |||
| UA | 58.4 | 56.9 | 52.3 | |
| STEMI | 21.9 | 29.9 | 37.2 | |
| NonSTEMI | 19.7 | 13.1 | 10.9 | |
| MACE, % | 31.4 | 44.5 | 41.6 | 0.019 |
| All-cause death, % | 2.92 | 4.38 | 9.49 | 0.032 |
Data are presented as mean ± SD or number (%)
FIB fibrinogen, BMI body mass index, Past PCI or CABG past percutaneous coronary intervention or coronary artery bypass grafting, Past MI past myocardial infarction, HGB hemoglobin, HbA1c hemoglobin A1c, FBG fasting blood glucose, hsCRP hypersensitive C-reactive protein, CKMB creatine kinase isoenzymes MB, Pro-BNP pro-B-type natriuretic peptide, LDL-C low-density lipoprotein cholesterol, PLT platelets, ACEI angiotensin-converting enzyme inhibition, ARB angiotensin receptor blocker, CCB calcium channel blocker, ACS acute coronary syndromes, UA unstable angina, STEMI ST-segment elevation myocardial infarction, NSTEMI non-ST-segment elevation myocardial infarction, MACE major adverse cardiovascular events
“a” represents P value = 1
Association between HbA1c/FBG and FIB
To investigate the relationship between glucose metabolism indices and FIB, we utilised linear regression analysis (Table 3). Admission HbA1c (R2 = 0.016; 95% CI 0.027–0.158, P = 0.005) and FBG level (R2 = 0.017; 95% CI 0.016–0.092, P = 0.005) were significantly positively correlated with FIB in whole ACS patients. In ACS patients with DM, admission HbA1c (R2 = 0.035; 95% CI 0.009–0.212, P = 0.009) and FBG level (R2 = 0.029; 95% CI 0.001–0.098, P = 0.046) were also positively correlated with FIB. However, in the non-DM population, no significant relation was found between FIB and HbA1c or FBG (P > 0.05). The corresponding graphs are shown in Fig. 1.
Table 3.
Linear regression analysis between glucose metabolism and FIB in patients with DM, without DM and whole
| Variable | Adjusted R square | Coefficient | 95% CI | SEM | P value |
|---|---|---|---|---|---|
| Whole | |||||
| HbA1C, % | 0.016 | 0.137 | 0.027 to 0.158 | 0.939 | 0.005 |
| FBG, mmol/L | 0.017 | 0.138 | 0.016 to 0.092 | 0.939 | 0.005 |
| DM | |||||
| HbA1C, % | 0.035 | 0.210 | 0.009 to 0.212 | 0.781 | 0.009 |
| FBG, mmol/L | 0.029 | 0.197 | 0.001 to 0.098 | 0.784 | 0.046 |
| Non-DM | |||||
| HbA1c, % | − 0.001 | 0.052 | − 0.157 to 0.423 | 0.989 | 0.367 |
| FBG, mmol/L | 0.001 | 0.063 | − 0.035 to 0.126 | 0.988 | 0.267 |
FIB fibrinogen, DM diabetes mellitus, HbA1c Hemoglobin A1c, FBG fasting blood glucose, CI confidence interval, SEM standard error of measurement
Fig. 1.

Linear regression analysis of the relationship between glucose metabolism and FIB. a Linear regression analysis of the relationship between glucose metabolism (HbA1c and FBG) and FIB in whole patients with ACS after PCI. b Linear regression analysis of the relationship between glucose metabolism (HbA1c and FBG) and FIB in ACS patients with DM after PCI. FIB fibrinogen, DM diabetes mellitus, HbA1c Haemoglobin A1c, FBG fasting blood glucose
Cox regression and landmark analysis in patients with ACS
Cox regression analysis revealed that, when compared with the FIB-L group, the FIB-M (HR 1.797, 95% CI 1.117–2.892, P = 0.016) and FIB-H (HR 1.664, 95% CI 1.002–2.763, P = 0.049) groups were associated with increased MACEs over a median of 27.55 months of follow-up in the whole population; and FIB-M (HR 7.783, 95% CI 1.012–59.854, P = 0.049), but not HbA1c and FBG, was associated with increased MACEs in DM patients. In addition, baseline FIB levels revealed no relationship with MACEs in non-DM patients (Table 4). The corresponding Kaplan–Meier curves are shown in Fig. 2.
Table 4.
Cox regression analysis of MACE in patients with DM, without DM and whole
| Variable | Hazard Ratio | 95% CI | SEM | P value |
|---|---|---|---|---|
| Whole | ||||
| Hypertension | 1.044 | 1.023 to 1.066 | 0.010 | < 0.001 |
| CKMB | 0.993 | 0.989 to 0.997 | 0.002 | 0.002 |
| FIB-L | 0.033 | |||
| FIB-Ma | 1.797 | 1.117 to 2.892 | 0.243 | 0.016 |
| FIB-Ha | 1.664 | 1.002 to 2.763 | 0.259 | 0.049 |
| DM | ||||
| Hypertension | 1.033 | 1.005 to 1.061 | 0.014 | 0.021 |
| FIB-L | 0.020 | |||
| FIB-Ma | 7.783 | 1.012 to 59.854 | 1.041 | 0.049 |
| FIB-Ha | 3.398 | 0.407 to 28.347 | 1.082 | 0.258 |
| Non-DM | ||||
| Hypertension | 1.055 | 1.028 to 1.083 | 0.013 | < 0.001 |
| FIB-L | 0.173 | |||
| FIB-Ma | 1.797 | 0.948 to 3.408 | 0.327 | 0.895 |
| FIB-Ha | 1.926 | 0.988 to 4.042 | 0.359 | 0.094 |
MACE major adverse cardiovascular events, FIB fibrinogen, CKMB creatine kinase isoenzymes MB, DM diabetes mellitus, CI confidence interval, SEM standard error of measurement
aCompared with FIB-L group
Fig. 2.

Kaplan–Meier survival curves for freedom from MACEs in the whole, non-DM and DM patient groups. Kaplan–Meier survival curves for freedom from MACEs in a the whole population by FIB level, b DM by FIB level and c non-DM by FIB level. FIB fibrinogen, DM diabetes mellitus
Because the number of patients with DM in this work was not adequate for landmark analysis, the overall population was subjected to landmark survival analysis with a landmark point of 30 months. The results in Table 5 show significantly more 2-year MACEs in the FIB-M (HR 3.798, 95% CI 1.508–9.564, P = 0.005) and FIB-H (HR 4.405, 95% CI 1.587–12.227, P = 0.004) groups than in the FIB-L group within 30 months of follow up (MACEs [FIB-L to FIB-M to FIB-H]: 10.9% to 26.3% to 27.7%) but not in the later period (between the 31st month and end of follow-up) in the whole population (MACEs [FIB-L to FIB-M to FIB-H]: 36% to 34% to 30.6%). Significant interactions were observed between time and FIB with respect to MACEs. The corresponding Kaplan–Meier curves are shown in Fig. 3.
Table 5.
Landmark analysis of MACE in ACS patients after PCI
| Variable | MACE, % | Hazard ratio | 95% CI | SEM | P value |
|---|---|---|---|---|---|
| ≤ 30 months | |||||
| Hypertension | 1.047 | 1.014 to 1.080 | 0.016 | 0.005 | |
| PLT | 1.006 | 1.001 to 1.011 | 0.003 | 0.012 | |
| FIB-L | 10.9 | ||||
| FIB-Ma | 26.3 | 3.798 | 1.508 to 9.564 | 0.471 | 0.005 |
| FIB-Ha | 27.7 | 4.405 | 1.587 to 12.227 | 0.521 | 0.004 |
| 31 months to maximum follow-up | |||||
| Hypertension | 1.002 | 1.001 to 1.003 | 0.001 | < 0.001 | |
| Smoking | 1.039 | 1.004 to 1.076 | 0.018 | 0.029 | |
| CRE | 0.973 | 0.949 to 0.997 | 0.013 | 0.030 | |
| FIB-L | 36 | ||||
| FIB-Ma | 34 | 1.458 | 0.548 to 3.876 | 0.499 | 0.450 |
| FIB-Ha | 30.6 | 1.356 | 0.395 to 4.656 | 0.629 | 0.628 |
ACS acute coronary syndrome, PCI percutaneous coronary intervention, MACE major adverse cardiovascular events, PLT platelet, FIB fibrinogen, CRE creatinine, CI confidence interval, SEM standard error of measurement
aCompared with FIB-L group
Fig. 3.
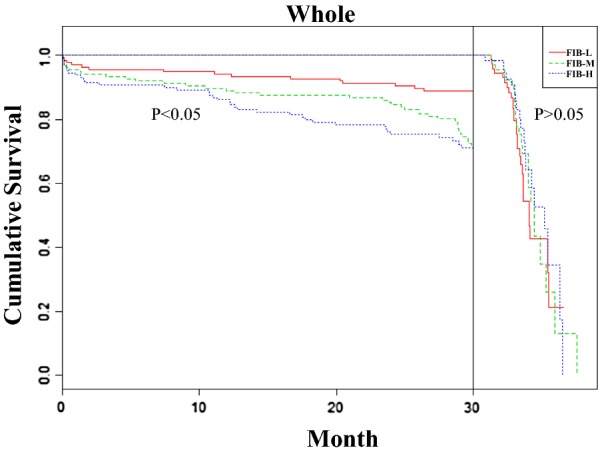
Landmark analysis of MACEs in ACS patients after PCI. Kaplan–Meier survival curves (divided into two parts by the landmark point of 30 months) for freedom from MACEs in the whole population by FIB level. ACS acute coronary syndrome, FIB fibrinogen, DM diabetes mellitus, PCI percutaneous coronary intervention, HR hazard ratio, CI confidence interval
Discussions
In the current study, we noted that FIB levels were higher in Chinese ACS patients with DM than in non-DM patients after PCI. Baseline plasma FIB was related to HbA1c and FBG, and Cox regression analysis demonstrated that elevated baseline FIB levels are an important and independent predictor of MACEs in the whole and DM patient populations with ACS after PCI but not in non-DM patients over a median of 27.55 months of follow-up. Moreover, landmark survival analysis indicated that, over the first 30 months, patients with elevated FIB showed a large number of MACEs. From the 31st month to the end of follow-up, no significant association was found between FIB level and MACEs; this finding suggests that the relationship between FIB and MACEs is more reliable over short follow-up times than over longer periods. To the best of our knowledge, this study is first to investigate the relationship between FIB, glucose metabolism (HbA1c and FBG) and 2-year MACEs in ACS patients undergoing PCI with or without DM in China.
Fibrinogen is converted into insoluble fibrin by thrombin and expose polymerisation sites facilitating clot formation during activation of the coagulation cascade [18, 19]. Individuals suffering from diabetes exhibit higher levels of plasma FIB than those without type-2 diabetes mellitus (T2DM) [20, 21]. Inflammation is a common antecedent of atherosclerosis and diabetes, and FIB plays essential roles in inflammation and tissue repair [22, 23]. FIB is related to insulin sensitivity and insulin resistance causes oxidative stress via thrombin formation and the following FIB synthesis, which promotes diabetes complications and adverse clinical consequences [24–28]. However, whether HbA1c and FBG levels are correlated with FIB in patients with ACS, DM-ACS and non-DM-ACS undergoing PCI remains unclear. HbA1c, which reflects the 3-month average plasma glucose concentration, is a marker of long-term glucose management, and HbA1c levels are associated with the prognosis of AMI [29, 30]. In the present study, the mean FIB level of DM patients was higher than that of non-DM patients. In addition, linear regression analysis showed that admission HbA1c and FBG were positively correlated with FIB in patients with ACS and DM-ACS but not in patients without DM. Our study not only confirms the relationship between FIB and diabetes but also further assesses the relationship between FIB and glucose metabolism indicators in ACS patients with or without DM. However, conflicting results were found. The prospective Multi-Ethnic Study of Atherosclerosis showed that, after adjustment, FIB levels are no longer related to the onset of diabetes in the entire sample [31]. Similarly, the multicentre epidemiological Insulin Resistance Atherosclerosis Study showed that changes in FIB are not substantially related to incident diabetes [32]. Obviously, the target population of these two studies are participants without CAD or DM, and their aim is to explore the association between FIB and incident diabetes; these details are very different from those of the current study.
Patients with DM often have accelerated atherosclerosis and more serious clinical outcomes than those without the disease [33]. A nationwide study from Korea that used data from four consecutive nationwide databases revealed that the absolute burden of CAD remains high as the number of people with diabetes continues to increase [34]. Previous studies have reported relations between elevated FIB levels and adverse cardiovascular events in CAD and DM patients [10, 11, 35–38]. FIB is regarded as a risk factor in prognostic models for patients with T2DM, but few studies have explored these relations in patients with DM-ACS, non-DM ACS and whole who underwent PCI [39]. The major outcome of this study shows that FIB level is an important and independent predictor of 2-year MACEs in patients in the whole ACS and ACS combined with DM populations. By contrast, in non-DM patients, FIB level reflected no relationship with MACEs. As described above, FIB is positively correlated with HbA1c and FBG. In addition, elevated baseline FIB may potentiate MACE through platelet crosslinking, clot formation and arterial thrombosis [35]. These findings may explain why FIB exhibits no predictive value for MACEs in ACS patients without DM in this study. In the ADVANCE study, a case-cohort study including 3865 patients with T2DM and baseline CAD or risk factors, IL-6 levels, but not CRP or FIB levels, were significant to the prediction of macro-vascular events and mortality [40]. CAD is a clinical syndrome with high heterogeneity and different disease severities and prognoses. Different types of CAD may lead to differences in the research results and differences in time during which the studies were conducted may also contribute to the inconsistent results.
Many clinical studies have shown that the risks of target lesion failure, safety and efficacy outcomes amongst patients undergoing PCI are similar after implantation of third-generation drug eluting stents with biodegradable polymers or second-generation drug eluting stents with durable polymers [41–43]. In addition, patients with and without DM show different performance in terms of safety and effectiveness for the same kind of stent, thus suggesting the existence of differences between groups with and without diabetes [44, 45]. The stents implanted in all patients of the present study were second-generation drug-eluting stents; as such, the effect of different types of implanted stents on cardiovascular events was minimised.
Table 5 shows the results of landmark analyses of the MACEs. FIB consistently revealed better predictive value for MACEs after PCI in the first 30 months than in the subsequent period (between the 31st month and end of follow-up). Significant interactions were found between time and FIB with respect to MACEs, which suggests that baseline FIB levels cannot accurately reflect patients’ fibrinolysis and coagulation status with prolonged follow-up. Additional studies addressing the effects of FIB level variability over time or the role of FIB isoform variability are required.
This study presents a number of advantages. First, we explored the relationship between FIB and glucose metabolism (HbA1c and FBG) in the whole, DM and non-DM populations with ACS. Results showed that baseline FIB is positively associated with HbA1c and FBG in the whole and DM populations with ACS, which helps enhance our understanding of the relationship between diabetes and FIB. Secondly, several reports on the relationship between FIB and cardiovascular events in patients with diabetes and/or CAD have been published [38, 39]. Some studies focus on the association between FIB and long- or short-term MACEs in patients with ACS [10, 11, 35]. However, few researchers have assessed 2-year MACEs in ACS populations after PCI with or without DM. Despite revascularisation, a large proportion of ACS patients continue to experience MACEs, which is worsened by DM. Thus, determining the relationship between FIB and MACEs in ACS patients with DM and without DM is meaningful. Finally, few scholars have explored the relationship between FIB and MACEs in a Chinese ACS population after PCI. In a study from Beijing, the association between FIB and cardiovascular events in patients with stable angina pectoris and T2DM was assessed [38]. However, the target population of this work is very different from that in the present study. Another study showed that FIB level at admission is independently associated with death risk amongst Chinese patients with ACS [46]. However, this work did not explore the relationship between FIB and glucose metabolism or the relationship between FIB and 2-year MACEs in ACS patients after PCI with and without DM. Thus far, the present work is the first to study the relationship between FIB, glucose metabolism (HbA1c and FBG) and 2-year MACEs after PCI in ACS patents with and without DM in a prospective cohort from China.
This study features some limitations. Firstly, this study is a single-centre observational cohort study, which is less convincing than clinical trial studies. Secondly, only 411 ACS patients were enrolled in this work, amongst which only 103 patients had T2DM; this limitation may affect the reliability of the results. Finally, the study only included ACS patients undergoing PCI, which suggests that the study results may not be generalisable to all ACS patients.
Conclusions
Elevated baseline plasma FIB levels were positively correlated with HbA1c and FBG and associated with 2-year MACEs (median follow-up, 27.55 months) independent of HbA1c and inflammatory status in whole ACS and DM-ACS patients following PCI but not in ACS patients without DM. However, as the follow-up period increased, baseline FIB levels lost their ability to predict MACEs.
Authors’ contributions
ZY conceived and designed the study; YW and LZ contributed to the design; LZ performed the study, JL, CX, RL, XB and LW help to the study; LZ analyzed the data and draft the paper; JZ contributed to the drafting. All authors read, critically revised the final manuscript. All authors read and approved the final manuscript.
Acknowledgements
Not applicable.
Competing interests
The authors declare that they have no competing interests.
Availability of data and materials
We confirm the availability of data in the paper.
Consent for publication
All authors have reviewed the final version of the manuscript and approve of its publication.
Ethics approval and consent to participate
The study was approved by the ethics committee of the First Affiliated Hospital of Xi’an Jiaotong University (Ethical approval number: XJTU1AF2012LSK-312) and written informed consent was obtained from all study participants.
Funding
This research was funded by the National Natural Science Foundation of China [Nos. 81770458, 81500389], Key Project of Research and Development Plan of Shaanxi Province [2017ZDCXL-SF-02-04-01] and National Key R&D Program of China [2018YFC1311505].
Publisher’s Note
Springer Nature remains neutral with regard to jurisdictional claims in published maps and institutional affiliations.
Abbreviations
- FIB
fibrinogen
- HbA1c
hemoglobin A1c
- FBG
fasting blood glucose
- AMI
acute myocardial infarction
- T2DM
type 2 diabetes mellitus
- BMI
body mass index
- HGB
hemoglobin
- hsCRP
hypersensitive C-reactive protein
- CKMB
creatine kinase isoenzymes MB
- Pro-BNP
pro-B-type natriuretic peptide
- LDL-C
low-density lipoprotein cholesterol
- PLT
platelets
- ACEI
angiotensin-converting enzyme inhibition
- ARB
angiotensin receptor blocker
- CCB
calcium channel blocker
- CAD
coronary artery disease
- ACS
acute coronary syndromes
- UA
unstable angina
- STEMI
ST-segment elevation myocardial infarction
- NSTEMI
non-ST-segment elevation myocardial infarction
- MACE
major adverse cardiovascular events
- PCI
percutaneous coronary intervention
- CABG
percutaneous coronary intervention or coronary artery bypass grafting
Contributor Information
Yue Wu, Email: yue.wu@xjtu.edu.cn.
Zuyi Yuan, Phone: +86-029-85323820, Email: zuyiyuan@mail.xjtu.edu.cn.
References
- 1.Murray CJ, Barber RM, Foreman KJ, et al. Global, regional, and national disability-adjusted life years (DALYs) for 306 diseases and injuries and healthy life expectancy (HALE) for 188 countries, 1990–2013: quantifying the epidemiological transition. Lancet. 2015;386(10009):2145–2191. doi: 10.1016/S0140-6736(15)61340-X. [DOI] [PMC free article] [PubMed] [Google Scholar]
- 2.Murray CJ, Vos T, Lozano R, et al. Disability-adjusted life years (DALYs) for 291 diseases and injuries in 21 regions, 1990–2010: a systematic analysis for the Global Burden of Disease Study 2010. Lancet. 2012;380(9859):2197–2223. doi: 10.1016/S0140-6736(12)61689-4. [DOI] [PubMed] [Google Scholar]
- 3.Navarese EP, De Luca G, Castriota F, et al. Low-molecular-weight heparins vs. unfractionated heparin in the setting of percutaneous coronary intervention for ST-elevation myocardial infarction: a meta-analysis. J Thromb Haemost. 2011;9(10):1902–1915. doi: 10.1111/j.1538-7836.2011.04445.x. [DOI] [PubMed] [Google Scholar]
- 4.De Luca G, Verdoia M, Suryapranata H. Benefits from intracoronary as compared to intravenous abciximab administration for STEMI patients undergoing primary angioplasty: a meta-analysis of 8 randomized trials. Atherosclerosis. 2012;222(2):426–433. doi: 10.1016/j.atherosclerosis.2012.02.041. [DOI] [PubMed] [Google Scholar]
- 5.De Luca G, Dirksen MT, Spaulding C, et al. Impact of diabetes on long-term outcome after primary angioplasty: insights from the DESERT cooperation. Diabetes Care. 2013;36(4):1020–1025. doi: 10.2337/dc12-1507. [DOI] [PMC free article] [PubMed] [Google Scholar]
- 6.Eapen ZJ, Tang WH, Felker GM, et al. Defining heart failure end points in ST-segment elevation myocardial infarction trials: integrating past experiences to chart a path forward. Circ Cardiovasc Qual Outcomes. 2012;5(4):594–600. doi: 10.1161/CIRCOUTCOMES.112.966150. [DOI] [PubMed] [Google Scholar]
- 7.Anderson JL, Morrow DA. Acute myocardial infarction. N Engl J Med. 2017;376(21):2053–2064. doi: 10.1056/NEJMra1606915. [DOI] [PubMed] [Google Scholar]
- 8.Petersen MA, Ryu JK, Akassoglou K. Fibrinogen in neurological diseases: mechanisms, imaging and therapeutics. Nat Rev Neurosci. 2018;19(5):283–301. doi: 10.1038/nrn.2018.13. [DOI] [PMC free article] [PubMed] [Google Scholar]
- 9.Gorog DA. Prognostic value of plasma fibrinolysis activation markers in cardiovascular disease. J Am Coll Cardiol. 2010;55(24):2701–2709. doi: 10.1016/j.jacc.2009.11.095. [DOI] [PubMed] [Google Scholar]
- 10.Ang L, Behnamfar O, Palakodeti S, et al. Elevated baseline serum fibrinogen: effect on 2-year major adverse cardiovascular events following percutaneous coronary intervention. J Am Heart Assoc. 2017;6(11):e006580. doi: 10.1161/JAHA.117.006580. [DOI] [PMC free article] [PubMed] [Google Scholar]
- 11.Mahmud E, Ramsis M, Behnamfar O, et al. Effect of serum fibrinogen, total stent length, and type of acute coronary syndrome on 6-month major adverse cardiovascular events and bleeding after percutaneous coronary intervention. Am J Cardiol. 2016;117(10):1575–1581. doi: 10.1016/j.amjcard.2016.02.032. [DOI] [PubMed] [Google Scholar]
- 12.Jain A, Gupta HL, Narayan S. Hyperfibrinogenemia in patients of diabetes mellitus in relation to glycemic control and urinary albumin excretion rate. J Assoc Physicians India. 2001;49:227–230. [PubMed] [Google Scholar]
- 13.Fuller JH, Keen H, Jarrett RJ, et al. Haemostatic variables associated with diabetes and its complications. Br Med J. 1979;2(6196):964–966. doi: 10.1136/bmj.2.6196.964. [DOI] [PMC free article] [PubMed] [Google Scholar]
- 14.She J, Deng Y, Wu Y, et al. Hemoglobin A1c is associated with severity of coronary artery stenosis but not with long term clinical outcomes in diabetic and nondiabetic patients with acute myocardial infarction undergoing primary angioplasty. Cardiovasc Diabetol. 2017;16(1):97. doi: 10.1186/s12933-017-0578-7. [DOI] [PMC free article] [PubMed] [Google Scholar]
- 15.Handelsman Y, Mechanick JI, Blonde L, et al. American association of clinical endocrinologists medical guidelines for clinical practice for developing a diabetes mellitus comprehensive care plan. Endocr Pract. 2011;17(Suppl 2):1–53. doi: 10.4158/EP.17.S2.1. [DOI] [PubMed] [Google Scholar]
- 16.Levine GN, Bates ER, Bittl JA, et al. 2016 ACC/AHA guideline focused update on duration of dual antiplatelet therapy in patients with coronary artery disease: a report of the American College of Cardiology/American Heart Association Task Force on Clinical Practice Guidelines. J Thorac Cardiovasc Surg. 2016;152(5):1243–1275. doi: 10.1016/j.jtcvs.2016.07.044. [DOI] [PubMed] [Google Scholar]
- 17.Ferreira-González I, Busse JW, Heels-Ansdell D, Montori VM, Akl EA, Bryant DM, Alonso-Coello P, Alonso J, Worster A, Upadhye S, et al. Problems with use of composite end points in cardiovascular trials: systematic review of randomised controlled trials. BMJ. 2007;334(7597):786. doi: 10.1136/bmj.39136.682083.AE. [DOI] [PMC free article] [PubMed] [Google Scholar]
- 18.Yang Z, Mochalkin I, Doolittle RF. A model of fibrin formation based on crystal structures of fibrinogen and fibrin fragments complexed with synthetic peptides. Proc Natl Acad Sci USA. 2000;97(26):14156–14161. doi: 10.1073/pnas.97.26.14156. [DOI] [PMC free article] [PubMed] [Google Scholar]
- 19.Dempfle CE, Mosesson MW. Theme issue: fibrinogen and fibrin–structure, function, interactions and clinical applications. Thromb Haemost. 2003;89(4):599–600. doi: 10.1055/s-0037-1613565. [DOI] [PubMed] [Google Scholar]
- 20.Danesh J, Lewington S, Thompson SG, et al. Plasma fibrinogen level and the risk of major cardiovascular diseases and nonvascular mortality: an individual participant meta-analysis. JAMA. 2005;294(14):1799–1809. doi: 10.1001/jama.294.14.1799. [DOI] [PubMed] [Google Scholar]
- 21.Barazzoni R, Zanetti M, Davanzo G, et al. Increased fibrinogen production in type 2 diabetic patients without detectable vascular complications: correlation with plasma glucagon concentrations. J Clin Endocrinol Metab. 2000;85(9):3121–3125. doi: 10.1210/jcem.85.9.6779. [DOI] [PubMed] [Google Scholar]
- 22.Pickup JC, Mattock MB. Activation of the innate immune system as a predictor of cardiovascular mortality in type 2 diabetes mellitus. Diabet Med. 2003;20(9):723–726. doi: 10.1046/j.1464-5491.2003.00990.x. [DOI] [PubMed] [Google Scholar]
- 23.Davalos D, Akassoglou K. Fibrinogen as a key regulator of inflammation in disease. Semin Immunopathol. 2012;34(1):43–62. doi: 10.1007/s00281-011-0290-8. [DOI] [PubMed] [Google Scholar]
- 24.Ceriello A, Pirisi M. Is oxidative stress the missing link between insulin resistance and atherosclerosis. Diabetologia. 1995;38(12):1484–1485. doi: 10.1007/BF00400613. [DOI] [PubMed] [Google Scholar]
- 25.Ludvik B, Hanefeld M, Pacini G. Improved metabolic control by Ipomoea batatas (Caiapo) is associated with increased adiponectin and decreased fibrinogen levels in type 2 diabetic subjects. Diabetes Obes Metab. 2008;10(7):586–592. doi: 10.1111/j.1463-1326.2007.00752.x. [DOI] [PubMed] [Google Scholar]
- 26.Pacilli A, De Cosmo S, Trischitta V, Bacci S. Role of relationship between HbA1c, fibrinogen and HDL-cholesterol on cardiovascular disease in patients with type 2 diabetes mellitus. Atherosclerosis. 2013;228(1):247–248. doi: 10.1016/j.atherosclerosis.2013.02.010. [DOI] [PubMed] [Google Scholar]
- 27.Bardini G, Dicembrini I, Cresci B, Rotella CM. Inflammation markers and metabolic characteristics of subjects with 1-h plasma glucose levels. Diabetes Care. 2010;33(2):411–413. doi: 10.2337/dc09-1342. [DOI] [PMC free article] [PubMed] [Google Scholar]
- 28.Ang L, Palakodeti V, Khalid A, Tsimikas S, Idrees Z, Tran P, Clopton P, Zafar N, Bromberg-Marin G, Keramati S, et al. Elevated plasma fibrinogen and diabetes mellitus are associated with lower inhibition of platelet reactivity with clopidogrel. J Am Coll Cardiol. 2008;52(13):1052–1059. doi: 10.1016/j.jacc.2008.05.054. [DOI] [PubMed] [Google Scholar]
- 29.Skriver MV, Støvring H, Kristensen JK, Charles M, Sandbæk A. Short-term impact of HbA1c on morbidity and all-cause mortality in people with type 2 diabetes: a Danish population-based observational study. Diabetologia. 2012;55(9):2361–2370. doi: 10.1007/s00125-012-2614-1. [DOI] [PubMed] [Google Scholar]
- 30.Olsson M, Schnecke V, Cabrera C, Skrtic S, Lind M. Contemporary risk estimates of three HbA1c variables for myocardial infarction in 101,799 patients following diagnosis of type 2 diabetes. Diabetes Care. 2015;38(8):1481–1486. doi: 10.2337/dc14-2351. [DOI] [PubMed] [Google Scholar]
- 31.Bertoni AG, Burke GL, Owusu JA, Carnethon MR, Vaidya D, Barr RG, Jenny NS, Ouyang P, Rotter JI. Inflammation and the incidence of type 2 diabetes: the multi-ethnic study of atherosclerosis (MESA) Diabetes Care. 2010;33(4):804–810. doi: 10.2337/dc09-1679. [DOI] [PMC free article] [PubMed] [Google Scholar]
- 32.Festa A, Williams K, Tracy RP, Wagenknecht LE, Haffner SM. Progression of plasminogen activator inhibitor-1 and fibrinogen levels in relation to incident type 2 diabetes. Circulation. 2006;113(14):1753–1759. doi: 10.1161/CIRCULATIONAHA.106.616177. [DOI] [PubMed] [Google Scholar]
- 33.Pozzati A, Abrignani MG. Pathogenesis of atherosclerosis in diabetes mellitus. Ital Heart J. 2004;5(Suppl 4):7S–11S. [PubMed] [Google Scholar]
- 34.Jung CH, Chung JO, Han K, Ko SH, Ko KS, Park JY. Improved trends in cardiovascular complications among subjects with type 2 diabetes in Korea: a nationwide study (2006–2013) Cardiovasc Diabetol. 2017;16(1):1. doi: 10.1186/s12933-016-0482-6. [DOI] [PMC free article] [PubMed] [Google Scholar]
- 35.Mahmud E, Behnamfar O, Lin F, Reeves R, Patel M, Ang L. Elevated serum fibrinogen is associated with 12-month major adverse cardiovascular events following percutaneous coronary intervention. J Am Coll Cardiol. 2016;67(21):2556–2557. doi: 10.1016/j.jacc.2016.03.540. [DOI] [PubMed] [Google Scholar]
- 36.Lepojärvi ES, Piira OP, Kiviniemi AM, et al. Usefulness of highly sensitive troponin as a predictor of short-term outcome in patients with diabetes mellitus and stable coronary artery disease (from the ARTEMIS Study) Am J Cardiol. 2016;117(4):515–521. doi: 10.1016/j.amjcard.2015.11.038. [DOI] [PubMed] [Google Scholar]
- 37.Ghasemzadeh N, Brooks MM, Vlachos H, Hardison R, Sikora S, Sperling L, Quyyumi AA, Epstein SE. An aggregate biomarker risk score predicts high risk of near-term myocardial infarction and death: findings from BARI 2D (bypass angioplasty revascularization investigation 2 diabetes) J Am Heart Assoc. 2017;6(7):e003587. doi: 10.1161/JAHA.116.003587. [DOI] [PMC free article] [PubMed] [Google Scholar]
- 38.Yang SH, Du Y, Zhang Y, et al. Serum fibrinogen and cardiovascular events in Chinese patients with type 2 diabetes and stable coronary artery disease: a prospective observational study. BMJ Open. 2017;7(6):e015041. doi: 10.1136/bmjopen-2016-015041. [DOI] [PMC free article] [PubMed] [Google Scholar]
- 39.Bosevski M, Bosevska G, Stojanovska L, Apostolopoulos V. CRP and fibrinogen imply clinical outcome of patients with Type-2 diabetes and coronary artery disease. Acta Biochim Biophys Sin (Shanghai) 2017;49(3):284–285. doi: 10.1093/abbs/gmw135. [DOI] [PubMed] [Google Scholar]
- 40.Lowe G, Woodward M, Hillis G, Rumley A, Li Q, Harrap S, Marre M, Hamet P, Patel A, Poulter N, et al. Circulating inflammatory markers and the risk of vascular complications and mortality in people with type 2 diabetes and cardiovascular disease or risk factors: the ADVANCE study. Diabetes. 2014;63(3):1115–1123. doi: 10.2337/db12-1625. [DOI] [PubMed] [Google Scholar]
- 41.Yamaji K, Zanchin T, Zanchin C, Stortecky S, Koskinas KC, Hunziker L, Praz F, Blöchlinger S, Moro C, Moschovitis A, et al. Unselected use of ultrathin strut biodegradable polymer sirolimus-eluting stent versus durable polymer everolimus-eluting stent for coronary revascularization. Circ Cardiovasc Interv. 2018;11(9):e006741. doi: 10.1161/CIRCINTERVENTIONS.118.006741. [DOI] [PubMed] [Google Scholar]
- 42.Vlachojannis GJ, Smits PC, Hofma SH, Togni M, Vázquez N, Valdés M, Voudris V, Slagboom T, Goy JJ, den Heijer P, et al. Biodegradable polymer biolimus-eluting stents versus durable polymer everolimus-eluting stents in patients with coronary artery disease: final 5-year report from the COMPARE II Trial (Abluminal Biodegradable Polymer Biolimus-Eluting Stent Versus Durable Polymer Everolimus-Eluting Stent) JACC Cardiovasc Interv. 2017;10(12):1215–1221. doi: 10.1016/j.jcin.2017.02.029. [DOI] [PubMed] [Google Scholar]
- 43.Pilgrim T, Piccolo R, Heg D, Roffi M, Tüller D, Muller O, Moarof I, Siontis GC, Cook S, Weilenmann D, et al. Ultrathin-strut, biodegradable-polymer, sirolimus-eluting stents versus thin-strut, durable-polymer, everolimus-eluting stents for percutaneous coronary revascularisation: 5-year outcomes of the BIOSCIENCE randomised trial. Lancet. 2018;392(10149):737–746. doi: 10.1016/S0140-6736(18)31715-X. [DOI] [PubMed] [Google Scholar]
- 44.Tang XF, Ma YL, Song Y, Xu JJ, Yao Y, He C, Wang HH, Jiang P, Jiang L, Liu R, et al. Biodegradable polymer drug-eluting stents versus second-generation drug-eluting stents in patients with and without diabetes mellitus: a single-center study. Cardiovasc Diabetol. 2018;17(1):114. doi: 10.1186/s12933-018-0758-0. [DOI] [PMC free article] [PubMed] [Google Scholar]
- 45.Wiemer M, Stoikovic S, Samol A, Dimitriadis Z, Ruiz-Nodar JM, Birkemeyer R, Monsegu J, Finet G, Hildick-Smith D, Tresukosol D, et al. Third generation drug eluting stent (DES) with biodegradable polymer in diabetic patients: 5 years follow-up. Cardiovasc Diabetol. 2017;16(1):23. doi: 10.1186/s12933-017-0500-3. [DOI] [PMC free article] [PubMed] [Google Scholar]
- 46.Peng Y, Xia TL, Li YM, Huang FY, Chai H, Wang PJ, Liu W, Zhang C, Pu XB, Chen SJ, et al. Fibrinogen is related to long-term mortality in Chinese patients with acute coronary syndrome but failed to enhance the prognostic value of the GRACE score. Oncotarget. 2017;8(13):20622–20629. doi: 10.18632/oncotarget.15094. [DOI] [PMC free article] [PubMed] [Google Scholar]
Associated Data
This section collects any data citations, data availability statements, or supplementary materials included in this article.
Data Availability Statement
We confirm the availability of data in the paper.