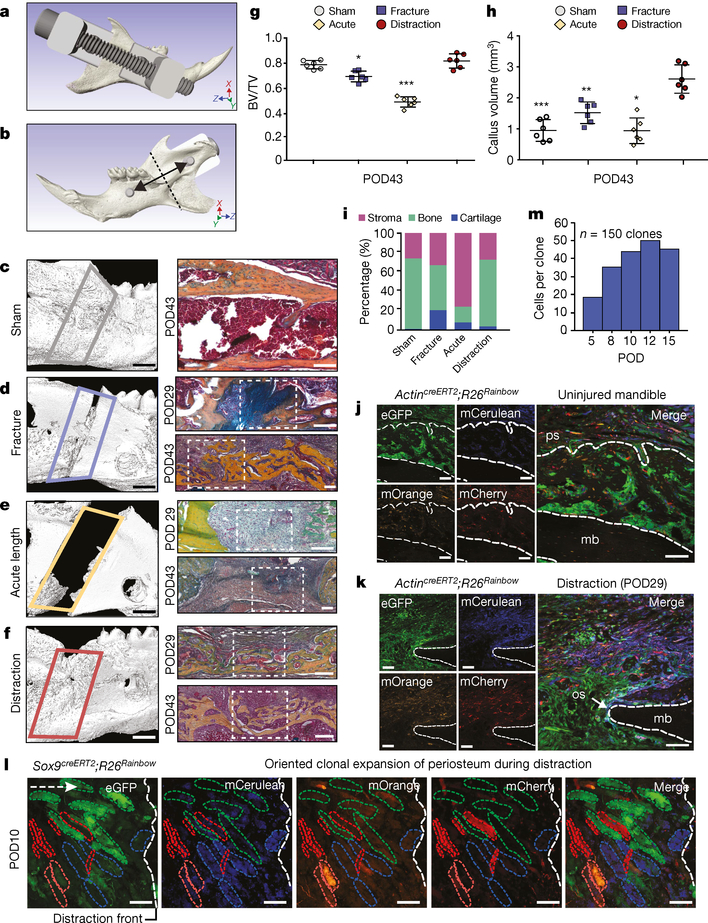
Fig. 1 |. Tissue-resident stem and progenitor cells enact bone regeneration in distraction osteogenesis.
a, Computer-assisted design of a distraction device using 3D μCT of the C57BL/6 mouse hemimandible. b, The lingual aspect illustrates the location of the osteotomy (dotted line), perpendicular to the vector of bidirectional distraction (solid arrow). c, Three-dimensional μCT of a sham-operated mandible (left, lateral view), with pentachrome staining of a transverse section (right) at POD43. The outlined area (left) indicates the volume analysed for new bone formation (n = 5). d, As for c, but for a fractured mandible, and also showing POD29. The white dotted lines indicate the osteotomy area. e, As for d, but for an acutely lengthened mandible. f, As for d, but for a gradually distracted mandible. g, Quantification of bone volume/total tissue volume (BV/TV) analysed at POD43 from μCT (n = 6, *P ≤ 0.05, ***P ≤ 0.001; Tukey’s multiple comparisons). h, Quantification of new bone callus volume formed at POD43 (n = 6, *P ≤ 0.05, **P ≤ 0.01, ***P ≤ 0.001; Tukey’s multiple comparisons). i, Tissue fraction of bone, cartilage and stroma from pentachrome histology at POD43 (n = 6). j, Confocal micrographs of uninjured transverse mandible sections after one week (n = 4). Uninjured mandibular bone (mb) is between the dotted lines. eGFP, enhanced green fluorescent protein; mCerulean, membrane cerulean (blue fluorescence signal); mCherry, membrane cherry (red fluorescence signal); mOrange, membrane orange (orange fluorescence signal); ps, periosteum. k, As for j, but for POD29 of distraction osteogenesis (n = 4). The dotted outline indicates the mandibular bone at the distraction site. os, osteotomy site. l, Confocal micrographs of whole-mount periosteum at POD10 (clones are indicated by coloured dotted outlines) (n = 5). The vector of distraction is indicated by the dotted white arrow (left). Buccal to lingual view of periosteal callus overlying the distraction sites. m, Quantification of average clone size within the regenerate during distraction (POD5–15; n = 5). Scale bars, 1 mm (c–f left), 200 μm (c–f right, j–l).

