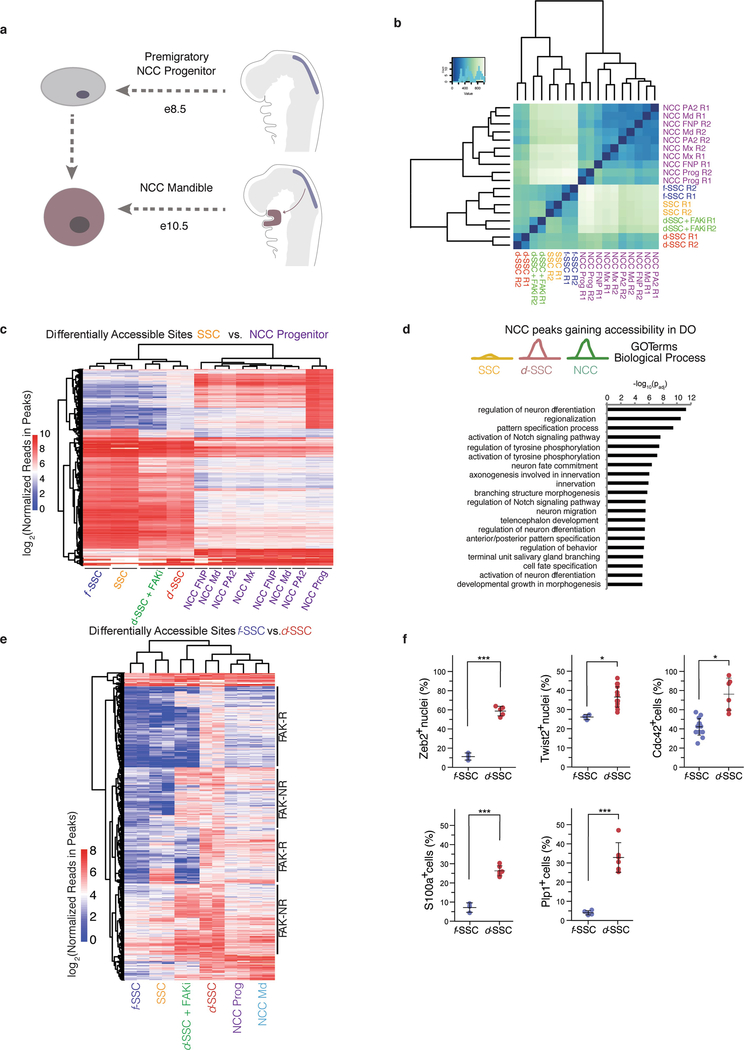
Extended Data Fig. 9 |. NCC transcriptional networks in d-SSCs.
a, Diagram showing the developmental origin of NCC-derived SSCs. e, embryonic day of development. b, Clustering of SSC and NCC samples using all accessible sites in SSCs and NCCs merged. c, Heat map showing all accessible sites that are significantly differentially accessible between uninjured SSCs and NCC progenitors. Colour represents the log2-transformed normalized read counts within peak regions. d, GO terms enriched in sets of genes near peaks that are more accessible in NCC and d-SSCs than in uninjured SSCs. GO terms shown are those that are significantly enriched after false discovery rate correction in GREAT (two-sided binomial P value shown). e, Heat map showing all accessible sites that are differentially accessible between f-SSCs and d-SSCs. The sites that are FAK-R or FAK-NR are highlighted along the right. Colour represents the log2-transformed normalized read counts within peak regions. f, Quantification of immunofluorescence staining for each of the NCC markers observed on RNA-seq analysis and evaluated in this figure, including nuclear Zeb2 (n = 15, ***P < 0.001), nuclear Twist2 (n = 15, *P < 0.05), Cdc42 (n = 6, P < 0.05), S100a (n = 6, ***P < 0.001) and Plp1 (n = 6, ***P < 0.001) (Student’s t-test; shown are means ± s.d.). n refers to the number of animals in each independent experiment.

