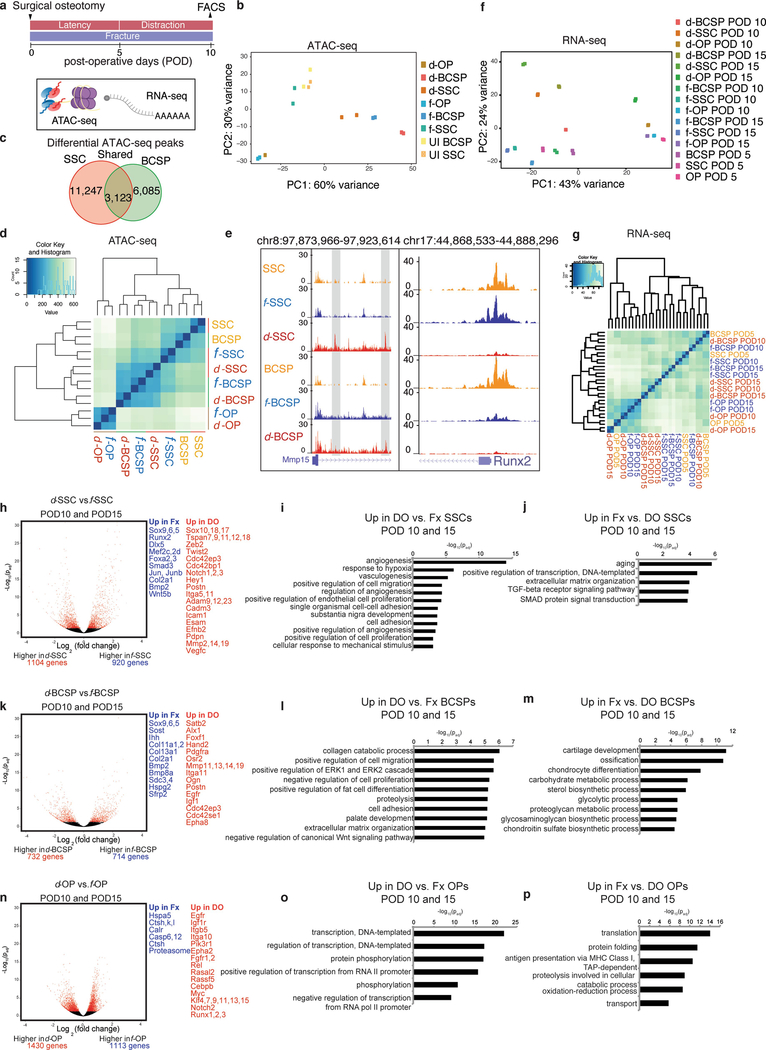
Extended Data Fig. 4 |. Changes in gene regulation in response to distraction.
a, Schematic showing FACS isolation of stem and progenitor cells from uninjured, fractured and distracted mandibles for ATAC-seq (assay for accessibility of chromatin, which is shown with purple spheres and yellow lines, to depict nucleosomes) and RNA-seq (shown with a polyA strand). Samples were collected in duplicate for ATAC-seq at POD10 and in duplicate for RNA-seq at PODs 5, 10 and 15. b, PCA showing PC1 and PC2 for all ATAC-seq data (n = 164,266 peaks). UI, uninjured. c, Venn diagram showing the number of differential peaks between the fracture and diffraction conditions in both SSCs and BCSPs. Overlap between these (shared peaks; twofold change with P < 0.05 in both SSCs and BCSPs) is shown in the centre. d, Cluster dendrogram for ATAC-seq, showing clustering of samples based on all ATAC-seq peaks from SSCs, BCSPs and OPs. e, Example loci (Mmp15 and Runx2, with their locations on chromosomes 8 and 17, respectively, shown at the top), revealing accessibility that is distraction-specific (Mmp15) and fracture-specific (Runx2), respectively. The height of the genome browser tracks shows the number of reads normalized by read depth and overall peak enrichment in the library. f, PCA showing PC1 and PC2 for all RNA-seq data at PODs 5,10 and 15 (n = 17,491 genes). g, Cluster dendrogram for RNA-seq, showing clustering of samples based on all genes from SSCs, BCSPs and OPs on PODs 5, 10 and 15. h, Volcano plot showing differential gene expression between d-SSCs at PODs 10 and 15 and f-SSCs at PODs 10 and 15. Red dots represent genes that are significantly differentially expressed with an adjusted P-value cut-off of 0.05 (DESeq2). Differentially expressed genes that are upregulated in f-SSCs (Fx) are shown in blue (fold change greater than 1.5; Padj less than 0.05), and differentially expressed genes that are upregulated in d-SSCs (DO) are shown in red. i, Significantly enriched GO terms for genes upregulated in d-SSCs at PODs 10 and 15, from GREAT version 3.0.0, with P values (one-sided binomial) corrected using the Benjamini–Hochberg correction. j, Significantly enriched GO terms for genes upregulated in f-SSCs at PODs 10 and 15 from GREAT, with P values (one-sided binomial) corrected using the Benjamini–Hochberg correction. k, As for h, but for BCSPs. l, As for i, but for BCSPs. m, As for j, but for BCSPs. n, As for h, but for OPs. o, As for i, but for OPs. p, As for j, but for OPs.

