Abstract
Temporomandibular joint disorders (TMD) are common dysfunctions of the masticatory region and are often linked to dislocation or changes of the temporomandibular joint (TMJ) disc. Magnetic resonance imaging (MRI) is the gold standard for TMJ imaging but standard clinical sequences do not deliver a sufficient resolution and contrast for the creation of detailed meshes of the TMJ disc. Additionally, bony structures cannot be captured appropriately using standard MRI sequences due to their low signal intensity. The objective of this study was to enable researchers to create high resolution representations of all structures of the TMJ and consequently investigate morphological as well as positional changes of the masticatory system. To create meshes of the bony structures, a single computed tomography (CT) scan was acquired. In addition, a high‐resolution MRI sequence was produced, which is used to collect the thickness and position change of the disc for various static postures using bite blocks. Changes in thickness of the TMJ disc as well as disc translation were measured. The newly developed workflow successfully allows researchers to create high resolution models of all structures of the TMJ for various static positions, enabling the investigation of TMJ disc translation and deformation. Discs were thinnest in the lateral part and moved mainly anteriorly and slightly medially. The procedure offers the most comprehensive picture of disc positioning and thickness changes reported to date. The presented data can be used for the development of a biomechanical computer model of TMJ anatomy and to investigate dynamic and static loads on the components of the system, which could be useful for the prediction of TMD onset.
Keywords: magnetic resonance imaging, temporomandibular joint, temporomandibular joint disc, temporomandibular joint morphology
Introduction
The masticatory system is a highly active part of the human body used regularly for tasks such as speaking, chewing and drinking. There is a variety of problems that lead to dysfunction or pain of the temporomandibular joint (TMJ) and muscles. These disorders are collectively named temporomandibular disorders (TMD; Schiffman et al. 2014) and affect approximately 20% of the population (Solberg et al. 1979). Loss of function or pain of the jaw region can lead to severe impairments concerning the above‐mentioned primary functions (Agerberg & Carlsson, 1972).
The etiology of TMD is not completely understood. A main focus of TMD research is TMJ disc displacement, because it is one of the most common arthropathies of the masticatory system (Ingawale & Goswami, 2009) and can lead to degenerative changes of the disc and its surrounding hard tissues (Wilkes, 1989; Chase et al. 1995). Moreover, the TMJ disc plays an important role for lubrication and load distribution in the joint (Koolstra et al. 2007; Tanaka & Koolstra, 2008; Koolstra & Tanaka, 2009; Nickel et al. 2009; Stankovic et al. 2013). Biomechanical analysis of TMJ disc displacement, however, is challenging due to the complexity of the region's anatomy and consequently the complexity of its biomechanics. The masticatory region is the only human movement system that uses a combination of two separate joints to articulate a single bone, the mandible. Mandibular movement involves both rotation and translation in six degrees‐of‐freedom and the dynamic articular discs permit a wide range of movements (Ide & Nakazawa, 1991; Drake et al. 2014). Moreover, acquisition of muscle activation patterns with electromyography is difficult because a large number of jaw muscles are partly overlapping each other in the small facial area (Castroflorio et al. 2008). The combination of mechanical and anatomical complexity as well as the lack of proper measurement devices make the in vivo investigation of masticatory kinematics and kinetics very challenging. This motivates the need for detailed imaging studies of the TMJ disc in context with surrounding joint structures and over the full range of jaw motion.
For imaging of bony structures, computed tomography (CT) can be considered the gold standard. Unfortunately, CT is not viable for the detailed investigation of the cartilaginous structures of the TMJ, due to the low soft tissue contrast (Pahwa et al. 2015). On the other hand, magnetic resonance imaging (MRI) is better suited for soft‐tissue imaging and has proven to be a useful approach for clinical TMJ disc investigation (Ahmad et al. 2009). Nevertheless, resolution and contrast of standard MRI sequences used for the TMJ are not sufficient to reliably segment the disc or quantify disc position (Larheim, 2005; Stehling et al. 2007). Furthermore, scans are commonly acquired using somewhat high inter‐slice spacing and mostly focus on sagittal images (Ahmad et al. 2009; Petersson, 2010; Amaral et al. 2013; Bae et al. 2016). Due to the rounded shape of the disc, a lot of information is lost with higher slice thickness, especially for the medial and lateral parts of the disc. Hence, MRI investigations of the disc mainly focused on the central part, which is quasi perpendicular to the sagittal imaging plane (Eberhard et al. 2002; Katzberg & Tallents, 2005). Although a significant link between disc morphology and disc position has been reported previously (Amaral et al. 2013), correlation between clinical diagnosis and MRI findings is still an ongoing subject of debate (Manfredini & Guarda‐Nardini, 2008; Petersson, 2010; Park et al. 2012; Galhardo et al. 2013; Wurm et al. 2018). Regardless, MRI continues to be the most promising tool for the detailed, in vivo investigation of disc positioning as well as shape.
Previous computational investigations of the TMJ during functional movements have mainly focused on condylar movement and TMJ joint space changes (Fushima et al. 2003; Palla et al. 2003; Gallo, 2005; Ettlin et al. 2008). These studies used a combination of a jaw tracking system and bone meshes, acquired from a closed mouth MRI, to investigate the changes in condyle position and joint space. However, in joint space studies, the disc morphology is not directly acquired for movements or different positions and instead is inferred indirectly by the distance between the bone surfaces. Therefore, it does not account for the actual change in disc shape, which might be more complicated than depicted by the joint space. Some previous studies have measured disc morphology directly (Donzelli et al. 2004; Gallo, 2012) but they used a standard clinical MRI sequence (1.5 Tesla MRI; 0.5 mm resolution; 2 mm slice thickness), which does not resolve the thin regions of the disc because information is lost due to the large slice thickness of conventional MRI sequences. Additionally, precise bone boundaries cannot be acquired by sole use of MRI, and hence the combination of high‐resolution joint MRI volumes with a modality suited for bone imaging (e.g. CT) would even further increase the quality of the obtained meshes. Al‐Saleh et al. (2017b) presented a workflow combining CBCT and MRI images of the temporomandibular disc but did also not use a high‐resolution MRI sequence (1.5 Tesla MRI; 0.8 × 0.5/0.6 × 0.5 mm resolution; 2–3 mm slice thickness), which makes in vivo shape change investigations very difficult. Additionally, their analysis of the TMJ focused on changes of the joint before and after mandibulotomy, where bigger changes of shape and position can be expected (Al‐Saleh et al. 2017a). Moreover, all studies that tried to investigate the TMJ disc directly, only investigated the joint in closed and open mouth positions, which does not capture the full range of deformation and position change of the disc during all functional movements of the mandible.
The position and shape of the TMJ disc in different jaw postures has not previously been measured in vivo. Understanding disc placement and morphology in relation to the skull and condyle could provide insight into the mechanisms underlying early stages of disc displacement, e.g. thinner regions of the disc in different jaw postures are likely related to regions of high compressive stress. In this study, a novel imaging protocol that combines a high‐resolution MRI sequence for the TMJ disc with CT images of the surrounding bone structures, in order to quantify disc morphology in vivo, is proposed. Using this protocol, disc morphology for five different jaw positions (closed, open, protrusion, left laterotrusion, right laterotrusion) was analyzed to provide the most comprehensive picture of disc positioning and thickness changes reported to date.
Material and methods
Data were acquired from one symptom‐free volunteer. Ethics approval was obtained from the institutional review board of the Medical University of Vienna and written informed consent was obtained. The normality of functional movements was assessed by mandibular condyle tracings (Piehslinger et al. 1993a,1993b, 1994a,1994b,1994c).
To generate high resolution representations of the bony structures of the masticatory region, one closed‐mouth CT (Siemens™ Sensation 4) volume with an in‐slice resolution of 0.3 × 0.3 mm and a slice thickness of 0.5 mm was collected. To improve the quality of the dentition we performed optical scans (Ceramill™ map 400) of plaster models (Gypsum Stone IV).
MRI scans were performed on a Siemens™ Prisma 3T machine using a 64‐channel head coil (Table 1). To obtain overall spatial information on muscles and the soft tissue structures, a full skull MRI scan using a coronal Double Echo Steady State (DESS) sequence was created, encompassing the head from the top to the shoulders and from the corner of the eyes to around the posterior end of the atlas. To enable disc segmentation, an additional Turbo Spin Echo T1 sequence scan for both TMJs was performed. This approach yielded volumes with an in‐plane resolution of 0.17 mm and a slice thickness of 1 mm. TMJ scans were performed in sagittal (T1 parasag) and coronal (T1 paracor) direction to diminish the loss of information due to the disc's rounded shape.
Table 1.
Parameters for MRI sequences
| DESS coronal | T1 parasag | T1 paracor | |
|---|---|---|---|
| FOV (mm × mm) | 218 × 153 | 150 × 150 | 150 × 150 |
| Number of slices | 256 | 28 | 32 |
| Slices thickness (mm) | 0.5 | 1 | 1 |
| Slices gap | 0 | 10% | 10% |
| Number of averages | 1 | 3 | 3 |
| TR (ms) | 15.03 | 804 | 918 |
| TE (ms) | 4.18 | 12 | 12 |
| Flip angle (deg) | 18 | 150 | 150 |
| Fat suppression | Water excit. Fast | – | – |
| Acquisition matrix (pix) | 384 × 269 | 448 × 314 | 448 × 314 |
| Pixel bandwidth (Hz/pix) | 169 | 248 | 248 |
| MR acquisition type | 3D | 2D | 2D |
| Voxel sizes (mm) | 0.3 × 0.3 × 0.5 | 0.17 × 0.17 × 1.0 | 0.17 × 0.17 × 1.0 |
| Total acquisition time (min s−1) | 6 : 09 | 9 : 32 | 10 : 53 |
High resolution TMJ MRI scans were collected in five positions:
Closed mouth
Opened mouth
Right laterotrusion
Left laterotrusion
Protrusion
To ensure that the volunteer kept the position of the mandible stable during MRI acquisition, silicone bite blocks were created. To confirm the correct mandible position during bite block creation, a jaw‐tracking system (Gamma™ Cadiax 4) was used and condylar positions were recorded.
Registration of image volumes (MRI‐MRI as well as CT‐MRI) was performed semi‐automatically using normalized mutual information and the conjugate gradient method (Fig. 1). CT segmentation of bony structures was performed semi‐automatically with minor manual postprocessing. Dental surface scans were registered to the respective CT bony structures using an iterative closest point (ICP) registration in meshmixer (Autodesk, Inc.). Segmentation of the temporomandibular discs was performed manually for sagittal and coronal volumes by an expert specialized in TMD and TMJ‐MRI. Moreover, the mandibular condyles were segmented semi‐automatically from MRI data for all positions. Segmentation and registration were performed using amira 3D™.
Figure 1.
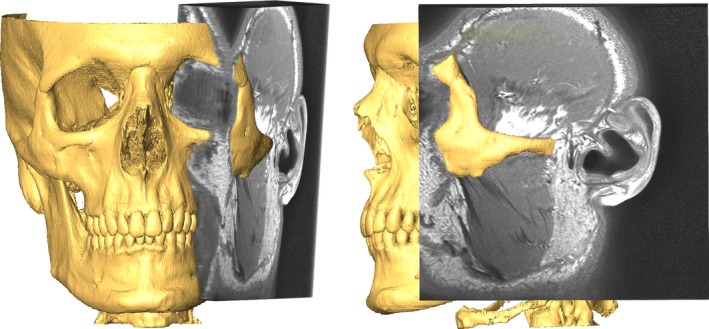
Registered CT (rendered) and MRI volumes.
In the interest of dose minimization, the CT images of the bony structures were only collected in the closed‐mouth position. The segmented meshes then had to be translated and rotated to fit the different positions collected for the joint. To achieve this, we used the previously segmented condyles from the MRI as the target for an ICP registration of the CT mandible. To control the position, we scanned the bite blocks used during data acquisition with an optical scanner to get 3D representations; these scanned blocks were fitted between the model's teeth using ICP.
Segmented meshes were imported into meshmixer for post processing (e.g. filling holes, smoothing). A cartilage layer of 0.4 mm was added to the condyle as well as the articular fossa (Hansson et al. 1977). Lastly, disc segmentations of the sagittal and coronal volumes had to be combined to one smooth disc representation. This was achieved by enveloping the two segmentation results with a smooth mesh that fit the segmentations as well as possible while not interpenetrating with the bones or cartilage layers.
Thickness measures were performed using meshmixer. Thickness was estimated using the mean distance of 50 rays distributed around the surface normal direction to eliminate measurement errors due to possible small overhangs of the mesh. The angle of the rays was changed incrementally up to a 5° deviation from the normal angle. In addition, the positioning of the disc relative to the condyle and skull were computed and visualized using the surface area with a mesh‐to‐mesh distance of < 1 mm between the disc and the cartilage layers. For mandible measurements, the meshes were first registered using ICP to get rid of differences in mandible position, because the mandibular position changes during functional movements.
Results
The image acquisition set‐up yielded image volumes with high enough resolution and contrast for the segmentation of the temporomandibular joint disc (Fig. 2). Due to the small slice thickness, the combined segmentations already capture the rounded shape of the disc quite well. Still raw segmentations were rough and manual post‐processing had to be performed to create smooth disc meshes. The final 3D disc meshes fit the coronal and sagittal segmentations well and did not interpenetrate the cartilage surfaces (Fig. 3).
Figure 2.
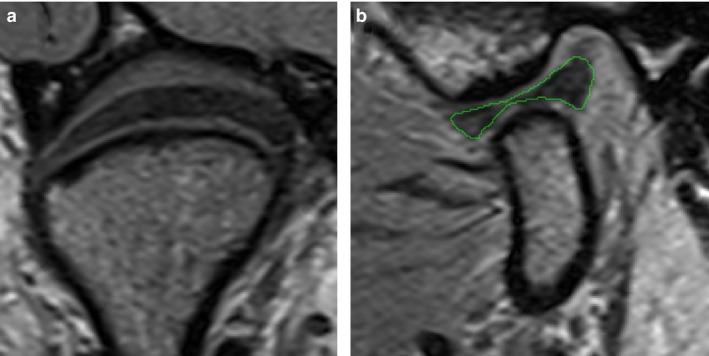
Examples of achieved MRI image quality: (a) coronal slice, (b) sagittal slice with segmentation (green).
Figure 3.
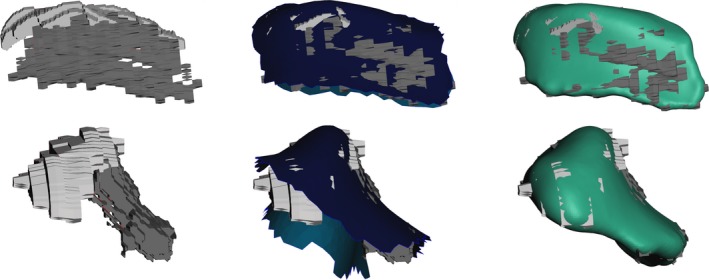
Workflow of disc mesh creation. Leftmost pictures show segmentation from MRI; middle pictures show interpenetration with cartilage borders, and right pictures show the smooth final meshes in comparison with the MRI segmentation.
Using the condyles segmented from the MRI images in combination with the scanned bite blocks allowed us to successfully translate and rotate the closed‐mouth CT mandible to the desired jaw postures (Fig. 4). Combining the re‐positioned segmented bone meshes, together with the disc mesh, enabled the generation of high‐resolution representations of the TMJ for all imaged postures (Fig. 5).
Figure 4.
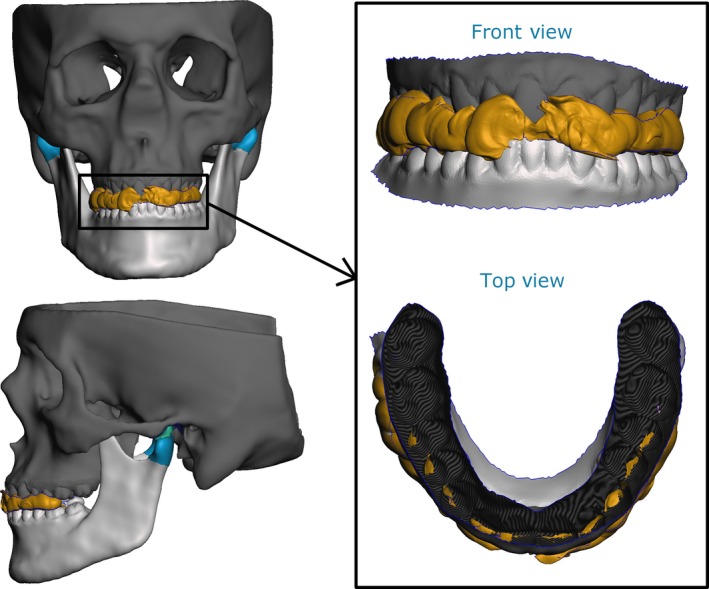
Example of qualitative verification of mandible position (protrusion shown) using the scanned bite blocks (yellow, bite block; green, articular disc; light blue, condylar cartilage; dark blue, articular fossa cartilage).
Figure 5.
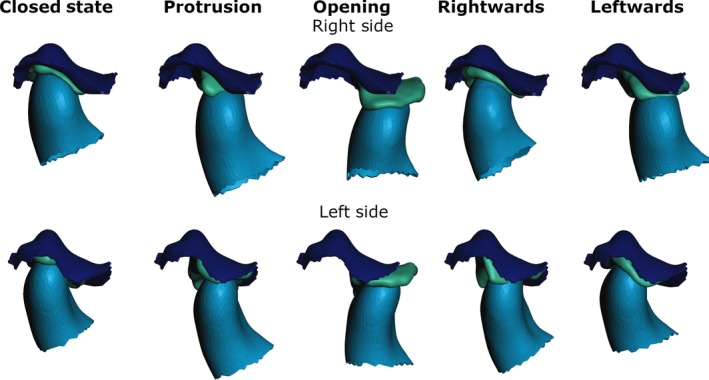
Disc and condyle position for the different postures (Rightwards and Leftwards describe corresponding mandible movements. Dark blue, fossa articularis; green, disc; light blue, condyle).
Figures 6 and 7 depict the visualization of the thickness measurements for the right and left TMJ disc for all five mandible positions. Using the classical sagittal categorization of disc zones, the intermediate zone of the disc is the thinnest, followed by the anterior band; the posterior band is the thickest. Looking at the meshes using a three‐dimensional (3D) approach, instead of sagittal slices, the thinnest part of the disc tends to be on the lateral side of the disc. This trend holds true for all positions as well as for the right‐ and the left‐side discs.
Figure 6.
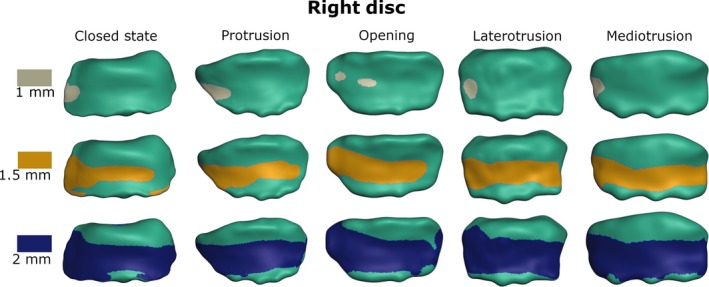
Visualization of disc thickness for the right disc from top view (gray/yellow/blue area is thinner than 1/1.5/2 mm, respectively).
Figure 7.
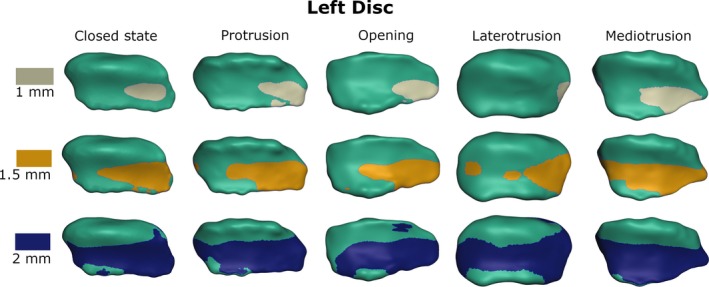
Visualization of disc thickness for the left disc from top view (gray/yellow/blue area is thinner than 1/1.5/2 mm, respectively).
For opening, protrusion and mediotrusion the disc meshes show a mostly anterior movement with a slight lateral shift. Moreover, a flattening of the disc can be observed the further anterior it moves. This change in roundness is accompanied by a slight elongation of the medial‐lateral direction. For laterotrusion, there seems to rather be a medial‐lateral shortening of the disc with a slight medial movement of the disc.
Table 2 shows the measured translation of the temporomandibular disc relative to the mandibular condyle (after registration to the mandible posture) and the fossa articularis, respectively. Translation was measured using the distance between the central point of the area of cartilage that was closer to the disc than 1 mm. Figure 8 shows a graphical representation of these results. The disc expresses a rather large translation relative to the skull with a maximum distance of 8.3 mm, while translation relative to the mandible was only 3 mm.
Table 2.
Translation of the disc relative to mandibular condyle and fossa articularis, respectively. Distances are measured from closed mouth position
| Relative to mandibular condyle | Relative to fossa articularis | |||
|---|---|---|---|---|
| Right disc (mm) | Left disc (mm) | Right disc (mm) | Left disc (mm) | |
| Protrusion | 1.39 | 1.5 | 6.11 | 6.14 |
| Opening | 3.01 | 1.55 | 7.17 | 8.28 |
| Mandible leftwards | 2.42 | 0.87 | 6.69 | 2.26 |
| Mandible rightwards | 0.74 | 0.53 | 1.90 | 5.87 |
| Mean distance | 1.89 | 1.12 | 5.47 | 5.63 |
Figure 8.
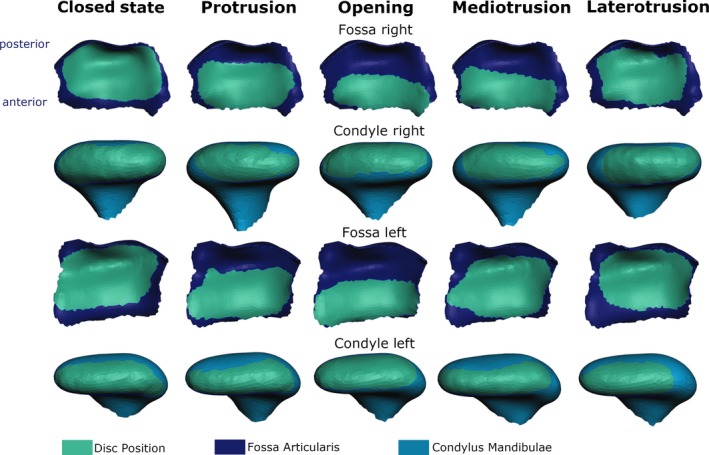
Visualization of disc position (green area) relative to fossa articularis (dark blue) and mandibular condyle (light blue) for the right and left disc (top view for condyle and bottom view for fossa).
Discussion
This paper presents an investigation of in vivo changes of mandibular as well as TMJ disc position for various mandible postures. Moreover, in vivo investigation of shape changes of the TMJ disc is possible due to the high resolution and contrast of the volumes acquired using the presented MRI protocol.
Acquisition of TMJ image volumes of sufficient fidelity for disc and bone segmentation is a very difficult task because of the small size of the involved structures. Hence resolution has to be high, while slice thickness should be as small as possible, a combination that is difficult to achieve without a substantial increase in noise, examination time and/or loss of contrast. But taking into account that the TMJ disc is surrounded by soft tissue structures (e.g. articular cartilage, tendinous capsule, muscle attachments), image contrast is an equally important factor for disc segmentation. Considering all these factors, a T1 TSE sequence was chosen. Using a Turbo‐Spin‐Echo sequence enables the researcher to speed up data acquisition or keep acquisition time stable, while allowing for longer recovery of longitudinal magnetization, leading to an improved signal‐to‐noise ratio (Hennig et al. 1986). Most investigations of the TMJ use either a proton density (PD) or T2‐mapping to better depict fluid components of the TMD and consequently better identify tears. As this study was focused on the morphology of the structures, we decided to use a T1 sequence, which generally speaking is better suited for imaging anatomical outlines of the involved structures. The high resolution and small slice thickness of the presented sequence, which surpass all previously reported investigations of the TMJ, enable us to acquire MRI images that allow for resolution as well as contrast levels, which, to the best of the authors’ knowledge, have not been previously reported for TMJ imaging.
Another difficulty while imaging the TMJ disc is its rounded shape. Speaking in very simplified terms, the disc sits on the condyle like a hollowed out half‐sphere and hence becomes more parallel to the sagittal and coronal imaging plane as it moves away from the central part. In previous literature, the disc has been imaged with quite a large slice thickness of up to 5 mm (Karlo et al. 2012; Bae et al. 2016; Wurm et al. 2018), which leads to a substantial amount of lost information. Hence, most research focused on the central part of the disc, where the structure is mostly perpendicular to the imaging plane. One drawback of this procedure is that investigations of two‐dimensional images cannot fully capture the 3D change in shape (e.g. in partially dislocated discs). In addition, the region of interest for disc pathologies might, for example, lie further medially or laterally, where sagittal two‐dimensional (2D) slices cannot fully represent the morphology of the disc. To diminish this effect, in this investigation images were acquired using a sequence with a slice thickness of 1 mm, which has not been reported before for the TMJ. Additionally, images were collected in sagittal as well as coronal direction, and segmentation information from both volumes was combined to even further increase the amount of image information.
The workflow presented in this study results in a 3D surface mesh for the structures of the TMJ. Importantly, this enables the investigation of disc shape changes independent of any imaging plane. Generally, the disc was thinnest on the lateral part for all investigated jaw postures. Interestingly, this lateral zone has been previously reported in the literature to be the main site of TMJ disc perforations, degeneration of the articulating surfaces and increased stresses (Öberg et al. 1971; Sava & Scutariu, 1991; Stratmann et al. 1996; Koolstra & van Eijden, 2006; Mori et al. 2010). This seems to be a promising route for future morphological investigations into the onset of TMD, which could possibly help to explain the occurrence of TMJ joint clicking with an initial partial disc degeneration or dislocation in the lateral part of the joint.
Another benefit of the presented approach is the visualization of disc positioning. The reported findings agree with previous literature that reports a large dorsoventral movement of the disc with a moderate mediolateral shift (Gallo, 2012). Moreover, the presented work enables easy investigation of changes of disc position relative to the mandibular condyle and the fossa articularis. The position of the disc relative to the mandible is particularly hard to investigate without 3D representations because the position and orientation of the mandible changes during functional movements and hence a spatial registration has to be performed to eliminate global changes. With the presented approach this is a simple task, fulfilled by using a basic ICP registration of the mandible meshes, which do not change in shape. This comparison of position is not only a valuable tool for visualization of function but could potentially be useful in the future to establish guidelines for the characterization of healthy and pathological disc displacements during functional jaw movements.
Additionally, the high‐resolution meshes enable the investigation of TMJ disc shape changes. The disc seems to flatten and slightly elongate in the medial‐lateral direction while moving anteriorly. For laterotrusion, a medial‐lateral shortening of the disc with a light medial movement of the disc was observed, which might be caused by compression of the joint during the movement. These findings agree with previous literature on human TMJ disc shape that reports deformations in the mediolateral directions as well as changes in convexity for jaw opening (Gallo, 2012). Sindelar & Herring (2005) investigated disc shape changes in TMJ discs of pigs, using a differential variable reluctance transducer to measure antero‐posterior strain in the lateral aspect of the posterior and intermediate band of the TMJ disc, and used this information to investigate deformation. They reported elongation in the anterior‐posterior direction for opening, protrusion and contralateral movements as well as shortening for ipsilateral and closing movements. Unfortunately, it is hard to compare these measurements of linear deformation of fixed locations inside the disc with the morphological results of the presented study. Generally speaking, a clear elongation or shortening of the medial zone cannot be seen in the presented results. This might be the case because the authors report deformation corresponding to internal strain in the disc, which might not necessarily agree with morphological changes of the 3D surface of the disc (Sindelar & Herring, 2005).
One of the few possibilities for the examination of TMJ loads is biomechanical computer simulations. Various models have been proposed with different levels of anatomical accuracy of the TMJ (Koolstra & van Eijden, 2005; de Zee et al. 2007; Hannam et al. 2008; Mori et al. 2010; Commisso et al. 2015). These models have been used to investigate the TMJ for various variables, such as volumetric strain (Koolstra & van Eijden, 2006) or tensile stress (Koolstra & Tanaka, 2009) during open–close movements. The validation of biomechanical models is a frequently discussed topic (Hicks et al. 2015). As described above, in vivo measurements of TMJ loads are not possible and standard imaging sequences do not produce data of a quality that is feasible for validation of TMJ disc model movement and deformation. The data presented in this paper enable researchers to create a biomechanical model including high resolution representations of all necessary structures, and, in addition, the information on disc position and disc deformation for various functional movements offers unique possibilities for model validation.
A limitation of this study is the assumption of a uniform thickness of the cartilage layer. Cartilage thickness has been shown to change to some extent on the mandible as well as temporal bone sites (Hansson et al. 1977; Singh & Detamore, 2009; Mirahmadi et al. 2017). The cartilage layers are extremely thin and virtually impossible to capture using current MRI sequences. In order to not completely neglect the presence of articular cartilage, we decided to model a uniform layer with a thickness taken from the literature.
Understanding how the TMJ disc displaces and changes shape during functional movements requires a characterization of the surrounding bone structures, since these are mechanically coupled. In this study, we do so by acquiring CT imaging data and merging the data with MRI imaging for the disc. The use of a CT scan, however, is not ideal. The invasive nature of the scan limits the applicability of the approach for daily clinical use, even though one single CT suffices for any number of investigated postures and the estimated dose of a single CT scan is low (McCollough et al. 2015). Nevertheless, the development of a completely non‐invasive workflow is a challenge we plan to tackle in the future. Potential solutions to this problem could be designated MRI sequences for bone acquisition, such as ultra‐short‐echo‐time or zero‐echo‐time sequences (Reichert et al. 2005; Wiesinger et al. 2016), as well as the use of a statistical shape modeling approach for mesh deformation (Cootes et al. 1995; Baldwin et al. 2010).
The current workflow still requires some manual segmentation and processing steps. A workflow with a fully automated pipeline to minimize time as well as operator input variances would be the ideal case. As previously discussed, the small size of the disc as well as the surrounding soft tissue structures make a fully automated workflow non‐practical as of now and a further increase in image resolution as well as contrast has to be achieved first. Nevertheless, previous literature suggests that manual disc segmentation of MRI scans with comparably low resolution has proven to be reliable (Al‐Saleh et al. 2017b) and hence it is reasonable to expect that the manual segmentation of the presented high resolution scans is reliable as well.
To conclude, this paper presents a novel workflow and measurements for the in vivo investigation of the translation and shape change of the human temporomandibular joint for different positions, comprising all steps necessary from image acquisition to mesh analysis. One of the main contributions of this research was the definition of a high resolution and high contrast MRI sequence that enables the quantification of the morphology of the temporomandibular disc. Moreover, we present a straightforward mesh creation and registration pipeline that enables quite fast model creation, especially after the first initial meshes for the closed mouth position have been created. We show that our results agree with previous literature and plan on using the findings of this study in future research into the workings of pathologies of the TMD as well as the basis for the development of personalized biomechanical simulations of the masticatory region.
Conflict of interest
The authors declare no conflict of interest.
Author contributions
B.S., M.S.S., E.P., C.K., M.K., S.T. and I.S. were involved in conceptualization and design of the study. B.S., C.K. and S.T. collected the data. B.S. and M.S.S. prepared data for analysis, which was performed by B.S., M.S.S. and I.S. B.S. drafted the manuscript, which was co‐edited by all authors.
Acknowledgements
The authors would like to thank Ms Masopust from the Division of Radiology of the Dental Clinic of the Medical University of Vienna for her support during image acquisition.
This research has been funded by the Medical Scientific Fund of the Mayor of the City of Vienna and the Vienna School of Interdisciplinary Dentistry.
[Correction Statement: Correction added on 25 March 2019 after first online publication: Acknowledgment section has been updated in this version.]
References
- Agerberg G, Carlsson GE (1972) Functional disorders of the masticatory system I. Distribution of symptoms according to age and sex as judged from investigation by questionnaire. Acta Odontol Scand 30, 597–613. [DOI] [PubMed] [Google Scholar]
- Ahmad M, Hollender L, Anderson Q, et al. (2009) Research diagnostic criteria for temporomandibular disorders (RDC/TMD): development of image analysis criteria and examiner reliability for image analysis. Oral Surg Oral Med Oral Pathol Oral Radiol Endod 107, 844–860. [DOI] [PMC free article] [PubMed] [Google Scholar]
- Al‐Saleh MAQ, Punithakumar K, Lagravere M, et al. (2017a) Three‐dimensional morphological changes of the temporomandibular joint and functional effects after mandibulotomy. J Otolaryngol Head Neck Surg 46, 8. [DOI] [PMC free article] [PubMed] [Google Scholar]
- Al‐Saleh MAQ, Punithakumar K, Lagravere M, et al. (2017b) Three‐dimensional assessment of temporomandibular joint using MRI‐CBCT image registration. PLoS One 12, e0169555. [DOI] [PMC free article] [PubMed] [Google Scholar]
- Amaral RDO, Damasceno NNDL, De Souza LA, et al. (2013) Magnetic resonance images of patients with temporomandibular disorders: Prevalence and correlation between disk morphology and displacement. Eur J Radiol 82, 990–994. [DOI] [PubMed] [Google Scholar]
- Bae WC, Tafur M, Chang EY, et al. (2016) High‐resolution morphologic and ultrashort time‐to‐echo quantitative magnetic resonance imaging of the temporomandibular joint. Skeletal Radiol 45, 383–391. [DOI] [PMC free article] [PubMed] [Google Scholar]
- Baldwin MA, Langenderfer JE, Rullkoetter PJ, et al. (2010) Development of subject‐specific and statistical shape models of the knee using an efficient segmentation and mesh‐morphing approach. Comput Methods Programs Biomed 97, 232–240. [DOI] [PubMed] [Google Scholar]
- Castroflorio T, Bracco P, Farina D (2008) Surface electromyography in the assessment of jaw elevator muscles. J Oral Rehabil 35, 638–645. [DOI] [PubMed] [Google Scholar]
- Chase DC, Hudson J‐W, Gerard DA, et al. (1995) The Christensen prosthesis: a retrospective clinical study. Oral Surg Oral Med Oral Pathol Oral Radiol Endod 80, 273–278. [DOI] [PubMed] [Google Scholar]
- Commisso MS, Martínez‐Reina J, Ojeda J, et al. (2015) Finite element analysis of the human mastication cycle. J Mech Behav Biomed Mater 41, 23–35. [DOI] [PubMed] [Google Scholar]
- Cootes TF, Taylor CJ, Cooper DH, et al. (1995) Active shape models – their training and application. Comput Vis Image Underst 61, 38–59. [Google Scholar]
- Donzelli PS, Gallo LM, Spilker RL, et al. (2004) Biphasic finite element simulation of the TMJ disc from in vivo kinematic and geometric measurements. J Biomech 37, 1787–1791. [DOI] [PubMed] [Google Scholar]
- Drake R, Vogl W, Mitchell A (2014) Gray's Anatomy for Students, 3rd edn London: Churchill Livingstone. [Google Scholar]
- Eberhard D, Bantleon HP, Steger W (2002) The efficacy of anterior repositioning splint therapy studied by magnetic resonance imaging. Eur J Orthod 24, 343–352. [DOI] [PubMed] [Google Scholar]
- Ettlin DA, Mang H, Colombo V, et al. (2008) Stereometric assessment of TMJ space variation by occlusal splints. J Dent Res 87, 877–881. [DOI] [PubMed] [Google Scholar]
- Fushima K, Gallo LM, Krebs M, et al. (2003) Analysis of the TMJ intraarticular space variation: a non‐invasive insight during mastication. Med Eng Phys 25, 181–190. [DOI] [PubMed] [Google Scholar]
- Galhardo APM, Da Costa Leite C, Gebrim EMMS, et al. (2013) The correlation of research diagnostic criteria for temporomandibular disorders and magnetic resonance imaging: a study of diagnostic accuracy. Oral Surg Oral Med Oral Pathol Oral Radiol 115, 277–284. [DOI] [PubMed] [Google Scholar]
- Gallo LM (2005) Modeling of temporomandibular joint function using MRI and jaw‐tracking technologies – Mechanics. Cells Tissues Organs 180, 54–68. [DOI] [PubMed] [Google Scholar]
- Gallo LM (2012) Movements of the temporomandibular joint disk. Semin Orthod 18, 92–98. [Google Scholar]
- Hannam AG, Stavness I, Lloyd JE, et al. (2008) A dynamic model of jaw and hyoid biomechanics during chewing. J Biomech 41, 1069–1076. [DOI] [PubMed] [Google Scholar]
- Hansson T, Öberg T, Carlsson GE, et al. (1977) Thickness of the soft tissue layers and the articular disk in the temporomandibular joint. Acta Odontol Scand 35, 77–83. [DOI] [PubMed] [Google Scholar]
- Hennig J, Nauerth A, Friedburg H (1986) RARE imaging: a fast imaging method for clinical MR. Magn Reson Med 3, 823–833. [DOI] [PubMed] [Google Scholar]
- Hicks JL, Uchida TK, Seth A, et al. (2015) Is my model good enough? Best practices for verification and validation of musculoskeletal models and simulations of human movement. J Biomech Eng 137, 020905. [DOI] [PMC free article] [PubMed] [Google Scholar]
- Ide Y, Nakazawa K (1991) Anatomical atlas of the temporomandibular joint. J Oral Maxillofac Surg 50, 657 Available from http://www.quintpub.com/display_detail.php3?psku=B2742#.XFqxnFVKjmE [Google Scholar]
- Ingawale S, Goswami T (2009) Temporomandibular joint: disorders, treatments, and biomechanics. Ann Biomed Eng 37, 976–996. [DOI] [PubMed] [Google Scholar]
- Karlo CA, Patcas R, Kau T, et al. (2012) MRI of the temporo‐mandibular joint: which sequence is best suited to assess the cortical bone of the mandibular condyle? A cadaveric study using micro‐CT as the standard of reference. Eur Radiol 22, 1579–1585. [DOI] [PubMed] [Google Scholar]
- Katzberg RW, Tallents RH (2005) Normal and abnormal temporomandibular joint disc and posterior attachment as depicted by magnetic resonance imaging in symptomatic and asymptomatic subjects. J Oral Maxillofac Surg 63, 1155–1161. [DOI] [PubMed] [Google Scholar]
- Koolstra JH, Tanaka E (2009) Tensile stress patterns predicted in the articular disc of the human temporomandibular joint. J Anat 215, 411–416. [DOI] [PMC free article] [PubMed] [Google Scholar]
- Koolstra JH, van Eijden TM (2005) Combined finite‐element and rigid‐body analysis of human jaw joint dynamics. J Biomech 38, 2431–2439. [DOI] [PubMed] [Google Scholar]
- Koolstra JH, van Eijden TMGJ (2006) Prediction of volumetric strain in the human temporomandibular joint cartilage during jaw movement. J Anat 209, 369–380. [DOI] [PMC free article] [PubMed] [Google Scholar]
- Koolstra JH, Tanaka E, Van Eijden TM (2007) Viscoelastic material model for the temporomandibular joint disc derived from dynamic shear tests or strain‐relaxation tests. J Biomech 40, 2330–2334. [DOI] [PubMed] [Google Scholar]
- Larheim TA (2005) Role of magnetic resonance imaging in the clinical diagnosis of the temporomandibular joint. Cells Tissues Organs 180, 6–21. [DOI] [PubMed] [Google Scholar]
- Manfredini D, Guarda‐Nardini L (2008) Agreement between research diagnostic criteria for temporomandibular disorders and magnetic resonance diagnoses of temporomandibular disc displacement in a patient population. Int J Oral Maxillofac Surg 37, 612–616. [DOI] [PubMed] [Google Scholar]
- McCollough CH, Bushberg JT, Fletcher JG, et al. (2015) Answers to common questions about the use and safety of CT Scans. Mayo Clin Proc 90, 1380–1392. [DOI] [PubMed] [Google Scholar]
- Mirahmadi F, Koolstra JH, Lobbezoo F, et al. (2017) Ex vivo thickness measurement of cartilage covering the temporomandibular joint. J Biomech 52, 165–168. [DOI] [PubMed] [Google Scholar]
- Mori H, Horiuchi S, Nishimura S, et al. (2010) Three‐dimensional finite element analysis of cartilaginous tissues in human temporomandibular joint during prolonged clenching. Arch Oral Biol 55, 879–886. [DOI] [PubMed] [Google Scholar]
- Nickel J, Spilker R, Iwasaki L, et al. (2009) Static and dynamic mechanics of the temporomandibular joint: plowing forces, joint load and tissue stress. Orthod Craniofac Res 12, 159–167. [DOI] [PMC free article] [PubMed] [Google Scholar]
- Öberg T, Carlsson GE, Fajers CM (1971) The temporomandibular joint: a morphologic study on a human autopsy material. Acta Odontol Scand 29, 349–384. [DOI] [PubMed] [Google Scholar]
- Pahwa S, Seith Bhalla A, Roychaudhary A, et al. (2015) Multidetector computed tomography of temporomandibular joint: a road less travelled. World J Clin Cases, 16, 442–449. [DOI] [PMC free article] [PubMed] [Google Scholar]
- Palla S, Gallo LM, Gössi D (2003) Dynamic stereometry of the temporomandibular joint. Orthod Craniofac Res 6(Suppl. 1), 37–47. [DOI] [PubMed] [Google Scholar]
- Park JW, Song HH, Roh HS, et al. (2012) Correlation between clinical diagnosis based on RDC/TMD and MRI findings of TMJ internal derangement. Int J Oral Maxillofac Surg 41, 103–108. [DOI] [PubMed] [Google Scholar]
- Petersson A (2010) What you can and cannot see in TMJ imaging – an overview related to the RDC/TMD diagnostic system. J Oral Rehabil 37, 771–778. [DOI] [PubMed] [Google Scholar]
- Piehslinger E, Celar A, Futter K, et al. (1993a) Orthopedic jaw movement observations. Part I: determination and analysis of the length of protrusion. Cranio 11, 113–117. [DOI] [PubMed] [Google Scholar]
- Piehslinger E, Celar RM, Horejs T, et al. (1993b) Orthopedic jaw movement observations. Part II: the rotational capacity of the mandible. Cranio 11, 206–210. [DOI] [PubMed] [Google Scholar]
- Piehslinger E, Celar A, Celar RM, et al. (1994a) Orthopedic jaw movement observations. Part V: transversal condylar shift in protrusive and retrusive movement. Cranio 12, 247–251. [DOI] [PubMed] [Google Scholar]
- Piehslinger E, Celar A, Schmid‐Shwap M, et al. (1994b) Orthopedic jaw movement observations. Part III: the quantitation of mediotrusion. Cranio 12, 33–37. [DOI] [PubMed] [Google Scholar]
- Piehslinger E, Celar RM, Horejs T, et al. (1994c) Recording orthopedic jaw movements. Part IV: the rotational component during mastication. Cranio 12, 156–160. [DOI] [PubMed] [Google Scholar]
- Reichert ILH, Robson MD, Gatehouse PD, et al. (2005) Magnetic resonance imaging of cortical bone with ultrashort TE pulse sequences. Magn Reson Imaging 23, 611–618. [DOI] [PubMed] [Google Scholar]
- Sava A, Scutariu M (1991) Functional anatomy of the temporo‐mandibular joint (II). Rev Med Chir Soc Med Nat Iasi 116, 1213–1217. [PubMed] [Google Scholar]
- Schiffman E, Ohrbach R, Truelove E, et al. (2014) Diagnostic criteria for temporomandibular disorders (DC/TMD) for clinical and research applications: recommendations of the International RDC/TMD Consortium Network and Orofacial Pain Special Interest Group. J Oral Facial Pain Headache 28, 6–27. [DOI] [PMC free article] [PubMed] [Google Scholar]
- Sindelar BJ, Herring SW (2005) Soft tissue mechanics of the temporomandibular joint. Cells Tissues Organs 180, 36–43. [DOI] [PubMed] [Google Scholar]
- Singh M, Detamore MS (2009) Biomechanical properties of the mandibular condylar cartilage and their relevance to the TMJ disc. J Biomech 42, 405–417. [DOI] [PubMed] [Google Scholar]
- Solberg WK, Woo MW, Houston JB (1979) Prevalence of mandibular dysfunction in young adults. J Am Dent Assoc 98, 25–34. [DOI] [PubMed] [Google Scholar]
- Stankovic S, Vlajkovic S, Boskovic M, et al. (2013) Morphological and biomechanical features of the temporomandibular joint disc: an overview of recent findings. Arch Oral Biol 58, 1475–1482. [DOI] [PubMed] [Google Scholar]
- Stehling C, Vieth V, Bachmann R, et al. (2007) High‐resolution magnetic resonance imaging of the temporomandibular joint: image quality at 1.5 and 3.0 Tesla in volunteers. Invest Radiol 42, 428–434. [DOI] [PubMed] [Google Scholar]
- Stratmann U, Schaarschmidt K, Santamaria P (1996) Morphometric investigation of condylar cartilage and disc thickness in the human temporomandibular joint: significance for the definition of ostearthrotic changes. J Oral Pathol Med 25, 200–205. [DOI] [PubMed] [Google Scholar]
- Tanaka E, Koolstra JH (2008) Biomechanics of the temporomandibular joint. J Dent Res 87, 989–991. [DOI] [PubMed] [Google Scholar]
- Wiesinger F, Sacolick LI, Menini A, et al. (2016) Zero TE MR bone imaging in the head. Magn Reson Med 75, 107–114. [DOI] [PubMed] [Google Scholar]
- Wilkes CH (1989) Internal derangements of the temporomandibular joint. Pathological variations. Arch Otolaryngol Head Neck Surg 115, 469. [DOI] [PubMed] [Google Scholar]
- Wurm MC, Behrends TK, Wolfgang W, et al. (2018) Correlation between pain and MRI findings in TMD patients. J Craniomaxillofac Surg 46, 1167–1171. [DOI] [PubMed] [Google Scholar]
- de Zee M, Dalstra M, Cattaneo PM, et al. (2007) Validation of a musculo‐skeletal model of the mandible and its application to mandibular distraction osteogenesis. J Biomech 40, 1192–1201. [DOI] [PubMed] [Google Scholar]


