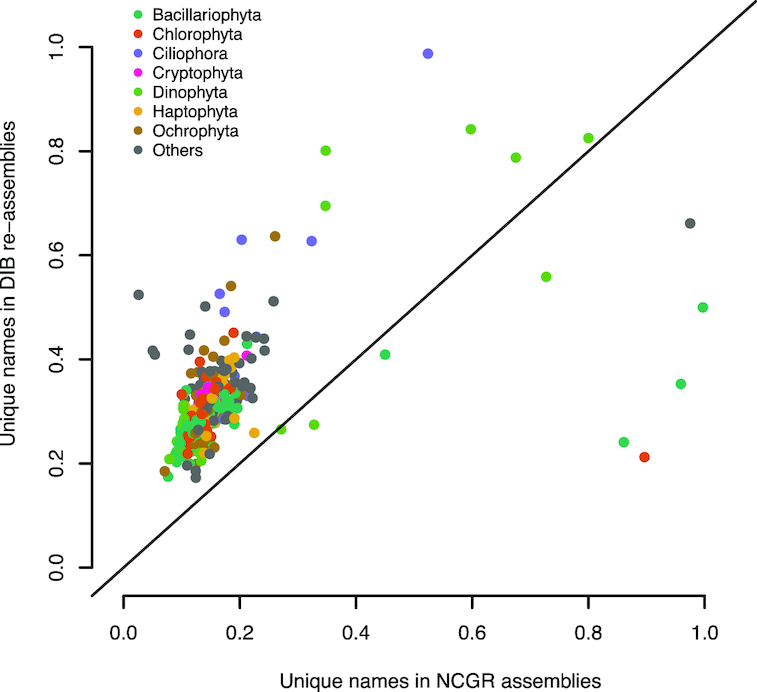
Figure 7:

Unique gene names found in a subset (296 samples) of either NCGR ‘nt’ assemblies or DIB re-assemblies but not found in the other assembly, normalized to the number of annotated contigs in each assembly. The line indicates a 1:1 relationship between the unique gene names in DIB and NCGR. More than 97% of the DIB assemblies had more unique gene names than in NCGR assemblies of the same sample.
