

Abstract
Background
Rheumatoid arthritis is a systemic auto‐immune disorder that causes widespread and persistent inflammation of the synovial lining of joints and tendon sheaths. Presently, there is no cure for rheumatoid arthritis and treatment focuses on managing symptoms such as pain, stiffness and mobility, with the aim of achieving stable remission and improving mobility. Celecoxib is a selective non‐steroidal anti‐inflammatory drug (NSAID) used for treatment of people with rheumatoid arthritis.
Objectives
To assess the benefits and harms of celecoxib in people with rheumatoid arthritis.
Search methods
We searched the Cochrane Central Register of Controlled Trials (CENTRAL), MEDLINE, Embase and clinical trials registers (ClinicalTrials.gov and the World Health Organization trials portal) to May 18, 2017. We also searched the reference and citation lists of included studies.
Selection criteria
We included prospective randomized controlled trials (RCTs) that compared oral celecoxib (200 mg and 400 mg daily) versus no intervention, placebo or a traditional NSAID (tNSAID) in people with confirmed rheumatoid arthritis, of any age and either sex. We excluded studies with fewer than 50 participants in each arm or had durations of fewer than four weeks treatment.
Data collection and analysis
We used standard methodological procedures expected by The Cochrane Collaboration.
Main results
We included eight RCTs with durations of 4 to 24 weeks, published between 1998 and 2014 that involved a total of 3988 adults (mean age = 54 years), most of whom were women (73%). Participants had rheumatoid arthritis for an average of 9.2 years. All studies were assessed at high or unclear risk of bias in at least one domain. Overall, evidence was assessed as moderate‐to‐low quality. Five studies were funded by pharmaceutical companies.
Celecoxib versus placebo
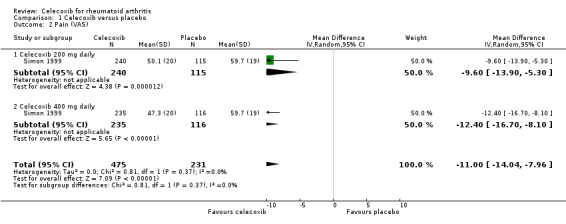
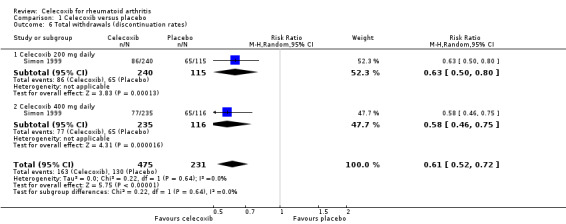
We included two studies (N = 873) in which participants received 200 mg daily or 400 mg daily or placebo. Participants who received celecoxib showed significant clinical improvement compared with those receiving placebo (15% absolute improvement; 95% CI 7% to 25%; RR 1.53, 95% CI 1.25 to 1.86; number needed to treat to benefit (NNTB) = 7, 95% CI 5 to 13; 2 studies, 873 participants; moderate to low quality evidence).
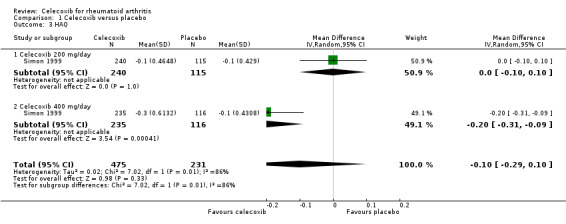
Participants who received celecoxib reported less pain than placebo‐treated people (11% absolute improvement; 95% CI 8% to 14%; NNTB = 4, 95% CI 3 to 6; 1 study, 706 participants) but results were inconclusive for improvement in physical function (MD ‐0.10, 95% CI 0.29 to 0.10; 1 study, 706 participants).
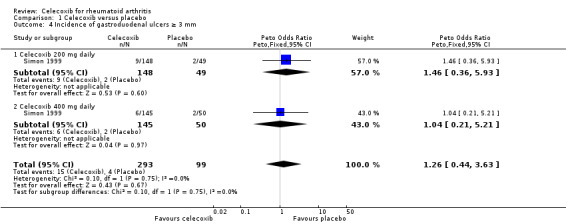
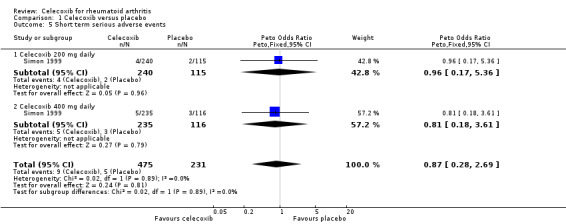
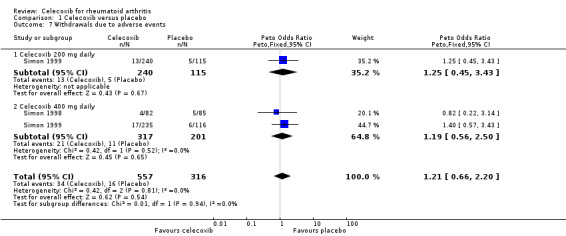
In the celecoxib group, 15/293 participants developed ulcers, compared with 4/99 in the placebo group (Peto OR 1.26, 95% CI 0.44 to 3.63; 1 study, 392 participants; low quality evidence). Nine (of 475) participants in the celecoxib group developed short‐term serious adverse events, compared with five (of 231) in the placebo group (Peto OR 0.87 (0.28 to 2.69; 1 study, 706 participants; low quality evidence).
There were fewer withdrawals among people who received celecoxib (163/475) compared with placebo (130/231) (22% absolute change; 95% CI 16% to 27%; RR 0.61, 95% CI 0.52 to 0.72; 1 study, 706 participants).
Cardiovascular events (myocardial infarction, stroke) were not reported. However, regulatory agencies warn of increased cardiovascular event risk associated with celecoxib.
Celecoxib versus tNSAIDs
Seven studies (N = 2930) compared celecoxib and tNSAIDs (amtolmetin guacyl, diclofenac, ibuprofen, meloxicam, nabumetone, naproxen, pelubiprofen); one study included comparisons of both placebo and tNSAIDs (N = 1149).
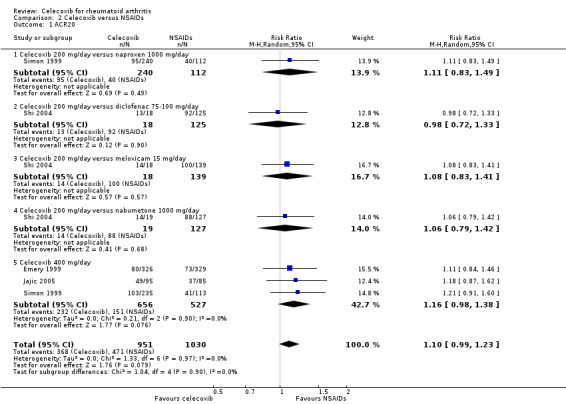
There was a small improvement, which may not be clinically significant, in numbers of participants achieving ACR20 criteria response in the celecoxib group compared to tNSAIDs (4% absolute improvement; 95% CI 0% less improvement to 8% more improvement; RR 1.10, 95% CI 0.99 to 1.23; 4 studies, 1981 participants). There was a lack of evidence of difference between participants in the celecoxib and tNSAID groups in terms of pain or physical function. Results were assessed at moderate‐to‐low quality evidence (downgraded due to risk of bias and inconsistency).
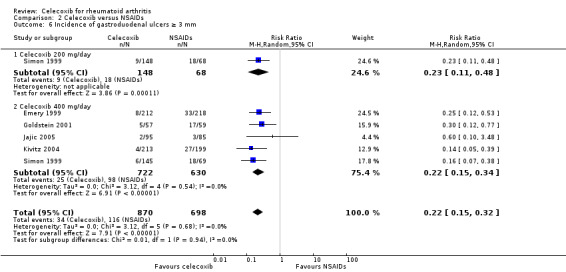
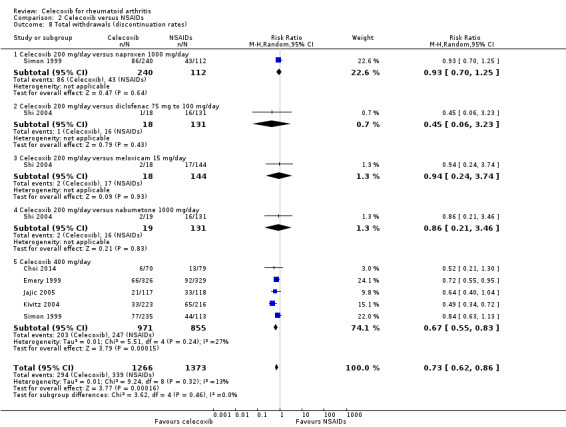
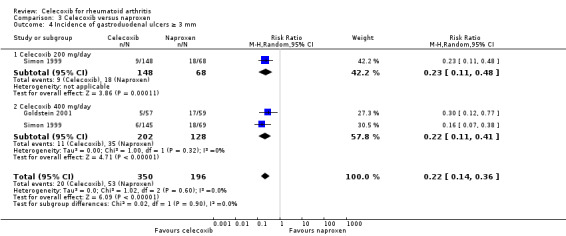
People who received celecoxib had a lower incidence of gastroduodenal ulcers ≥ 3 mm (34/870) compared with those who received tNSAIDs (116/698). This corresponded to 12% absolute change (95% CI 11% to 13%; RR 0.22, 95% CI 0.15 to 0.32; 5 studies, 1568 participants; moderate quality evidence). There were 7% fewer withdrawals among people who received celecoxib (95% CI 4% to 9%; RR 0.73, 95% CI 0.62 to 0.86; 6 studies, 2639 participants).
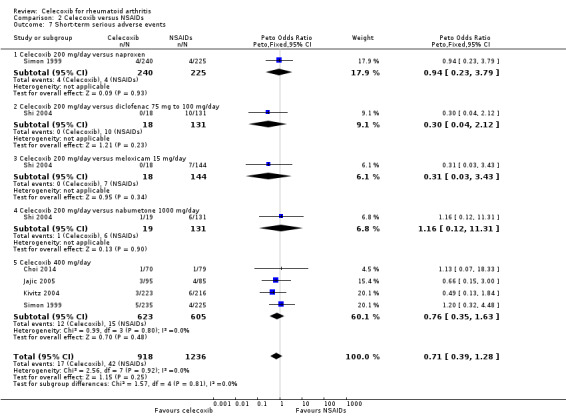
Results were inconclusive for short‐term serious adverse events and cardiovascular events (low quality evidence). There were 17/918 serious adverse events in people taking celecoxib compared to 42/1236 among people who received placebo (Peto OR 0.71; 95% CI 0.39 to 1.28; 5 studies, 2154 participants). Cardiovascular events were reported in both celecoxib and placebo groups in one study (149 participants).
Authors' conclusions
Celecoxib may improve clinical symptoms, alleviate pain and contribute to little or no difference in physical function compared with placebo. Celecoxib was associated with fewer numbers of participant withdrawals. Results for incidence of gastroduodenal ulcers (≥ 3 mm) and short‐term serious adverse events were uncertain; however, there were few reported events for either.
Celecoxib may slightly improve clinical symptoms compared with tNSAIDs. Results for reduced pain and improved physical function were uncertain. Particpants taking celecoxib had lower incidence of gastroduodenal ulcers (≥ 3 mm) and there were fewer withdrawals from trials. Results for cardiovascular events and short‐term serious adverse events were also uncertain.
Uncertainty about the rate of cardiovascular events between celecoxib and tNSAIDs could be due to risk of bias; another factor is that these were small, short‐term trials. It has been reported previously that both celecoxib and tNSAIDs increase cardiovascular event rates. Our confidence in results about harms is therefore low. Larger head‐to‐head clinical trials comparing celecoxib to other tNSAIDs is needed to better inform clinical practice.
Keywords: Humans; Anti‐Inflammatory Agents, Non‐Steroidal; Anti‐Inflammatory Agents, Non‐Steroidal/adverse effects; Anti‐Inflammatory Agents, Non‐Steroidal/therapeutic use; Arthritis, Rheumatoid; Arthritis, Rheumatoid/drug therapy; Celecoxib; Celecoxib/adverse effects; Celecoxib/therapeutic use; Myocardial Infarction; Myocardial Infarction/chemically induced; Myocardial Infarction/epidemiology; Pain Measurement; Randomized Controlled Trials as Topic; Stomach Ulcer; Stomach Ulcer/chemically induced; Stomach Ulcer/epidemiology; Stroke; Stroke/chemically induced; Stroke/epidemiology; Treatment Outcome
Plain language summary
Benefits and harms of celecoxib for treating people with rheumatoid arthritis
Review question
We aimed to assess the benefits (improvement in pain, stiffness, physical function) and harms (gut and heart problems) of celecoxib compared with other similar drugs or a fake drug (placebo) for adults with rheumatoid arthritis.
Background
Rheumatoid arthritis is an auto‐immune disease that causes the lining of joints to become inflamed making them painful, stiff and swollen. The small joints of hands and feet are usually affected first. Presently, there is no cure; treatment aims to achieve remission or delay disease progression to improve mobility and reduce pain, swelling and stiffness. Nonsteroidal anti‐inflammatory drugs (NSAIDs) are used to treat people with rheumatoid arthritis. Celecoxib is a selective NSAID which may help to relieve symptoms of rheumatoid arthritis.
Search date
We searched for evidence up to May 18, 2017.
Study characteristics
We included eight studies published between 1998 and 2014 that involved 3988 adults (average age 54 years), most of whom were women (73%). Participants had rheumatoid arthritis for an average of 9.2 years.
Studies compared celecoxib with another treatment; 1786 participants received celecoxib and 2202 received either placebo or a traditional NSAID (tNSAID).
Five studies were supported or funded by the pharmaceutical industry.
Key results
When compared with placebo, of every 100 people who received celecoxib, 15 had symptom improvement after 4 to 12 weeks. People who took celecoxib rated their pain 11 points lower (on a scale of 0 to 100) after 12 weeks.
Results were inconclusive about improvements in physical function and numbers of people who developed gastroduodenal ulcers over 3 mm diameter when we compared celecoxib and placebo. Evidence was also inconclusive about harms that appear shortly after use of the drugs. None of the studies that compared celecoxib and placebo reported heart attacks or strokes.
Results about improvement in pain and physical function were inconclusive when celecoxib was compared with tNSAIDs. A small improvement was found in relation to a scoring system (ACR20) used by doctors to assess people with rheumatoid arthritis. Of every 100 people who took celecoxib: 13 fewer developed gastroduodenal ulcers over 3 mm diameter; and 7 fewer withdrew from studies compared with people receiving tNSAIDs.
Celecoxib may improve rheumatoid arthritis symptoms and alleviate pain more than placebo, but probably provides little or no difference in physical function improvement.
Quality of evidence
Evidence was rated as moderate or low quality due to methodological shortcomings and few observed events indicating harms.
Summary of findings
Summary of findings for the main comparison. Celecoxib versus placebo.
|
Patient or population: people with rheumatoid arthritis Setting: ambulatory Intervention: celecoxib 200 mg daily and 400 mg daily Comparison: placebo | ||||||
| Outcomes | Anticipated absolute effects* (95% CI) | Relative effect (95% CI) | № of participants (studies) | Quality of the evidence (GRADE) | Comments | |
| Risk with placebo | Risk with celecoxib | |||||
| Clinical improvement: American College of Rheumatology 20% improvement criteria (ACR20) follow up: range 4 weeks to 12 weeks | 288 per 1000 | 441 per 1000 (360 to 536) | RR 1.53 (1.25 to 1.86) | 873 (2 RCTs) | ⊕⊕⊕⊝ Moderate¹ | 15% absolute improvement (95% CI 7% to 25%), 53% relative improvement (95% CI 25% to 86%), NNTB 7 (95% CI 5 to 13)² |
| Pain: self‐reported visual analogue scale (VAS) from 0 to 100 points (where 0 is no pain) follow up: 12 weeks | Mean pain = 60 | Mean pain in the celecoxib group was 11 points lower (14.04 lower to 7.96 lower) | ‐ | 706 (1 RCT) | ⊕⊕⊕⊝ Moderate¹ | 11% absolute improvement (95% CI 8% to 14%), 18% relative improvement (95% CI 13% to 23%), MD ‐11.00 (95% CI ‐14.04 to ‐7.96), NNTB 4 (95% CI 3 to 6)³ |
| Physical function: Health Assessment Questionnaire Disability Index (HAQ) scale 0 to 3; higher scores means worse functional ability; follow up: 12 weeks | Mean change in physical function = ‐0.1 | Mean change in physical function in the intervention group was 0.1 point better (0.29 better to 0.1 worse) | ‐ | 706 (1 RCT) | ⊕⊕⊝⊝ Low¹4 | 3.3% absolute improvement (95% CI 9.6% better to 3.3% worse); 1% relative improvement (2.9% better to 1% worse), MD = ‐0.10 (95% CI ‐0.29 to 0.10) (NNTB = NA) |
| Cardiovascular events (myocardial infarction, stroke) | See comment | See comment | Not estimable | (0 studies) | No studies reported this outcome | |
| Incidence of gastroduodenal ulcers ≥ 3 mm follow up: 12 weeks | 40 per 1000 | 51 per 1000 (17 to 142) | Peto OR 1.26 (0.44 to 3.63)⁶ | 392 (1 RCT) | ⊕⊕⊝⊝ Low¹ 7 | Celecoxib group had more participants with gastroduodenal ulcers ≥ 3 mm, but CI is wide. 1% absolute change (95% CI 4% less to 6% more), 26% relative change (95% CI 56% less to 263% more) (NNTH = NA) |
| Short‐term serious adverse events follow up: 12 weeks | 22 per 1000 | 19 per 1000 (6 to 55) | Peto OR 0.87 (0.28 to 2.69)⁶ |
706 (1 RCT) | ⊕⊕⊝⊝ Low¹ 7 | Celecoxib group had fewer SAEs, but CI is wide. 0% absolute change (95% CI 2% less to 2% more), 13% relative change (95% CI 72% less to 169% more) (NNTH = NA) |
| Total withdrawals; follow up: 12 weeks | 563 per 1000 | 343 per 1000 (293 to 405) | RR 0.61 (0.52 to 0.72) | 706 (1 RCT) | ⊕⊕⊝⊝ Low¹ 7 | Celecoxib group had fewer withdrawals. 22% absolute change (95% CI 16% to 27% less), 39% relative change (28% to 48% less), NNTH⁵ (95% CI 4 to 7)⁵ |
| *The risk in the intervention group (and its 95% confidence interval) is based on the assumed risk in the comparison group and the relative effect of the intervention (and its 95% CI). CI: Confidence interval; NA: not applicable; NNTB: number needed to treat for an additional beneficial outcome; NNTH: number needed to harm; RCT: randomized controlled trial; RR: Risk ratio; SAE: serious adverse event; OR: Odds ratio; | ||||||
| GRADE Working Group grades of evidence High quality: We are very confident that the true effect lies close to that of the estimate of the effect Moderate quality: We are moderately confident in the effect estimate: The true effect is likely to be close to the estimate of the effect, but there is a possibility that it is substantially different Low quality: Our confidence in the effect estimate is limited: The true effect may be substantially different from the estimate of the effect Very low quality: We have very little confidence in the effect estimate: The true effect is likely to be substantially different from the estimate of effect | ||||||
¹ Downgraded one level for study limitations: all trials had high or unclear risk of at least one type of bias.
² Number needed to treat for an additional beneficial outcome (NNTB) calculated using online calculator: http://www.nntonline.net/visualrx/.
³ Number needed to treat for an additional beneficial outcome (NNTB) for continuous outcomes calculated using the Wells calculator (from the CMSG Editorial office; http://musculoskeletal.cochrane.org/).
⁴ Downgraded one level due to inconsistency: high heterogeneity..
⁵ Number needed to harm (NNTH) calculated using online calculator: http://www.nntonline.net/visualrx/.
⁶ Report Peto OR which can be interpreted as an RR due to the low event rate.
⁷ Downgraded one level due to imprecision: few events
Summary of findings 2. Celecoxib versus traditional NSAIDs.
|
Patient or population: people with rheumatoid arthritis Setting: ambulatory Intervention: celecoxib Comparison: NSAIDs | ||||||
| Outcomes | Anticipated absolute effects* (95% CI) | Relative effect (95% CI) | № of participants (studies) | Quality of the evidence (GRADE) | Comments | |
| Risk with NSAIDs | Risk with celecoxib | |||||
| Clinical improvement: American College of Rheumatology 20% improvement criteria (ACR20) follow up: range 6 weeks to 24 weeks | 457 per 1000 | 503 per 1000 (453 to 562) | RR 1.10 (0.99 to 1.23) | 1981 (4 RCTs) | ⊕⊕⊕⊝ Moderate¹ | 4% absolute improvement (95% CI 0% to 8% more), 10% relative improvement (1% less to 23% more) (NNTB = NA) |
| Pain: self‐reported visual analogue scale (VAS) from 0 to 100 (where 0 is no pain) follow up: range 6 weeks to 24 weeks | Mean pain = 47 | Mean pain in the intervention group was 1.59 points lower (3.83 better to 0.65 worse) | ‐ | 1504 (3 RCTs) | ⊕⊕⊕⊝ Moderate¹ | 2% absolute improvement (95% CI 3.83% better to 0.65% worse), 3% relative improvement (95% CI 8% better to 1% worse), MD = ‐1.59 (95% CI ‐3.83 to 0.65) (NNTB = NA) |
| Physical function: Health Assessment Questionnaire Disability Index (HAQ) scale 0 to 3; higher scores means worse functional ability; follow up: range 6 weeks to 12 weeks | Mean physical function = ‐0.2 points | Mean physical function in the intervention group was not different (0 points) (0.13 better to 0.13 worse) | ‐ | 849 (2 RCTs) | ⊕⊕⊝⊝ Low¹ 2 | 0% absolute change (95% CI 4% better to 4% worse), 0% relative change (95% CI 65% better to 65% worse), MD = 0.00 (95% CI ‐0.13 to 0.13) (NNTB = NA) |
| Cardiovascular events (myocardial infarction, stroke) follow up: 6 weeks | 13 per 1000 | 14 per 1000 (1 to 191) | Peto OR 1.13 (0.07 to 18.33)⁴ | 149 (1 RCT) | ⊕⊕⊝⊝ Low¹ 5 | Celecoxib group had more cardiovascular events, but CI was wide. 0% absolute change (95% CI 4% less to 4% more), 13% relative change (95% CI 93% less to 1733% more) (NNTH = NA) |
| Incidence of gastroduodenal ulcers ≥ 3 mm follow up: range 12 weeks to 24 weeks | 155 per 1000 | 34 per 1000 (24 to 50) | RR 0.21 (0.14 to 0.32) | 1568 (5 RCTs) | ⊕⊕⊕⊝ Moderate¹ | 12% absolute change (95% CI 11% to 13%), 21% relative change (95% CI 14% to 32%), NNTH 9 (95% CI 8 to 10)³ |
| Short‐term serious adverse events follow up: range 6 weeks to 24 weeks | 34 per 1000 | 26 per 1000 (15 to 48) | Peto OR 0.71 (0.39 to 1.28)⁴ | 2154 (5 RCTs) | ⊕⊕⊝⊝ Low¹5 | 1% absolute change (95% CI 2% less to 1% more), 29% relative change (95% CI 61% less to 28% more), (NNTH = NA) |
| Total withdrawals; follow up: range 6 weeks to 24 weeks | 247 per 1000 | 180 per 1000 (153 to 212) | RR 0.73 (0.62 to 0.86) | 2639 (6 RCTs) | ⊕⊕⊕⊝ Moderate¹ | 7% absolute change (95% CI 4% to 9%), 27% relative change (95% CI 14% to 38%), NNTH = 14 (95% CI 11 to 23)³ |
| *The risk in the intervention group (and its 95% confidence interval) is based on the assumed risk in the comparison group and the relative effect of the intervention (and its 95% CI). CI: Confidence interval; NA: not applicable; NNTB: number needed to treat for an additional beneficial outcome; NNTH: number needed to harm; RCT: randomized controlled trial; RR: Risk ratio; OR: Odds ratio; | ||||||
| GRADE Working Group grades of evidence High quality: We are very confident that the true effect lies close to that of the estimate of the effect Moderate quality: We are moderately confident in the effect estimate: The true effect is likely to be close to the estimate of the effect, but there is a possibility that it is substantially different Low quality: Our confidence in the effect estimate is limited: The true effect may be substantially different from the estimate of the effect Very low quality: We have very little confidence in the effect estimate: The true effect is likely to be substantially different from the estimate of effect | ||||||
¹ All trials had high or unclear risk of at least one type of bias.
² Downgraded one level due to inconsistency: high heterogeneity
³ Number needed to harm (NNTH) calculated using online calculator: http://www.nntonline.net/visualrx/.
⁴ Report Peto OR which can be interpreted as an RR due to the low event rate.
⁵ .Few events.
Background
Description of the condition
Rheumatoid arthritis is a systemic auto‐immune disorder that causes widespread and persistent inflammation of the synovial lining of the joints and tendon sheaths. Persistent inflammation results in many systemic and extra‐articular manifestations involving most organ systems, leading to severe complications and comorbidities such as rheumatoid lung, carditis, vasculitis, cachexia, anemia, accelerated atherosclerosis, myocardial and cerebrovascular disease, lymphoma, osteoporosis, and depression. Complications and comorbidities lead to disability, social dysfunction and premature death (McInnes 2011). Treatment of rheumatoid arthritis focuses on managing symptoms such as pain, stiffness and limited mobility (Aletaha 2005). Incidence is related to environmental factors such as smoking, infections, immunizations, obesity and socio‐economic status (Myasoedova 2010). Smoking is the principal risk for development of rheumatoid arthritis (Scott 2010).
The global prevalence of rheumatoid arthritis in 2010 was estimated to be 0.24% and was approximately twice as high in women than men (Cross 2014). There has been no discernible change in prevalence since 1990 (Cross 2014). Rheumatoid arthritis prevalence peaks in older age; it is expected that the number of people living with rheumatoid arthritis will increase in the future (Cross 2014).
Description of the intervention
At present, there is no cure for rheumatoid arthritis; treatment focuses on management of symptoms. Current treatments include pharmacological interventions, physical therapy and balneotherapy (bathing in mineral‐rich water). Pharmacotherapeutic options for people with rheumatoid arthritis include disease‐modifying antirheumatic drugs (DMARDs), both synthetic and biologics; nonsteroidal anti‐inflammatory drugs (NSAIDs); glucocorticoids; analgesics; and, rarely, cytostatics (drugs that inhibit cell growth).
In recent years several Cochrane Reviews have assessed various pharmacological interventions for people with rheumatoid arthritis including methotrexate (Lopez‐Olivo 2014), rituximab (a biologic agent) (Lopez‐Olivo 2015), tumor necrosis factor (TNF)‐alpha inhibitor certolizumab pegol (CDP870) (Ruiz Garcia 2014), etanercept (a soluble TNF‐alpha receptor disease‐modifying antirheumatic drug) (Lethaby 2013), opioids (Whittle 2011), muscle relaxants (Richards 2012a) and neuromodulators (Richards 2012b). Non‐drug interventions have also been assessed. Cramp 2013 analysed interventions for self‐reported fatigue in adults with rheumatoid arthritis; Hurkmans 2009 investigated dynamic exercise programs; and Verhagen 2015 assessed balneotherapy. Reported benefits and harms vary for both drug and non‐drug interventions.
NSAIDs are commonly prescribed for people with rheumatoid arthritis. The analgesic effect of NSAIDs is traditionally explained primarily by inhibition of cyclooxygenase (COX) enzyme. COX has two isoforms (COX‐1 and COX‐2). Although COX‐1 is part of normal cells, COX‐2 is usually specific to inflamed tissue, so has a role in mediating pain, inflammation and fever (Conaghan 2012).
Traditional NSAIDs (tNSAIDs), such as ibuprofen, diclofenac and naproxen, are non‐selective and inhibit both COX‐1 and COX‐2. Celecoxib is a COX‐2 inhibitor.
How the intervention might work
NSAIDs are a heterogeneous group of drugs with common pain‐relieving, antipyretic, and anti‐inflammatory actions, and are thought to relieve pain by inhibiting cyclooxygenases and consequently the production of prostaglandins (Hawkey 1999). Considering the influence of COX on normal metabolism and inflammatory response, it became important to find ways to regulate inflammation, but without interrupting the normal body processes. Selective COX‐2 inhibitors were developed to avoid gastro‐intestinal toxicity of nonselective NSAIDs. This led to the development of the group of NSAIDs known as the coxibs, including the drugs celecoxib, etoricoxib, lumiracoxib, parecoxib, rofecoxib and valdecoxib. Celecoxib is a highly selective reversible COX‐2 inhibitor, which prevents transformation of arachidonic acid to prostaglandin precursors, important mediators of pain and inflammation. Thus, inhibiting production of these prostaglandins through COX‐2 inhibition alleviates pain and swelling (Süleyman 2007). Celecoxib is currently marketed in most countries in doses that were evaluated in this review (200 mg and 400 mg daily) (FDA 2016; TGA 2010).
Why it is important to do this review
Use of NSAIDs is associated with varying degrees of cardiovascular and gastro‐intestinal risk, such as upper gastro‐intestinal bleeding, and these risks should be considered in treatment decisions (Conaghan 2012; Trelle 2011). However, proton pump inhibitors can reduce risk of upper gastro‐intestinal bleeding (Lanas 2014). Use of selective COX‐2 inhibitors is associated with risk of serious vascular events, due to a twofold increased risk of myocardial infarction (Kearney 2006). A 2013 meta‐analysis conducted by the Coxib and traditional NSAID Trialists’ (CNT) Collaboration analyzed vascular and upper gastro‐intestinal effects of NSAIDs, based on individual participant data from randomized controlled trials. It was shown that celecoxib significantly increased major cardiovascular event risk, but with less proportional excess risk of major vascular events associated with lower celecoxib doses in placebo‐controlled trials (CNT 2013).
In an era when many effective treatments are available, the need for continuous NSAID use is decreasing and requires justification. Clinical studies, rather than laboratory assay studies, are the best way to determine if people benefit from the use of more selective NSAIDs (Chou 2006). We therefore examined the benefits and harms of celecoxib for people with rheumatoid arthritis by analyzing results of randomized controlled trials.
This Review was conducted according to guidelines recommended by the Cochrane Musculoskeletal Group Editorial Board (Ghogomu 2014).
Objectives
To assess the benefits and harms of celecoxib in people with rheumatoid arthritis.
Methods
Criteria for considering studies for this review
Types of studies
We included prospective randomized controlled trials (RCTs) reported in full‐text reports with no language restrictions. Studies with fewer than 50 participants in each arm or involving treatment of less than four weeks' duration were excluded.
Types of participants
We included studies involving participants of any age and either sex with clinical confirmation of rheumatoid arthritis or who met the rheumatoid arthritis criteria of the 1987 American College of Rheumatology Classification (ACR) (Arnett 1988), or the 2010‐2009 ACR criteria for classification of rheumatoid arthritis (Aletaha 2010), whichever was used by study authors. People with juvenile arthritis were excluded.
Studies involving participants with conditions other than rheumatoid arthritis (i.e. mixed populations) were included only if outcomes for participants with rheumatoid arthritis were presented as a separate data subset or if separate data were available from the study authors.
Types of interventions
We included trials comparing oral celecoxib (200 mg and 400 mg daily) with no intervention, placebo or another traditional nonsteroidal anti‐inflammatory drug (tNSAID).
Types of outcome measures
Primary outcomes
ACR20/30 (Felson 1995). ACR20/30 was defined as a 20% and 30% improvement, respectively, in the number of tender and swollen joints and a corresponding improvement in at least three of the following items: observer evaluation of overall disease activity, the individual's evaluation of overall disease activity, the individual's evaluation of pain, a score of physical disability, or improvements in blood acute‐phase responses (Felson 1998).
Pain.
Self‐reported function as measured on the Health Assessment Questionnaire (HAQ) Disability Index (Gardiner 1993) or modified HAQ. HAQ scores range from 0 to 3, with 3 indicating a worse health state; therefore negative change indicates health improvement.
Cardiovascular events (myocardial infarction, stroke).
Incidence of gastroduodenal ulcer ≥ 3 mm.
Short‐term serious adverse events from trials.
Long‐term adverse events or toxicity from observational studies.
Secondary outcomes
Total withdrawals (discontinuation rates).
Withdrawals due to adverse events.
Withdrawals due to lack of efficacy.
Search methods for identification of studies
Electronic searches
We searched the Cochrane Central Register of Controlled Trials (CENTRAL), MEDLINE and Embase. We also searched trials registers (www.ClinicalTrials.gov and www.who.int/ictrp/en/). We searched databases from inception dates to May 18, 2017. We imposed no restrictions on language of publication. See Appendix 1 for the MEDLINE, Embase and The Cochrane Library search strategy. The MEDLINE search strategy combined the subject search with the Cochrane Highly Sensitive Search Strategy for identifying reports of randomized controlled trials (as published in Box 6.4.c in the Cochrane Handbook for Systematic Reviews of Interventions Version 5.1.0, updated March 2011) and was modified for other databases (Higgins 2011).
Searching other resources
We checked reference lists and citations of all included primary studies and relevant review articles for additional references. We searched for errata or retractions from included studies published in full‐text on PubMed (www.ncbi.nlm.nih.gov/pubmed).
For assessments of adverse effects, we searched the websites of regulatory agencies: USA Food and Drug Administration‐MedWatch (http://www.fda.gov/Safety/MedWatch/default.htm); European Medicines Evaluation Agency (http://www.emea.europa.eu); Australian Adverse Drug Reactions Bulletin (http://www.tga.gov.au/adr/aadrb.htm); and UK Medicines and Healthcare products Regulatory Agency (MHRA) pharmacovigilance and drug safety updates (http://www.mhra.gov.uk).
Data collection and analysis
Selection of studies
Three review authors (MF, AJK, MR) independently screened titles and abstracts for inclusion of all the potential studies we had identified as a result of the search and coded them as 'retrieve' (eligible or potentially eligible/unclear) or 'do not retrieve'. We retrieved the full‐text study reports/publications and two review authors (MF, AJK) independently screened the full‐text and identified studies for inclusion, and identified and recorded reasons for exclusion of ineligible studies. We resolved any disagreement through discussion or, if required, we consulted a third author (LP). We identified and excluded duplicates and collated multiple reports of the same study so that each study, rather than each report, was the unit of interest in the Review. All studies were published in English so translation was unnecessary. We recorded the selection process in sufficient detail to complete a PRISMA flow diagram and Characteristics of excluded studies table. Study authors were contacted for clarifications and to obtain additional data whenever necessary.
Data extraction and management
We used a data collection form for study characteristics and outcome data which had been piloted on one study in the Review. Two review authors (MF, AJK) extracted study characteristics from included studies. We extracted the following study characteristics:
Methods: study design, total duration of study, number of study centers and location, study setting, withdrawals, and date of study.
Participants: number, mean age, age range, sex, disease duration, severity of condition, diagnostic criteria, important rheumatoid arthritis‐specific baseline data, inclusion criteria, and exclusion criteria.
Interventions: intervention, comparison, concomitant medications, and excluded medications.
Outcomes: major and minor outcomes specified and collected, and time points reported.
Characteristics of the design of the trial as outlined in the Assessment of risk of bias in included studies section.
Notes: study funding sources, notable declarations of interest of study authors, co‐interventions that participants were permitted to take.
Two review authors (MF, AJK) independently extracted outcome data from included studies. Numbers of events and participants per treatment group for dichotomous outcomes, means, standard deviations and number of participants per treatment group for continuous outcomes, were extracted. We resolved disagreements by consensus or by involving a third author (LP). One review author (MF) transferred data into the Review Manager (RevMan) file (Review Manager 2014). Two authors (AJK, LP) checked whether all data were entered correctly. We double‐checked that data were entered correctly by comparing data presented in the systematic review with the study reports. Whenever necessary, we attempted to obtain or clarify data from relevant individuals or organizations.
For numeric data present only in figures or graphs, authors of the original report were contacted and data requested. When necessary, numeric data were extracted from figures in the reports using Plot Digitizer software (Vucic 2015). Whenever possible, we used results from intention‐to‐treat analyses.
If a study had reported multiple time‐point measurements we extracted data from the end of the study for analysis.
Assessment of risk of bias in included studies
Two review authors (MF, AJK) independently assessed risk of bias for each study using the criteria outlined in the Cochrane Handbook for Systematic Reviews of Interventions (Higgins 2011). We resolved any disagreements by discussion or by involving another author (LP). We assessed the risk of bias according to the following domains:
random sequence generation;
allocation concealment;
blinding of participants and personnel;
blinding of outcome assessment;
incomplete outcome data;
selective outcome reporting; and
other biases (relating to particular aspects of study design and conflicts of interest).
We graded each potential source of bias as high, low or unclear and provided a quote from the study report together with a justification for our judgment in the 'Risk of bias' table. We summarized the risk of bias judgements across different studies for each of the domains listed. We considered blinding separately for different key outcomes where necessary (e.g. for unblinded outcome assessment, risk of bias for all‐cause mortality may be different than for a patient‐reported pain scale). We also considered the impact of missing data for key outcomes.
Attrition in either study arm above 30% and imbalance in attrition between study arms over 10% was considered high risk of bias, regardless of the data imputation method. Attrition between 10% and 30% in either arm, and imbalance between groups between 5% and 10% was considered unclear risk of bias.
Where information on risk of bias related to unpublished data or correspondence with an author, we noted this in the 'Risk of bias' table.
When considering treatment effects, we took into account the risk of bias for the studies that had contributed to that outcome.
We presented figures generated by the 'Risk of bias' tool to provide summary assessments of the risk of bias.
Assessment of bias in conducting the systematic review
We conducted the review a priori according to the protocol published in the Cochrane Library (Fidahic 2016).
Measures of treatment effect
We analyzed dichotomous data as risk ratios (RR) or Peto odds ratio (Peto OR) when the outcome was a rare event (approximately less than 10%), and used 95% confidence intervals (CI). Continuous data were analyzed as mean difference and 95% CI. We entered data presented as a scale with a consistent direction of effect across studies.
We provided the absolute per cent difference, the relative per cent change from baseline, and the number needed to treat for an additional beneficial outcome (NNTB) in Effects of interventions and the 'Comments' columns of 'Summary of findings' tables. The NNTB was provided only when the outcome showed a statistically significant difference.
For dichotomous outcomes, such as serious adverse events, the NNTB was calculated from the control group event rate and the risk ratio using the Visual Rx NNT calculator (Cates 2008). The NNTB for continuous measures was calculated using the Wells calculator (http://musculoskeletal.cochrane.org/).
For dichotomous outcomes, the absolute risk difference was calculated using the Risk Difference statistic in RevMan and the result expressed as a percentage. For continuous outcomes, the absolute benefit was calculated as the improvement in the intervention group minus the improvement in the control group, in the original units.
The relative per cent change for dichotomous data was calculated as the RR and expressed as a percentage. For continuous outcomes, the relative difference in the change from baseline was calculated as the absolute benefit divided by the baseline mean of the control group.
Unit of analysis issues
Where multiple arms were reported in a single trial, we included only the relevant arms. For studies containing more than two relevant intervention groups, to make multiple pair‐wise comparisons between all possible pairs of intervention groups possible, we included the same group of participants more than once in the meta‐analysis, but divided the number of participants proportionally, following the procedure recommended in the Cochrane Handbook for Systematic Reviews of Interventions (Higgins 2011). If the meta‐analyses resulted in statistically significant overall estimates, we transformed these results back into measures which are clinically useful in daily practice, such as the NNTB and the absolute or relative improvement on the original units, to express the final results of the review (Akl 2011).
Dealing with missing data
We did not encounter any missing data for analysis of outcomes. To obtain missing information for risk of bias analysis we contacted study authors via e‐mail.
Assessment of heterogeneity
Clinical and methodological diversity were assessed in terms of participants, interventions, outcomes and study characteristics for the included studies to determine if meta‐analysis was appropriate. Statistical heterogeneity was assessed by visual inspection of the forest plot to assess for obvious differences in results among studies, and using the I² and Chi² statistical tests.
As recommended in the Cochrane Handbook for Systematic Reviews of Interventions (Deeks 2011), the interpretation of an I² value of 0% to 40% might 'not be important'; 30% to 60% may represent 'moderate' heterogeneity; 50% to 90% may represent 'substantial' heterogeneity; and 75% to 100% represents 'considerable' heterogeneity. As noted in the Handbook, we kept in mind that the importance of I² depends on magnitude and direction of effects and strength of evidence for heterogeneity.
Assessment of reporting biases
We planned to create a funnel plot to explore possible small study biases. However, there were too few included studies to analyze potential publication bias.
We checked trial protocols against published reports to assess outcome reporting bias. For studies published after 1 July 2005, we screened the Clinical Trial Register at the International Clinical Trials Registry Platform of the World Health Organization (apps.who.int/trialsearch) for a priori trial protocols. We evaluated if selective reporting of outcomes was present.
Data synthesis
We undertook meta‐analyses only where this was meaningful, that is, if the treatments, participants and the underlying clinical question were sufficiently similar for pooling to make sense. We planned to categorize studies as short‐term and long‐term, where long‐term studies were defined as those with duration of more than six months for analyses. However, we did not find any studies longer than six months.
We used a random‐effects model and performed sensitivity analyses using the fixed‐effect model.
Summary of findings table
We created 'Summary of findings' tables that included the following outcomes:
ACR20/30 improvement;
pain;
Health Assessment Questionnaire (HAQ) change from baseline;
cardiovascular events (myocardial infarction, stroke);
incidence of gastroduodenal ulcer ≥ 3 mm;
short‐term serious adverse events from trials; and
discontinuation rates.
'Summary of findings' tables present comparisons for:
Two authors (LP, MF) independently assessed evidence quality. We used the five GRADE considerations (study limitations, consistency of effect, imprecision, indirectness, and publication bias) to assess the quality of a body of evidence as it related to the studies which contributed data to the meta‐analyses for the pre‐specified outcomes. We used methods and recommendations described in Section 8.5, 8.7 and Chapter 11 and Chapter 13 section 13.5 of the Cochrane Handbook for Systematic Reviews of Interventions using GRADEpro software (GRADEpro GDT 2014; Higgins 2011; Schünemann 2011a). We justified all decisions to downgrade the quality of studies in footnotes and we made comments to aid readers' understanding of the review where necessary.
We provided the absolute per cent difference, the relative per cent change from baseline, NNTB and NNTH (NNTB and NNTH were provided only when the outcome showed a statistically significant difference) in the 'Comments' columns of 'Summary of findings' tables.
Subgroup analysis and investigation of heterogeneity
We planned to carry out the following subgroup analyses:
participants’ age (< 65 years versus ≥ 65 years);
participants’ sex;
duration of rheumatoid arthritis (< 3 years versus ≥ 3 years);
drug dose (200 mg to 400 mg); and
methodological quality (studies with low risk of bias on all domains versus all the other studies).
However, we were able to conduct a subgroup analysis only for drug dose.
We used the formal test for subgroup interactions in Review Manager 2014, and applied caution to interpret subgroup analyses as advised in section 9.6 of the Cochrane Handbook for Systematic Reviews of Interventions (Deeks 2011). The magnitude of the effects was compared between subgroups by means of assessing the overlap of the confidence intervals of the summary estimated. No overlap of the confidence intervals indicated statistical significance.
Sensitivity analysis
Primary meta‐analysis was restricted to studies assessed at low risk of bias. Because no studies were assessed at low risk of bias on all seven domains, we considered a study to be at overall low risk of bias when three domains (randomization sequence, allocation concealment, blinding of participants and personnel) were assessed as low risk of bias. All studies were included in meta‐analyses. Sensitivity analysis was performed to assess how the results of the meta‐analysis might be affected if studies at unclear and high risk of bias were included. If assessment of heterogeneity found one or more outlying studies with results that conflicted with the rest of the studies, sensitivity analysis was performed to assess the influence on the results of the meta‐analysis. Sensitivity analysis was also performed for potential differences between random‐effects and fixed‐effect meta‐analyses.
Interpreting results and reaching conclusions
We followed the guidelines in the Cochrane Handbook for Systematic Reviews of Interventions, Chapter 12 for interpreting results (Schünemann 2011b); and were aware of distinguishing a lack of evidence of effect from a lack of effect. We based our conclusions only on findings from the quantitative synthesis of included studies for this review. The Implications for research section of this review provides suggested priorities for future research and we outlined what the remaining uncertainties were in the area.
Results
Description of studies
See Figure 1, Characteristics of included studies, Characteristics of excluded studies and Characteristics of studies awaiting classification.
1.
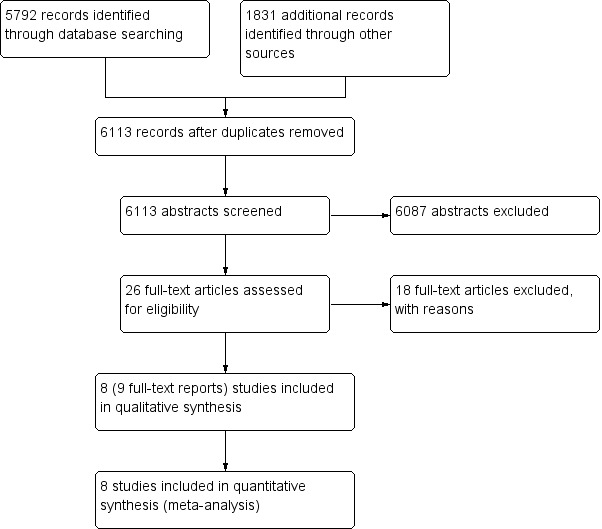
Study flow diagram
Results of the search
We identified 5792 records from searching databases and 1831 from searching other sources. Following de‐duplication, we screened 6113 records by title and abstract. We obtained 26 full‐text papers that were potentially eligible for inclusion Of these, eight studies (9 reports) were included (Figure 1). We did not find any eligible studies that were only published as conference abstracts or were available only as unpublished data.
Included studies
We included eight double‐blinded, randomized, parallel‐group trials that were published in English language between 1998 and 2014 (Choi 2014; Emery 1999; Goldstein 2001; Jajic 2005; Kivitz 2004; Shi 2004; Simon 1998; Simon 1999). Study duration ranged from 4 weeks to 24 weeks. Only one study was registered on ClinicalTrials.gov (Choi 2014).
Participants were randomly assigned to treatment with different doses of celecoxib (range 80 mg/day up to 800 mg/day) (N = 1786). In this review we included only participants who received celecoxib 200 mg (N = 295) and celecoxib 400 mg (N = 1322), which is in total 1617 participants who received celecoxib doses relevant for this review. Additionally, we included 2202 participants that were randomly assigned to one of the comparator groups: tNSAIDs (N = 1886) or placebo (N = 316).
Although ACR20/30 was defined as a primary outcome measure, included studies reported only ACR20.
Population
The eight included studies included a total of 3988 participants whose mean age was 54 years; 73% were women. Participants had rheumatoid arthritis for an average duration of 9.2 years; two studies did not describe duration of rheumatoid arthritis in study participants (Jajic 2005; Kivitz 2004).
Settings
All studies were conducted in ambulatory outpatient setting. Three studies were conducted in one country only, namely China (Shi 2004), Korea (Choi 2014) or USA (Goldstein 2001). One study was conducted in multiple sites in Europe (Jajic 2005), one in USA and Canada (Simon 1999), while two studies were conducted in multiple continents (Emery 1999; Kivitz 2004). For one trial study location was not described (Simon 1998). See Characteristics of included studies.
Interventions and comparators
Two studies compared celecoxib with placebo (Simon 1998; Simon 1999); seven studies compared celecoxib with another marketed tNSAID drug (naproxen amtolmetin guacyl (AMG), diclofenac, ibuprofen, lumiracoxib, meloxicam, nabumetone and pelubiprofen) (Choi 2014; Emery 1999; Goldstein 2001; Jajic 2005; Kivitz 2004; Shi 2004; Simon 1999). However, since concern over hepatotoxicity has led to market withdrawal or non approval of lumiracoxib in most markets (Singer 2010), comparison of celecoxib with lumiracoxib was not included in this review.
Study funding
Four studies were sponsored by pharmaceutical companies producing study drugs (Goldstein 2001; Kivitz 2004; Simon 1998; Simon 1999). One study reported that a pharmaceutical company provided investigational medication for the study (Choi 2014). One study reported part funding support by a state authority (Shi 2004). Two studies did not declare sources of funding or declarations of declaration of interest (Emery 1999; Jajic 2005). Five studies that provided declarations included one or more authors who were employed by the sponsor (Emery 1999; Goldstein 2001; Kivitz 2004; Simon 1998; Simon 1999).
Study registration
One study was registered in ClinicalTrials.gov (Choi 2014). Although it is indicated that the trial was completed in October 2011, the results were not posted in ClinicalTrials.gov (last checked on May 26, 2017). The other included studies did not provide information about study registration, but they were published in 2005 or before, when prospective registration of trials was not mandatory.
Excluded studies
Following assessment we excluded 18 studies. Of these, 11 studies did not report separate data for people with rheumatoid arthritis (Chan 2002; Chan 2004; Chan 2007; Chan 2010; Cheung 2010; Goldstein 2002; Hegazy 2011; Kellner 2012; Kellner 2013; Nissen 2016; Silverstein 2000). One study was published only as a conference abstract, from which it appears that participants with different types of arthritis were included, but results were not shown separately for rheumatoid arthritis in the abstract (Chan 2015). One study was not an RCT (Cheatum 1999). Five RCTs were excluded because they compared celecoxib with comparators that were irrelevant to this systematic review (Liu 2015; Song 2007), celecoxib was not analysed (Laine 2002; Laine 2007) or there were fewer than 50 participants in each arm (Zayat 2011). See Characteristics of excluded studies.
Risk of bias in included studies
Risk of bias varied across studies (Figure 2; Figure 3). High risk of attrition bias was assessed for seven studies. Most of the studies were judged as having low risk of selection bias and reporting bias because those domains were adequately described. Among the other risk of bias domains the judgements varied more.
2.
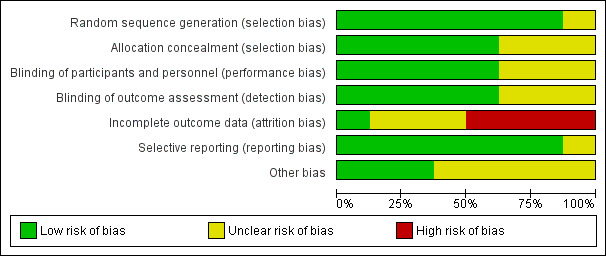
Risk of bias graph: review authors' judgements about each risk of bias item presented as percentages across all included studies
3.
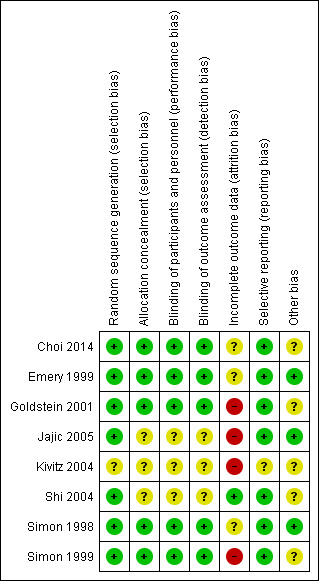
Risk of bias summary: review authors' judgements about each risk of bias item for each included study
Allocation
Random sequence generation was adequately described in seven studies (low risk of bias) (Choi 2014; Emery 1999; Goldstein 2001; Jajic 2005; Shi 2004; Simon 1998; Simon 1999). Five studies used software‐generated randomization methods (Choi 2014; Goldstein 2001; Jajic 2005; Shi 2004; Simon 1999); two used centralized random numbers methods (Emery 1999; Simon 1998). One study was assessed at unclear risk of selection bias because the method of random sequence generation was not described (Kivitz 2004).
Blinding
Three studies did not describe blinding and were assessed at unclear risk of performance and detection bias (Jajic 2005; Kivitz 2004; Shi 2004). Five studies were included adequate descriptions of blinding and were assessed at low risk of performance and detection bias (Choi 2014; Emery 1999; Goldstein 2001; Simon 1998; Simon 1999).
Incomplete outcome data
Seven studies were assessed at high or unclear risk of attrition bias because of significant numbers of participants who were lost to follow‐up or because of imbalance in attrition between study arms, or both (Choi 2014; Emery 1999; Goldstein 2001; Jajic 2005; Kivitz 2004; Simon 1998; Simon 1999). One study reported low rates of attrition and rates were similar in all study arms and was assessed at low risk of attrition bias (Shi 2004).
Selective reporting
Kivitz 2004 was the only study assessed at unclear risk of reporting bias; not all outcomes specified in methods were described in results, except for a note that there was no difference in efficacy. Seven studies were assessed at low risk of reporting bias (Choi 2014; Emery 1999; Goldstein 2001; Jajic 2005; Shi 2004; Simon 1998; Simon 1999).
Other potential sources of bias
Concomitant therapy and rescue medication were identified as potential sources of bias in five studies (Choi 2014; Goldstein 2001; Kivitz 2004; Shi 2004; Simon 1999). Acetaminophen was used as a rescue medication in four studies (Choi 2014; Goldstein 2001; Kivitz 2004; Simon 1999). The rescue treatment protocols for acetaminophen included an acetaminophen extended‐release 650 mg tablet (Choi 2014), up to 2 g daily (Kivitz 2004; Simon 1999); one study did not describe the rescue medication protocol (Goldstein 2001). Aspirin was used as a rescue medication at a stable dose of no more than 325 mg daily in Simon 1999. Methotrexate and folic acid were used as concomitant therapy as a dose of 10 mg/week of methotrexate and 5 mg daily of folic acid tablet in Shi 2004. Oral corticosteroids were permitted in one study “only if there was no change in the dosing regimen during the study”, but the dose was not specified (Goldstein 2001). None of the studies reported how many co‐interventions participants in each study arm took and how this may have affected the results. No other sources of bias were identified in three studies (Emery 1999; Jajic 2005; Simon 1998).
Effects of interventions
No studies reported ACR30 data. Although we planned to assess self‐reported function measured on the Health Assessment Questionnaire (HAQ) Disability Index, some studies reported according to the modified HAQ (MHAQ); these results were reported. No studies reported long‐term adverse events.
Comparison 1. Celecoxib versus placebo
Simon 1998 and Simon 1999 (N = 873) compared celecoxib with placebo. Simon 1998 compared 400 mg celecoxib daily with placebo and 4 weeks follow up; Simon 1999 compared two doses of celecoxib (200 mg and 400 mg daily) with placebo and 12 weeks follow up.
Primary outcomes
ACR20 improvement
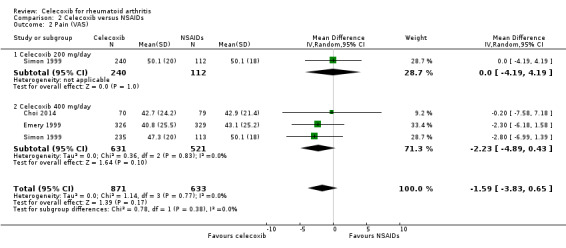
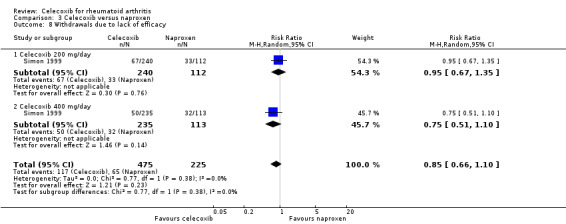
More participants who received either 200 mg or 400 mg celecoxib daily had statistically significant and clinically important rates of meeting the ACR20 improvement criteria (RR 1.53, 95% CI 1.25 to 1.86, P < 0.001; 2 studies; N = 873; Analysis 1.1). This corresponds with a 15% absolute improvement (95% CI 7% to 25%) or 53% relative improvement (95% CI 25% to 86%). The number needed to treat to benefit (NNTB) was seven (95% CI 5 to 13). No differences were found in subgroup analyses of celecoxib 200 mg (Analysis 1.1) and 400 mg (Analysis 1.1.2) daily compared with placebo (P = 0.45). Evidence quality was moderate (downgraded due to risk of bias). There was no heterogeneity (Chi² = 0.81, df = 2, P = 0.67, I² = 0%).
1.1. Analysis.
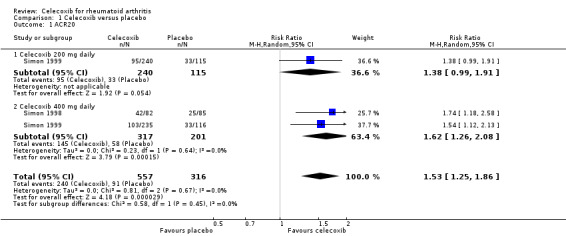
Comparison 1 Celecoxib versus placebo, Outcome 1 ACR20.
Pain
Celecoxib 200 mg and 400 mg daily significantly reduced pain compared to placebo (MD ‐11.00, 95% CI ‐14.04 to ‐7.96, P < 0.001; 1 study, N = 706; Analysis 1.2). This corresponds with an 11% absolute improvement (95% CI 8% to 14%) and 18% relative improvement (95% CI 13% to 23%), NNTB = 4 (95% CI 3 to 6), (MD 11, 95% CI 14.04 to 7.96). Subgroup analyses comparing celecoxib 200 mg (Analysis 1.2) and 400 mg (Analysis 1.2) daily with placebo had the same direction as the overall effect; there was no evidence of a difference between subgroups (P = 0.37). Evidence quality was moderate (downgraded due to risk of bias). There was no heterogeneity (Chi² = 0.81, df = 1, P = 0.37, I² = 0%).
1.2. Analysis.
Comparison 1 Celecoxib versus placebo, Outcome 2 Pain (VAS).
Self‐reported physical function (Health Assessment Questionnaire (HAQ))
We found no evidence of a difference between celecoxib and placebo for self‐reported function measured on the HAQ (95% CI crossed the line of no effect) (MD ‐0.10, 95% CI ‐0.29 to 0.10, P = 0.33; 1 study, N = 706; Analysis 1.3). Subgroup analyses found no difference between celecoxib 200 mg (Analysis 1.3) daily and placebo, but celecoxib 400 mg daily was superior to placebo (Analysis 1.3). There was statistically significant heterogeneity (Chi² = 7.02, df = 1, P = 0.008, I² = 86%). Evidence quality was low (downgraded due to risk of bias and inconsistency).
1.3. Analysis.
Comparison 1 Celecoxib versus placebo, Outcome 3 HAQ.
Cardiovascular events
No studies reported this outcome.
Incidence of gastroduodenal ulcer ≥ 3 mm
Results were inconclusive about differences in incidence of gastroduodenal ulcers between celecoxib 200 mg and 400 mg daily and placebo. In this analysis 15/293 (51 per 1000; range 17 to 142) participants in the celecoxib group developed ulcers compared with 4/99 (40 per 1000) in the placebo group (Peto OR 1.26, 95% CI 0.44 to 3.63, P = 0.67; 1 study, N = 392; Analysis 1.4). Subgroup analyses comparing celecoxib 200 mg (Analysis 1.4) and 400 mg (Analysis 1.4) daily with placebo showed no differences. Evidence quality was low (downgraded due to risk of bias and imprecision). There was no heterogeneity (Chi² = 0.11, df = 1, P = 0.74, I² = 0%).
1.4. Analysis.
Comparison 1 Celecoxib versus placebo, Outcome 4 Incidence of gastroduodenal ulcers ≥ 3 mm.
Short‐term serious adverse events
Results were inconclusive for short‐term serious adverse events like headache, dyspepsia, diarrhea and abdominal pain (Simon 1999). There were 9/475 (19 per 1000; range 6 to 55) participants in the celecoxib group who developed short‐term serious adverse events compared with 5/231 (22 per 1000) in the placebo group (Peto OR 0.87, 95% CI 0.28 to 2.69, P = 0.81; 1 study, N = 706; Analysis 1.5). Subgroup analyses of celecoxib 200 mg (Analysis 1.5) and 400 mg (Analysis 1.5) daily versus placebo indicated no differences. Evidence quality was low (downgraded due to risk of bias and imprecision). There was no heterogeneity (Chi² = 0.02, df = 1, P = 0.89, I² = 0%).
1.5. Analysis.
Comparison 1 Celecoxib versus placebo, Outcome 5 Short term serious adverse events.
Secondary outcomes
Total withdrawals (discontinuation rates)
Simon 1999 showed a statistically significant higher rate of total withdrawals from the placebo group compared to celecoxib 200 mg and 400 mg daily (RR 0.61, 95% CI 0.52 to 0.72, P < 0.001; N = 706; Analysis 1.6). There were 163/475 (343 per 1000; range 293 to 405) withdrawals from the celecoxib group compared with 130/231 (563 per 1000) in the placebo group, corresponding to 22% absolute change (95% CI 16% to 27%) and 39% relative change (28% to 48%), NNTH = 5 (95% CI 4 to 7). Subgroup analyses for celecoxib 200 mg daily and 400 mg daily versus placebo had the same direction as the overall effect; there was no evidence of difference between subgroups (P = 0.64). Evidence quality was low (downgraded due to risk of bias and imprecision). There was no heterogeneity (Chi² = 0.22, df = 1, P = 0.64, I² = 0%).
1.6. Analysis.
Comparison 1 Celecoxib versus placebo, Outcome 6 Total withdrawals (discontinuation rates).
Withdrawals due to adverse events
Pooled analysis results were inconclusive regarding difference between celecoxib and placebo in numbers of withdrawals due to adverse events (Peto OR 1.21, 95% CI 0.66 to 2.20, P = 0.54; 2 studies, N = 873; Analysis 1.7). Subgroup analyses for celecoxib 200 mg daily and 400 mg daily versus placebo had the same direction as the overall effect; there was no evidence of difference between subgroups (P = 0.94). There was no heterogeneity (Chi² = 0.44, df = 2, P = 0.80, I² = 0%).
1.7. Analysis.
Comparison 1 Celecoxib versus placebo, Outcome 7 Withdrawals due to adverse events.
Withdrawals due to lack of efficacy
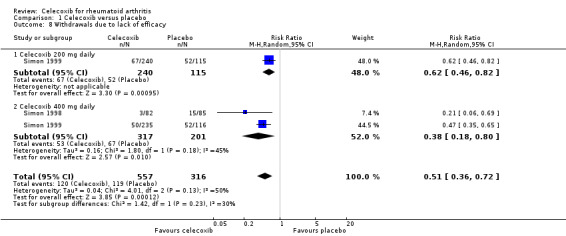
Pooled analysis showed statistically significant more withdrawals due to lack of efficacy in the placebo group compared to celecoxib (RR 0.51, 95% CI 0.36 to 0.72, P < 0.001; 2 studies, N = 873; Analysis 1.8). Subgroup analyses for celecoxib 200 mg daily and 400 mg daily versus placebo had the same direction as the overall effect; there was no evidence of difference between subgroups (P = 0.23). Heterogeneity was moderate (Chi² = 4.01, df = 2, P = 0.13, I² = 50%).
1.8. Analysis.
Comparison 1 Celecoxib versus placebo, Outcome 8 Withdrawals due to lack of efficacy.
Comparison 2. Celecoxib versus tNSAIDs
Primary outcomes
ACR20
Shi 2004 and Simon 1999 compared celecoxib 200 mg daily with tNSAIDs; Emery 1999, Jajic 2005 and Simon 1999 compared celecoxib 400 mg daily with tNSAIDs. Follow‐up periods ranged from 12 weeks to 6 months. Pooled analysis showed no statistically significant difference between celecoxib and tNSAIDs in ACR20 improvement criteria (RR 1.10, 95% CI 0.99 to 1.23, P = 0.08; 4 studies, N = 1981; Analysis 2.1). More participants receiving tNSAIDs (368/951 or 503 per 1000; range 453 to 562) had clinical improvement compared to those taking placebo (471/1030 or 457 per 1000), accounting for 4% absolute improvement (95% CI 0% less to 8% more) or 10% relative improvement (1% less to 23% more). This improvement may not be clinically significant; evidence quality was assessed as moderate due to risk of bias. There was no evidence of differences among subgroups of drugs included in this analysis (P = 0.90). There was no heterogeneity (Chi² = 1.33, df = 6, P = 0.97, I² = 0%).
2.1. Analysis.
Comparison 2 Celecoxib versus NSAIDs, Outcome 1 ACR20.
Pain
Simon 1999 compared celecoxib 200 mg daily versus tNSAIDs, and three studies compared celecoxib 400 mg daily and tNSAIDs (Choi 2014; Emery 1999; Simon 1999). Follow‐up ranged from 6 weeks to 24 weeks. Pooled analysis showed no statistically significant difference between celecoxib and tNSAIDs in reducing pain (MD ‐1.59, 95% CI ‐3.83 to 0.65, P = 0.17; 3 studies, N = 1504; Analysis 2.2). Pain intensity was slightly lower with celecoxib compared to tNSAIDs; 2% absolute improvement (95% CI 3.83% better to 0.65% worse), 3% relative improvement (95% CI 8% better to 1% worse); MD= ‐1.59 (95% CI ‐3.83 to 0.65). This improvement may not be clinically significant (moderate quality of evidence due to risk of bias). Subgroup analyses for celecoxib 200 mg daily and 400 mg daily versus tNSAIDs had the same direction as the overall effect; there was no evidence of difference among subgroups (P = 0.38). There was no heterogeneity (Chi² = 1.14, df = 3, P = 0.77, I² = 0%).
2.2. Analysis.
Comparison 2 Celecoxib versus NSAIDs, Outcome 2 Pain (VAS).
Self‐reported physical function (Health Assessment Questionnaire (HAQ) and Modified Health Assessment Questionnaire (MHAQ)
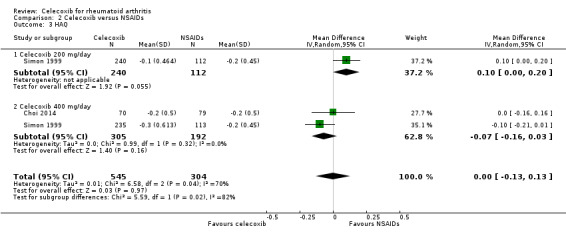
Simon 1999 compared celecoxib 200 mg daily with tNSAIDs; Choi 2014 and Simon 1999 compared celecoxib 400 mg daily with tNSAIDs. Follow‐up periods were 6 weeks and 12 weeks. Pooled analysis showed no evidence of difference between celecoxib and tNSAIDs in self‐reported physical function assessed using the HAQ (MD 0.00, 95% CI ‐0.13 to 0.13, P = 0.97; 2 studies, N = 849; Analysis 2.3); 0% absolute change (95% CI 13% better to 13% worse), 0% relative change (95% CI 65% better to 65% worse). There was statistically significant heterogeneity (Chi² = 6.58, df = 2, P = 0.04; I² = 70%). Evidence quality was assessed as low (downgraded due to risk of bias and inconsistency).
2.3. Analysis.
Comparison 2 Celecoxib versus NSAIDs, Outcome 3 HAQ.
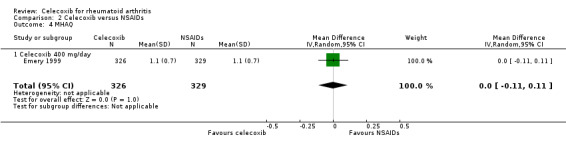
Emery 1999 compared celecoxib 400 mg daily versus tNSAIDs with 24 weeks follow‐up. There was no evidence of difference between celecoxib and tNSAIDs in self‐reported physical using the modified form of the HAQ questionnaire (MD 0.00, 95% CI ‐0.11 to 0.11, P = 1.00; 1 study, N = 655; Analysis 2.4). Heterogeneity was not applicable for this outcome.
2.4. Analysis.
Comparison 2 Celecoxib versus NSAIDs, Outcome 4 MHAQ.
Cardiovascular events
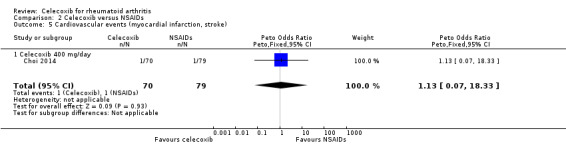
Choi 2014 compared celecoxib 400 mg daily versus tNSAIDs. There was no evidence of difference between celecoxib and tNSAIDs in the incidence of cardiovascular events (OR 1.13, 95% CI 0.07 to 18.42, P = 0.93; 1 study, N = 149; Analysis 2.5). Only one cardiovascular event was reported in each group, 1/70 (or 14 per 1000; range 1 to 191) in the celecoxib group and 1/79 (13 per 1000) in the tNSAID group; 0% absolute change (95% CI 4% less to 4% more), 13% relative change (95% CI 93% less to 1733% more); Peto OR 1.13 (95% CI 0.07 to 18.33). These data did not enable definitive conclusions to be made because this study was short duration and there was significant risk of type 2 error due to small numbers. Furthermore, this result is uncertain because it was based on low quality evidence (downgraded due to risk of bias and imprecision). Heterogeneity was not applicable for this outcome.
2.5. Analysis.
Comparison 2 Celecoxib versus NSAIDs, Outcome 5 Cardiovascular events (myocardial infarction, stroke).
Incidence of gastroduodenal ulcer ≥ 3 mm
Simon 1999 compared celecoxib 200 mg daily versus tNSAIDs; Emery 1999, Goldstein 2001, Jajic 2005, Kivitz 2004 and Simon 1999 compared celecoxib 400 mg daily versus tNSAIDs. Follow‐up ranged from 12 weeks to 6 months. Pooled analysis showed that the incidence rate of gastroduodenal ulcers ≥ 3 mm was statistically significantly lower in the celecoxib group compared to tNSAIDs (RR 0.22, 95% CI 0.15 to 0.32, P < 0.001; 5 studies, N = 1568; Analysis 2.6). Subgroup analyses for celecoxib 200 mg daily and 400 mg daily versus tNSAIDs had the same direction as the overall effect; there was no evidence of difference between subgroups (P = 0.94). There were 34/870 (343 per 1000; range 232 to 50) ulcers reported in the celecoxib group compared to 116/698 (or 155 per 1000) in participants taking tNSAIDs, corresponding to 12% absolute change (95% CI 11% to 13%), 22% relative change (95% CI 15% to 32%); NNTH 9 (95% CI 8 to 10), RR 0.22 (95% CI 0.15 to 0.32). This result is based on moderate quality evidence (downgraded due to risk of bias). There was no heterogeneity (Chi² = 3.12, df = 5, P = 0.68, I² = 0%).
2.6. Analysis.
Comparison 2 Celecoxib versus NSAIDs, Outcome 6 Incidence of gastroduodenal ulcers ≥ 3 mm.
Short‐term serious adverse events
Shi 2004 and Simon 1999 compared celecoxib 200 mg daily versus tNSAIDs; Choi 2014, Jajic 2005, Kivitz 2004 and Simon 1999 compared celecoxib 400 mg daily versus tNSAIDs. Follow‐up ranged from six weeks to six months. Pooled analysis showed that there was no evidence of difference between celecoxib and tNSAIDs in the rate of short‐term serious adverse events (OR 0.77, 95% CI 0.42 to 1.44, P = 0.42; 5 studies, N = 2154; Analysis 2.7). There was no evidence of difference in effect among subgroups (P = 0.81). There were 17/918 (26 per 1000; range 15 to 48) serious adverse events in the celecoxib group compared to 42/1236 (or 34 per 1000) in the tNSAID group, corresponding to 1% absolute change (95% CI 2% less to 1% more), 29% relative change (95% CI 61% less to 28% more); Peto OR 0.71 (0.39 to 1.28). This result is uncertain because it was based on low quality evidence (downgraded due to risk of bias and imprecision). There was no heterogeneity (Chi² = 1.68, df = 7, P = 0.98, I² = 0%).
2.7. Analysis.
Comparison 2 Celecoxib versus NSAIDs, Outcome 7 Short‐term serious adverse events.
Secondary outcomes
Total withdrawals (discontinuation rates)
Shi 2004 and Simon 1999 compared celecoxib 200 mg daily versus tNSAIDs; five studies compared celecoxib 400 mg daily versus tNSAIDs (Choi 2014; Emery 1999; Jajic 2005; Kivitz 2004; Simon 1999). Follow‐up ranged from six weeks to six months. Pooled analysis showed that the rate of total withdrawals was statistically significantly lower in the celecoxib group compared to tNSAIDs (RR 0.73, 95% CI 0.62 to 0.86, P < 0.001; 6 studies, N = 2639; Analysis 2.8). There was no evidence of difference in effect among subgroups (P = 0.46). There were 294/1266 (180 per 1000; range 153 to 212) withdrawals among participants taking celecoxib compared to 339/1373 (247 per 1000) in those taking tNSAIDs, corresponding with 7% absolute change (95% CI 4% to 9%), 27% relative change (95% CI 14% to 38%); NNTH 14 (95% CI 11 to 23), RR 0.73 (95% CI 0.62 to 0.86). This result is based on moderate quality evidence (downgraded due to risk of bias). There was no heterogeneity (Chi² = 9.24, df = 8, P = 0.32, I² = 13%).
2.8. Analysis.
Comparison 2 Celecoxib versus NSAIDs, Outcome 8 Total withdrawals (discontinuation rates).
Withdrawals due to adverse events
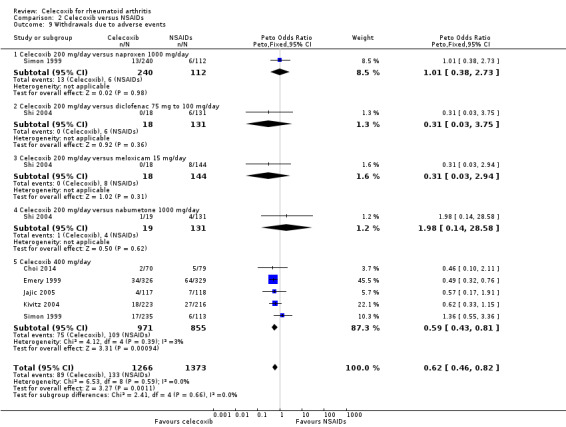
Shi 2004 and Simon 1999 compared celecoxib 200 mg daily versus tNSAIDs; five studies compared celecoxib 400 mg daily versus tNSAIDs (Choi 2014; Emery 1999; Jajic 2005; Kivitz 2004; Simon 1999). Pooled analysis showed that the rate of total withdrawals due to adverse events was statistically significantly lower in the celecoxib group compared to tNSAIDs (Peto OR 0.62, 95% CI 0.46 to 0.82, P = 0.001; 6 studies, N = 2639; Analysis 2.9). There was no evidence of difference in effect among subgroups (P = 0.74). There was no heterogeneity (Chi² = 6.53, df = 8, P = 0.59, I² = 0%).
2.9. Analysis.
Comparison 2 Celecoxib versus NSAIDs, Outcome 9 Withdrawals due to adverse events.
Withdrawals due to lack of efficacy
Shi 2004 and Simon 1999 compared celecoxib 200 mg daily versus tNSAIDs; three studies compared celecoxib 400 mg daily versus tNSAIDs (Emery 1999; Kivitz 2004; Simon 1999). Pooled analysis showed that there was no statistically significant difference between celecoxib and other tNSAIDs in rate of withdrawals due to lack of efficacy (RR 0.83, 95% CI 0.63 to 1.10, P = 0.19; 4 studies, N = 2255; Analysis 2.10). There was no evidence of difference in effect among subgroups (P = 0.83). Heterogeneity was low (Chi² = 7.09, df = 6, P = 0.31, I² = 15%).
2.10. Analysis.
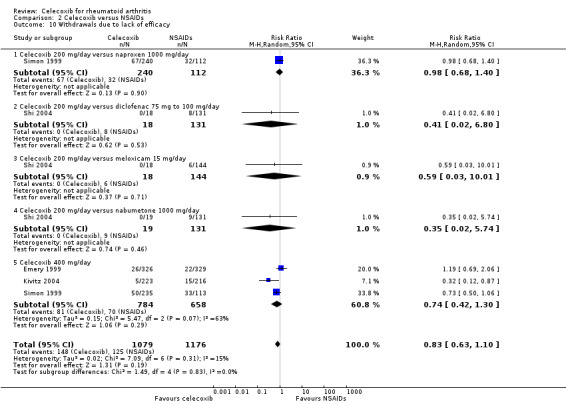
Comparison 2 Celecoxib versus NSAIDs, Outcome 10 Withdrawals due to lack of efficacy.
Comparison 3. Celecoxib versus naproxen
Compared to all tNSAIDs, celecoxib induced fewer gastroduodenal ulcers ≥ 3 mm and was associated with fewer withdrawals. There was no evidence of differences for other review outcomes.
Simon 1999 and Goldstein 2001 provided data for this comparison: Simon 1999 compared 200 mg and 400 mg celecoxib daily with naproxen 1000 mg daily and Goldstein 2001 compared celecoxib 400 mg daily with naproxen 1000 mg.
Primary outcomes
ACR20
There was no statistically significant difference between celecoxib 200 mg or 400 mg daily and naproxen 1000 mg daily in ACR20 improvement criteria (RR 1.16, 95% CI 0.94 to 1.42, P = 0.16; Analysis 3.1). There was no heterogeneity (Chi² = 0.17, df = 1, P = 0.68, I² = 0%).
3.1. Analysis.
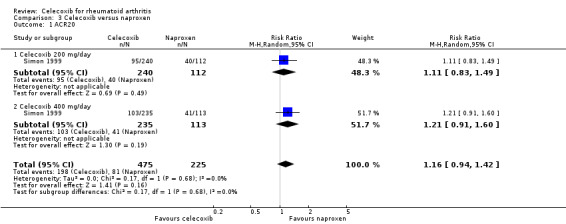
Comparison 3 Celecoxib versus naproxen, Outcome 1 ACR20.
Pain
There was no statistically significant difference in pain reduction among groups receiving celecoxib 200 mg or 400 mg daily and naproxen 1000 mg daily (MD ‐1.40, 95% CI ‐4.36 to 1.56, P = 0.35; Analysis 3.2). There was no heterogeneity (Chi² = 0.86, df = 1, P = 0.35, I² = 0%).
3.2. Analysis.
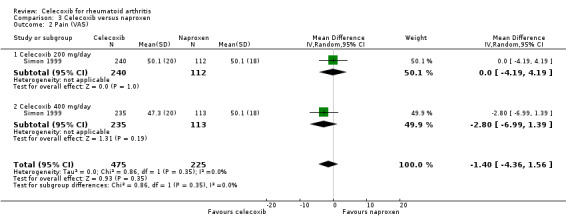
Comparison 3 Celecoxib versus naproxen, Outcome 2 Pain (VAS).
Self‐reported function (Health Assessment Questionnaire (HAQ))
There was no statistically significant difference between celecoxib 200 mg or 400 mg daily and naproxen 1000 mg daily in self‐reported function using the HAQ (MD 0.00, 95% CI ‐0.19 to 0.20, P = 0.99; Analysis 3.3). There was statistically significant heterogeneity (Chi² = 9.32, df = 1, P = 0.002, I² = 89%).
3.3. Analysis.
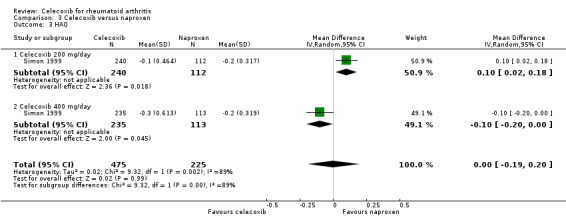
Comparison 3 Celecoxib versus naproxen, Outcome 3 HAQ.
Cardiovascular events
No studies reported this outcome.
Incidence of gastroduodenal ulcers ≥ 3 mm
The incidence of gastroduodenal ulcers ≥ 3 mm was statistically significant lower in participants receiving celecoxib 200 mg and 400 mg daily compared to naproxen 1000 mg daily (RR 0.22, 95% CI 0.14 to 0.36, P < 0.001; N = 546; Analysis 3.4). There was no heterogeneity (Chi² = 1.02, df = 2, P = 0.60, I² = 0%).
3.4. Analysis.
Comparison 3 Celecoxib versus naproxen, Outcome 4 Incidence of gastroduodenal ulcers ≥ 3 mm.
Short‐term serious adverse events
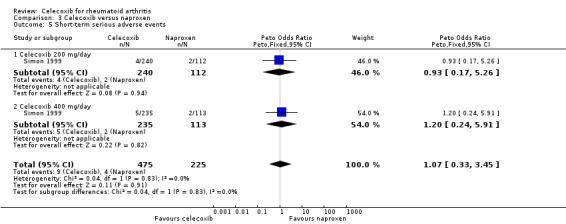
There was no statistically significant difference in incidence of short‐term serious adverse events for celecoxib 200 mg and 400 mg daily and naproxen 1000 mg daily (Peto OR 1.07, 95% CI 0.33 to 3.45, P = 0.91; Analysis 3.5). There was no heterogeneity (Chi² = 0.04, df = 1, P = 0.83, I² = 0%).
3.5. Analysis.
Comparison 3 Celecoxib versus naproxen, Outcome 5 Short‐term serious adverse events.
Secondary outcomes
Total withdrawals (discontinuation rates)
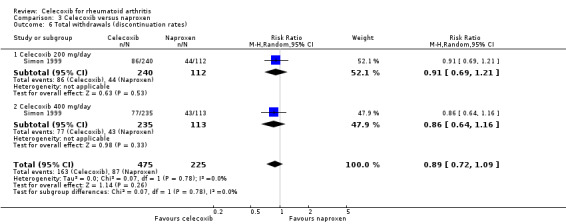
There was no statistically significant difference between celecoxib 200 mg and 400 mg daily and naproxen 1000 mg daily in total number of withdrawals (RR 0.89, 95% CI 0.72 to 1.09, P = 0.26; Analysis 3.6). There was no heterogeneity (Chi² = 0.07, df = 1, P = 0.78, I² = 0%).
3.6. Analysis.
Comparison 3 Celecoxib versus naproxen, Outcome 6 Total withdrawals (discontinuation rates).
Withdrawals due to adverse events
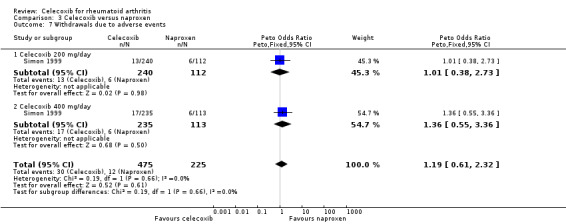
There was no statistically significant difference between celecoxib 200 mg and 400 mg daily and naproxen 1000 mg daily in withdrawals due to adverse events (Peto OR 1.19, 95% CI 0.61 to 2.32, P = 0.62; Analysis 3.7). There was no heterogeneity (Chi² = 0.19, df = 1, P = 0.66, I² = 0%).
3.7. Analysis.
Comparison 3 Celecoxib versus naproxen, Outcome 7 Withdrawals due to adverse events.
Withdrawals due to lack of efficacy
There was no statistically significant difference between celecoxib 200 mg and 400 mg daily and naproxen 1000 mg daily in withdrawals due to lack of efficacy (RR 0.85, 95% CI 0.66 to 1.10, P = 0.23; Analysis 3.8). There was no heterogeneity (Chi² = 0.77, df = 1, P = 0.38, I² = 0%).
3.8. Analysis.
Comparison 3 Celecoxib versus naproxen, Outcome 8 Withdrawals due to lack of efficacy.
Comparison 4. Celecoxib versus diclofenac
Shi 2004 and Emery 1999 provided data for this comparison: Shi 2004 compared celecoxib 200 mg daily with diclofenac 75‐100 mg daily and Emery 1999 compared and celecoxib 400 mg daily with diclofenac 150 mg daily. Follow‐up duration for both studies was six months.
Primary outcomes
ACR20
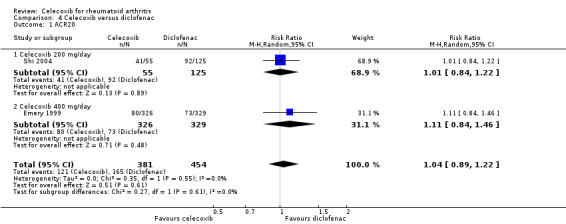
Pooled analysis showed no statistically significant difference between 200 mg and 400 mg celecoxib daily and diclofenac in ACR20 improvement criteria (RR 1.04, 95% CI 0.89 to 1.22, P = 0.61; 2 studies, N = 835; Analysis 4.1). There was no heterogeneity (Chi² = 0.35, df = 1, P = 0.55, I² = 0%).
4.1. Analysis.
Comparison 4 Celecoxib versus diclofenac, Outcome 1 ACR20.
Pain
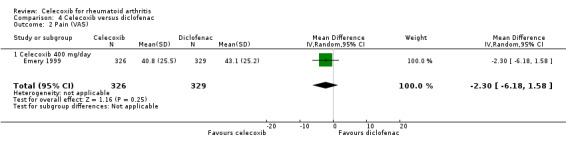
There was no statistically significant difference between 400 mg celecoxib daily and diclofenac in pain reduction (MD ‐2.30, 95% CI ‐6.18 to 1.58, P = 0.25; 1 study, N = 655; Analysis 4.2). Heterogeneity was not applicable for this outcome.
4.2. Analysis.
Comparison 4 Celecoxib versus diclofenac, Outcome 2 Pain (VAS).
Self‐reported physical function (Modified Health Assessment Questionnaire (MHAQ))
There was no statistically significant difference between 400 mg celecoxib daily and diclofenac in self‐reported function measured on the MHAQ (MD 0.00, 95% CI ‐0.11 to 0.11, P = 1.00; 1 study, N = 655; Analysis 4.3). Heterogeneity was not applicable for this outcome.
4.3. Analysis.

Comparison 4 Celecoxib versus diclofenac, Outcome 3 MHAQ.
Cardiovascular events
No studies reported this outcome.
Incidence of gastroduodenal ulcer ≥ 3 mm
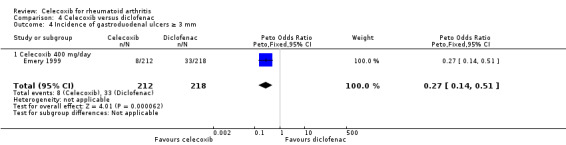
Celecoxib 400 mg daily induced fewer gastroduodenal ulcers ≥ 3 mm compared to diclofenac (Peto OR 0.27, 95% CI 0.14 to 0.51, P < 0.001; 1 study, N = 655; Analysis 4.4). Heterogeneity was not applicable for this outcome.
4.4. Analysis.
Comparison 4 Celecoxib versus diclofenac, Outcome 4 Incidence of gastroduodenal ulcers ≥ 3 mm.
Short‐term serious adverse events
There was no statistically significant difference between celecoxib 200 mg daily and diclofenac in short‐term serious adverse events (Peto OR 0.35, 95% CI 0.09 to 1.34, P = 0.13; 1 study, N = 186; Analysis 4.5). Heterogeneity was not applicable for this outcome.
4.5. Analysis.
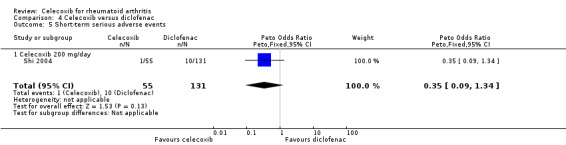
Comparison 4 Celecoxib versus diclofenac, Outcome 5 Short‐term serious adverse events.
Secondary outcomes
Total withdrawals (discontinuation rates)
Pooled analysis showed that the rate of total withdrawals was significantly lower with celecoxib compared to diclofenac (RR 0.73, 95% CI 0.56 to 0.95, P = 0.02; 2 studies, N = 841; Analysis 4.6). There was no heterogeneity (Chi² = 0.00, df = 1, P = 0.96, I² = 0%).
4.6. Analysis.
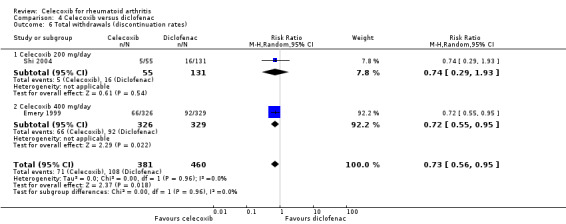
Comparison 4 Celecoxib versus diclofenac, Outcome 6 Total withdrawals (discontinuation rates).
Withdrawals due to adverse events
Pooled analysis showed that the rate of total withdrawals due to adverse events was statistically significant lower with celecoxib compared to diclofenac (RR 0.53, 95% CI 0.36 to 0.78, P = 0.001; 2 studies, N = 841; Analysis 4.7). There was no heterogeneity (Chi² = 0.08, df = 1, P = 0.78, I² = 0%).
4.7. Analysis.
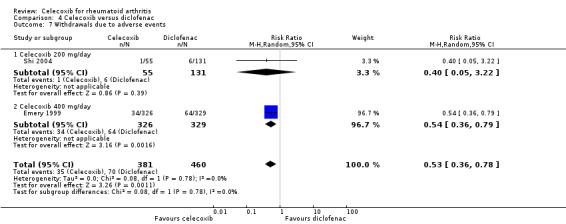
Comparison 4 Celecoxib versus diclofenac, Outcome 7 Withdrawals due to adverse events.
Withdrawals due to lack of efficacy
Pooled analysis showed no statistically significant difference in withdrawals due to lack of efficacy between celecoxib and diclofenac (Peto OR 0.98, 95% CI 0.57 to 1.7, P = 0.94; 2 studies, N = 841; Analysis 4.8). Heterogeneity was moderate (Chi² = 3.89, df = 1, P = 0.05, I² = 74.3%).
4.8. Analysis.
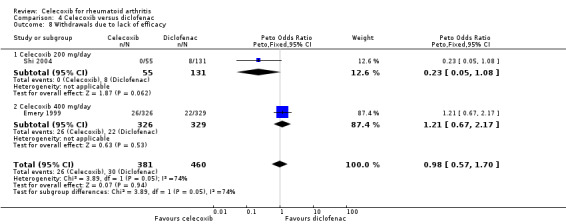
Comparison 4 Celecoxib versus diclofenac, Outcome 8 Withdrawals due to lack of efficacy.
Comparison 5. Celecoxib versus meloxicam
Compared with all tNSAIDs, celecoxib induced fewer gastroduodenal ulcers ≥ 3 mm and fewer withdrawals. These effects were not observed in the comparison of celecoxib and meloxicam; there was no evidence of difference for any outcomes between these drugs alone.
Shi 2004 (N = 199) provided data for this comparison: 200 mg celecoxib daily compared with meloxicam 15 mg daily. Follow‐up duration was six months. Assessment of heterogeneity was not applicable for this comparison.
Primary outcomes
ACR20
There was no statistically significant difference between celecoxib 200 mg daily and meloxicam 15 mg daily in ACR20 criteria (RR 1.04, 95% CI 0.86 to 1.25, P = 0.71; Analysis 5.1).
5.1. Analysis.
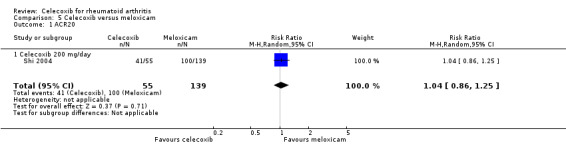
Comparison 5 Celecoxib versus meloxicam, Outcome 1 ACR20.
Pain
No studies reported this outcome.
Self‐reported physical function (Health Assessment Questionnaire (HAQ))
No studies reported this outcome.
Cardiovascular events
No studies reported this outcome.
Incidence of gastroduodenal ulcer ≥ 3 mm
No studies reported this outcome.
Short‐term serious adverse events
There was no statistically significant difference between celecoxib 200 mg daily and meloxicam 15 mg daily in short term serious adverse events (Peto OR 0.46, 95% CI 0.09 to 2.21, P = 0.33; Analysis 5.2).
5.2. Analysis.

Comparison 5 Celecoxib versus meloxicam, Outcome 2 Short‐term serious adverse events.
Secondary outcomes
Total withdrawals (discontinuation rates)
There was no statistically significant difference between celecoxib 200 mg daily and meloxicam 15 mg daily in total withdrawals (RR 0.77, 95% CI 0.30 to 1.99, P = 0.59; Analysis 5.3).
5.3. Analysis.
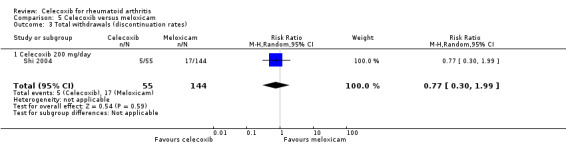
Comparison 5 Celecoxib versus meloxicam, Outcome 3 Total withdrawals (discontinuation rates).
Withdrawals due to adverse events
There was no statistically significant difference between celecoxib 200 mg daily and meloxicam 15 mg daily in withdrawals due to adverse events (Peto OR 0.42, 95% CI 0.10 to 1.88, P = 0.26; Analysis 5.4).
5.4. Analysis.
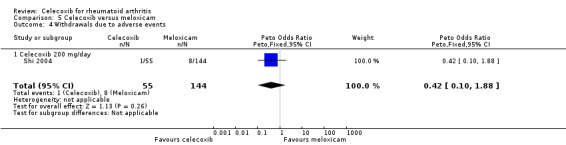
Comparison 5 Celecoxib versus meloxicam, Outcome 4 Withdrawals due to adverse events.
Withdrawals due to lack of efficacy
There was no statistically significant difference between celecoxib 200 mg daily and meloxicam 15 mg daily in withdrawals due to lack of efficacy (Peto OR 0.24, 95% CI 0.04 to 1.48, P = 0.13; Analysis 5.5).
5.5. Analysis.
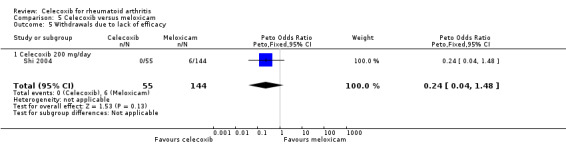
Comparison 5 Celecoxib versus meloxicam, Outcome 5 Withdrawals due to lack of efficacy.
Comparison 6. Celecoxib versus nabumetone
Compared with all tNSAIDs, celecoxib induced fewer gastroduodenal ulcers ≥ 3 mm and fewer withdrawals. These effects were not observed in the comparison of celecoxib and nabumetone; there was no evidence of difference for any outcomes between these drugs alone.
Shi 2004 (N = 182) provided data for this comparison: 200 mg celecoxib daily compared with nabumetone 1000 mg daily. Follow‐up duration was six months. Assessment of heterogeneity was not applicable for this comparison.
Primary outcomes
ACR20
There was no statistically significant difference between celecoxib 200 mg daily and nabumetone 1000 mg daily in ACR20 criteria (RR 1.08, 95% CI 0.89 to 1.30, P = 0.46; Analysis 6.1).
6.1. Analysis.
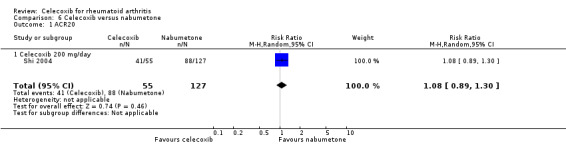
Comparison 6 Celecoxib versus nabumetone, Outcome 1 ACR20.
Pain
No studies reported this outcome.
Self‐reported function (Health Assessment Questionnaire (HAQ))
No studies reported this outcome.
Cardiovascular events
No studies reported this outcome.
Incidence of gastroduodenal ulcer ≥ 3 mm
No studies reported this outcome.
Short‐term serious adverse events
There was no statistically significant difference between celecoxib 200 mg daily and nabumetone 1000 mg daily in short‐term serious adverse events (Peto OR 0.47, 95% CI 0.09 to 2.44, P = 0.37; Analysis 6.2).
6.2. Analysis.
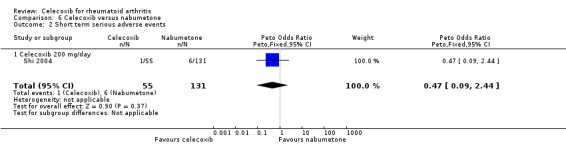
Comparison 6 Celecoxib versus nabumetone, Outcome 2 Short term serious adverse events.
Secondary outcomes
Total withdrawals (discontinuation rates)
There was no statistically significant difference between celecoxib 200 mg daily and nabumetone 1000 mg daily in total withdrawals (RR 0.74, 95% CI 0.29 to 1.93, P = 0.54; N = 182; Analysis 6.3).
6.3. Analysis.
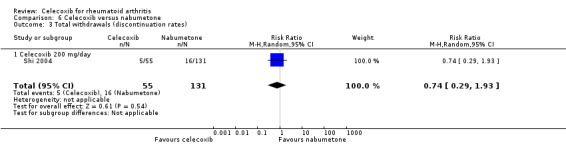
Comparison 6 Celecoxib versus nabumetone, Outcome 3 Total withdrawals (discontinuation rates).
Withdrawals due to adverse events
There was no statistically significant difference between celecoxib 200 mg daily and nabumetone 1000 mg daily in withdrawals due to adverse events (Peto OR 0.63, 95% CI 0.09 to 4.36, P = 0.64; Analysis 6.4).
6.4. Analysis.
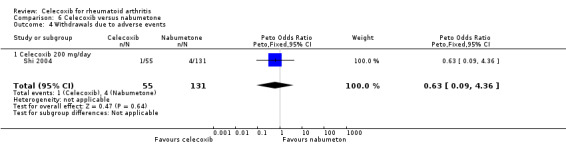
Comparison 6 Celecoxib versus nabumetone, Outcome 4 Withdrawals due to adverse events.
Withdrawals due to lack of efficacy
There was no statistically significant difference between celecoxib 200 mg daily and nabumetone 1000 mg daily in withdrawals due to lack of efficacy (Peto OR 0.23, 95% CI 0.05 to 0.98, P = 0.05; Analysis 6.5).
6.5. Analysis.
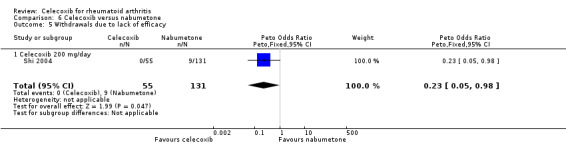
Comparison 6 Celecoxib versus nabumetone, Outcome 5 Withdrawals due to lack of efficacy.
Comparison 7. Celecoxib versus amtolmetin guacyl (AMG)
Compared with all tNSAIDs, celecoxib induced fewer gastroduodenal ulcers ≥ 3 mm and fewer withdrawals. These effects were not observed in the comparison of celecoxib and AMG; there was no evidence of difference for any outcomes between these drugs alone.
Jajic 2005 provided data for this comparison: 400 mg celecoxib daily compared with AMG 1200 mg. Follow‐up duration was five months. Assessment of heterogeneity was not applicable for this comparison.
Primary outcomes
ACR20
There was no statistically significant difference between celecoxib 400 mg daily and AMG 1200 mg daily in ACR20 criteria (RR 1.18, 95% CI 0.87 to 1.62, P = 0.28; Analysis 7.1).
7.1. Analysis.
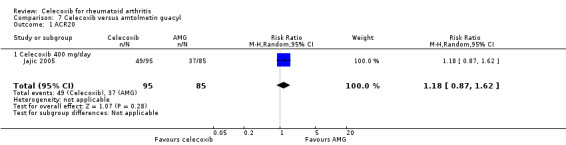
Comparison 7 Celecoxib versus amtolmetin guacyl, Outcome 1 ACR20.
Pain
No studies reported this outcome.
Self‐reported function (Health Assessment Questionnaire (HAQ))
No studies reported this outcome.
Cardiovascular events
No studies reported this outcome.
Incidence of gastroduodenal ulcer ≥ 3 mm
There was no statistically significant difference between celecoxib 400 mg daily and AMG 1200 mg daily in incidence of gastroduodenal ulcers ≥ 3 mm (Peto OR 0.59, 95% CI 0.10 to 3.49, P = 0.56; Analysis 7.2).
7.2. Analysis.
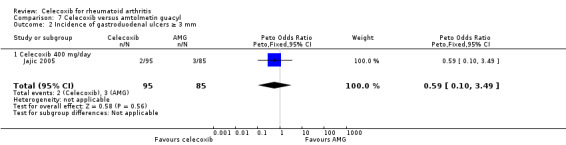
Comparison 7 Celecoxib versus amtolmetin guacyl, Outcome 2 Incidence of gastroduodenal ulcers ≥ 3 mm.
Short‐term serious adverse events
There was no statistically significant difference between celecoxib 400 mg daily and AMG 1200 mg daily in rate of short term serious adverse events (Peto OR 0.66, 95% CI 0.15 to 3.00, P = 0.59; Analysis 7.3).
7.3. Analysis.
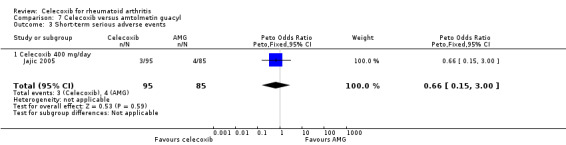
Comparison 7 Celecoxib versus amtolmetin guacyl, Outcome 3 Short‐term serious adverse events.
Secondary outcomes
Total withdrawals (discontinuation rates)
There was no statistically significant difference between celecoxib 400 mg daily and AMG 1200 mg daily in total withdrawals (RR 0.64, 95% CI 0.40 to 1.04, P = 0.07; Analysis 7.4).
7.4. Analysis.
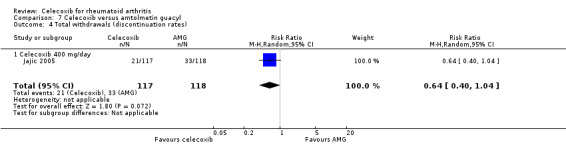
Comparison 7 Celecoxib versus amtolmetin guacyl, Outcome 4 Total withdrawals (discontinuation rates).
Withdrawals due to adverse events
There was no statistically significant difference between celecoxib 400 mg daily and AMG 1200 mg daily in withdrawals due to adverse events (Peto OR 0.57, 95% CI 0.17 to 1.91, P = 0.36; Analysis 7.5).
7.5. Analysis.

Comparison 7 Celecoxib versus amtolmetin guacyl, Outcome 5 Withdrawals due to adverse events.
Withdrawals due to lack of efficacy
No studies reported this outcome.
Comparison 8. Celecoxib versus pelubiprofen
Compared with all tNSAIDs, celecoxib induced fewer gastroduodenal ulcers ≥ 3 mm and fewer withdrawals. These effects were not observed in the comparison of celecoxib and pelubiprofen; there was no evidence of difference for any outcomes between these drugs alone.
Choi 2014 (N = 149) provided data for this comparison: 400 mg celecoxib compared with pelubiprofen 90 mg daily. Follow‐up duration was six months. Assessment of heterogeneity was not applicable for this comparison.
Primary outcomes
ACR20
No studies reported this outcome.
Pain
There was no statistically significant difference between celecoxib 400 mg daily and pelubiprofen 90 mg daily in pain intensity (MD ‐0.20, 95% CI ‐7.58 to 7.18, P = 0.96; Analysis 8.1).
8.1. Analysis.

Comparison 8 Celecoxib versus pelubiprofen, Outcome 1 Pain (VAS).
Self‐reported function (Health Assessment Questionnaire (HAQ))
There was no statistically significant difference between celecoxib 400 mg daily and pelubiprofen 90 mg daily in self‐reported function measured on the HAQ (MD 0.00, 95% CI ‐0.16 to 0.16, P = 1.00; Analysis 8.2).
8.2. Analysis.
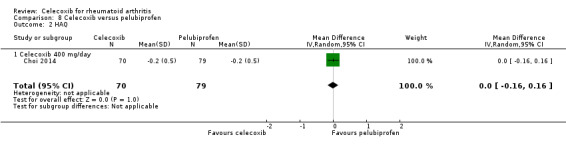
Comparison 8 Celecoxib versus pelubiprofen, Outcome 2 HAQ.
Cardiovascular events
There was no statistically significant difference between celecoxib 400 mg daily and pelubiprofen 90 mg daily in cardiovascular events (Peto OR 1.13, 95% CI 0.07 to 18.33, P = 0.93; Analysis 8.3).
8.3. Analysis.
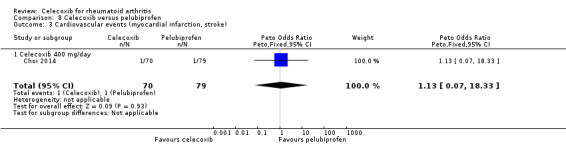
Comparison 8 Celecoxib versus pelubiprofen, Outcome 3 Cardiovascular events (myocardial infarction, stroke).
Incidence of gastroduodenal ulcer ≥ 3 mm
No studies reported this outcome.
Short‐term serious adverse events
There was no statistically significant difference between celecoxib 400 mg daily and pelubiprofen 90 mg daily in short‐term serious adverse events (Peto OR 1.13, 95% CI 0.07 to 18.33, P = 0.93; Analysis 8.4).
8.4. Analysis.
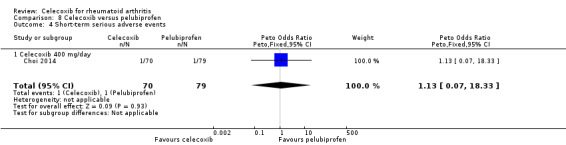
Comparison 8 Celecoxib versus pelubiprofen, Outcome 4 Short‐term serious adverse events.
Secondary outcomes
Total withdrawals (discontinuation rates)
There was no statistically significant difference between celecoxib 400 mg daily and pelubiprofen 90 mg daily in total withdrawals (RR 0.52, 95% CI 0.21 to 1.30, P = 0.16; Analysis 8.5).
8.5. Analysis.

Comparison 8 Celecoxib versus pelubiprofen, Outcome 5 Total withdrawals (discontinuation rates).
Withdrawals due to adverse events
There was no statistically significant difference between celecoxib 400 mg daily and pelubiprofen 90 mg daily in withdrawals due to adverse events (Peto OR 0.46, 95% CI 0.10 to 2.11, P = 0.32; Analysis 8.6).
8.6. Analysis.
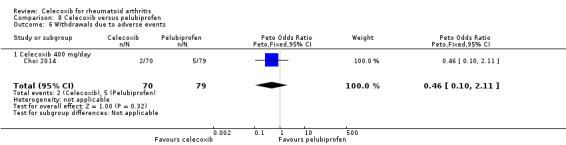
Comparison 8 Celecoxib versus pelubiprofen, Outcome 6 Withdrawals due to adverse events.
Withdrawals due to lack of efficacy
No studies reported this outcome.
Comparison 9. Celecoxib versus ibuprofen
Compared with all tNSAIDs, celecoxib induced fewer gastroduodenal ulcers ≥ 3 mm and fewer withdrawals. The same effects were observed in comparison of celecoxib and ibuprofen. Celecoxib also had a lower rate of withdrawals due to lack of efficacy compared to ibuprofen.
Kivitz 2004 (N = 439) provided data for this comparison: 400 mg celecoxib daily compared with ibuprofen 2400 mg daily. Follow‐up duration was 13 weeks. Assessment of heterogeneity was not applicable for this comparison.
Primary outcomes
ACR20
No studies reported this outcome.
Pain
No studies reported this outcome.
Self‐reported physical function (Health Assessment Questionnaire (HAQ))
No studies reported this outcome.
Cardiovascular events
No studies reported this outcome.
Incidence of gastroduodenal ulcer ≥ 3 mm
The rate of gastroduodenal ulcers ≥ 3 mm was statistically significant lower in the celecoxib 400 mg daily group compared to ibuprofen 2400 mg daily (RR 0.14, 95% CI 0.05 to 0.39, P < 0.001; Analysis 9.1).
9.1. Analysis.
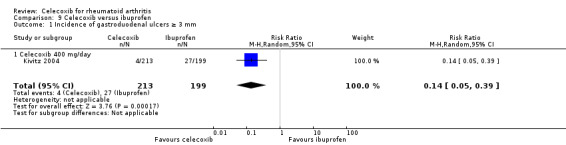
Comparison 9 Celecoxib versus ibuprofen, Outcome 1 Incidence of gastroduodenal ulcers ≥ 3 mm.
Short‐term serious adverse events
There was no statistically significant difference between celecoxib 400 mg daily and ibuprofen 2400 mg daily in rate of short term serious adverse events (Peto OR 0.49, 95% CI 0.13 to 1.84, P = 0.29; Analysis 9.2).
9.2. Analysis.
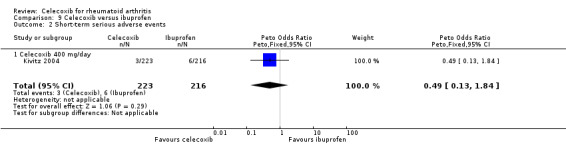
Comparison 9 Celecoxib versus ibuprofen, Outcome 2 Short‐term serious adverse events.
Secondary outcomes
Total withdrawals (discontinuation rates)
The rate of total withdrawals was statistically significantly lower in the celecoxib 400 mg daily group compared to ibuprofen 2400 mg daily (RR 0.49, 95% CI 0.34 to 0.72, P < 0.001; Analysis 9.3).
9.3. Analysis.
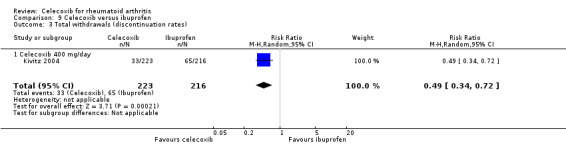
Comparison 9 Celecoxib versus ibuprofen, Outcome 3 Total withdrawals (discontinuation rates).
Withdrawals due to adverse events
There was no statistically significant difference between celecoxib 400 mg daily and ibuprofen 2400 mg daily in rate of withdrawals due to adverse events (RR 0.65, 95% CI 0.37 to 1.14, P = 0.13; Analysis 9.4).
9.4. Analysis.
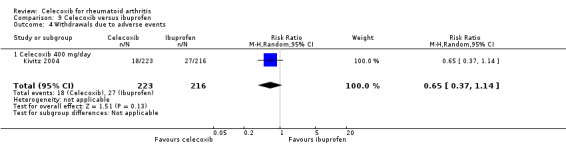
Comparison 9 Celecoxib versus ibuprofen, Outcome 4 Withdrawals due to adverse events.
Withdrawals due to lack of efficacy
The rate of withdrawals due to lack of efficacy was statistically significantly lower in the celecoxib 400 mg daily group compared to ibuprofen 2400 mg (Peto OR 0.34, 95% CI 0.14 to 0.83, P = 0.02; Analysis 9.5).
9.5. Analysis.

Comparison 9 Celecoxib versus ibuprofen, Outcome 5 Withdrawals due to lack of efficacy.
Sensitivity analysis
We conducted sensitivity analyses to assess the potential influence of risk of bias. We conducted 15 sensitivity analyses to assess the potential influence of studies assessed at low and high risk of bias on domains related to randomization sequence, allocation concealment and blinding of participants and personnel, based on data from three studies (Jajic 2005; Kivitz 2004; Shi 2004). Shi 2004 was excluded (high risk of bias for blinding of participants and personnel) and subsequently, Jajic 2005 and Kivitz 2004 were also excluded from analyses. Results were recorded and compared with analysis of all relevant studies for that outcome. After repeating sensitivity analyses, we found only one study had statistically significant results.
The outcome 'withdrawals due to adverse events' in Analysis 2.9 presents pooled data from six studies showing that the rate of total withdrawals due to adverse events was statistically significantly lower with celecoxib compared to tNSAIDs. However, after excluding three studies assessed at unclear or high risk of bias for randomization sequence, allocation concealment and blinding of participants and personnel (Jajic 2005; Kivitz 2004; Shi 2004) results showed no statistically significant difference between celecoxib and tNSAIDs in the rate of total withdrawals due to adverse events.
We also conducted sensitivity analyses to address the potential influence of different types of meta‐analysis. Results from all analyses were compared according to use of fixed‐effect and random‐effects models. There were no significant changes in results from changing meta‐analysis model types.
Publication bias
We were unable to estimate potential publication bias in this systematic review because we did not include a sufficient number of trials for assessment.
Discussion
Summary of main results
We included eight randomized controlled trials (RCTs) that assessed the clinical benefits and harms of celecoxib for people with rheumatoid arthritis. Included studies compared celecoxib 200 mg daily and 400 mg daily with placebo or traditional nonsteroidal anti‐inflammatory drugs (tNSAIDs). Celecoxib provided better clinical improvement than placebo (15% absolute improvement) and alleviation of pain (11% absolute improvement). Celecoxib was associated with lower rates of total withdrawals from studies (22% absolute change). Results of comparisons between celecoxib and placebo were uncertain for physical function, incidence of gastroduodenal ulcers ≥ 3 mm and short‐term serious adverse events. None of the studies comparing celecoxib with placebo reported incidence of cardiovascular events, including myocardial infarction and stroke. Findings from the comparison of celecoxib and placebo are provided in Table 1.
In comparisons of celecoxib with tNSAIDs, celecoxib was associated with slight clinical improvement (4% absolute improvement), which may not be clinically significant. Results were uncertain for pain (2% absolute improvement) and physical function (0% absolute change). Participants taking celecoxib had lower incidence of gastroduodenal ulcers ≥ 3 mm (12% absolute change) and fewer withdrawals from trials (7% absolute change). Results were uncertain for numbers of cardiovascular events and short‐term serious adverse events. Findings are provided in Table 2.
Uncertain results about the rate of cardiovascular events between celecoxib and tNSAIDs could be due to risk of bias and that evidence came from small, short‐term trials. A recent relevant study indicated that both celecoxib and tNSAIDs increase the rate of cardiovascular events (CNT 2013). Regulatory agencies in Australia, Europe and the UK refer to the USA FDA assessment of increased risk of cardiovascular events (FDA 2016). Advice about increased risk of cardiovascular events is included in most product labels.
We have limited confidence in results about harms. Further and larger clinical trials comparing celecoxib directly to other tNSAIDs are required to inform clinical practice.
Overall, evidence was assessed at moderate‐to‐low quality; evidence was downgraded due to risk of bias, imprecision and inconsistency.
Overall completeness and applicability of evidence
The included studies had similar inclusion criteria, with precisely defined participant, intervention and outcome criteria. Seven studies (Choi 2014; Emery 1999; Goldstein 2001; Jajic 2005; Kivitz 2004; Shi 2004; Simon 1999) included comparison with another marketed tNSAID drug: naproxen, diclofenac, meloxicam, nabumetone, lumiracoxib, ibuprofen, pelubiprofen and AMG. However, there are many other tNSAIDs on the market used to treat people with rheumatoid arthritis. New trials with head‐to‐head comparisons of other drugs are necessary to address this limitation.
One study analyzed only harms (Kivitz 2004) and one analyzed only benefits (Simon 1998). Not all studies analyzed outcomes of interest for this review and many analyses included few participants. Cardiovascular events are a major concern for users of these drugs; we included only one small study (N = 149) of short duration (6 weeks) reporting this outcome. Evidence about relevant outcomes is incomplete and studies that were identified were insufficient to address all review objectives.
Studies included participants from Africa (Emery 1999; Kivitz 2004), Asia (Choi 2014; Kivitz 2004; Shi 2004), North America (Goldstein 2001; Kivitz 2004; Simon 1999), Europe (Emery 1999; Jajic 2005; Kivitz 2004), South America (Kivitz 2004) and Australia (Emery 1999). Results may be applicable to participants from different settings. Simon 1998 did not report study location.
Only one study explicitly declared participants' country of origin (Korea) (Choi 2014); two studies described participants' race (mostly Caucasian) (Goldstein 2001; Kivitz 2004). Other included studies did not report participants' ethnicity or race. It is unknown if study participants' race or ethnicity had an effect on results.
Review results may not be applicable to pregnant or lactating women. Four included studies excluded pregnant and lactating women (Choi 2014; Emery 1999; Jajic 2005; Shi 2004). Two studies did not mention pregnancy or lactation status in exclusion criteria (Simon 1998; Simon 1999); two studies specified that pregnancy was an exclusion criterion, but not lactating women (Goldstein 2001; Kivitz 2004).
Quality of the evidence
Table 1 and Table 2 indicate overall evidence quality assessed using the GRADE approach. For celecoxib compared with placebo, we rated outcomes for clinical improvement and pain as moderate quality evidence due to risk of bias; physical function was rated as low quality evidence due to risk of bias and inconsistency. Other outcomes evaluating harms for celecoxib compared with placebo were rated as low due to risk of bias and imprecision. In the comparison of celecoxib with other marketed tNSAIDs we rated outcomes for clinical improvement, pain, incidence of gastro‐intestinal ulcers and total withdrawals as moderate quality due to risk of bias. Physical function was rated as low quality evidence due to risk of bias and inconsistency. Incidence of cardiovascular events and short‐term serious adverse events was rated as low quality evidence due to risk of bias and imprecision.
Overall evidence quality was assessed as moderate to low because of risk of bias and few observed events for some harm outcomes and imprecision (wide confidence intervals).
All studies were assessed at unclear or high risk of bias on at least one domain. Most studies had problems with attrition bias; only one study had low risk of attrition bias, and four had high risk of attrition bias.
Most studies permitted use of concomitant and rescue medications, which was not controlled or accounted for in study results. We were unable to obtain clarifications regarding risk of bias from corresponding authors of three studies (Jajic 2005; Kivitz 2004; Shi 2004).
Overall, results did not permit robust conclusions to be made about the objectives of this review due to lack of high‐quality evidence and imprecision of results.
Potential biases in the review process
One of the most important steps in conducting a systematic review is the literature search and we consider that our review had low risk of bias related to searching. We searched several international medical databases and clinical trial registries. We also checked reference lists and citations of all included studies for studies that may have been missed from database searching.
Screening, data extraction and risk of bias assessment for each item were conducted by two independent authors and discrepancies were resolved through discussion and consultation when necessary.
Limitations of this systematic review include unsuccessful communication with several study authors. We contacted the corresponding authors of all eight studies to clarify risk of bias. We received responses from five study authors; we await responses from three.
Five included studies were supported or funded by the pharmaceutical industry (Choi 2014; Goldstein 2001; Kivitz 2004; Simon 1998; Simon 1999). Shi 2004 was partly supported by the state regulatory body. Jajic 2005 indicated that drugs for the study were provided by a pharmaceutical company. Emery 1999 did not declare funding source.
Agreements and disagreements with other studies or reviews
A systematic review by Roubille 2015 analyzed the effects of tumor necrosis factor inhibitors, methotrexate, NSAIDs and corticosteroids on cardiovascular events in rheumatoid arthritis, psoriasis and psoriatic arthritis. Separate data were shown for celecoxib (supplementary figure 1) in people with rheumatoid arthritis (from 5 studies), indicating that celecoxib did not increase the risk of all cardiovascular events (RR 1.03, 95% CI 0.80 to 1.32; P = 0.81). However, the five studies were observational and not RCTs. Roubille 2015 was sponsored by AbbVie.
A systematic review by Van Walsem 2015 assessed benefit‐risk of diclofenac and tNSAIDs in people with rheumatoid arthritis and osteoarthritis. Data were not presented separately for rheumatoid arthritis and osteoarthritis. Diclofenac was associated with a lower risk of withdrawals due to lack of benefit compared to celecoxib, which is not in line with our results. Van Walsem 2015 was funded by Novartis and some authors were employees of Novartis.
In 2013, the Coxib and traditional NSAID Trialists’ (CNT) Collaboration published a meta‐analysis of vascular and upper gastro‐intestinal effects of NSAIDs, based on individual participant data (IPD) from RCTs (CNT 2013). Indication for treatment with an NSAID in the included RCTs were mostly rheumatoid arthritis and osteoarthritis; a quarter of RCTs studied prevention of colorectal adenoma or of Alzheimer’s disease with coxibs. The analysis included data from trials that analysed celecoxib doses of 100 mg, 200 mg, 400 mg and 800 mg daily. Results showed that celecoxib significantly increased the risk of major cardiovascular events (RR 1.36, 95% CI 1.00 to 1.84), with smaller proportional excess risk of major vascular events with lower celecoxib doses in placebo‐controlled trials. Higher doses of celecoxib yielded larger proportional excesses in risk of ulcer. The authors concluded that although there was a trend towards less risk with lower celecoxib doses, the vascular effects of celecoxib 200 mg daily (the most widely used coxib regimen) were statistically uncertain. This study was funded by the UK Medical Research Council and British Heart Foundation (CNT 2013).
For this systematic review we could not confirm such results, because results for differences between celecoxib and tNSAIDs in the rate of cardiovascular events were uncertain; evidence for this outcome came from only one small study (N = 149) of six weeks duration.
A systematic review by Moore 2013 assessed gastro‐intestinal outcomes of celecoxib in people with osteoarthritis and rheumatoid arthritis. Data were not presented separately for rheumatoid arthritis and osteoarthritis. The main outcome measured was incidence of clinically significant upper and lower gastro‐intestinal events. Compared to other tNSAIDs celecoxib was associated with lower risk of gastro‐intestinal events. Time to incidence of events was longer in celecoxib group, than tNSAIDs. This review was funded by Pfizer Inc and some authors were employees of Pfizer (Moore 2013).
A systematic review by Ashroft 2001 assessed gastroduodenal ulceration in participants with rheumatoid arthritis and osteoarthritis treated with celecoxib. Data were not presented separately for rheumatoid arthritis and osteoarthritis. Summary results were that celecoxib was associated with lower incidence of gastroduodenal ulcers than diclofenac, ibuprofen and naproxen which is in line with our results. Funding source was not reported (Ashroft 2001).
A systematic review by Bensen 2000 assessed gastro‐intestinal tolerability of celecoxib and tNSAIDs in participants with rheumatoid arthritis and osteoarthritis. Data were not presented separately for rheumatoid arthritis and osteoarthritis. Results from this review showed that celecoxib had superior gastro‐intestinal tolerability relative to tNSAIDs. A limitation of this review was that the only tNSAID comparator was naproxen. This study was supported by Pharmacia and some authors were employees of Pharmacia (Bensen 2000).
Our literature search indicated that previous systematic reviews and meta‐analyses did not provide separate analyses for benefits and safety of celecoxib in people with rheumatoid arthritis based on data from RCTs. The only one systematic review that analysed risk for cardiovascular events in rheumatoid arthritis, associated with consumption of celecoxib, included only observational studies in this analysis (Roubille 2015).
Compared to findings from systematic reviews where data from RCTs for both rheumatoid arthritis and osteoarthritis were included, reported benefits for celecoxib versus placebo and celecoxib versus tNSAIDs, our findings align with previous systematic reviews. Safety data for celecoxib versus placebo indicate equal results between celecoxib and placebo in incidence of gastroduodenal ulcers ≥ 3 mm and short‐term serious adverse events. However, there were few events reported.
Celecoxib was associated with lower incidence of gastroduodenal ulcers ≥ 3 mm and lower rate of total withdrawals than tNSAIDs. There was no evidence of difference between celecoxib and tNSAIDs in cardiovascular event rates and short‐term serious adverse events. However, few events were observed and therefore our confidence in these results is very low.
Authors' conclusions
Implications for practice.
Short‐term studies including participants with rheumatoid arthritis provided evidence that celecoxib is better than placebo for clinical improvement and alleviation of pain. There was no evidence that celecoxib was different to analyzed tNSAIDs in terms of benefit outcomes. In safety outcomes, celecoxib was associated with lower incidence of gastroduodenal ulcers ≥ 3 mm and fewer withdrawals, but there was inconclusive evidence for a difference between celecoxib and tNSAIDs in the rates of cardiovascular events and short‐term serious adverse events.
There are known risks of harm (e.g. cardiovascular events) with NSAID use overall in the general population but we are uncertain about differences between individual NSAIDs, and risk of this particular drug for this patient group.
Quality of evidence was moderate‐to‐low because of risk of bias and few observed safety events. Most studies were funded by the pharmaceutical industry.
Implications for research.
This systematic review provides evidence about benefits and safety of celecoxib compared with placebo or tNSAIDs. However, the evidence is based on studies with a number of methodological shortcomings; evidence was assessed as moderate‐to‐low quality. Six studies were longer than 12 weeks, and five were supported by pharmaceutical companies. New studies about benefits and safety of celecoxib for rheumatoid arthritis are necessary and should assign appropriate, robust study design and methodological quality, longer follow‐up periods, attract independent funding and conduct more direct comparisons with tNSAIDs. Future studies should also include larger populations of participants to detect rare events, especially cardiovascular incidence rates.
Acknowledgements
We are grateful to the Cochrane Musculoskeletal Group for their help and support. Many thanks to Prof Peter Tugwell, Lara J Maxwell and Jordi Pardo for their invaluable help. Special gratitude goes to Camillia and Branko Mamic for their generous support throughout the years.
Appendices
Appendix 1. Search strategies
MEDLINE via OVID
1. (cyclooxygenase‐2 or cyclooxygenase 2 or cyclooxygenase‐II or cyclooxygen‐aseII).ti,ab.
2. (cyclo oxygenase‐2 or cyclo oxygenase2 or cyclo oxygenase‐II or cyclo oxygen‐aseII).ti,ab.
3. (cox‐2 or cox2 or cox‐II or coxII).ti,ab.
4. (celecoxib or celebrex or SC‐58635).af.
5. Cyclooxygenase inhibitors/
6. or/1‐5
7. exp arthritis, rheumatoid/
8. ((rheumatoid or reumatoid or revmatoid or rheumatic or reumatic or revmatic or rheumat$ or reumat$ or revmarthrit$) adj3 (arthrit$ or artrit$ or diseas$ or condition$ or nodule$)).tw.
9. (felty$ adj2 syndrome).tw.
10. (caplan$ adj2 syndrome).tw.
11. (sjogren$ adj2 syndrome).tw.
12. (sicca adj2 syndrome).tw.
13. still$ disease.tw.
14. or/7‐13
15. 6 and 14
16. randomized controlled trial.pt.
17. controlled clinical trial.pt.
18. randomized.ab.
19. placebo.ab.
20. drug therapy.fs.
21. randomly.ab.
22. trial.ab.
23. groups.ab.
24. or/13‐20
25. (animals not (humans and animals)).sh.
26. 24 not 25
27. 15 and 26
Embase
1. (cyclooxygenase‐2 or cyclooxygenase2 or cyclooxygenase‐II or cyclooxygenaseII).ti,ab.
2. (cyclo oxygenase‐2 or cyclo oxygenase2 or cyclo oxygenase‐II or cyclo oxygenaseII).ti,ab.
3. (cox‐2 or cox2 or cox‐II or coxII).ti,ab.
4. (celecoxib or celebrex or SC‐58635).af.
5. Cyclooxygenase 2 inhibitor/
6. Cyclooxygenase 2/
7. Celecoxib/
8. or/1‐7
9. exp arthritis, rheumatoid/
10. (felty$ adj2 syndrome).tw.
11. (caplan$ adj2 syndrome).tw.
12. rheumatoid nodule.tw.
13. (sjogren$ adj2 syndrome).tw.
14. (sicca adj2 syndrome).tw.
15. still$ disease.tw.
16. bechterew$ disease.tw.
17. (arthritis adj2 rheumat$).tw.
18. or/9‐17
19. random$.tw.
20. factorial$.tw.
21. crossover$.tw.
22. cross over.tw.
23. cross‐over.tw.
24. placebo$.tw.
25. (doubl$ adj blind$).tw.
26. (singl$ adj blind$).tw.
27. assign$.tw.
28. allocat$.tw.
29. volunteer$.tw.
30. crossover procedure/
31. double blind procedure/
32. randomized controlled trial/
33. single blind procedure/
34. or/19‐33
35. 8 and 18 and 34
CENTRAL
1. (cyclooxygenase‐2 or cyclooxygenase 2 or cyclooxygenase‐II or cyclooxygen‐aseII).ti,ab.
2. (cyclo oxygenase‐2 or cyclo oxygenase2 or cyclo oxygenase‐II or cyclo oxygen‐aseII).ti,ab.
3. (cox‐2 or cox2 or cox‐II or coxII).ti,ab.
4. (celecoxib or celebrex or SC‐58635).af.
5. Cyclooxygenase inhibitors/
6. or/1‐5
7. exp arthritis, rheumatoid/
8. ((rheumatoid or reumatoid or revmatoid or rheumatic or reumatic or revmatic or rheumat$ or reumat$ or revmarthrit$) adj3 (arthrit$ or artrit$ or diseas$ or condition$ or nodule$)).tw.
9. (felty$ adj2 syndrome).tw.
10. (caplan$ adj2 syndrome).tw.
11. (sjogren$ adj2 syndrome).tw.
12. (sicca adj2 syndrome).tw.
13. still$ disease.tw.
14. or/7‐13
15. 6 and 14
Data and analyses
Comparison 1. Celecoxib versus placebo.
| Outcome or subgroup title | No. of studies | No. of participants | Statistical method | Effect size |
|---|---|---|---|---|
| 1 ACR20 | 2 | 873 | Risk Ratio (M‐H, Random, 95% CI) | 1.53 [1.25, 1.86] |
| 1.1 Celecoxib 200 mg daily | 1 | 355 | Risk Ratio (M‐H, Random, 95% CI) | 1.38 [0.99, 1.91] |
| 1.2 Celecoxib 400 mg daily | 2 | 518 | Risk Ratio (M‐H, Random, 95% CI) | 1.62 [1.26, 2.08] |
| 2 Pain (VAS) | 1 | 706 | Mean Difference (IV, Random, 95% CI) | ‐9.00 [‐14.04, ‐7.96] |
| 2.1 Celecoxib 200 mg daily | 1 | 355 | Mean Difference (IV, Random, 95% CI) | ‐9.60 [‐13.90, ‐5.30] |
| 2.2 Celecoxib 400 mg daily | 1 | 351 | Mean Difference (IV, Random, 95% CI) | ‐12.40 [‐16.70, ‐8.10] |
| 3 HAQ | 1 | 706 | Mean Difference (IV, Random, 95% CI) | ‐0.10 [‐0.29, 0.10] |
| 3.1 Celecoxib 200 mg/day | 1 | 355 | Mean Difference (IV, Random, 95% CI) | 0.0 [‐0.10, 0.10] |
| 3.2 Celecoxib 400 mg/day | 1 | 351 | Mean Difference (IV, Random, 95% CI) | ‐0.20 [‐0.31, ‐0.09] |
| 4 Incidence of gastroduodenal ulcers ≥ 3 mm | 1 | 392 | Peto Odds Ratio (Peto, Fixed, 95% CI) | 1.26 [0.44, 3.63] |
| 4.1 Celecoxib 200 mg daily | 1 | 197 | Peto Odds Ratio (Peto, Fixed, 95% CI) | 1.46 [0.36, 5.93] |
| 4.2 Celecoxib 400 mg daily | 1 | 195 | Peto Odds Ratio (Peto, Fixed, 95% CI) | 1.04 [0.21, 5.21] |
| 5 Short term serious adverse events | 1 | 706 | Peto Odds Ratio (Peto, Fixed, 95% CI) | 0.87 [0.28, 2.69] |
| 5.1 Celecoxib 200 mg daily | 1 | 355 | Peto Odds Ratio (Peto, Fixed, 95% CI) | 0.96 [0.17, 5.36] |
| 5.2 Celecoxib 400 mg daily | 1 | 351 | Peto Odds Ratio (Peto, Fixed, 95% CI) | 0.81 [0.18, 3.61] |
| 6 Total withdrawals (discontinuation rates) | 1 | 706 | Risk Ratio (M‐H, Random, 95% CI) | 0.61 [0.52, 0.72] |
| 6.1 Celecoxib 200 mg daily | 1 | 355 | Risk Ratio (M‐H, Random, 95% CI) | 0.63 [0.50, 0.80] |
| 6.2 Celecoxib 400 mg daily | 1 | 351 | Risk Ratio (M‐H, Random, 95% CI) | 0.58 [0.46, 0.75] |
| 7 Withdrawals due to adverse events | 2 | 873 | Peto Odds Ratio (Peto, Fixed, 95% CI) | 1.21 [0.66, 2.20] |
| 7.1 Celecoxib 200 mg daily | 1 | 355 | Peto Odds Ratio (Peto, Fixed, 95% CI) | 1.25 [0.45, 3.43] |
| 7.2 Celecoxib 400 mg daily | 2 | 518 | Peto Odds Ratio (Peto, Fixed, 95% CI) | 1.19 [0.56, 2.50] |
| 8 Withdrawals due to lack of efficacy | 2 | 873 | Risk Ratio (M‐H, Random, 95% CI) | 0.51 [0.36, 0.72] |
| 8.1 Celecoxib 200 mg daily | 1 | 355 | Risk Ratio (M‐H, Random, 95% CI) | 0.62 [0.46, 0.82] |
| 8.2 Celecoxib 400 mg daily | 2 | 518 | Risk Ratio (M‐H, Random, 95% CI) | 0.38 [0.18, 0.80] |
Comparison 2. Celecoxib versus NSAIDs.
| Outcome or subgroup title | No. of studies | No. of participants | Statistical method | Effect size |
|---|---|---|---|---|
| 1 ACR20 | 4 | 1981 | Risk Ratio (M‐H, Random, 95% CI) | 1.10 [0.99, 1.23] |
| 1.1 Celecoxib 200 mg/day versus naproxen 1000 mg/day | 1 | 352 | Risk Ratio (M‐H, Random, 95% CI) | 1.11 [0.83, 1.49] |
| 1.2 Celecoxib 200 mg/day versus diclofenac 75‐100 mg/day | 1 | 143 | Risk Ratio (M‐H, Random, 95% CI) | 0.98 [0.72, 1.33] |
| 1.3 Celecoxib 200 mg/day versus meloxicam 15 mg/day | 1 | 157 | Risk Ratio (M‐H, Random, 95% CI) | 1.08 [0.83, 1.41] |
| 1.4 Celecoxib 200 mg/day versus nabumetone 1000 mg/day | 1 | 146 | Risk Ratio (M‐H, Random, 95% CI) | 1.06 [0.79, 1.42] |
| 1.5 Celecoxib 400 mg/day | 3 | 1183 | Risk Ratio (M‐H, Random, 95% CI) | 1.16 [0.98, 1.38] |
| 2 Pain (VAS) | 3 | 1504 | Mean Difference (IV, Random, 95% CI) | ‐1.59 [‐3.83, 0.65] |
| 2.1 Celecoxib 200 mg/day | 1 | 352 | Mean Difference (IV, Random, 95% CI) | 0.0 [‐4.19, 4.19] |
| 2.2 Celecoxib 400 mg/day | 3 | 1152 | Mean Difference (IV, Random, 95% CI) | ‐2.23 [‐4.89, 0.43] |
| 3 HAQ | 2 | 849 | Mean Difference (IV, Random, 95% CI) | 0.00 [‐0.13, 0.13] |
| 3.1 Celecoxib 200 mg/day | 1 | 352 | Mean Difference (IV, Random, 95% CI) | 0.10 [‐0.00, 0.20] |
| 3.2 Celecoxib 400 mg/day | 2 | 497 | Mean Difference (IV, Random, 95% CI) | ‐0.07 [‐0.16, 0.03] |
| 4 MHAQ | 1 | 655 | Mean Difference (IV, Random, 95% CI) | 0.0 [‐0.11, 0.11] |
| 4.1 Celecoxib 400 mg/day | 1 | 655 | Mean Difference (IV, Random, 95% CI) | 0.0 [‐0.11, 0.11] |
| 5 Cardiovascular events (myocardial infarction, stroke) | 1 | 149 | Peto Odds Ratio (Peto, Fixed, 95% CI) | 1.13 [0.07, 18.33] |
| 5.1 Celecoxib 400 mg/day | 1 | 149 | Peto Odds Ratio (Peto, Fixed, 95% CI) | 1.13 [0.07, 18.33] |
| 6 Incidence of gastroduodenal ulcers ≥ 3 mm | 5 | 1568 | Risk Ratio (M‐H, Random, 95% CI) | 0.22 [0.15, 0.32] |
| 6.1 Celecoxib 200 mg/day | 1 | 216 | Risk Ratio (M‐H, Random, 95% CI) | 0.23 [0.11, 0.48] |
| 6.2 Celecoxib 400 mg/day | 5 | 1352 | Risk Ratio (M‐H, Random, 95% CI) | 0.22 [0.15, 0.34] |
| 7 Short‐term serious adverse events | 5 | 2154 | Peto Odds Ratio (Peto, Fixed, 95% CI) | 0.71 [0.39, 1.28] |
| 7.1 Celecoxib 200 mg/day versus naproxen | 1 | 465 | Peto Odds Ratio (Peto, Fixed, 95% CI) | 0.94 [0.23, 3.79] |
| 7.2 Celecoxib 200 mg/day versus diclofenac 75 mg to 100 mg/day | 1 | 149 | Peto Odds Ratio (Peto, Fixed, 95% CI) | 0.30 [0.04, 2.12] |
| 7.3 Celecoxib 200 mg/day versus meloxicam 15 mg/day | 1 | 162 | Peto Odds Ratio (Peto, Fixed, 95% CI) | 0.31 [0.03, 3.43] |
| 7.4 Celecoxib 200 mg/day versus nabumetone 1000 mg/day | 1 | 150 | Peto Odds Ratio (Peto, Fixed, 95% CI) | 1.16 [0.12, 11.31] |
| 7.5 Celecoxib 400 mg/day | 4 | 1228 | Peto Odds Ratio (Peto, Fixed, 95% CI) | 0.76 [0.35, 1.63] |
| 8 Total withdrawals (discontinuation rates) | 6 | 2639 | Risk Ratio (M‐H, Random, 95% CI) | 0.73 [0.62, 0.86] |
| 8.1 Celecoxib 200 mg/day versus naproxen 1000 mg/day | 1 | 352 | Risk Ratio (M‐H, Random, 95% CI) | 0.93 [0.70, 1.25] |
| 8.2 Celecoxib 200 mg/day versus diclofenac 75 mg to 100 mg/day | 1 | 149 | Risk Ratio (M‐H, Random, 95% CI) | 0.45 [0.06, 3.23] |
| 8.3 Celecoxib 200 mg/day versus meloxicam 15 mg/day | 1 | 162 | Risk Ratio (M‐H, Random, 95% CI) | 0.94 [0.24, 3.74] |
| 8.4 Celecoxib 200 mg/day versus nabumetone 1000 mg/day | 1 | 150 | Risk Ratio (M‐H, Random, 95% CI) | 0.86 [0.21, 3.46] |
| 8.5 Celecoxib 400 mg/day | 5 | 1826 | Risk Ratio (M‐H, Random, 95% CI) | 0.67 [0.55, 0.83] |
| 9 Withdrawals due to adverse events | 6 | 2639 | Peto Odds Ratio (Peto, Fixed, 95% CI) | 0.62 [0.46, 0.82] |
| 9.1 Celecoxib 200 mg/day versus naproxen 1000 mg/day | 1 | 352 | Peto Odds Ratio (Peto, Fixed, 95% CI) | 1.01 [0.38, 2.73] |
| 9.2 Celecoxib 200 mg/day versus diclofenac 75 mg to 100 mg/day | 1 | 149 | Peto Odds Ratio (Peto, Fixed, 95% CI) | 0.31 [0.03, 3.75] |
| 9.3 Celecoxib 200 mg/day versus meloxicam 15 mg/day | 1 | 162 | Peto Odds Ratio (Peto, Fixed, 95% CI) | 0.31 [0.03, 2.94] |
| 9.4 Celecoxib 200 mg/day versus nabumetone 1000 mg/day | 1 | 150 | Peto Odds Ratio (Peto, Fixed, 95% CI) | 1.98 [0.14, 28.58] |
| 9.5 Celecoxib 400 mg/day | 5 | 1826 | Peto Odds Ratio (Peto, Fixed, 95% CI) | 0.59 [0.43, 0.81] |
| 10 Withdrawals due to lack of efficacy | 4 | 2255 | Risk Ratio (M‐H, Random, 95% CI) | 0.83 [0.63, 1.10] |
| 10.1 Celecoxib 200 mg/day versus naproxen 1000 mg/day | 1 | 352 | Risk Ratio (M‐H, Random, 95% CI) | 0.98 [0.68, 1.40] |
| 10.2 Celecoxib 200 mg/day versus diclofenac 75 mg to 100 mg/day | 1 | 149 | Risk Ratio (M‐H, Random, 95% CI) | 0.41 [0.02, 6.80] |
| 10.3 Celecoxib 200 mg/day versus meloxicam 15 mg/day | 1 | 162 | Risk Ratio (M‐H, Random, 95% CI) | 0.59 [0.03, 10.01] |
| 10.4 Celecoxib 200 mg/day versus nabumetone 1000 mg/day | 1 | 150 | Risk Ratio (M‐H, Random, 95% CI) | 0.35 [0.02, 5.74] |
| 10.5 Celecoxib 400 mg/day | 3 | 1442 | Risk Ratio (M‐H, Random, 95% CI) | 0.74 [0.42, 1.30] |
Comparison 3. Celecoxib versus naproxen.
| Outcome or subgroup title | No. of studies | No. of participants | Statistical method | Effect size |
|---|---|---|---|---|
| 1 ACR20 | 1 | 700 | Risk Ratio (M‐H, Random, 95% CI) | 1.16 [0.94, 1.42] |
| 1.1 Celecoxib 200 mg/day | 1 | 352 | Risk Ratio (M‐H, Random, 95% CI) | 1.11 [0.83, 1.49] |
| 1.2 Celecoxib 400 mg/day | 1 | 348 | Risk Ratio (M‐H, Random, 95% CI) | 1.21 [0.91, 1.60] |
| 2 Pain (VAS) | 1 | 700 | Mean Difference (IV, Random, 95% CI) | ‐1.40 [‐4.36, 1.56] |
| 2.1 Celecoxib 200 mg/day | 1 | 352 | Mean Difference (IV, Random, 95% CI) | 0.0 [‐4.19, 4.19] |
| 2.2 Celecoxib 400 mg/day | 1 | 348 | Mean Difference (IV, Random, 95% CI) | ‐2.80 [‐6.99, 1.39] |
| 3 HAQ | 1 | 700 | Mean Difference (IV, Random, 95% CI) | 0.00 [‐0.19, 0.20] |
| 3.1 Celecoxib 200 mg/day | 1 | 352 | Mean Difference (IV, Random, 95% CI) | 0.1 [0.02, 0.18] |
| 3.2 Celecoxib 400 mg/day | 1 | 348 | Mean Difference (IV, Random, 95% CI) | ‐0.10 [‐0.20, ‐0.00] |
| 4 Incidence of gastroduodenal ulcers ≥ 3 mm | 2 | 546 | Risk Ratio (M‐H, Random, 95% CI) | 0.22 [0.14, 0.36] |
| 4.1 Celecoxib 200 mg/day | 1 | 216 | Risk Ratio (M‐H, Random, 95% CI) | 0.23 [0.11, 0.48] |
| 4.2 Celecoxib 400 mg/day | 2 | 330 | Risk Ratio (M‐H, Random, 95% CI) | 0.22 [0.11, 0.41] |
| 5 Short‐term serious adverse events | 1 | 700 | Peto Odds Ratio (Peto, Fixed, 95% CI) | 1.07 [0.33, 3.45] |
| 5.1 Celecoxib 200 mg/day | 1 | 352 | Peto Odds Ratio (Peto, Fixed, 95% CI) | 0.93 [0.17, 5.26] |
| 5.2 Celecoxib 400 mg/day | 1 | 348 | Peto Odds Ratio (Peto, Fixed, 95% CI) | 1.20 [0.24, 5.91] |
| 6 Total withdrawals (discontinuation rates) | 1 | 700 | Risk Ratio (M‐H, Random, 95% CI) | 0.89 [0.72, 1.09] |
| 6.1 Celecoxib 200 mg/day | 1 | 352 | Risk Ratio (M‐H, Random, 95% CI) | 0.91 [0.69, 1.21] |
| 6.2 Celecoxib 400 mg/day | 1 | 348 | Risk Ratio (M‐H, Random, 95% CI) | 0.86 [0.64, 1.16] |
| 7 Withdrawals due to adverse events | 1 | 700 | Peto Odds Ratio (Peto, Fixed, 95% CI) | 1.19 [0.61, 2.32] |
| 7.1 Celecoxib 200 mg/day | 1 | 352 | Peto Odds Ratio (Peto, Fixed, 95% CI) | 1.01 [0.38, 2.73] |
| 7.2 Celecoxib 400 mg/day | 1 | 348 | Peto Odds Ratio (Peto, Fixed, 95% CI) | 1.36 [0.55, 3.36] |
| 8 Withdrawals due to lack of efficacy | 1 | 700 | Risk Ratio (M‐H, Random, 95% CI) | 0.85 [0.66, 1.10] |
| 8.1 Celecoxib 200 mg/day | 1 | 352 | Risk Ratio (M‐H, Random, 95% CI) | 0.95 [0.67, 1.35] |
| 8.2 Celecoxib 400 mg/day | 1 | 348 | Risk Ratio (M‐H, Random, 95% CI) | 0.75 [0.51, 1.10] |
Comparison 4. Celecoxib versus diclofenac.
| Outcome or subgroup title | No. of studies | No. of participants | Statistical method | Effect size |
|---|---|---|---|---|
| 1 ACR20 | 2 | 835 | Risk Ratio (M‐H, Random, 95% CI) | 1.04 [0.89, 1.22] |
| 1.1 Celecoxib 200 mg/day | 1 | 180 | Risk Ratio (M‐H, Random, 95% CI) | 1.01 [0.84, 1.22] |
| 1.2 Celecoxib 400 mg/day | 1 | 655 | Risk Ratio (M‐H, Random, 95% CI) | 1.11 [0.84, 1.46] |
| 2 Pain (VAS) | 1 | 655 | Mean Difference (IV, Random, 95% CI) | ‐2.30 [‐6.18, 1.58] |
| 2.1 Celecoxib 400 mg/day | 1 | 655 | Mean Difference (IV, Random, 95% CI) | ‐2.30 [‐6.18, 1.58] |
| 3 MHAQ | 1 | 655 | Mean Difference (IV, Random, 95% CI) | 0.0 [‐0.11, 0.11] |
| 3.1 Celecoxib 400 mg/day | 1 | 655 | Mean Difference (IV, Random, 95% CI) | 0.0 [‐0.11, 0.11] |
| 4 Incidence of gastroduodenal ulcers ≥ 3 mm | 1 | 430 | Peto Odds Ratio (Peto, Fixed, 95% CI) | 0.27 [0.14, 0.51] |
| 4.1 Celecoxib 400 mg/day | 1 | 430 | Peto Odds Ratio (Peto, Fixed, 95% CI) | 0.27 [0.14, 0.51] |
| 5 Short‐term serious adverse events | 1 | 186 | Peto Odds Ratio (Peto, Fixed, 95% CI) | 0.35 [0.09, 1.34] |
| 5.1 Celecoxib 200 mg/day | 1 | 186 | Peto Odds Ratio (Peto, Fixed, 95% CI) | 0.35 [0.09, 1.34] |
| 6 Total withdrawals (discontinuation rates) | 2 | 841 | Risk Ratio (M‐H, Random, 95% CI) | 0.73 [0.56, 0.95] |
| 6.1 Celecoxib 200 mg/day | 1 | 186 | Risk Ratio (M‐H, Random, 95% CI) | 0.74 [0.29, 1.93] |
| 6.2 Celecoxib 400 mg/day | 1 | 655 | Risk Ratio (M‐H, Random, 95% CI) | 0.72 [0.55, 0.95] |
| 7 Withdrawals due to adverse events | 2 | 841 | Risk Ratio (M‐H, Random, 95% CI) | 0.53 [0.36, 0.78] |
| 7.1 Celecoxib 200 mg/day | 1 | 186 | Risk Ratio (M‐H, Random, 95% CI) | 0.40 [0.05, 3.22] |
| 7.2 Celecoxib 400 mg/day | 1 | 655 | Risk Ratio (M‐H, Random, 95% CI) | 0.54 [0.36, 0.79] |
| 8 Withdrawals due to lack of efficacy | 2 | 841 | Peto Odds Ratio (Peto, Fixed, 95% CI) | 0.98 [0.57, 1.70] |
| 8.1 Celecoxib 200 mg/day | 1 | 186 | Peto Odds Ratio (Peto, Fixed, 95% CI) | 0.23 [0.05, 1.08] |
| 8.2 Celecoxib 400 mg/day | 1 | 655 | Peto Odds Ratio (Peto, Fixed, 95% CI) | 1.21 [0.67, 2.17] |
Comparison 5. Celecoxib versus meloxicam.
| Outcome or subgroup title | No. of studies | No. of participants | Statistical method | Effect size |
|---|---|---|---|---|
| 1 ACR20 | 1 | 194 | Risk Ratio (M‐H, Random, 95% CI) | 1.04 [0.86, 1.25] |
| 1.1 Celecoxib 200 mg/day | 1 | 194 | Risk Ratio (M‐H, Random, 95% CI) | 1.04 [0.86, 1.25] |
| 2 Short‐term serious adverse events | 1 | 199 | Peto Odds Ratio (Peto, Fixed, 95% CI) | 0.46 [0.09, 2.21] |
| 2.1 Celecoxib 200 mg/day | 1 | 199 | Peto Odds Ratio (Peto, Fixed, 95% CI) | 0.46 [0.09, 2.21] |
| 3 Total withdrawals (discontinuation rates) | 1 | 199 | Risk Ratio (M‐H, Random, 95% CI) | 0.77 [0.30, 1.99] |
| 3.1 Celecoxib 200 mg/day | 1 | 199 | Risk Ratio (M‐H, Random, 95% CI) | 0.77 [0.30, 1.99] |
| 4 Withdrawals due to adverse events | 1 | 199 | Peto Odds Ratio (Peto, Fixed, 95% CI) | 0.42 [0.10, 1.88] |
| 4.1 Celecoxib 200 mg/day | 1 | 199 | Peto Odds Ratio (Peto, Fixed, 95% CI) | 0.42 [0.10, 1.88] |
| 5 Withdrawals due to lack of efficacy | 1 | 199 | Peto Odds Ratio (Peto, Fixed, 95% CI) | 0.24 [0.04, 1.48] |
| 5.1 Celecoxib 200 mg/day | 1 | 199 | Peto Odds Ratio (Peto, Fixed, 95% CI) | 0.24 [0.04, 1.48] |
Comparison 6. Celecoxib versus nabumetone.
| Outcome or subgroup title | No. of studies | No. of participants | Statistical method | Effect size |
|---|---|---|---|---|
| 1 ACR20 | 1 | 182 | Risk Ratio (M‐H, Random, 95% CI) | 1.08 [0.89, 1.30] |
| 1.1 Celecoxib 200 mg/day | 1 | 182 | Risk Ratio (M‐H, Random, 95% CI) | 1.08 [0.89, 1.30] |
| 2 Short term serious adverse events | 1 | 186 | Peto Odds Ratio (Peto, Fixed, 95% CI) | 0.47 [0.09, 2.44] |
| 2.1 Celecoxib 200 mg/day | 1 | 186 | Peto Odds Ratio (Peto, Fixed, 95% CI) | 0.47 [0.09, 2.44] |
| 3 Total withdrawals (discontinuation rates) | 1 | 186 | Risk Ratio (M‐H, Random, 95% CI) | 0.74 [0.29, 1.93] |
| 3.1 Celecoxib 200 mg/day | 1 | 186 | Risk Ratio (M‐H, Random, 95% CI) | 0.74 [0.29, 1.93] |
| 4 Withdrawals due to adverse events | 1 | 186 | Peto Odds Ratio (Peto, Fixed, 95% CI) | 0.63 [0.09, 4.36] |
| 4.1 Celecoxib 200 mg/day | 1 | 186 | Peto Odds Ratio (Peto, Fixed, 95% CI) | 0.63 [0.09, 4.36] |
| 5 Withdrawals due to lack of efficacy | 1 | 186 | Peto Odds Ratio (Peto, Fixed, 95% CI) | 0.23 [0.05, 0.98] |
| 5.1 Celecoxib 200 mg/day | 1 | 186 | Peto Odds Ratio (Peto, Fixed, 95% CI) | 0.23 [0.05, 0.98] |
Comparison 7. Celecoxib versus amtolmetin guacyl.
| Outcome or subgroup title | No. of studies | No. of participants | Statistical method | Effect size |
|---|---|---|---|---|
| 1 ACR20 | 1 | 180 | Risk Ratio (M‐H, Random, 95% CI) | 1.18 [0.87, 1.62] |
| 1.1 Celecoxib 400 mg/day | 1 | 180 | Risk Ratio (M‐H, Random, 95% CI) | 1.18 [0.87, 1.62] |
| 2 Incidence of gastroduodenal ulcers ≥ 3 mm | 1 | 180 | Peto Odds Ratio (Peto, Fixed, 95% CI) | 0.59 [0.10, 3.49] |
| 2.1 Celecoxib 400 mg/day | 1 | 180 | Peto Odds Ratio (Peto, Fixed, 95% CI) | 0.59 [0.10, 3.49] |
| 3 Short‐term serious adverse events | 1 | 180 | Peto Odds Ratio (Peto, Fixed, 95% CI) | 0.66 [0.15, 3.00] |
| 3.1 Celecoxib 400 mg/day | 1 | 180 | Peto Odds Ratio (Peto, Fixed, 95% CI) | 0.66 [0.15, 3.00] |
| 4 Total withdrawals (discontinuation rates) | 1 | 235 | Risk Ratio (M‐H, Random, 95% CI) | 0.64 [0.40, 1.04] |
| 4.1 Celecoxib 400 mg/day | 1 | 235 | Risk Ratio (M‐H, Random, 95% CI) | 0.64 [0.40, 1.04] |
| 5 Withdrawals due to adverse events | 1 | 235 | Peto Odds Ratio (Peto, Fixed, 95% CI) | 0.57 [0.17, 1.91] |
| 5.1 Celecoxib 400 mg/day | 1 | 235 | Peto Odds Ratio (Peto, Fixed, 95% CI) | 0.57 [0.17, 1.91] |
Comparison 8. Celecoxib versus pelubiprofen.
| Outcome or subgroup title | No. of studies | No. of participants | Statistical method | Effect size |
|---|---|---|---|---|
| 1 Pain (VAS) | 1 | 149 | Mean Difference (IV, Random, 95% CI) | ‐0.20 [‐7.58, 7.18] |
| 1.1 Celecoxib 400 mg/day | 1 | 149 | Mean Difference (IV, Random, 95% CI) | ‐0.20 [‐7.58, 7.18] |
| 2 HAQ | 1 | 149 | Mean Difference (IV, Random, 95% CI) | 0.0 [‐0.16, 0.16] |
| 2.1 Celecoxib 400 mg/day | 1 | 149 | Mean Difference (IV, Random, 95% CI) | 0.0 [‐0.16, 0.16] |
| 3 Cardiovascular events (myocardial infarction, stroke) | 1 | 149 | Peto Odds Ratio (Peto, Fixed, 95% CI) | 1.13 [0.07, 18.33] |
| 3.1 Celecoxib 400 mg/day | 1 | 149 | Peto Odds Ratio (Peto, Fixed, 95% CI) | 1.13 [0.07, 18.33] |
| 4 Short‐term serious adverse events | 1 | 149 | Peto Odds Ratio (Peto, Fixed, 95% CI) | 1.13 [0.07, 18.33] |
| 4.1 Celecoxib 400 mg/day | 1 | 149 | Peto Odds Ratio (Peto, Fixed, 95% CI) | 1.13 [0.07, 18.33] |
| 5 Total withdrawals (discontinuation rates) | 1 | 149 | Risk Ratio (M‐H, Random, 95% CI) | 0.52 [0.21, 1.30] |
| 5.1 Celecoxib 400 mg/day | 1 | 149 | Risk Ratio (M‐H, Random, 95% CI) | 0.52 [0.21, 1.30] |
| 6 Withdrawals due to adverse events | 1 | 149 | Peto Odds Ratio (Peto, Fixed, 95% CI) | 0.46 [0.10, 2.11] |
| 6.1 Celecoxib 400 mg/day | 1 | 149 | Peto Odds Ratio (Peto, Fixed, 95% CI) | 0.46 [0.10, 2.11] |
Comparison 9. Celecoxib versus ibuprofen.
| Outcome or subgroup title | No. of studies | No. of participants | Statistical method | Effect size |
|---|---|---|---|---|
| 1 Incidence of gastroduodenal ulcers ≥ 3 mm | 1 | 412 | Risk Ratio (M‐H, Random, 95% CI) | 0.14 [0.05, 0.39] |
| 1.1 Celecoxib 400 mg/day | 1 | 412 | Risk Ratio (M‐H, Random, 95% CI) | 0.14 [0.05, 0.39] |
| 2 Short‐term serious adverse events | 1 | 439 | Peto Odds Ratio (Peto, Fixed, 95% CI) | 0.49 [0.13, 1.84] |
| 2.1 Celecoxib 400 mg/day | 1 | 439 | Peto Odds Ratio (Peto, Fixed, 95% CI) | 0.49 [0.13, 1.84] |
| 3 Total withdrawals (discontinuation rates) | 1 | 439 | Risk Ratio (M‐H, Random, 95% CI) | 0.49 [0.34, 0.72] |
| 3.1 Celecoxib 400 mg/day | 1 | 439 | Risk Ratio (M‐H, Random, 95% CI) | 0.49 [0.34, 0.72] |
| 4 Withdrawals due to adverse events | 1 | 439 | Risk Ratio (M‐H, Random, 95% CI) | 0.65 [0.37, 1.14] |
| 4.1 Celecoxib 400 mg/day | 1 | 439 | Risk Ratio (M‐H, Random, 95% CI) | 0.65 [0.37, 1.14] |
| 5 Withdrawals due to lack of efficacy | 1 | 439 | Peto Odds Ratio (Peto, Fixed, 95% CI) | 0.34 [0.14, 0.83] |
| 5.1 Celecoxib 400 mg/day | 1 | 439 | Peto Odds Ratio (Peto, Fixed, 95% CI) | 0.34 [0.14, 0.83] |
Characteristics of studies
Characteristics of included studies [ordered by study ID]
Choi 2014.
| Methods | Study design: multicenter, randomized, double‐blind, double‐dummy, parallel‐group, phase III, non‐inferiority clinical trial Duration: 6 weeks Location: 14 medical centres in Korea Study dates: October 2010 to October 2011 |
|
| Participants | Randomized: 149 Completed: 130 Mean age in pelubiprofen group: 54.3 years Mean age in celecoxib group: 54.8 years % women in pelubiprofen group: 89.6 % women in celecoxib group: 91.2 |
|
| Interventions | Pelubiprofen group: pelubiprofen 90 mg daily (taken as 30 mg three times daily) oral administration and celecoxib placebo twice daily (N = 79) celecoxib group: 400 mg daily (taken as 200 mg Celebrex capsule twice daily) and pelubiprofen placebo tablet three times daily (N = 70) |
|
| Outcomes | Benefit outcomes: Primary: pain decrease from baseline to week 6 (100 mm pain on visual analogue scale ‐ VAS) Secondary:
Safety outcomes: clinical and laboratory adverse events (AEs), adverse drug reactions (ADRs) defined as AEs that were at least possibly related to study medications, serious AEs and ADRs |
|
| Funding | Daewon Pharm (Seoul, Korea) provided investigational medications for the study, and supported the conduct of the trial. “The funders played no role in the study design, data collection or analysis, decision to publish, or preparation of the manuscript” (p. 8) | |
| Declaration of interest | The authors declared no competing interests | |
| Notes | Compliance: 23 participants were protocol incompliant Study registration: the study was registered at ClinicalTrials.gov, identifier NCT01781702. Study status indicates that the study was completed, but no results were posted. Last checked May 26, 2017 |
|
| Risk of bias | ||
| Bias | Authors' judgement | Support for judgement |
| Random sequence generation (selection bias) | Low risk | Random allocation sequence generated using SAS v. 9.1 software (SAS Institute, Cary, NC) by an independent statistician and was stratified by center with a 1:1 allocation using random block sizes of 4 and 6 |
| Allocation concealment (selection bias) | Low risk | The allocation sequence was concealed from the researcher enrolling and assessing participants and who kept randomization envelopes |
| Blinding of participants and personnel (performance bias) All outcomes | Low risk | All treatment regimens were fully masked |
| Blinding of outcome assessment (detection bias) All outcomes | Low risk | Outcome assessors were blinded (information not present in the manuscript; obtained from the author via personal communication) |
| Incomplete outcome data (attrition bias) All outcomes | Unclear risk | Attrition in the pelubiprofen group was 16%, versus 8.5% in the celecoxib group. High attrition in one group and discrepancy in attrition rates between groups. For the efficacy profile analysis, per protocol (PP) populations were used for the main analysis and intent‐to‐treat (ITT) populations were used for supplementary analysis with the input of any missed observations according to the last observation‐carried‐forward method |
| Selective reporting (reporting bias) | Low risk | All outcomes specified in the methods were reported in results section |
| Other bias | Unclear risk | Rescue medication permitted: acetaminophen extended‐release 650 mg tablet. The total amount of rescue medication used was tracked using an accountability procedure (p. 3). However, results were not shown. Not indicated if participants had to stop taking acetaminophen before follow‐up visits. It is unclear whether co‐intervention might have affected study results |
Emery 1999.
| Methods | Study design: double‐blind, double‐dummy, randomized, parallel trial Duration: 24 weeks Location: 132 centres in Europe, Israel, South Africa, Australia and New Zealand Study dates: Not reported |
|
| Participants | Randomized: 655 Completed: 493 Mean age in celecoxib group: 55.9 years Mean age in diclofenac group: 54.5 years % women in celecoxib group: 76 % women in diclofenac group: 71 Inclusion criteria: Diagnosis of adult‐onset rheumatoid arthritis of at least 6 months’ duration, according to American Rheumatism Association criteria, a functional capacity classification of III or less and were anticipated to require continuous treatment with a non‐steroidal anti‐inflammatory drug (NSAID) for the duration of the trial |
|
| Interventions | Celecoxib 400 mg daily (taken as 200 mg twice daily) (N = 326) Diclofenac SR 150 mg daily (taken as 75 mg twice daily) (N = 329) |
|
| Outcomes | Benefit outcomes: Primary: physician’s and patient’s assessments of arthritis, number of tender or painful joints (68 joints), and number of swollen joints (66 joints). Secondary:
Safety outcomes: Single upper gastro‐intestinal endoscopic assessment at week 24, at time of withdrawal, or no more than 7 days after the last dose of study drug |
|
| Funding | Not described | |
| Declaration of interest | Not declared | |
| Notes | Compliance: Participants were withdrawn from the study for protocol violation or non‐compliance, adverse sign or symptom, or if they were lost to follow‐up Study registration: not described |
|
| Risk of bias | ||
| Bias | Authors' judgement | Support for judgement |
| Random sequence generation (selection bias) | Low risk | Centralized random numbers (information not present in the manuscript; obtained from the author via personal communication) |
| Allocation concealment (selection bias) | Low risk | The allocation sequence was concealed from the researcher enrolling and assessing participants and who kept randomization envelopes |
| Blinding of participants and personnel (performance bias) All outcomes | Low risk | This study was a double‐blind, double‐dummy, randomized, parallel trial. The drugs were identical in appearance |
| Blinding of outcome assessment (detection bias) All outcomes | Low risk | Data on any potential upper‐gastrointestinal ulcer complications (perforation, bleeding, or gastric‐outlet obstruction) were assessed by an external committee of independent gastroenterologists who were unaware of treatment status, according to pre‐established criteria |
| Incomplete outcome data (attrition bias) All outcomes | Unclear risk | Attrition was 20% in the celecoxib group and 28% in diclofenac group. The analyses were completed on the intention‐to‐treat population with the last observation carried forward (p. 2017) |
| Selective reporting (reporting bias) | Low risk | All outcomes specified in the methods are reported in results section |
| Other bias | Low risk | None identified |
Goldstein 2001.
| Methods | Study design: double‐blind, parallel‐group, multicenter study Duration: 12 weeks Location: 75 sites in USA Study dates: Not described |
|
| Participants | Randomized: 537 (536) Mean age in celecoxib group: 56.7 years Mean age in naproxen group: 57.7 years % women in celecoxib group: 67 % women in naproxen group: 67 Inclusion criteria: Active osteoarthritis or rheumatoid arthritis for at least 3 months and required chronic therapy with non‐steroidal anti‐inflammatory drugs (NSAIDs). All participants were to have a Functional Capacity Classification of I to III at baseline |
|
| Interventions | celecoxib 400 mg daily (taken as 200 mg twice daily) (N = 269) naproxen 1000 mg daily (taken as 500 mg twice daily) (N = 267) |
|
| Outcomes | Benefit outcomes: Primary:
Secondary: incidence of withdrawal resulting from lack of efficacy Safety outcome: Ulcer incidence and ulcer/erosion incidence |
|
| Funding | GD Searle & Co and Pfizer Inc | |
| Declaration of interest | Not declared. | |
| Notes | Compliance: not described Study registration: not described |
|
| Risk of bias | ||
| Bias | Authors' judgement | Support for judgement |
| Random sequence generation (selection bias) | Low risk | Participants were randomly assigned to treatment in the order in which they were enrolled at each site, according to a computer‐generated randomization schedule (information not present in the manuscript; obtained from the author via personal communication) |
| Allocation concealment (selection bias) | Low risk | Double‐blind. Bottles with medicine (information not present in the manuscript; obtained from the author via personal communication) |
| Blinding of participants and personnel (performance bias) All outcomes | Low risk | Double‐blind, parallel‐group, multicenter study |
| Blinding of outcome assessment (detection bias) All outcomes | Low risk | Assessment by endoscopists who were blinded to outcomes (information not present in the manuscript; obtained from the author via personal communication) |
| Incomplete outcome data (attrition bias) All outcomes | High risk | Attrition: 22% in celecoxib group and 44% in naproxen group. All randomized participants who took one dose of study medication were included in the analyses (intent‐to‐treat cohort) (p. 1201). Specific method for imputing missing data was not described |
| Selective reporting (reporting bias) | Low risk | All outcomes specified in the methods are reported in results section |
| Other bias | Unclear risk | Acetaminophen could be used throughout the study; oral corticosteroids were allowed only if there was no change in the dosing regimen during the study (p. 1201). It is not indicated whether participants had to discontinue using these medications before follow‐up visits, and use of rescue medications was not measured. It is unclear whether co‐intervention might have affected study result |
Jajic 2005.
| Methods | Study design: randomized, parallel group, double‐blind, double dummy, multi centre trial Duration: 24 weeks (2 phases: a single‐blind placebo run‐in period of one week and a double blind active treatment period of 24 weeks) Location: Croatia, Belgium, Germany, Czech Republic, Hungary Study dates: Not described |
|
| Participants | Randomized: 235 Completed: 180 Mean age in amtolmetin guacyl (AMG) group: 57.2 years Mean age in celecoxib group: 55.3 years % women in AMG group: 78.8 % women in celecoxib: 77.9 Inclusion criteria: Outpatients of either sex aged over 18 years; ACR criteria for clinical diagnosis of rheumatoid arthritis in acute phase with Functional Capacity Classification I‐III |
|
| Interventions | AMG 1200 mg daily (taken as 600 mg twice a day) (N = 118) Celecoxib 400 mg daily (taken as 200 mg twice a day) (N = 117) |
|
| Outcomes | Benefit outcomes: The primary outcome measure was American College of Rheumatology 20% improvement criteria (ACR20 Responder Index) Safety outcomes:
|
|
| Funding | Not declared. In the manuscript it is indicated that the AMG tablets were "kindly provided by Medosan Ricerca, Rome, Italy" | |
| Declaration of interest | Not declared. | |
| Notes | Compliance: 3.0% participants in AMG group and 0 in the celecoxib group were excluded because lack of compliance or poor compliance. Study registration: not described |
|
| Risk of bias | ||
| Bias | Authors' judgement | Support for judgement |
| Random sequence generation (selection bias) | Low risk | A computer‐generated randomization list was used by the coordinating centre |
| Allocation concealment (selection bias) | Unclear risk | Not described |
| Blinding of participants and personnel (performance bias) All outcomes | Unclear risk | Not described |
| Blinding of outcome assessment (detection bias) All outcomes | Unclear risk | Not described |
| Incomplete outcome data (attrition bias) All outcomes | High risk | "Since the number of patients lost during the study was less than that expected, the sample size was recalculated and the trial was stopped after the randomization of 235 patients (118 to the AMG group and 117 to the celecoxib group)“. However, data for this original attrition are not reported. Results are reported for 85 participants in AMG group and 95 in the celecoxib group, indicating very high attrition of 28% and 19%, respectively. Statistical analysis was performed on the Per Protocol (PP) cohort, defined as all treated participants that had completed the study. When the GI safety data were considered, also the Intent‐to‐Treat (ITT) analysis was done, i.e. all randomized participants who received at least one dose of study medication were taken into account. For this kind of analysis, the LOCF (Last Observation Carried Forward) method was applied in the presence of missing or not available observations". (p. 812) |
| Selective reporting (reporting bias) | Low risk | All outcomes specified in the methods are also reported in the result section |
| Other bias | Low risk | None identified |
Kivitz 2004.
| Methods | Study design: randomized, double‐blind, double‐dummy, parallel‐group, international, multicenter study Duration: 13 weeks Location: Argentina, Canada, Chile, Ireland, Mexico, Peru, Russia, South Africa, UK, USA Study dates: No report |
|
| Participants | Randomized: 893 Completed: 691 Average age in lumiracoxib 400 mg group: 52.4 ± 11.83 years Average age in lumiracoxib 800 mg group: 50.6 ± 11.63 years Average age in ibuprofen group: 52.2 ± 11.62 years Average age in celecoxib group: 51.7 ± 10.90 years % women in lumiracoxib 400 mg group: 78 % women in lumiracoxib 800 mg group: 81 % women in ibuprofen group: 80 % women in celecoxib group: 78 |
|
| Interventions | lumiracoxib 400 mg daily (taken once daily) (N = 227) lumiracoxib 800 mg daily (taken once daily) (N = 227) ibuprofen 2400 mg daily (taken as 800 mg three times daily) (N = 216) celecoxib 400 mg daily (taken as 200 mg twice daily) (N = 223) |
|
| Outcomes | Benefit outcomes: None Safety outcomes:
|
|
| Funding | Novartis Pharma AG, Basel, Switzerland | |
| Declaration of interest | Not declared. | |
| Notes | Compliance: Not described Study registration: not described |
|
| Risk of bias | ||
| Bias | Authors' judgement | Support for judgement |
| Random sequence generation (selection bias) | Unclear risk | Method for random sequence generation not described |
| Allocation concealment (selection bias) | Unclear risk | Not described |
| Blinding of participants and personnel (performance bias) All outcomes | Unclear risk | Double‐blinded study; double‐dummy |
| Blinding of outcome assessment (detection bias) All outcomes | Unclear risk | Not described |
| Incomplete outcome data (attrition bias) All outcomes | High risk | High attrition rates ranging from 14.8% in the celecoxib group to 30.1% in the ibuprofen group. Method for imputing missing data not described |
| Selective reporting (reporting bias) | Unclear risk | For some outcomes specified in methods specific results were not given, only a note that there was no difference in efficacy |
| Other bias | Unclear risk | Participants were allowed to take analgesic rescue paracetamol (up to 2 g daily) and antacid rescue medication [e.g. Rennie (calcium carbonate; F. Hoffmann‐La Roche Ltd, Basel, Switzerland) tablets up to a maximum of eight per day] (p. 1191). It is not indicated whether participants had to discontinue using these medications before follow‐up visits, and use of rescue medications was not measured. It is unclear whether co‐intervention might have affected study result |
Shi 2004.
| Methods | Study design: randomized, prospective clinical trial Duration: 6 months Location: Shanghai (China) Study dates: May 2002 to September 2002. The last participant completed treatment March 2003 |
|
| Participants | Randomized: 461 Completed: 407 Average age in diclofenac group: 45.6 ± 14.6 years Average age in nabumetone group: 51.6 ± 12.7 years Average age in meloxicam group: 51.7 ± 14.9 years Average age in celecoxib group: 52.6 ± 14.4 years % women in diclofenac group: 66.4 % women in meloxicam group: 65.9 % women in nabumetone group: 72.5 % women in celecoxib group: 65.4 |
|
| Interventions | diclofenac 75 mg to 100 mg daily (N = 131) meloxicam 15 mg daily (N = 144) nabumetone 1000 mg daily (N = 131) celecoxib 200 mg daily (N = 55) |
|
| Outcomes | Benefit outcomes: Primary:
Secondary:
Safety outcomes:
|
|
| Funding | Drugs used in the study were all paid for by the participants themselves. This survey was supported in part by a grant (BK‐PJ‐0301) from the State Food and Drug Administration of China |
|
| Declaration of interest | The authors declared that they have no competing interests | |
| Notes | Compliance: When withdrawals caused by high costs were not considered, compliance rate for celecoxib was significantly better than that for the other drugs (P < 0.05). The other three groups did not exhibit significant differences in compliance. Study registration: not described |
|
| Risk of bias | ||
| Bias | Authors' judgement | Support for judgement |
| Random sequence generation (selection bias) | Low risk | Computer program generated the randomization sequence |
| Allocation concealment (selection bias) | Unclear risk | Not described |
| Blinding of participants and personnel (performance bias) All outcomes | Unclear risk | Not described |
| Blinding of outcome assessment (detection bias) All outcomes | Unclear risk | Not described |
| Incomplete outcome data (attrition bias) All outcomes | Low risk | Attrition was low and similar in all the study groups. Sixteen participants (12.2%) withdrew from the diclofenac group, 16 (12.2%) from the nabumetone group, 17 (11.8%) from the meloxicam group and five (9.1%) from the celecoxib group. Method for imputing missing data not described |
| Selective reporting (reporting bias) | Low risk | All outcomes reported in the methods are also reported in the result section |
| Other bias | Unclear risk | Each participant received a concomitant therapy of methotrexate 10 mg/week and a 5 mg daily folic acid tablet. Focal intra‐articular injections (maximum twice) and focal physical therapy (such as microwave therapy) were also allowed if necessary. It is not indicated whether participants had to discontinue using these medications before follow‐up visits, and impact of additional interventions was not measured. It is unclear whether co‐interventions might have affected study result |
Simon 1998.
| Methods | Study design: randomized, double‐blind study Duration: 4 week Location: Not described Study dates: Not described |
|
| Participants | Randomized: 330 Completed: 293 Mean age in celecoxib 80 group: 55.6 years Mean age in celecoxib 400 group: 55.5years Mean age in celecoxib 800 group: 56.7 years Mean age in placebo group: 56.5 years % women in celecoxib 80 group: 66.6 % women in celecoxib 400 group: 95.1 % women in celecoxib 800 group:79.3 % women in placebo group: 75.3 Inclusion criteria: rheumatoid arthritis in a flare state (defined below), with a Steinbrocker functional capacity classification of 1‐111 |
|
| Interventions | celecoxib 80 mg daily (taken as 40 mg twice daily) (N = 81) celecoxib 400 mg daily (taken as 200 mg twice daily) (N = 82) celecoxib 800 mg daily (taken as 400 mg twice daily) (N = 82) placebo twice daily (N = 85) |
|
| Outcomes | Benefit outcomes: ‐arthritis pain on 100‐mm Visual Analog Scale (VAS) ‐assessment of joint swelling ‐assessment of joint tenderness/pain ‐duration of morning stiffness, ‐functional capacity classification ‐C‐reactive protein level ‐composite assessment of improvement using American College of Rheumatology (ACR) criteria Safety outcomes: None |
|
| Funding | Supported by G. D. Searle & Co | |
| Declaration of interest | Not declared | |
| Notes | Compliance: not described Study registration: not described |
|
| Risk of bias | ||
| Bias | Authors' judgement | Support for judgement |
| Random sequence generation (selection bias) | Low risk | Random numbers generated (information not present in the manuscript; obtained from the author via personal communication) |
| Allocation concealment (selection bias) | Low risk | Allocation adequately concealed (information not present in the manuscript; obtained from the author via personal communication) |
| Blinding of participants and personnel (performance bias) All outcomes | Low risk | Double‐blind study |
| Blinding of outcome assessment (detection bias) All outcomes | Low risk | Probably yes |
| Incomplete outcome data (attrition bias) All outcomes | Unclear risk | Attrition was 18% in the placebo group, 17% in the SC‐5863540 mg group, 4% in the SC‐58635200 mg group, and 6% in the SC‐58635 400 mg group. Method for imputing missing data not described |
| Selective reporting (reporting bias) | Low risk | All outcomes specified in the methods are reported in results section |
| Other bias | Low risk | None identified |
Simon 1999.
| Methods | Study design: Randomized, multicenter, placebo‐controlled, double blind Duration: 12 weeks Location: 79 USA and Canada Study dates: September 1996 – February 1998 |
|
| Participants | Randomized: 1149 Completed: 688 Mean age in celecoxib 200 group: 54 years Mean age in celecoxib 400 group: 55 ears Mean age in celecoxib 800 group: 54 years Mean age in naproxen 1000 group: 55 years Mean age in placebo group: 54 years % women in celecoxib 200 group: 74 % women in celecoxib 400 group: 73 % women in celecoxib 800 group: 72 % women in naproxen 1000 group: 72 % women in placebo group: 73 Inclusion criteria: aged ≥ 18 years, fulfilled ACR20 criteria for a diagnosis of rheumatoid arthritis evident for 3 months or longer, and were in a functional class of I, II or III. And if the dosage of glucocorticoids, disease‐modifying antirheumatic drugs, or methotrexate had been stable and were expected to remain constant throughout study |
|
| Interventions | celecoxib 200 mg daily (taken as 100 mg twice daily) (N = 240) celecoxib 400 mg daily (taken as 200 mg twice daily) (N = 235) celecoxib 800 mg daily (taken as 400 mg twice daily) (N = 218) naproxen 1000 mg daily (taken as 500 twice daily) (N = 225) placebo twice daily (N = 231) |
|
| Outcomes | Benefit outcomes: ‐VAS 100 ‐Patients Global Assesment ‐Physician's Global Assesment ‐Functional Disability index ‐ Health Assessment Questionnaire (HAQ) ‐ plasma levels of C reactive protein ‐complete count of tender/painful joints ‐American College of Rheumatology 20% improvement criteria (ACR 20) Safety outcomes: ‐incidence of the most frequently reported adverse events (headache, dyspepsia, upper respiratory tract infection, diarrhoea, abdominal pain, gastrointestinal tract adverse events and renal adverse events) ‐gastroduodenal ulcer incidences |
|
| Funding | This study was supported by G. D. Searle & Co, Skokie | |
| Declaration of interest | Multiple authors disclosed financial ties with pharmaceutical industry | |
| Notes | Compliance: not described Study registration: not described |
|
| Risk of bias | ||
| Bias | Authors' judgement | Support for judgement |
| Random sequence generation (selection bias) | Low risk | Participants were assigned by a computer‐generated randomization schedule |
| Allocation concealment (selection bias) | Low risk | Allocation adequately concealed (information not present in the manuscript; obtained from the author via personal communication) |
| Blinding of participants and personnel (performance bias) All outcomes | Low risk | Randomized, multicenter, placebo‐controlled, double blind |
| Blinding of outcome assessment (detection bias) All outcomes | Low risk | Probably yes |
| Incomplete outcome data (attrition bias) All outcomes | High risk | High attrition was observed in all study arms: Placebo: 56.27%, Celecoxib 100 mg: 35.83 %, Celecoxib 200 mg: 32.76 %, Celecoxib 400 mg: 37.15 %, Naproxen 500 mg: 38.66 %. Efficacy analyses were based on an intention‐to treat cohort, defined as all participants who took at least 1 dose of study medication. In all efficacy measures missing values were imputed using last observation carried forward (p. 1924). |
| Selective reporting (reporting bias) | Low risk | All outcomes specified in the methods were reported in results section |
| Other bias | Unclear risk | Stable doses of aspirin no more than 325 mg daily were allowed. Acetaminophen up to 2 g daily for no longer than 3 consecutive days was also allowed except within 48 hours prior to arthritis assessment. Stable doses of oral glucocorticoids (up to 10 mg of prednisone per day) or disease‐modifying antirheumatic drugs (DMARDS) were allowed. It is unclear whether co‐intervention might have affected study result |
List of abbreviations used in tables: ACR ‐ American College of Rheumatology, ADR ‐ Adverse Drug Reaction, AE ‐ Adverse Event, AMG ‐ Amtolmetin Guacyl, CER ‐ Clinical Efficacy Rate, DMARDS ‐ disease‐modifying antirheumatic drugs, ER ‐ Extended Release, ECG ‐ Electrocardiography, HAQ ‐Health Assessment Questionnaire, ITT ‐ Intent‐to‐Treat, KHAQ ‐ Korean health assessment questionnaire, LOCF ‐ Last Observation Carried Forward, N/A ‐ Non Aplicable, NSAID ‐ Non Steroidal Anti‐inflamatory Drug, OA ‐ Osteoarthritis, OER ‐ Overall effectiveness rate, PP ‐ Per Protocol, RA ‐ Rheumatoid Arthritis, UK ‐ United Kingdom, USA ‐ United States of America, VAS ‐ Visual Analog Scale
Characteristics of excluded studies [ordered by study ID]
| Study | Reason for exclusion |
|---|---|
| Chan 2002 | Did not report separate data for rheumatoid arthritis |
| Chan 2004 | Did not report separate data for rheumatoid arthritis |
| Chan 2007 | Did not report separate data for rheumatoid arthritis |
| Chan 2010 | Did not report separate data for rheumatoid arthritis |
| Chan 2015 | Did not report separate data for rheumatoid arthritis |
| Cheatum 1999 | Not RCT |
| Cheung 2010 | Did not report separate data for rheumatoid arthritis |
| Goldstein 2002 | Did not report separate data for rheumatoid arthritis |
| Hegazy 2011 | Did not report separate data for rheumatoid arthritis |
| Kellner 2012 | Did not report separate data for rheumatoid arthritis |
| Kellner 2013 | Did not report separate data for rheumatoid arthritis |
| Laine 2002 | Celecoxib was not among the studied NSAIDs |
| Laine 2007 | Celecoxib was not among the studied NSAIDs |
| Liu 2015 | Combination treatment of NSAID drugs. No separate data shown for celecoxib. Comparators were not relevant to this review |
| Nissen 2016 | Did not report separate data for rheumatoid arthritis |
| Silverstein 2000 | Did not report separate data for rheumatoid arthritis |
| Song 2007 | Comparator to celecoxib was neither placebo nor another NSAID |
| Zayat 2011 | Number of included participants not eligible for inclusion; total number of participants in the study was 58 ‐ inclusion criterion for this systematic review was 50 participants in each arm |
Differences between protocol and review
The first version of systematic review on this topic was published in The Cochrane library in 2002 (Garner 2002).
This systematic review was done according to the completely new protocol published in The Cochrane library in 2016 (Fidahic 2016). Compared to the methods used in the first version of the protocol, we changed outcomes, and databases that were searched. The outcomes were previously categorized as efficacy outcomes and safety outcomes, now as primary and secondary outcomes. In the first version of the review, the following efficacy outcomes were used: number of tender joints per patient, number of swollen joints per patient, pain, physician global assessment, patient global assessment, functional status, acute phase reactants and radiological damage. The following safety outcomes were used: total withdrawals, withdrawals due to total adverse events (AEs), withdrawals due to gastro‐intestinal AEs (GI AEs), withdrawals due to lack of efficacy, total AEs associated with therapy, number of patients with cardiovascular event(s), number of patients presenting clinically with perforations and/or ulcer and/or bleed (PUBs), number of patients with erosions or ulcers detected by endoscopy, deaths. In the first version of the review, the following was searched: MEDLINE, EMBASE, Cochrane Database of Systematic Reviews, Cochrane Controlled Trials Register, National Research Register, NHS Economic Evaluation Database, Health Technology Assessment Database, bibliographies of retrieved papers and content experts were consulted for additional references (Garner 2002).
In this version of the review, the following change was made compared to the 2016 protocol: one study (Emery 1999) provided data for primary outcome HAQ in form of MHAQ (Modified Health Assessment Questionnaire), and therefore MHAQ was included as a new outcome.
For the updated search in this review we simplified the original search which was used in the previous version of this review and indicated in the protocol for this version of the review.
Contributions of authors
MF, AJK, MR and LP screened the bibliographic records. MF and AJK extracted data. LP was involved in discussions and decision‐making in case of disagreements. MF entered data into RevMan. AJK and LP checked that all data were entered correctly. MF wrote the first version of the main text with the help of LP. All authors contributed to the final version of the systematic review. All authors approved final version of the systematic review.
Sources of support
Internal sources
-
University of Split School of Medicine, Croatia.
Logistic support for Mahir Fidahic, Antonia Jelicic Kadic, Mislav Radic, Livia Puljak
External sources
No sources of support supplied
Declarations of interest
Mahir Fidahic: no conflict of interest. Antonia Jelicic Kadic: no conflict of interest. Mislav Radic: no conflict of interest. Livia Puljak: no conflict of interest.
New
References
References to studies included in this review
Choi 2014 {published data only}
- Choi IA, Baek CS, Lee YA, Chung WT, Park YE, Lee YJ, et al. Comparison of the efficacy and safety profiles of a pelubiprofen versus celecoxib in patients with rheumatoid arthritis: a 6‐week, multicenter, randomised, double‐blind, phase III, non‐inferiority clinical trial. BMC Musculosceletal Disorders 2014;15(357):1‐9. [DOI] [PMC free article] [PubMed] [Google Scholar]
Emery 1999 {published data only}
- Emery P, Zeider H, Kvien TK, Guslandi M, Naudin R, Stead H, et al. Celecoxib versus diclofenac in long‐term management of rheumatoid arthritis: randomised double‐blind comparison. Lancet 1999;354(9196):2106‐11. [DOI] [PubMed] [Google Scholar]
Goldstein 2001 {published data only}
- Goldstein JL, Correa P, Zhao WW, Burr AM, Hubbard RC, Verburg KM, et al. Reduced incidence of gastroduodenal ulcers with celecoxib, a novel cyclooxygenase‐2 inhibitor, compared to naproxen in patients with arthritis. American Journal of Gastroenterology 2001;96(4):1019‐27. [DOI] [PubMed] [Google Scholar]
Jajic 2005 {published data only}
- Jajić Z, Malaise M, Nekam K, Koó E, Dankó K, Kovacs M, et al. Gastrointestinal safety of amtolmetin guacyl in comparison with celecoxib in patients with rheumatoid arthritis. Clinical and Experimental Rheumatology 2005;23(6):809‐818. [PubMed] [Google Scholar]
Kivitz 2004 {published data only}
- Kivitz AJ, Nayiager S, Schimansky T, Gimona A, Thurston HJ, Hawkey C. Reduced incidence of gastroduodenal ulcers associated with lumiracoxib compared with ibuprofen in patients with rheumatoid arthritis. Alimentary Pharmacology and Therapeutics 2004;19(11):1189‐98. [DOI] [PubMed] [Google Scholar]
Shi 2004 {published data only}
- Shi W, Wang YM, Li LS, Yan M, Li D, Chen NN, et al. Safety and efficacy of oral nonsteroidal anti‐inflammatory drugs in patients with rheumatoid arthritis. Clinical Drug Investigation 2004;2(24):89‐101. [DOI] [PubMed] [Google Scholar]
Simon 1998 {published data only}
- Simon LS, Lanza FL, Lipsky PE, Hubbard RC, Talwalker S, Schwartz BD, et al. Preliminary study of the safety and efficacy of SC‐58635, a novel cyclooxygenase 2 inhibitor: efficacy and safety in two placebo‐controlled trials in osteoarthritis and rheumatoid arthritis, and studies of gastrointestinal and platelet effects. Arthritis and Rheumatism 1998;41(9):1591‐602. [DOI] [PubMed] [Google Scholar]
Simon 1999 {published data only}
- Simon LS, Weaver AL, Graham DY, Kivitz AJ, Lipsky PE, Hubbart RC, et al. Anti‐inflammatory and upper gastrointestinal effects of celecoxib in rheumatoid arthritis. JAMA 1999;282(20):1921‐8. [DOI] [PubMed] [Google Scholar]
- Zhao SZ, Fiechtner JI, Tindall EA, Dedhiya SD, Zhao WW, Osterhaus JT, et al. Evaluation of health‐related quality of life of rheumatoid arthritis patients treated with celecoxib. Arthritis Care and Research 2000;12(2):112‐21. [DOI] [PubMed] [Google Scholar]
References to studies excluded from this review
Chan 2002 {published data only}
- Chan FKL, Hung LCT, Suen BY, Wu JCY, Lee KC, Leung VKS, et al. Celecoxib versus diclofenac and omeprazole in reducing the risk of recurrent ulcer bleeding in patients with arthritis. New England Journal of Medicine 2002;347(26):2104‐10. [DOI] [PubMed] [Google Scholar]
Chan 2004 {published data only}
- Chan FKL, Hung LCT, Suen BY, Wong VWS, Hui AJ, Wu JCY, et al. Celecoxib versus diclofenac plus omeprazole in high‐risk arthritis patients: results of a randomized double‐blind trial. Gastroenterology 2004;127(4):1038‐43. [DOI] [PubMed] [Google Scholar]
Chan 2007 {published data only}
- Chan FKL, Wong VWS, Suen BY, Wu JCY, Ching JYL, Hung LCT, et al. Combination of a cyclo‐oxygenase‐2 inhibitor and a proton‐pump inhibitor for prevention of recurrent ulcer bleeding in patients at very high risk: a double‐blind, randomised trial. Lancet 2007;369(9573):1621‐6. [DOI] [PubMed] [Google Scholar]
Chan 2010 {published data only}
- Chan FKL, Lanas A, Scheiman J, Berger MF, Nguyen H, Goldstein JL. Celecoxib versus omeprazole and diclofenac in patients with osteoarthritis and rheumatoid arthritis (CONDOR):a randomised trial. Lancet 2010;376(9736):173‐9. [DOI] [PubMed] [Google Scholar]
Chan 2015 {published data only}
- Chan FKL, Ching J, Cheung C, Lam LYK, Au KWL, Ng SC, et al. Prevention of recurrent ulcer bleeding in arthritis patients with high cardiovascular and high gastrointestinal risks: an 18‐month, double‐blind, randomized trial. Gastroenterology 2015;148:157‐158. [Google Scholar]
Cheatum 1999 {published data only}
- Cheatum DE, Arvanitakis C, Gumpel M, Stead H, Geis GS. An endoscopic study of gastroduodenal lesions induced by nonsteroidal anti‐inflammatory drugs. Clinical Therapeutics 1999;21(6):992‐1003. [DOI] [PubMed] [Google Scholar]
Cheung 2010 {published data only}
- Cheung R, Cheng TT, Dong Y, Lin HY, Lai K, Lau C, et al. Incidence of gastroduodenal ulcers during treatment with celecoxib or diclofenac: pooled results from three 12‐week trials in Chinese patients with osteoarthritis or rheumatoid arthritis. International Journal of Rheumatic Diseases 2010;13(2):151‐7. [DOI] [PubMed] [Google Scholar]
Goldstein 2002 {published data only}
- Goldstein JL, Eisen GM, Burke TA, Pena BM, Lefkowith J, Geis GS. Dyspepsia tolerability from the patients’ perspective: a comparison of celecoxib with diclofenac. Alimentary Pharmacology and Therapeutics 2002;16(4):819‐27. [DOI] [PubMed] [Google Scholar]
Hegazy 2011 {published data only}
- Hegazy R, Alashhab M, Amin M. Cardiorenal effects of newer NSAIDs (celecoxib) versus classic NSAIDs (ibuprofen) in patients with arthritis. Journal of Toxicology 2011; Vol. 2011, issue 862153. [DOI: 10.1155/2011/862153] [DOI] [PMC free article] [PubMed]
Kellner 2012 {published data only}
- Kellner HL, Li C, Essex MN. Efficacy and safety of celecoxib versus diclofenac and omeprazole in elderly arthritis patients: a subgroup analysis of the CONDOR trial. Current Medical Research and Opinion 2012;28(9):1537‐45. [DOI] [PubMed] [Google Scholar]
Kellner 2013 {published data only}
- Kellner HL, Li C, Essex MN. Celecoxib and diclofenac plus omeprazole are similarly effective in the treatment of arthritis in patients at high GI risk in the CONDOR trial. Open Rheumatology Journal 2013;7:96‐100. [DOI] [PMC free article] [PubMed] [Google Scholar]
Laine 2002 {published data only}
- Laine L, Bombardier C, Hawkey CJ, Davis B, Shapiro D, Brett C, et al. Stratifying the risk of NSAID‐related upper gastrointestinal clinical events: results of a double‐blind outcomes study in patients with rheumatoid arthritis. Gastroenterology 2002;123(4):1006‐12. [DOI] [PubMed] [Google Scholar]
Laine 2007 {published data only}
- Laine L, Curtis SP, Cryer B, Kaur A, Cannon CP. Assessment of upper gastrointestinal safety of etoricoxib and diclofenac in patients with osteoarthritis and rheumatoid arthritis in the Multinational Etoricoxib and Diclofenac Arthritis Long‐term (MEDAL) programme: a randomised comparison. Lancet 2007;369(9560):465‐73. [DOI] [PubMed] [Google Scholar]
Liu 2015 {published data only}
- Liu D, Guo M, Hu Y, Liu T, Yan J, Luo Y, et al. Effect of Sanhuangwuji powder, anti‐rheumatic drugs, and ginger‐partitioned acupoint stimulation on the treatment of rheumatoid arthritis with peptic ulcer: a randomized controlled study. Journal of Traditional Chinese Medicine 2015;35(3):273‐80. [DOI] [PubMed] [Google Scholar]
Nissen 2016 {unpublished data only}
- Nissen SE, Yeomans ND, Solomon DH, Lüscher TF, Libby P, Husni ME, et al. PRECISION Trial Investigators. Cardiovascular safety of celecoxib, naproxen, or ibuprofen for arthritis. New England Journal of Medicine 2016;375(26):2519‐29. [DOI] [PubMed] [Google Scholar]
Silverstein 2000 {published data only}
- Silverstein FE, Faich G, Goldstein JL, Simon LS, Pincus T, Whelton A, et al. Gastrointestinal toxicity with celecoxib vs nonsteroidal anti‐inflammatory drugs for osteoarthritis and rheumatoid arthritis the CLASS study: a randomized controlled trial. JAMA 2000;284(10):1247‐55. [DOI] [PubMed] [Google Scholar]
Song 2007 {published data only}
- Song YW, Lee EY, Koh EM, Cha HS, Yoo B, Lee CK, et al. Assessment of comparative pain relief and tolerability of SK1306X compared with celecoxib in patients with rheumatoid arthritis: a 6‐week, multicenter, randomized, double‐blind, double‐dummy, phase lll, noninferiority clinical trial. Clinical Therapeutics 2007;29(5):862‐73. [DOI] [PubMed] [Google Scholar]
Zayat 2011 {published data only}
- Zayat AS, Conaghan PG, Sharif M, Freeston JE, Wenham C, Hensor EMA, et al. Do non‐steroidal anti‐inflammatory drugs have a significant effect on detection and grading of ultrasound‐detected synovitis in patients with rheumatoid arthritis? Results from a randomised study. Annals of the Rheumatic Diseases 2011;70(10):1746‐51. [DOI] [PubMed] [Google Scholar]
Additional references
Akl 2011
- Akl EA, Oxman AD, Herrin J, Vist GE, Terrenato I, Sperati F, et al. Using alternative statistical formats for presenting risks and risk reductions. Cochrane Database of Systematic Reviews 2011, Issue 3. [DOI: 10.1002/14651858.CD006776.pub2] [DOI] [PMC free article] [PubMed] [Google Scholar]
Aletaha 2005
- Aletaha D, Ward MM, Machold KP, Nell VP, Stamm T, Smolen JS. Remission and active disease in rheumatoid arthritis: defining criteria for disease activity states. Arthritis and Rheumatism 2005;52(9):2625‐36. [DOI] [PubMed] [Google Scholar]
Aletaha 2010
- Aletaha D, Neogi T, Silman AJ, Funovits J, Felson DT, Bingham CO 3rd, et al. 2010 rheumatoid arthritis classification criteria: an American College of Rheumatology/European League Against Rheumatism collaborative initiative. Arthritis and Rheumatism 2010;62(9):2569‐81. [DOI] [PubMed] [Google Scholar]
Arnett 1988
- Arnett FC, Edworthy SM, Bloch DA, McShane DJ, Fries JF, Cooper NS, et al. The American Rheumatism Association 1987 revised criteria for the classification of rheumatoid arthritis. Arthritis and Rheumatism 1988;31(3):315‐24. [DOI] [PubMed] [Google Scholar]
Ashroft 2001
- Ashcroft DM, Chapman SR, Clark WK, Millson DS. Upper gastroduodenal ulceration in arthritis patients treated with celecoxib. Annals of Pharmacotherapy 2001;35(7‐8):829‐34. [DOI] [PubMed] [Google Scholar]
Bensen 2000
- Bensen WG, Zhao SZ, Burke TA, Zabinski RA, Makuch RW, Maurath CJ, et al. Uper gastrointestinal tolerability of celecoxib, a COX‐2 specific inhibitor, compared to naproxen and placebo. Journal of Rheumatology 2000;27(8):1876‐83. [PubMed] [Google Scholar]
Cates 2008
- Cates C. Dr Chris Cates’ EBM website. Visual Rx Version 3. www.nntonline.net/visualrx/ (accessed prior to 10 April 2017).
Chou 2006
- Chou R, Helfand M, Peterson K, Dana T, Roberts C. Drug class review on cyclo‐oxygenase (COX)‐2 inhibitors and non‐steroidal anti‐inflammatory drugs (NSAIDs): Final Report Update 3 [Internet]. www.ncbi.nlm.nih.gov/books/NBK10620/ (accessed prior to 10 April 2017).
CNT 2013
- Coxib and traditional NSAID Trialists' (CNT) Collaboration. Vascular and upper gastrointestinal effects of non‐steroidal anti‐inflammatory drugs: meta‐analyses of individual participant data from randomised trials. Lancet 2013;382(9894):769‐79. [DOI] [PMC free article] [PubMed] [Google Scholar]
Conaghan 2012
- Conaghan PG. A turbulent decade for NSAIDs: update on current concepts of classification, epidemiology, comparative efficacy, and toxicity. Rheumatology International 2012;32(6):1491‐502. [DOI] [PMC free article] [PubMed] [Google Scholar]
Cramp 2013
- Cramp F, Hewlett S, Almeida C, Kirwan JR, Choy EHS, Chalder T, et al. Non‐pharmacological interventions for fatigue in rheumatoid arthritis. Cochrane Database of Systematic Reviews 2013, Issue 8. [DOI: 10.1002/14651858.CD008322.pub2] [DOI] [PMC free article] [PubMed] [Google Scholar]
Cross 2014
- Cross M, Smith E, Hoy D, Carmona L, Wolfe F, Vos T, et al. The global burden of rheumatoid arthritis: estimates from the global burden of disease 2010 study. Annals of the Rheumatic Diseases 2014;73(7):1316‐22. [DOI] [PubMed] [Google Scholar]
Deeks 2011
- Deeks JJ, Higgins JPT, Altman DG (editors). Chapter 9: Analysing data and undertaking meta‐analyses. In: Higgins JPT, Green S (editors). Cochrane Handbook for Systematic Reviews of Interventions Version 5.1.0 [updated March 2011]. The Cochrane Collaboration, 2011. Available from www.cochrane‐handbook.org.
FDA 2016
- USA Food, Drug Administration (FDA). Celebrex product information. www.accessdata.fda.gov/drugsatfda_docs/label/2005/020998s017lbl.pdf (accessed 11 December 2016).
Felson 1995
- Felson DT, Anderson JJ, Boers M, Bombardier C, Furst D, Goldsmith C, et al. American College of Rheumatology. Preliminary definition of improvement in rheumatoid arthritis. Arthritis and Rheumatism 1995;38(6):727‐35. [DOI] [PubMed] [Google Scholar]
Felson 1998
- Felson DT, Anderson JJ, Lange ML, Wells G, LaValley MP. Should improvement in rheumatoid arthritis clinical trials be defined as fifty percent or seventy percent improvement in core set measures, rather than twenty percent?. Arthritis and Rheumatism 1998;41(9):1564‐70. [DOI] [PubMed] [Google Scholar]
Gardiner 1993
- Gardiner PV, Sykes HR, Hassey GA, Walker DJ. An evaluation of the health assessment questionnaire in long‐term longitudinal follow‐up of disability in rheumatoid arthritis. British Journal of Rheumatology 1993;32(8):724‐8. [DOI] [PubMed] [Google Scholar]
Ghogomu 2014
- Ghogomu EA, Maxwell LJ, Buchbinder R, Rader T, Pardo Pardo J, Johnston RV, et al. Updated method guidelines for Cochrane musculoskeletal group systematic reviews and meta analyses. Journal of Rheumatology 2014;41(2):194‐205. [DOI] [PubMed] [Google Scholar]
GRADEpro GDT 2014 [Computer program]
- GRADE Working Group, McMaster University. GRADEpro GDT. Hamilton (ON): GRADE Working Group, McMaster University, 2014.
Hawkey 1999
- Hawkey CJ. Cox‐2 inhibitors. Lancet 1999;353(9149):307‐14. [DOI] [PubMed] [Google Scholar]
Higgins 2011
- Higgins JP, Green S (editors). Cochrane Handbook for Systematic Reviews of Interventions Version 5.1.0 (updated March 2011). The Cochrane Collaboration, 2011. Available from www.cochrane‐handbook.org.
Hurkmans 2009
- Hurkmans E, Giesen FJ, Vliet Vlieland TPM, Schoones J, Ende ECHM. Dynamic exercise programs (aerobic capacity and/or muscle strength training) in patients with rheumatoid arthritis. Cochrane Database of Systematic Reviews 2009, Issue 4. [DOI: 10.1002/14651858.CD006853.pub2] [DOI] [PMC free article] [PubMed] [Google Scholar]
Kearney 2006
- Kearney PM, Baigent C, Godwin J, Halls H, Emberson JR, Patrono C. Do selective cyclo‐oxygenase‐2 inhibitors and traditional non‐steroidal anti‐inflammatory drugs increase the risk of atherothrombosis? Meta‐analysis of randomised trials. British Medical Journal 2006;332(7553):1302‐8. [DOI] [PMC free article] [PubMed] [Google Scholar]
Lanas 2014
- Lanas Á, Carrera‐Lasfuentes P, Arguedas Y, García S, Bujanda L, Calvet X, et al. Risk of upper and lower gastrointestinal bleeding in patients taking nonsteroidal anti‐inflammatory drugs, antiplatelet agents, or anticoagulants. Clinical Gastroenterology and Hepatology 2014;13(5):906‐12. [DOI] [PubMed] [Google Scholar]
Lethaby 2013
- Lethaby A, Lopez‐Olivo MA, Maxwell LJ, Burls A, Tugwell P, Wells GA. Etanercept for the treatment of rheumatoid arthritis. Cochrane Database of Systematic Reviews 2013, Issue 5. [DOI: 10.1002/14651858.CD004525.pub2] [DOI] [PMC free article] [PubMed] [Google Scholar]
Lopez‐Olivo 2014
- Lopez‐Olivo MA, Siddhanamatha HR, Shea B, Tugwell P, Wells GA, Suarez‐Almazor ME. Methotrexate for treating rheumatoid arthritis. Cochrane Database of Systematic Reviews 2014, Issue 6. [DOI: 10.1002/14651858.CD000957.pub2] [DOI] [PMC free article] [PubMed] [Google Scholar]
Lopez‐Olivo 2015
- Lopez‐Olivo MA, Amezaga Urruela M, McGahan L, Pollono EN, Suarez‐Almazor ME. Rituximab for rheumatoid arthritis. Cochrane Database of Systematic Reviews 2015, Issue 1. [DOI: 10.1002/14651858.CD007356.pub2] [DOI] [PMC free article] [PubMed] [Google Scholar]
McInnes 2011
- McInnes IB, Schett G. The pathogenesis of rheumatoid arthritis. New England Journal of Medicine 2011;365(23):2205‐19. [DOI] [PubMed] [Google Scholar]
Moore 2013
- Moore A, Makinson G, Li C. Patient‐level pooled analysis of adjudicated gastrointestinal outcomes in celecoxib clinical trials: meta‐analysis of 51,000 patients enrolled in 52 randomized trials. Arthritis Research and Therapy 2013;15(1):R6. [DOI] [PMC free article] [PubMed] [Google Scholar]
Myasoedova 2010
- Myasoedova E, Crowson CS, Kremers HM, Therneau TM, Gabriel SE. Is the incidence of rheumatoid arthritis rising? Results from Olmsted County, Minnesota, 1955‐2007. Arthritis and Rheumatism 2010;62(6):1576‐82. [DOI] [PMC free article] [PubMed] [Google Scholar]
Review Manager 2014 [Computer program]
- Nordic Cochrane Centre, The Cochrane Collaboration. Review Manager 5 (RevMan). Version 5.3. Copenhagen: Nordic Cochrane Centre, The Cochrane Collaboration, 2014.
Richards 2012a
- Richards BL, Whittle SL, Buchbinder R. Muscle relaxants for pain management in rheumatoid arthritis. Cochrane Database of Systematic Reviews 2012, Issue 1. [DOI: 10.1002/14651858.CD008922.pub2] [DOI] [PMC free article] [PubMed] [Google Scholar]
Richards 2012b
- Richards BL, Whittle SL, Buchbinder R. Neuromodulators for pain management in rheumatoid arthritis. Cochrane Database of Systematic Reviews 2012, Issue 1. [DOI: 10.1002/14651858.CD008921.pub2] [DOI] [PMC free article] [PubMed] [Google Scholar]
Roubille 2015
- Roubille C, Richer V, Starnino T, McCourt C, McFarlane A, Fleming P, et al. The effects of tumour necrosis factor inhibitors,methotrexate, non‐steroidal anti‐inflammatory drugs and corticosteroids on cardiovascular events in rheumatoid arthritis, psoriasis and psoriatic arthritis:a systematic review and meta‐analysis. Annals of the Rheumatic Diseases 2015;74(3):480‐9. [DOI] [PMC free article] [PubMed] [Google Scholar]
Ruiz Garcia 2014
- Ruiz Garcia V, Jobanputra P, Burls A, Cabello JB, Vela Casasempere P, Bort‐Marti S, et al. Certolizumab pegol (CDP870) for rheumatoid arthritis in adults. Cochrane Database of Systematic Reviews 2014, Issue 9. [DOI: 10.1002/14651858.CD007649.pub3] [DOI] [PubMed] [Google Scholar]
Schünemann 2011a
- Schünemann HJ, Oxman AD, Higgins JPT, Vist GE, Glasziou P, Guyatt GH. Chapter 11: Presenting results and ‘Summary of findings' tables. In: Higgins JPT, Green S (editors), Cochrane Handbook for Systematic Reviews of Interventions Version 5.1.0 (updated March 2011). The Cochrane Collaboration, 2011. Available from www.cochrane‐handbook.org.
Schünemann 2011b
- Schünemann H, Oxman AD, Vist GE, Higgins JBT, Deeks JJ, Glasziou P, et al. Chapter 12: Interpreting results and drawing conclusions. In: Higgins JPT, Green S (editors) Cochrane Handbook for Systematic Reviews of Interventions. Version 5.1.0 (updated March 2011). The Cochrane Collaboration, 2011. Available from www.cochrane‐handbook.org.
Scott 2010
- Scott DL, Wolfe F, Huizinga TW. Rheumatoid arthritis. Lancet 2010;376(9746):1094‐108. [DOI] [PubMed] [Google Scholar]
Singer 2010
- Singer JB, Lewitzky S, Leroy E, Yang F, Zhao X, Klickstein L, et al. A genome‐wide study identifies HLA alleles associated with lumiracoxib‐related liver injury. Nature Genetics 2010;42(8):711‐4. [DOI] [PubMed] [Google Scholar]
Süleyman 2007
- Süleyman H, Demircan B, Karagöz Y. Anti‐inflammatory and side effects of cyclooxygenase inhibitors. Pharmacological Reports 2007;59(3):247‐58. [PubMed] [Google Scholar]
TGA 2010
- Therapeutic Goods Administration (Australia). Australian Public Assessment Report for Celecoxib. Proprietary Product Name: Celebrex; Sponsor: Pfizer Australia Pty Ltd; August 2010. www.tga.gov.au/sites/default/files/auspar‐celebrex.pdf (accessed 11 December 2016). [Web resource]
Trelle 2011
- Trelle S, Reichenbach S, Wandel S, Hildebrand P, Tschannen B, Villiger PM, et al. Cardiovascular safety of non‐steroidal anti‐inflammatory drugs: network meta‐analysis. British Medical Journal 2011;342:c7086. [DOI] [PMC free article] [PubMed] [Google Scholar]
Van Walsem 2015
- Walsem A, Pandhi S, Nixon RM, Guyot P, Karabis A. Relative benefit‐risk comparing diclofenac to other traditional non‐steroidal anti‐inflammatory drugs and cyclooxygenase‐2 inhibitors in patients with osteoarthritis or rheumatoid arthritis: a network meta‐analysis. Arthritis Research and Therapy 2015;17(66):1‐18. [DOI] [PMC free article] [PubMed] [Google Scholar]
Verhagen 2015
- Verhagen AP, Bierma‐Zeinstra SMA, Boers M, Cardoso JR, Lambeck J, Bie R, et al. Balneotherapy (or spa therapy) for rheumatoid arthritis. Cochrane Database of Systematic Reviews 2015, Issue 4. [DOI: 10.1002/14651858.CD000518.pub2] [DOI] [PMC free article] [PubMed] [Google Scholar]
Vucic 2015
Whittle 2011
- Whittle SL, Richards BL, Husni E, Buchbinder R. Opioid therapy for treating rheumatoid arthritis pain. Cochrane Database of Systematic Reviews 2011, Issue 11. [DOI: 10.1002/14651858.CD003113.pub3] [DOI] [PubMed] [Google Scholar]
References to other published versions of this review
Fidahic 2016
- Fidahic M, Jelicic Kadic A, Radic M, Puljak L. Celecoxib for rheumatoid arthritis. Cochrane Database of Systematic Reviews 2016, Issue 2. [DOI: 10.1002/14651858.CD012095] [DOI] [PMC free article] [PubMed] [Google Scholar]
Garner 2002
- Garner SE, Fidan D, Frankish RR, Judd M, Shea B, Towheed T, et al. Celecoxib for rheumatoid arthritis. Cochrane Database of Systematic Reviews 2002, Issue 4. [DOI: 10.1002/14651858.CD003831] [DOI] [PubMed] [Google Scholar]