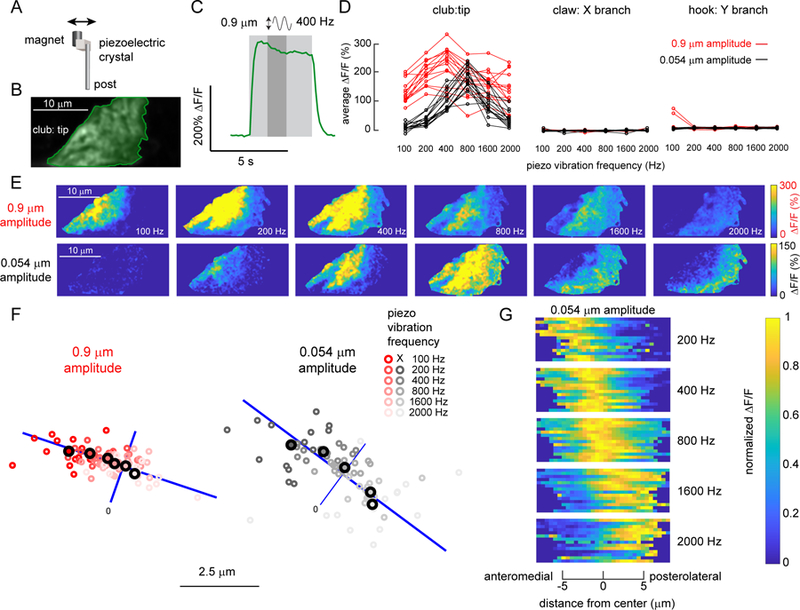
Figure 6. A map of vibration frequency in the axons of club neurons.

A. To vibrate the fly’s tibia, we attached one side of a piezoelectric crystal to a magnet and the other to a post fixed to a servo motor. The magnet was placed directly onto a pin glued to the tibia (see Figure S6 for details). B. Average GCaMP6f fluorescence from an example recording location, at the tip of the club axons (R64C04-Gal4). C. An example time course of the club’s response (∆F/F) to a 400 Hz, 0.9 µm vibration of the magnet. We averaged the activity level in a 1.25 second window (indicated by a darker grey shading) starting from 1.25 seconds after the stimulation onset, and used it as a measure of response amplitude in D and as activity maps in E. D. Only club neurons respond reliably to the vibration stimulus. Plots show the activity of different subsets of FeCO axons in response to tibia vibrations at different frequencies and amplitudes. Each line represents an average response from one fly. E. Example ∆F/F maps of GCaMP6f fluorescence at the tip of the club in response to tibia vibration at different frequencies and amplitudes. For both amplitudes, the responding regions shifted from the anterolateral side to the posteromedial side of the axon projection as stimulation frequency increased. F. A map of vibration frequency in club axon terminals. Smaller empty circles with different shades of red (0.9 µm amplitude) or grey (0.054 µm amplitude) represent the location of the weighted center of the responding region in different flies (n = 14 flies for both amplitudes). Larger, outlined circles represent the average location. The blue line represents the best fit line to the average locations across frequencies. We rotated the images from each fly to match the orientation of the example images shown in E. G. Distribution of activity (∆F/F) along the anterolateral to posteromedial axis (blue lines in F) of the club axons during tibia vibration. Signals were normalized by the maximum average activity during each stimulus in that fly. Responses shifted from the anterolateral to posteromedial side as vibration frequency increased. See also Figure S6
