

Abstract
Preclinical studies suggest that treatment with neoadjuvant immune checkpoint blockade is associated with enhanced survival and antigen-specific T cell responses over adjuvant treatment1; however, optimal regimens have not been defined. Herein, we report results from a randomized phase II study of neoadjuvant nivolumab versus combined ipilimumab with nivolumab in 23 patients with high-risk resectable melanoma (NCT02519322). RECIST overall response rates (ORR), pathologic complete response rates (pCR), treatment-related adverse events (trAEs), and immune correlates of response were assessed. Treatment with combined ipilimumab and nivolumab yielded high response rates (RECIST ORR 73%, pCR 45%) but substantial toxicity (73% grade 3 trAEs), whereas treatment with nivolumab monotherapy yielded modest responses (ORR 25%, pCR 25%) and low toxicity (8% grade 3 trAEs). Immune correlates of response were identified, demonstrating higher lymphoid infiltrates in responders to both therapies and a more clonal and diverse T cell infiltrate in responders to nivolumab monotherapy. These results are the first to describe the feasibility of neoadjuvant immune checkpoint blockade in melanoma and emphasize the need for additional studies to optimize treatment regimens and to validate putative biomarkers.
Clinical outcomes for patients with stage III melanoma have historically been poor2, however recent advances in treatment with adjuvant immune checkpoint blockade (ICB) have demonstrated survival benefit - substantiating the FDA approvals of single agent ipilimumab (CTLA-4 blockade)3 and nivolumab (PD-1 blockade)4 in patients with high-risk resected disease, and with recent data also showing benefit with adjuvant pembrolizumab5. Treatment with combined CTLA-4 and PD-1 blockade is also being studied in the adjuvant setting (NCT03068455; NCT03241186), although toxicity with this regimen can be significant6,7.
The current standard of care for patients with clinical stage III melanoma is upfront surgery with adjuvant therapy; however, we recently demonstrated that treatment with neoadjuvant and adjuvant targeted therapy (dabrafenib and trametinib) is associated with high pathologic complete response (pCR) rates and improved outcomes over standard of care upfront surgery8. Preclinical studies suggest that neoadjuvant administration of ICB is associated with improved survival and enhanced anti-tumor immune responses compared to the same therapy administered in the adjuvant setting1. Treatment with ICB has not been well-studied in the neoadjuvant setting in melanoma though its feasibility has been demonstrated in non-small cell lung cancer9. Based on these results and the described preclinical studies, we conducted a randomized, non-comparative phase II trial of neoadjuvant nivolumab monotherapy (3 mg/kg IV every 14 days for up to 4 doses) and combined ipilimumab with nivolumab (ipilimumab 3 mg/kg and nivolumab 1 mg/kg IV every 21 days for up to 3 doses) to define clinical responses (radiographic, pathologic, and survival rates) and immunologic biomarkers of response in patients with surgically resectable clinical stage III or oligometastatic stage IV disease (Fig. 1) (NCT02519322).
Figure 1. Trial schema.
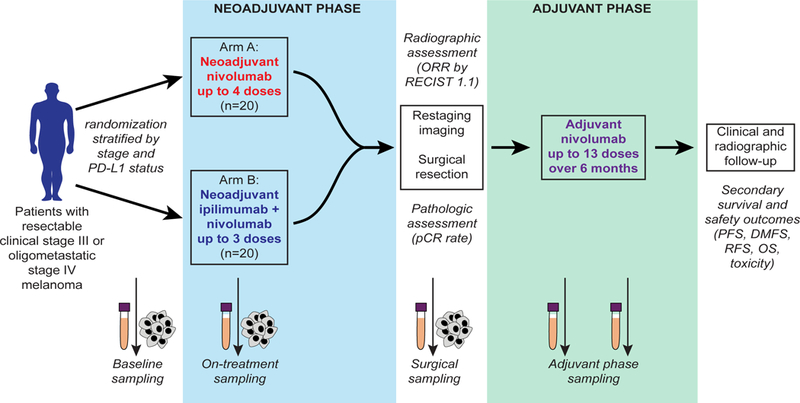
Patients with resectable clinical stage III or oligometastatic stage IV melanoma were stratified by stage and PD-L1 status and randomized in 1:1 ratio to neoadjuvant nivolumab 3 mg/kg for up to 4 doses (Arm A) or ipilimumab 3 mg/kg with nivolumab 1 mg/kg for up to 3 doses (Arm B), followed by surgical resection and then adjuvant nivolumab for 6 months. Primary endpoint of the trial was pathologic complete response (pCR) rate, defined as complete eradiation of tumor. Additional secondary endpoints included overall response rate by RECIST 1.1, survival outcomes, and immune correlates. Longitudinal tumor and blood samples were collected at baseline, prior to cycle 2, prior to cycle 3, and at the time of surgery followed by adjuvant blood collection every 3 months at the time of restaging.
A total of 30 patients were consented and assessed for eligibility of whom 23 were enrolled in the trial (Supplementary Fig 1). All patients were required to provide written informed consent prior to treatment and this trial adhered to all relevant ethical considerations. Twelve patients were randomized to nivolumab monotherapy and 11 patients were randomized to combined therapy with ipilimumab and nivolumab. The median (and range) of follow-up was 15.0 months (5.8–22.6) in the nivolumab monotherapy arm, and 15.6 months (5.8–24.4) in the combination therapy arm, and no significant differences in baseline patient characteristics were observed between arms (Supplementary Table 1). The majority of patients had clinical stage IIIB or IIIC disease10, with most having superficial spreading and nodular melanoma and none with mucosal or acral subtypes in this cohort. Of note, 3 of the patients on the combination therapy arm previously received adjuvant interferon or peginterferon, and 1 of the patients in the nivolumab monotherapy arm had previously received neoadjuvant dabrafenib and trametinib followed by surgery and then adjuvant radiation and biochemotherapy. All other patients were either treatment naïve or had previously only received surgical resection for primary melanoma.
Of note, a total of 40 patients were planned for accrual; however, the trial was stopped early by the data safety monitoring board (DSMB) based on an early observation of disease progression preventing surgical resection during neoadjuvant nivolumab treatment (17% or 2/12 patients) and high rates of grade 3 treatment-related adverse events (trAEs) during neoadjuvant combination treatment (73% or 8/11 patients), especially in light of more recent trial designs studying better tolerated dosing regimens for combination ipilimumab with nivolumab.
The RECIST overall response rate (ORR) was 25% (3/12 patients) with nivolumab monotherapy (Fig. 2A and Supplementary Fig. 2A) and 73% (8/11 patients) with combined ipilimumab and nivolumab therapy (Fig. 2B and Supplementary Fig. 2B), while pCR rates were 25% (3/12 patients) and 45% (5/11 patients), respectively. A representative response is shown (Fig. 2C). Two patients with progressive disease while receiving nivolumab monotherapy were unable to receive definitive surgical resection due to the development of synchronous metastatic disease as well as local progression. Compared to nivolumab alone, combination ipilimumab with nivolumab yielded improved radiologic and pathologic outcomes by Fisher’s exact test (p=0.039 and 0.40, respectively).
Figure 2. Radiographic and pathologic responses to neoadjuvant nivolumab and combination ipilimumab with nivolumab.
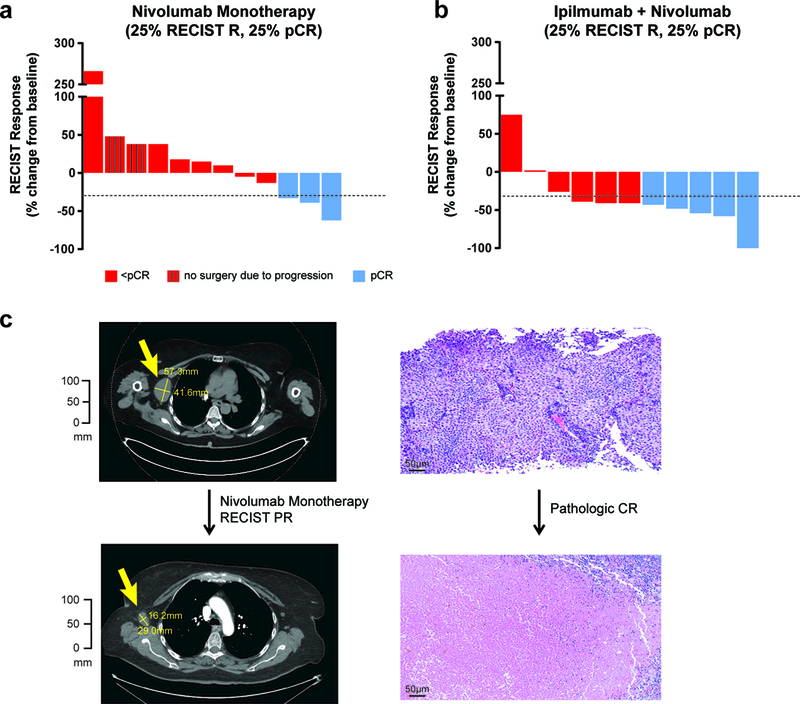
a, Waterfall plots of overall response rates (ORR) by RECIST 1.1 at 8 weeks and surgical pathologic complete responses (pCR) for the patients treated with nivolumab monotherapy (n=12, 25% RECIST ORR and pCR rate). Two of the patients progressed beyond resectability and did not receive surgical resection. b, Combination ipilimumab with nivolumab (n=11) yielded improved outcomes compared to nivolumab, 73% (95% CI 39–94%, p=0.039) RECIST ORR and 45% (95% CI 17–77%, p=0.40) pCR rate using two-sided Fisher’s Exact Test. c, Only one patient on the trial who had a pCR also had a radiographic complete response, with the other pathologic responders having partial responses.
Treatment with combination therapy was associated with improved progression-free survival (PFS), relapse-free survival (RFS), distant metastasis-free survival (DMFS), and overall survival (OS) over treatment with nivolumab alone, although this did not achieve statistical significance likely owing to the small sample size due to early closure of the trial (Fig. 3, and Supplementary Fig. 3); notably, with a median follow-up of 15.6 months (range 5.−24.4), 11/11 of the patients receiving dual checkpoint blockade are still alive. Improved RFS, DMFS, and OS were observed in patients who achieved a pCR following neoadjuvant therapy versus those who did not (Supplementary Fig. 4). This was also observed for patients who achieved a RECIST response (CR, PR) versus those who did not (SD, PD) (Supplementary Fig. 5). However, these results did not reach statistical significance likely owing to the limited sample size.
Figure 3. Kaplan-Meier Estimates of Survival.
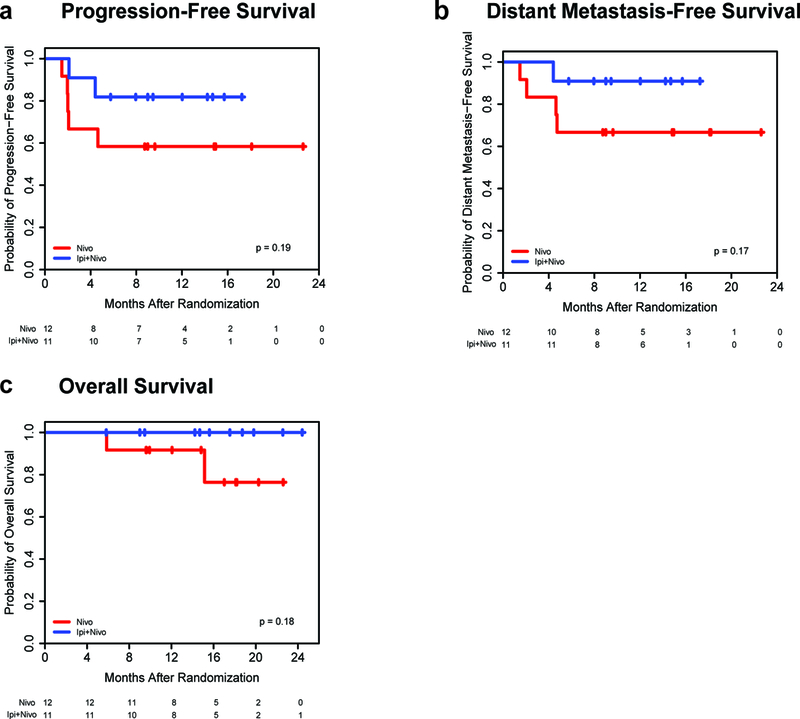
a,b,c, Kaplan-Meier estimates of progression-free survival (PFS), distant metastasis-free survival (DMFS), and overall survival (OS) by two-sided log-rank test are shown by treatment group. Patients were followed for a median of 15.0 months (range 5.8–22.6) in nivolumab (N) monotherapy arm (n=12) and 15.6 months (range 5.8–24.4) in the combination therapy (I+N) arm (n=11). Median survival endpoints have not been reached. Combination ipilimumab with nivolumab resulted in improved survival outcomes compared to nivolumab monotherapy, though this did not reach significance. For PFS, survival rates of 82% (95% CI 45–95%) at 17.2 months (mo) with I+N versus 58% (27–80%) at 22.6 mo with N, p=0.19. For DMFS, rates of 91% (51–99%) at 17.2 mo with I+N versus 67% (34–86%) at 22.6 mo with N, p=0.17. For OS, rates of 100% (100–100%) at 24.4 mo with I+N versus 76% (31–94%) at 22.6 mo with N, p=0.18.
Importantly, toxicity rates differed significantly between treatment arms during neoadjuvant treatment, with grade 3 trAEs reported in 8% (1/12 patients) of monotherapy treated and in 73% (8/11 patients) of combination treated patients (Supplementary Table 2); no grade 4 or 5 trAEs were observed. The only grade 3 trAE for nivolumab treated patients was tumor-related pain. In contrast, grade 3 trAEs for combination treated patients included transaminitis (27%), colitis (18%), hyperthyroidism (9%), pneumonia (18%), arthralgias (9%), myositis/myalgias (9%), electrolyte abnormalities (hypokalemia 9%, hyponatremia 18%), hyperglycemia (9%), fall (9%), and sinus tachycardia (9%). Dose delays were required in 64% of patients (7/11 patients) receiving combined ipilimumab and nivolumab therapy. None of the patients receiving nivolumab monotherapy required dose delays. During the post-operative and adjuvant periods (Supplementary Table 3), ≥ grade 3 trAEs were observed in an additional 2 patients in the nivolumab treated arm (grade 3 colitis in one patient, grade 4 diabetic ketoacidosis in one patient) and an additional 1 patient in the combination treated arm (hypophysitis).
Responders demonstrated a trend towards a higher total mutational burden compared to non-responders, though responses were seen even in low mutational burden disease (Fig. 4A). Immune profiling via immunohistochemistry (IHC) performed on baseline and early on-treatment tumor samples demonstrated higher CD8+ T-cell infiltrate, tumor cell PD-L1 expression, and expression of lymphoid markers (Granzyme B, CD4, FoxP3, CD20, and PD-1) in responders compared to non-responders (Fig. 4B-D, and Supplementary Fig.6). Early on-treatment biopsies showed a significantly stronger predictive signal for most of these markers compared to baseline, consistent with prior published literature11. Parallel analyses by multiplex immunohistochemistry revealed co-expression of additional immune markers in the CD45+ infiltrate that correlated with response, including expression of CD45RO, β2-microglobulin, T cell markers (CD3, CD8), and B cell markers (CD19, CD20). In addition, cell proliferation (assessed by Ki67) within CD45+ cells was higher in responders compared to non-responders (Fig. 4E, Supplementary Fig.7, and Supplementary Tables 4–9).
Figure 4. Immune correlates of response to immune checkpoint blockade (ICB).
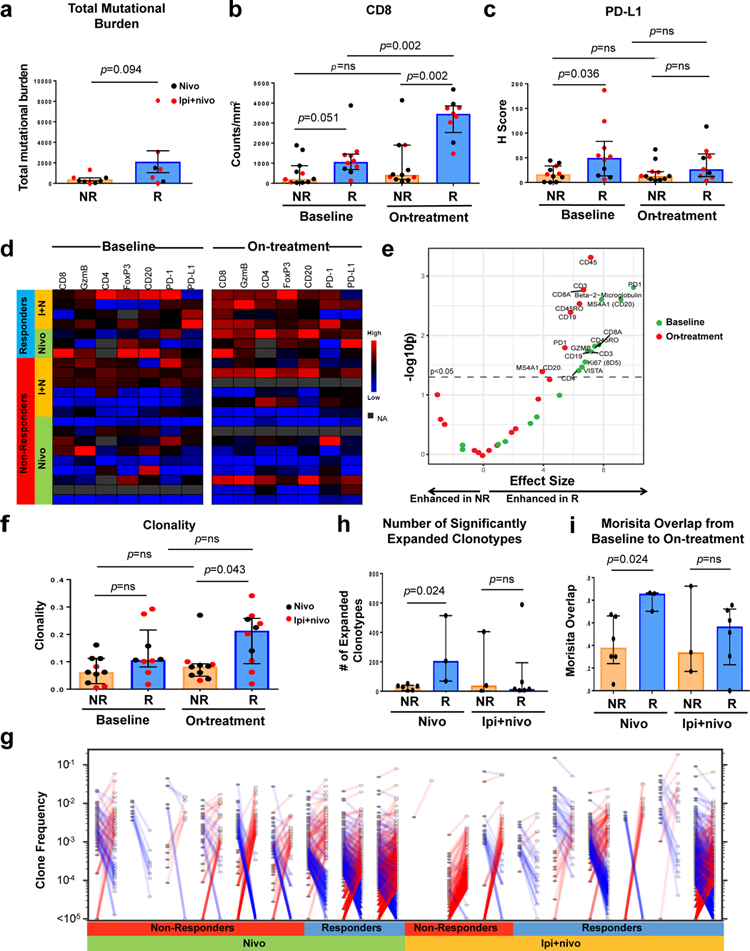
Longitudinal tumor biopsies were obtained at baseline and early on-treatment in patients on neoadjuvant ICB therapy. The tumor molecular and immune microenvironment was compared between non-responders (NR) and responders (R), with responders defined as patients achieving a complete or partial response by RECIST 1.1. a, Total mutational burden, defined as the sum of non-synonymous exonic mutations, is displayed (n=8 NR and 7 R). b,c, Quantification by immunohistochemistry of CD8 cell count density (n=11 NR and 10 R at baseline, n=11 NR and 9 R on-treatment) and PD-L1 H score (28–8 clone) (n=11 NR and 10 R at baseline, n=11 NR and 9 R on-treatment). d, Supervised hierarchical clustering summarizes expression of additional lymphoid markers (Granzyme B, CD4, FoxP3, CD20, and PD-1) using standard immunohistochemistry with blue indicating lower count density and red higher count density (or H score for PD-L1). e, Volcano plots of two-sided pairwise Mann-Whitney comparisons of multiplex immunohistochemistry marker expression between NR and R in baseline (green) and on-treatment (red) samples in the combined treatment arms (n=11 NR and 11 R at baseline, n=10 NR and 6 R on-treatment). Immune marker expression was assessed on CD45 positive cells and quantified as expression per area of assayed tissue. f, T cell clonality scores between NR and R at baseline (left, n=10 NR and 9 R) and on-treatment (right, n=10 NR and 9 R). g, Analysis of change in T cell repertoire was performed using differential abundance analysis. Clones that significantly increase (red) or decrease (blue) in frequency from baseline (closed circles) to on-treatment (open circles) are shown for whole clinical trial cohort. h,i, Change in T cell repertoire was assessed for number of significantly expanded clonotypes (n= 6 NR and 3 R for nivolumab treated patients, n=3 NR and 6 R for combination ICB treated patients) and Morisita Overlap index (n=6 NR ad 3 R for nivolumab treated patients, n=3 NR and 6 R for combination ICB treated patients). For a-c, f, h-I, Bar heights indicate median values, and interquartile ranges are presented in addition to individual data points. Comparisons were made using two-sided Mann-Whitney U tests.
T cell receptor sequencing demonstrated higher clonality in tumors of responders (at pre- and on-treatment time points) similar to that described in prior published studies12 (Fig. 4F). Of note, the increased clonality in on-treatment samples was predominantly observed in patients on nivolumab monotherapy, as patients responding to combined ipilimumab with nivolumab displayed a more heterogeneous pattern of clonality. T cell diversity was similarly higher in responders to nivolumab monotherapy, suggesting that responders to nivolumab monotherapy have a more diverse T cell repertoire with a subset of tumor reactive clones accounting for the high clonality (Supplementary Fig.8). To further investigate longitudinal changes in T cell repertoire, we assessed T cell repertoire dynamics using differential abundance analysis, demonstrating greater treatment-induced clonal expansion within the tumors of nivolumab responders compared with non-responders (Fig. 4G-H). Furthermore, nivolumab responders exhibited a greater frequency of pre-existing T cell clones at baseline that were either preserved or further expanded with treatment (Fig. 4I). By contrast, the dynamics of the intratumoral T cell repertoire in patients treated with combination ipilimumab and nivolumab demonstrated greater variability under treatment. (Fig. 4G). Analysis of the T cell repertoire in peripheral blood revealed significant expansion of tumor resident T cell clones from baseline to early on-treatment in the setting of treatment with combined ipilimumab and nivolumab compared to nivolumab monotherapy (Supplementary Fig.8). However this was not associated with differences in response (Supplementary Fig.8). Parallel analyses of the impact of total mutational burden, IHC parameters, and T cell repertoires using pCR as an outcome demonstrated similar findings (Supplementary Fig. 6–7, 9–10).
To our knowledge, this is the first randomized neoadjuvant trial of single or dual agent ICB in patients with resectable clinical stage III or oligometastatic stage IV melanoma. Treatment with neoadjuvant nivolumab was well tolerated and was associated with reasonable response rates (ORR, pCR); however, the frequency of significant disease progression during neoadjuvant nivolumab monotherapy that precluded standard of care surgery underscored clinical concerns with this approach. In contrast, neoadjuvant therapy with combined ipilimumab and nivolumab resulted in higher response and pCR rates, but with higher toxicities. This activity was achieved despite the fact that 64% of patients (7/11 patients) received only 2 of the planned 3 neoadjuvant doses. It is notable that 11/11 patients receiving dual immune checkpoint blockade remain alive after a median of 15.6 months (range 5.−24.4), which is a higher proportion surviving at this time point than expected compared with historical controls for this high-risk patient population5,13,14. The promising activity seen in the combination arm supports the rationale for expanded evaluation of combination ICB agents in the neoadjuvant setting.
Compared to RECIST responses seen in the metastatic setting with the medication doses and schedules used in this trial6, in this neoadjuvant cohort we observed somewhat higher response rates (73% versus ~60%) and rates of ≥ grade 3 trAEs (73% versus ~60%) with combination therapy, and lower response rates (25% versus ~40%) and rates of ≥ grade 3 trAEs (8% versus ~20%) with nivolumab monotherapy. Given the relatively small size of this study, however, it is difficult to draw conclusions on whether there is a true difference in efficacy and toxicity of immune checkpoint blockade between resectable and unresectable disease.
Importantly, data have evolved since our trial was designed regarding optimal dosing regimens and schedules for these agents. For example, shorter neoadjuvant treatment regimens have been explored incorporating anti-PD-1 monotherapy in melanoma and lung cancer with success9,15. In addition to this, alternative dosing strategies for combined CTLA-4 and PD-1 blockade (such as ipilimumab 1 mg/kg and nivolumab 3 mg/kg or less frequent dosing) are also being explored to preserve efficacy while limiting toxicity (NCT02977052, NCT03068455, NCT03241186, NCT03158129, NCT01454102). Furthermore, novel agents with potentially less toxicity than CTLA-4 blockade are now being tested in the neoadjuvant setting for patients with resectable metastatic melanoma, including in our amended trial – where treatment with nivolumab will be combined with relatlimab – a monoclonal antibody blocking the lymphocyte-activation gene 3 (LAG-3), an immune checkpoint molecule frequently upregulated in cancer.
Detailed immunologic correlative studies recapitulated several known immune biomarkers of response to ICB in the metastatic melanoma setting, with early on-treatment biopsies showing higher lymphoid immune infiltrates and a more clonal T cell repertoire in responders compared to non-responders11,12. Baseline higher clonality is especially prominent in nivolumab monotherapy responders, with further expansion of the pre-existing high-frequency clones with treatment. These data highlight the importance of and perhaps need for a tumor-educated (but inhibited) T cell repertoire in shaping the response to anti-PD-1 monotherapy and are consistent with prior reports16,17. However, responses to treatment with combined ipilimumab and nivolumab therapy seem to be less dependent on a pre-existing intra-tumoral T cell repertoire, and this treatment is associated with an increase in tumor-resident T cell clones in the periphery.
This study has several limitations including relatively small sample size, which is a result of early trial closure. However, despite this limitation, the data does provide provocative preliminary evidence regarding efficacy and toxicity of anti-PD-1 monotherapy and combined anti-CTLA-4 and anti-PD-1 therapy in patients with resectable high-risk metastatic melanoma. The data suggest that while neoadjuvant administration of single agent anti-PD-1 is safe, disease progression within the neoadjuvant period can occur in a subset of patients. Additionally, while combination anti-PD-1 and anti-CTLA-4 is more effective in terms of response rates and the ability to produce pCR, this efficacy comes at the expense of significant toxicity. Currently, while there is a trend towards improved clinical survival outcomes for combination treated patients, the data are too premature to be conclusive and longer term follow up is essential. Another limitation in study interpretation is regarding comparison of the two treatment arms. Exploratory analyses were performed between treatment arms to gain insight into potential differences in efficacy and toxicity; as the trial was designed with two non-comparative arms, these results need to therefore be interpreted with caution. Though findings from these studies are provocative, additional studies in larger cohorts will be needed to validate these findings and to further optimize therapeutic approaches.
Of note, our original trial design included patients with AJCC 7th Edition stage IIIB, IIIC, and oligometastatic stage IV disease. The inclusion of patients with oligometastatic stage IV disease renders this study population relatively heterogeneous and thereby decreases the generalizability of this data to a stage III population. In future trials, limiting these treatments to more defined patient cohorts, such as AJCC 8th Edition stage IIIB/IIIC/IIID melanoma only, may be a more reasonable strategy. Additionally, these data are limited to patients with cutaneous or unknown primary melanoma, as no cases of mucosal or acral subtypes were included in this trial. As such, it remains unclear whether our findings apply to patients with these melanoma subtypes.
Together, these results provide critical data on the performance of two 8–9 week neoadjuvant ICB regimens that are commonly used in unresectable melanoma – nivolumab 3 mg/kg every 2 weeks and ipilimumab 3 mg/kg with nivolumab 1 mg/kg every 3 weeks - in resectable clinical stage III and oligometastatic stage IV melanoma patients, and suggest that treatment with combined ipilimumab and nivolumab is associated with improved responses but also significant toxicity. Further studies are needed to optimize these regimens and determine long term benefits as well as to better understand the mechanistic underpinnings of therapeutic response and resistance.
ONLINE METHODS
Patients
Eligible patients were at least 18 years of age with histologically proven clinical stage III or oligometastatic stage IV cutaneous, mucosal or acral melanoma per AJCC 7th Edition10. Clinical stage III disease was defined as at least one lymph node metastasis measuring 1.5 cm in short axis or at least one 1.0 cm in-transit metastasis, as per RECIST 1.1 criteria18. Patients with oligometastatic stage IV melanoma were eligible if there were <4 sites of metastases with no bone and brain involvement. Only patients with surgically resectable disease, as determined by a multidisciplinary consensus review, were eligible. All patients had Eastern Cooperative Oncology Group (ECOG) performance status of 0 or 1 with normal organ and bone marrow function. Key exclusion criteria included prior exposure to ICB agents, use of anticoagulants, concurrent medical condition requiring chronic corticosteroids or other immunosuppressive medication, or active concurrent second cancer. A complete list of inclusion and exclusion criteria is provided in the protocol.
Trial Design and Treatments
In this single-institution, investigator-initiated phase II randomized non-comparative study, patients were randomized to receive 4 doses of nivolumab (Arm A) or 3 doses of combination ipilimumab with nivolumab (Arm B) administered in a neoadjuvant fashion. Patients were stratified based on stage (IIIB/IIIC/M1A vs. M1B/M1C) and PD-L1 status (less than or greater than 1% tumor cells positive for membranous staining; clone 28–8), and then randomized in a 1:1 ratio between Arms A and B. Patients in Arm A received up to 4 doses of nivolumab 3 mg/kg IV on weeks 1, 3, 5 and 7. Patients in Arm B received up to 3 doses of nivolumab 1 mg/kg with ipilimumab 3 mg/kg on weeks 1, 4, and 7. Patients were closely monitored for local disease progression during neoadjuvant therapy. Following neoadjuvant treatment, patients underwent restaging with assessment of radiographic responses (via RECIST) and proceeded to surgery if no contraindication was present such as development of unresectable distant metastases. All patients undergoing surgery were offered nivolumab 3 mg/kg IV every 2 weeks for 13 doses in the adjuvant setting as long as they did not require adjuvant radiation and did not experience unacceptable toxicities during neoadjuvant therapy (Supplementary Fig.1).
Primary and Secondary Endpoints
The primary endpoint of this study was assessment of pathologic response in each arm at the time of surgical resection. Secondary endpoints included: assessment of overall response rate (ORR) by RECIST 1.1 to neoadjuvant therapy; progression-free survival (PFS) defined as the time from study randomization to development of radiographic progression before surgery, disease recurrence after surgical resection, or death from any cause; relapse-free survival (RFS) defined as the time from surgery to disease recurrence or death from any cause; distant metastasis-free survival (DMFS) defined as the time from study randomization to development of distant metastases or death from any cause; overall survival (OS) defined as the time from randomization to death from any cause; and safety. Exploratory analyses were undertaken to identify immunologic and genomic predictors of therapeutic response and to gain mechanistic insight on treatment efficacy.
Pathologic and Clinical Assessments
Patients who received per-protocol neoadjuvant treatment and underwent surgery were evaluable for the primary endpoint of pathologic response. Surgical samples were analyzed by dermatopathologists for pathologic complete response (pCR), defined as absence of any viable malignant cells on hematoxylin and eosin stained slides and confirmatory SOX-10 immunohistochemical (IHC) staining of representative sections in ambiguous cases as has been advocated for other systems8,19.
Disease assessments included clinical examinations and imaging studies (PET-CT or CT of chest, abdomen and pelvis with contrast; MRI or CT of brain) at baseline, at completion of neoadjuvant treatment (~week 9), and every 12 weeks after surgery for up to 2 years. Radiologic assessment immediately after neoadjuvant therapy was performed according to RECIST 1.1 criteria to classify best response to therapy as complete (CR) or partial (PR) response, stable disease (SD) or progressive disease (PD). ORR was defined as CR plus PR rates. All patients randomized were eligible for evaluation of PFS. Patients who underwent surgery were eligible for evaluation of RFS. All patients randomized were evaluable for DMFS and for OS. For survival comparisons of responders versus non-responders (by either pathologic response or RECIST), all survival endpoints were defined from the time of surgery.
Adverse events and laboratory values were assessed at screening, baseline, and prior to each neoadjuvant and adjuvant dose, and were graded according to the National Cancer Institute Common Terminology Criteria for Adverse Events, v4.020.
Trial Oversight
This trial was approved by the MD Anderson Cancer Center Institutional Review Board. The trial was conducted in accordance with the ethical principles of the Declaration of Helsinki and with adherence to the Good Clinical Practice guidelines, as defined by the International Conference on Harmonization. This protocol was conducted with compliance with all relevant ethical regulations. Written informed consent was obtained from all participants. The MD Anderson Data Safety Monitoring Board (DSMB) reviewed the data at 12 month increments. The drug manufacturer (Bristol-Myers Squibb) funded the trial and supplied the agents but had no role in the design or execution of the trial, the collection or analysis of the data or the preparation of the manuscript.
Biospecimen Collection
Blood and tumor samples were collected at several time-points for correlative studies including baseline, on-treatment (weeks 3 and 5 for Arm A, weeks 4 and 7 for Arm B), and at surgical resection. Details on timing of on-treatment sample collection in the analyses included in this manuscript are shown in Supplementary Table 10. Blood collection was continued every 12 weeks in the adjuvant setting. Tumor samples were obtained as core, punch or excisional biopsies performed by treating clinicians or an interventional radiologist. Samples were immediately formalin fixed and paraffin-embedded (FFPE) or snap frozen following tissue collection.
Singlet Immunohistochemistry
Hematoxylin and eosin (H&E) and immunohistochemistry (IHC) staining were performed on FFPE tumor tissue sections. The tumor tissues were fixed in 10% formalin, embedded in paraffin, and sectioned into 4 μm sections used for histopathological study. Sections were stained with mouse or rabbit anti-human monoclonal antibodies against CD4 (Novocastra, CD4–368-L-A, 1:80), CD8 (Thermo Scientific, MS-457-S, 1:25), FoxP3 (BioLegend, cat#320102, 1:50), Granzyme B (Leica Microsystems, cat# PA0291, 1:1), CD20 (Dako, cat# M0755, 1:1400), PD-1 (Abcam, cat# ab137132, 1:250), and PD-L1 (Cell Signaling Technologies, cat#13684, 1:100). All sections were counterstained with hematoxylin, dehydrated, and mounted. Sections were processed with peroxidase-conjugated avidin/biotin and 3’−3-diaminobenzidine (DAB) substrate (Leica Microsystems) and slides were scanned and digitalized using the scanscope system from Scanscope XT (Aperio/Leica Technologies).
Quantitative analysis of IHC staining was conducted using the image analysis software- ImageScope-Aperio/Leica. Five random areas (1 mm2 each) were selected using a customized algorithm for each marker in order to determine the number of positive cells per high-powered field (HPF). The data is expressed as a percent score (number of positive cells/total number of cells) or density (total number of positive cells/mm2 area). IHC staining was interpreted in conjunction with H&E stained sections.
Multiplex Immunohistochemistry
Multiplex immunohistochemistry was performed using Digital Spatial Profiling (NanoString, Seattle, WA). An automated setup capable of imaging and sample collection was developed by modifying a standard microscope and controlling it with Metamorph® (Molecular Devices) and home-built software. For protein detection, a multiplexed cocktail of primary antibodies, each with a unique, UV photocleavable indexing oligo, and/or 1–3 fluorescent markers (antibodies and/or DNA dyes) was applied to a slide-mounted FFPE tissue section. The tissue slide was placed on the stage of an inverted microscope (Nikon, Ti-E®). A custom gasket was then clamped onto the slide, allowing the tissue to be submerged in 1.5 mL of buffer solution (TBST, protein assay; 2X SSC +0.1% Tween 20, RNA assay). The gasket clamp design allows the buffer to be accessed from above by a microcapillary tip (100 μm inner diameter). The microcapillary tip is connected to a syringe pump (Cavro® XCalibur) primed with buffer solution, allowing for accurate aspiration of small volumes (<2.5 μL). Additionally, the tip is mounted to a separate, vertically-aligned z-stage (ASI LS-50), which provides sub-micron tip position accuracy over the tissue. Under the microscope, wide field fluorescence imaging was performed with epi-illumination from visible LED light engine (Lumencor, SOLA®). The tissue area of interest was then located using fluorescence imaging with a 4x objective (Nikon). This was followed by 20x (Nikon, ELWD) fluorescence scanning. Each 20x image corresponds to 665μm x 665μm of tissue area with a CMOS camera (Hamamatsu, Flash 4.0®). The 20x images were assembled to yield a high-resolution image of the tissue area of interest. The specific regions of interest (ROIs) for molecular profiling were then selected based on the fluorescence information and sequentially processed by the microscope automation.
The steps performed for each ROI by the microscope automation were as follows: First, the microcapillary tip was washed by dispensing clean buffer out the capillary and into a wash station. Next, the tissue slide was washed by exchanging the buffer solution on the slide via the inlet and outlet wash ports on the gasket clamp. The microcapillary tip was then moved into position 50μm above the ROI. The local area of tissue around the ROI was washed by dispensing 100μL of buffer solution from the microcapillary. Then, the ROI was selectively illuminated with UV light to release the indexing oligos by coupling UV LED light with a digital mirror device (DMD) module (Andor, Mosaics3®). UV LED light was collimated to be reflected from the DMD surface into the microscope objective, and focused at the sample tissue (365nm, ~125mW/Cm2 or 385nm, ~800mW/Cm2; 6 second exposure for the protein assay). Each micro mirror unit in the DMD corresponds to ~1μm2 area of sample and reflects the UV light in a controlled pattern based on the ROl selection in the image. Following each UV illumination cycle, the eluent was collected from the local region via microcapillary aspiration and transferred to an individual well of a microtiter plate. Once all ROIs were processed, pools of released indexing oligos were hybridized to NanoString optical barcodes for digital counting and subsequently analyzed with an nCounter® Analysis System using the protocol below.
Sample preparation for protein profiling and IHC
Each selected primary antibody was coupled to a unique 70 bp indexing oligo (NanoString, custom conjugation service). All assays were performed on 5μm FFPE sections mounted onto charged slides. Deparaffinization and rehydration of tissue was performed by incubating slides in 3 washes of CitriSolv (Decon Labs, Inc., 1601) for 5 minutes each, 2 washes of 100% ethanol for 10 minutes each, 2 washes of 95% ethanol for 10 minutes each, and 2 washes of dH2O for 5 minutes each. Slides were then placed in a plastic Coplin jar containing 1X Citrate Buffer pH 6.0 (Sigma, C9999) and covered with a lid. The Coplin jar was placed into a pressure cooker (BioSB, BSB7008) and run on high pressure and temperature for 15 minutes. The Coplin jar was removed from the pressure cooker and cooled at room temperature for 25 minutes. Slides were washed with 5 changes of 1X TBS-T (Cell Signaling Technology, 9997) for 2 minutes each. Excess TBS-T was removed from the slide, and a hydrophobic barrier was drawn around each tissue section with a hydrophobic pen (Vector Laboratories, H-4000). Slides were then incubated with blocking buffer [1X TBS-T, 5% Goat Serum (Sigma-Aldrich, G9023–5ML), 0.1 mg/mL salmon sperm DNA (Sigma-Aldrich, D7656), and 10 mg/mL dextran sulfate (Sigma-Aldrich, 67578–5G)] for 1 hour. Slides were washed with 3 changes of 1X TBS-T for 2 minutes each. Primary antibodies were diluted in antibody diluent [Signal Stain Antibody Diluent (Cell Signaling Technology, 8112), 0.1 mg/mL salmon sperm DNA, and 10 mg/mL dextran sulfate]. Tissue sections were then covered with diluted primary antibody solution. Slides were incubated at 4°C in a humidity chamber overnight. Primary antibody was aspirated from slides and washed with 3 changes of 1X TBS-T for 10 minutes each. DNA was counterstained with 100 nM SYTO 83 (ThermoFisher, S11364) in 1X TBS-T for 15 minutes. Excess SYTO 83 was removed with 5 changes TBS-T, and slide was processed in an automated fashion on the instrument described above.
Custom masking
For each region of interest, 20x stacked tiff images of fluorescent CD45 (Alexa Fluor 647) and DNA (SYTO 83) were processed with ImageJ to create custom masks. Each stacked tiff was split into two images, and the CD45 image was manually thresholded to select positive cells. The thresholded CD45 image was converted to mask, image inverted, dilated, holes filled, inverted LUT, and then image inverted to create the final CD45 Mask (1st mask).
Hybridization assay set up
Hybridization of cleaved indexing oligos to fluorescent barcodes was performed using the nCounter Protein TagSet reagents (NanoString, 120100002). Indexing oligos were denatured at 95°C for 3 to 5 minutes and placed on ice for 2 minutes. A master mix was created by adding 70μL of hybridization buffer to the Protein TagSet tube. A 7μL aliquot of master mix was added to each of 12 hybridization tubes. Depending on the experiment, 2 to 8 μL denatured protein sample was added to each tube. Hybridizations were performed at 65°C overnight in a thermocycler with a 70°C heated lid to limit evaporation. After hybridization, samples were processed using the nCounter PrepStation and Digital Analyzer as per manufacturer instructions.
nCounter data analysis
Digital counts from barcodes corresponding to protein probes were analyzed as follows: raw counts were first normalized with internal spike-in controls (ERCCs) to account for system variation. IgG control counts from each ROI were subtracted to control for nonspecific antibody binding, values were then normalized by UV mask area. Average count density weighted by area of tissue assayed was calculated for CD45+ mask for each tissue.
DNA Extraction
Sections from paraffin embedded tissue or frozen tissues embedded in OCT were reviewed for pathologic diagnosis and dissected if necessary to ensure that ≥90% of the sample represented tumor. Total cellular DNA was isolated from FFPE tissue sections using the QIAmp FFPE DNA isolation kit according to the manufacturer’s protocol (Qiagen Inc, Hilden, Germany) following de-paraffinization and proteinase K treatment. The DNeasy blood and tissue kit was used for DNA isolation from frozen tissue according to the manufacturer’s protocol (Qiagen Inc, Hilden, Germany).
Whole Exome Sequencing
Patient-matched and time-matched peripheral blood leukocytes were used as germline DNA control. Exome capture was performed on 280 ng of genomic DNA per sample based on KAPA library prep (Kapa Biosystems) using the Agilent SureSelect Target Enrichment System kit according to the manufacturer’s instructions and paired-end multiplex sequencing of samples was performed on the Illumina HiSeq 2500 sequencing platform.
WES data processing
Raw output of the Illumina whole-exome sequencing data was processed using Illumina’s Consensus Assessment of Sequence And Variation (CASAVA) tool (v1.8.2) (http://support.illumina.com/sequencing/sequencing_software/casava.html) for demultiplexing and conversion to FASTQ format. The FASTQ files were aligned to the human reference genome (hg19) using BWA (v0.7.5)22 with 3 mismatches (2 mismatches must be in the first 40 seed regions) for a 76-base sequencing run. The aligned BAM files were then subjected to mark duplication, realignment and base recalibration using Picard (v1.112) and GATK (v3.1–1) software tools23. The generated BAM files were then used for downstream analysis. Genotyping quality check was performed to rule out any possible sample swapping or contamination. Briefly, germline SNPs were called using Platypus (v0.8.1)24. Samples from the same patient were confirmed/identified by the percentage of genotyping-identity between them, which was defined by the fraction of identical germline alleles among the overlapping SNPs between the two samples. All samples in this study passed quality check, and no sample swapping or contamination was detected.
Somatic mutation calling, filtering, and functional annotation
MuTect (v1.1.4) 25 was applied to identify somatic point mutations, and Pindel (v0.2.4) 26 was applied to identify small insertion and deletions (Indels). The MuTect and Pindel outputs were then run through our pipeline for filtering and annotation. Briefly, only MuTect calls marked as “KEEP” were selected and taken into the next step. For both substitutions and Indels, mutations with a low variant allelic fraction (VAF < 0.02) or had a low total read coverage (< 20 reads for tumor samples; <10 reads for germline sample), were removed. In addition, Indels that had an immediate repeat region within 25 base pairs downstream towards it 3’ region were also removed. After that, common variants reported by ExAc (the Exome Aggregation Consortium, http://exac.broadinstitute.org), Phase-3 1000 Genome Project (http://phase3browser.1000genomes.org/Homo_sapiens/Info/Index ), or the NHLBI GO Exome Sequencing Project (ESP6500, http://evs.gs.washington.edu/EVS/) with the minor allele frequency greater than 0.5% were removed. The intronic mutations, mutations at 3’ or 5’ UTR or UTR flanking regions, silent mutations, in-frame small insertions and deletions were also removed.
Mutation load calculation
The mutation load was calculated by counting the total number of somatic non-synonymous mutations identified in each sample.
T Cell Receptor Sequencing
T cell receptor (TCR) beta chain CDR3 regions were sequenced by ImmunoSeq™ (Adaptive Biotechnologies, Seattle, WA), with primers annealing to V and J segments, resulting in amplification of rearranged VDJ segments from each cell. Clonality and richness values were obtained through the ImmunoSeq Analyzer software. Clonality was measured as 1-(entropy)/log2(# of productive unique sequences), with entropy taking into account clone frequency. Differential abundance analysis was assessed using a modification of the DESeq R package, as previously described21, to identify clones that were significantly expanded or contracted from baseline to on-treatment time points. Morisita Overlap is a population overlap metric relating the dispersion of clones in the samples and was calculated through the ImmunoSeq Analyzer software. Significantly expanded clones from baseline to on-treatment were identified from the peripheral blood and then compared to clones in baseline tumor sample as well as on-treatment tumor sample to determine expansion of tumor restricted T cell clones.
Statistical Methods
A total of 20 patients in each arm were planned for enrolment. We assumed the pCR rate would be 5% for patients in Arm A and 15% for Arm B, based on extrapolation from RECIST CR rates in published studies7,27,28 which corresponds to the prior probability of 0.64 for at least 1 out of 20 patients experiencing the primary outcome event in Arm A and 0.96 for Arm B. Bayesian analyses for posterior probabilities of response used a prior beta distribution of (0.5, 0.5) (Supplementary Table 11).
Although the primary focus of the clinical trial was the assessment of the two treatment arms separately, statistical comparisons between both arms, and by response status, were performed to inform future studies. Associations between categorical measures and treatment arms were evaluated using Fisher’s exact test while differences in continuous measures between treatment arms were tested using the Mann-Whitney U test. PFS, RFS, DMFS, and OS were estimated using the Kaplan-Meier method and differences between groups were assessed using the log-rank test. Patients who were alive as of the data cut-off (May 9, 2018) were censored in the OS evaluation at the date of last contact, whereas those who were alive and had not developed an event as defined in each endpoint as of the data cut-off were censored in the PFS, RFS, and DMFS assessment. Clinical analyses were performed using SAS 9.4 for Windows while the biospecimen analyses were performed using GraphPad Prism 7. All statistical tests used an alpha value of 0.05 and were two-sided.
Supplementary Material
Acknowledgements:
We sincerely thank the patients and their families for participating in this clinical trial. The clinical aspects of this study were funded by Bristol-Myers Squibb. The correlative research was supported by the philanthropic contributions to The University of Texas MD Anderson Cancer Center Melanoma Moon Shot Program, The Parker Institute for Cancer Immunotherapy, and U.S. Department of Defense Grant CA150619.
Footnotes
Reporting summary:
Further information on experimental design is available in the Nature Research Reporting Summary linked to this article.
Data Availability:
The authors declare that the data supporting the findings of this study are available within the paper and its supplementary information files. Whole exome sequencing, T cell receptor sequencing, and Nanostring digital spatial profiling data are available from the European Genome-phenome Archive under accession number EGAS00001002698.
Competing Interests: R.N.A. reports grants from Merck, Bristol-Myers Squibb and Array Biopharma, all outside the submitted work. S.M.R. received support from National Institutes of Health T32 Training Grant T32 CA 009666, outside the submitted work. H.A.T. reports personal fees from Novartis, grants from Merck and Celgene, and grants and personal fees from BMS and Genentech, all outside of the submitted work. M.A.D. reports personal fees from Novartis, BMS and Vaccinex, grants from AstraZeneca and Merck, and grants and personal fees from Roche/Genentech and Sanofi-Aventis, all outside the submitted work. W.-J.H. reports research grants from Merck, Bristol-Myers Squibb, MedImmune, GlaxoSmithKline and has served on an advisory board for Merck, all outside the submitted work. M.K.W. reports personal fees from Merck and EMD Serono, outside the submitted work. J.G. reports advisory board participation with Merck and Castle Biosciences. A.J.L. reports personal fees from BMS, personal fees from Novartis, personal fees from Genentech / Roche, personal fees and non-financial support from ArcherDX, personal fees and non-financial support from Beta-Cat, grants and non-financial support from Medimmune / AstraZeneca, personal fees from Merck, grants and non-financial support from Sanofi, grants, personal fees and non-financial support from Janssen, all outside the submitted work. V.G. reports US patent (PCT/US17/53,717), consultant fees from Microbiome DX, and honoraria from CAP18, outside of the submitted work. A.R. reports US patent (PCT/US17/53,717) and is supported by the Kimberley Clark Foundation Award for Scientific Achievement provided by MD Anderson’s Odyssey Fellowship Program. M.C.A. is supported by the National Health and Medical Research Council of Australia CJ Martin Early Career Fellowship (#1148680), and reports advisory board participation, travel support and honoraria from Merck Sharpe and Dohme. C.N.S. reports US patent (PCT/US17/53,717), outside of the submitted work. P.S. reports consultant or advisor fees from Bristol-Myers Squibb, GlaxoSmithKline, AstraZeneca, Amgen, Jounce, Kite Pharma, Neon, Evelo, EMD Serono, and Astellas, during the conduct of the study; stock from Jounce, Kite Pharma, Evelo, Constellation, Neon, outside the submitted work; and has a patent licensed to Jounce, outside the submitted work. M.T.T. reports personal fees from Myriad Genetics, Seattle Genetics and Novartis, all outside the submitted work. J.A.W. reports US patent (PCT/US17/53,717), has received compensation for speaker’s bureau and honoraria from Dava Oncology, Bristol-Myers Squibb and Illumina and has served on advisory committees for GlaxoSmithKline, Roche/Genentech, Novartis and AstraZeneca. All other authors declare no competing interests.
REFERENCES
- 1.Liu J, et al. Improved Efficacy of Neoadjuvant Compared to Adjuvant Immunotherapy to Eradicate Metastatic Disease. Cancer discovery 6, 1382–1399 (2016). [DOI] [PubMed] [Google Scholar]
- 2.Gershenwald JE, et al. Melanoma staging: Evidence-based changes in the American Joint Committee on Cancer eighth edition cancer staging manual. CA Cancer J Clin 67, 472–492 (2017). [DOI] [PMC free article] [PubMed] [Google Scholar]
- 3.Eggermont AMM, Suciu S & Testori A Ipilimumab Adjuvant Therapy in Melanoma. The New England journal of medicine 376, 399 (2017). [DOI] [PubMed] [Google Scholar]
- 4.Weber J, et al. Adjuvant Nivolumab versus Ipilimumab in Resected Stage III or IV Melanoma. The New England journal of medicine 377, 1824–1835 (2017). [DOI] [PubMed] [Google Scholar]
- 5.Eggermont AMM, et al. Adjuvant Pembrolizumab versus Placebo in Resected Stage III Melanoma. The New England journal of medicine 378, 1789–1801 (2018). [DOI] [PubMed] [Google Scholar]
- 6.Larkin J, et al. Combined Nivolumab and Ipilimumab or Monotherapy in Untreated Melanoma. The New England journal of medicine 373, 23–34 (2015). [DOI] [PMC free article] [PubMed] [Google Scholar]
- 7.Wolchok JD, et al. Overall Survival with Combined Nivolumab and Ipilimumab in Advanced Melanoma. The New England journal of medicine 377, 1345–1356 (2017). [DOI] [PMC free article] [PubMed] [Google Scholar]
- 8.Amaria RN, et al. Neoadjuvant plus adjuvant dabrafenib and trametinib versus standard of care in patients with high-risk, surgically resectable melanoma: a single-centre, open-label, randomised, phase 2 trial. The Lancet. Oncology (2018). [DOI] [PubMed] [Google Scholar]
- 9.Forde PM, et al. Neoadjuvant PD-1 Blockade in Resectable Lung Cancer. The New England journal of medicine (2018). [DOI] [PubMed] [Google Scholar]
- 10.Edge SB & American Joint Committee on Cancer. AJCC cancer staging manual, (Springer, New York, 2010). [DOI] [PubMed] [Google Scholar]
- 11.Chen PL, et al. Analysis of Immune Signatures in Longitudinal Tumor Samples Yields Insight into Biomarkers of Response and Mechanisms of Resistance to Immune Checkpoint Blockade. Cancer discovery 6, 827–837 (2016). [DOI] [PMC free article] [PubMed] [Google Scholar]
- 12.Roh W, et al. Integrated molecular analysis of tumor biopsies on sequential CTLA-4 and PD-1 blockade reveals markers of response and resistance. Sci Transl Med 9(2017). [DOI] [PMC free article] [PubMed] [Google Scholar]
- 13.Eggermont AM, et al. Prolonged Survival in Stage III Melanoma with Ipilimumab Adjuvant Therapy. The New England journal of medicine 375, 1845–1855 (2016). [DOI] [PMC free article] [PubMed] [Google Scholar]
- 14.Long GV, et al. Adjuvant Dabrafenib plus Trametinib in Stage III BRAF-Mutated Melanoma. The New England journal of medicine 377, 1813–1823 (2017). [DOI] [PubMed] [Google Scholar]
- 15.Huang AC, e.a.A.C.P.a.A.A.f.C.R.A.M.A.−., 2018; Chicago. [Google Scholar]
- 16.Tumeh PC, et al. PD-1 blockade induces responses by inhibiting adaptive immune resistance. Nature 515, 568–571 (2014). [DOI] [PMC free article] [PubMed] [Google Scholar]
- 17.Inoue H, et al. Intratumoral expression levels of PD-L1, GZMA, and HLA-A along with oligoclonal T cell expansion associate with response to nivolumab in metastatic melanoma. Oncoimmunology 5, e1204507 (2016). [DOI] [PMC free article] [PubMed] [Google Scholar]
- 18.Eisenhauer EA, et al. New response evaluation criteria in solid tumours: revised RECIST guideline (version 1.1). European journal of cancer 45, 228–247 (2009). [DOI] [PubMed] [Google Scholar]
- 19.Provenzano E, et al. Standardization of pathologic evaluation and reporting of postneoadjuvant specimens in clinical trials of breast cancer: recommendations from an international working group. Modern pathology : an official journal of the United States and Canadian Academy of Pathology, Inc 28, 1185–1201 (2015). [DOI] [PubMed] [Google Scholar]
- 20.NCI. National Cancer Institute Common Terminology Criteria for Adverse Events (CTCAE), version 4.0. (2009).
- 21.Cha E, et al. Improved survival with T cell clonotype stability after anti-CTLA-4 treatment in cancer patients. Sci Transl Med 6, 238ra270 (2014). [DOI] [PMC free article] [PubMed] [Google Scholar]
- 22.Li H & Durbin R Fast and accurate short read alignment with Burrows-Wheeler transform. Bioinformatics 25, 1754–1760 (2009). [DOI] [PMC free article] [PubMed] [Google Scholar]
- 23.DePristo MA, et al. A framework for variation discovery and genotyping using next-generation DNA sequencing data. Nat Genet 43, 491–498 (2011). [DOI] [PMC free article] [PubMed] [Google Scholar]
- 24.Rimmer A, et al. Integrating mapping-, assembly- and haplotype-based approaches for calling variants in clinical sequencing applications. Nat Genet 46, 912–918 (2014). [DOI] [PMC free article] [PubMed] [Google Scholar]
- 25.Cibulskis K, et al. Sensitive detection of somatic point mutations in impure and heterogeneous cancer samples. Nat Biotechnol 31, 213–219 (2013). [DOI] [PMC free article] [PubMed] [Google Scholar]
- 26.Ye K, Schulz MH, Long Q, Apweiler R & Ning Z Pindel: a pattern growth approach to detect break points of large deletions and medium sized insertions from paired-end short reads. Bioinformatics 25, 2865–2871 (2009). [DOI] [PMC free article] [PubMed] [Google Scholar]
- 27.Topalian SL, et al. Safety, activity, and immune correlates of anti-PD-1 antibody in cancer. The New England journal of medicine 366, 2443–2454 (2012). [DOI] [PMC free article] [PubMed] [Google Scholar]
- 28.Wolchok JD, et al. Nivolumab plus ipilimumab in advanced melanoma. The New England journal of medicine 369, 122–133 (2013). [DOI] [PMC free article] [PubMed] [Google Scholar]
Associated Data
This section collects any data citations, data availability statements, or supplementary materials included in this article.