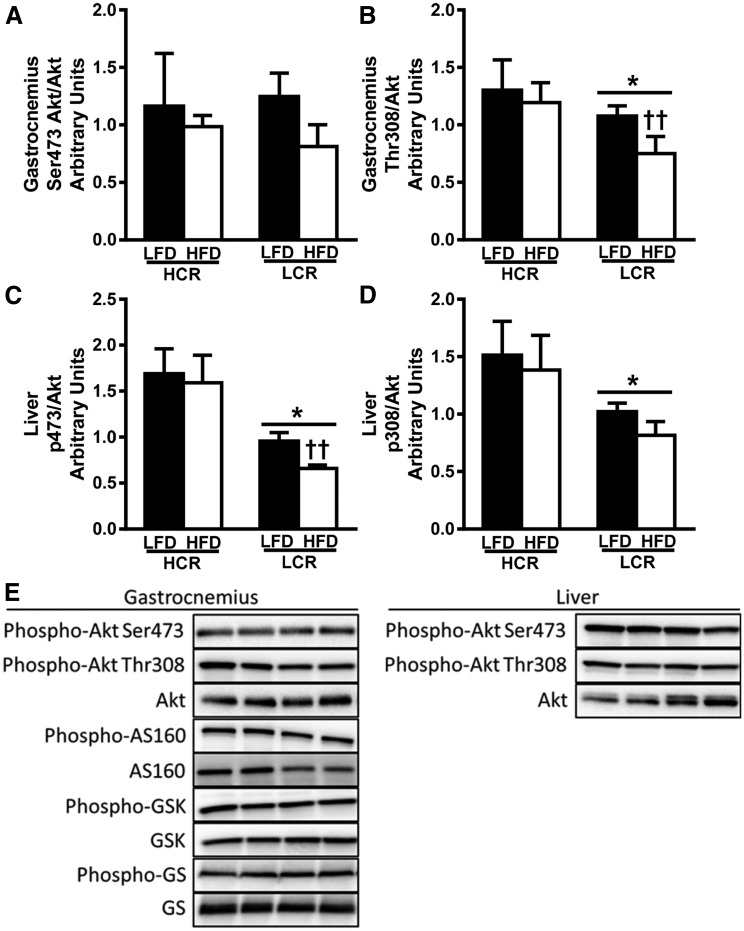
Figure 5.
Gastrocnemius and liver insulin signaling are reduced following acute insulin stimulation in LCR rats. (A–D) Insulin-stimulated activation of Akt was determined by western blot as the phosphorylation state of Ser473 or Thr308 relative to total Akt expression for gastrocnemius [(A) and (B), respectively] and liver [(C) and (D), respectively] following acute insulin bolus. (E) Representative blots. Values are expressed as means ± SEM (n = 4 to 7). *P < 0.05 for main effect HCR rats vs LCR rats; ††P < 0.05 for LFD vs HFD within strain.

