

Abstract
Purpose.
The objective of the current study was to explore the efficacy of using pH-weighted amine CEST-EPI as a potential non-invasive imaging biomarker for treatment response and/or failure in recurrent GBM patients treated with bevacizumab.
Methods.
A total of 11 patients with recurrent GBM treated with bevacizumab were included in this prospective study. CEST-EPI, perfusion MRI, and standardized anatomic MRI were obtained in patients before and after bevacizumab administration. CEST-EPI measures of magnetization transfer ratio asymmetry (MTRasym) at 3ppm were used for pH-weighted imaging contrast. Multiple measures were examined for their association with progression-free survival (PFS).
Results.
Tumor acidity, measured with MTRasym at 3ppm, was significantly reduced in both contrast enhancing and non-enhancing tumor after bevacizumab (p=0.0002 and p<0.00001, respectively). The reduction in tumor acidity in both contrast enhancing and non-enhancing tumor was linearly correlated with PFS (p=0.044 and p=0.00026, respectively). In 9 of the 11 patients, areas of residual acidity were localized to areas of tumor recurrence, typically around 2 months prior to radiographic progression. Univariate (p=0.006) and multivariate Cox regression controlling for age (p=0.009) both indicated that change in tumor acidity (ΔMTRasym at 3ppm) was a significant predictor of PFS.
Conclusions.
This pilot study suggests pH-weighted amine CEST MRI may have value as a non- invasive, early imaging biomarker for bevacizumab treatment response and failure. Early decreases MTRasym at 3.0ppm in recurrent GBM after bevacizumab may be associated with better PFS. Residual or emerging regions of acidity may colocalize to the site of tumor recurrence.
Keywords: pH-weighted imaging, bevacizumab, recurrent GBM, glioblastoma, CEST
INTRODUCTION
Glioblastoma (GBM) represents for 56.6% of gliomas and 14.7% of all primary central nervous system tumors [1]. GBM is an aggressive form of brain tumor with median overall survival (OS) around 15 months despite the intensive standard of care therapy, including gross surgical resection followed by radiation therapy (RT) and concurrent temozolomide (TMZ) chemotherapy [2]. With novel treatment modality such as tumor treating fields (TTF), OS for newly diagnosed GBM patients can be further improved to 19.6 months [3].
One of the distinguishing features of GBM over lower grade gliomas is the extent of tumor angiogenesis. Neovascularization is promoted through overexpression of multiple proangiogenic factors, including vascular endothelial growth factor (VEGF) [4]. Bevacizumab, a monoclonal antibody against VEGF-A, was approved by the Food and Drug Administration for the treatment of recurrent GBM in 2009 based on the ability to improve progression-free survival (PFS); however, subsequent studies have not demonstrated an overall survival (OS) benefit [5]. Regardless, bevacizumab remains one of the most widely used therapies for recurrent GBM and almost all patients with GBM are exposed to bevacizumab at some time during their treatment in the United States.
Early and accurate assessment of GBM treatment response can be beneficial for individualized treatment planning. However, conventional MRI response criteria (the RANO criteria based on bidimensional measurement of contrast enhancing tumor [6]) can fail to provide accurate assessment of tumor burden when treated with anti-angiogenic agents due to the reduction in contrast enhancement resulting from decreased permeability of the blood-brain barrier and not due to direct tumor destruction or lead to meaningful clinical benefit [7]. Altough some strategies have suggested contrast enhancing tumor burden can be accurately quantified (e.g. T1 subtraction maps [8]), alternative imaging biomarkers focusing on tumor metabolism may be desirable to identify early bevacizumab response and failure.
Since the vasculature of GBM is tortuous, disorganized, and highly permeable [9], intratumoral hypoxia and acidity can often occur [10]. Apart from these vascular abnormalities and hypoxia, enhanced metabolism and shifted glucose utilization toward glycolysis (i.e. the Warburg effect) also contributes to tumor acidosis through lactic acid accumulation [11]. Imaging biomarkers sensitive to extracellular pH changes may provide a noninvasive measure of this abnormal metabolism, potentially predicting early treatment response and therapeutic benefit. Chemical exchange saturation transfer (CEST) is an advanced MRI technique that detects metabolites with increased sensitivity, by continuous saturation of hydrogen proton on target metabolite and its exchange with water proton. The attenuation of water proton signal allows for an indirect measurement of relative concentration of target metabolite and the exchange rate [12]. Previous studies have suggested that pH sensitive amine CEST contrast can be obtained by directly targeting the base-catalyzed exchange process between amine and water protons [13]. Therefore, in the current pilot study, we hypothesized that amine CEST-EPI, a fast pH-weighted molecular MRI technique, can serve as a potential non-invasive imaging biomarker for treatment response and/or failure in recurrent GBM patients treated with bevacizumab.
METHODS
Patients
A total of 11 patients with recurrent GBM (nine males and two females) from the ages of 29 to 75 years old undergoing bevacizumab treatment (with or without adjuvant chemotherapy or immunotherapy) were included in this retrospective study. All patients were provided informed, written consent to participate in advanced imaging and our internal review board–approved research database. All diagnoses were determined histopathologically after surgical resection or biopsy, according to the 2016 WHO classification of CNS tumors [14]. More detailed patient information is in Table 1. Progression was defined prospectively by the treating neuro-oncologists, if subsequent scans showed definite increase in imaging-evaluable tumor (≥25% increase in the sum of enhancing lesions, new enhancing lesions >1 cm2, or an unequivocal qualitative increase in non-enhancing tumor or unequivocal new area of non-contrast enhancing tumor). Patients who died before evidence of imaging progression were defined to have progressed on the date of death. PFS was defined as the time from the start of bevacizumab treatment to radiographic and/or clinical progression. OS was not included in the analysis since few patients expired by the time of data censoring (December, 2018).
Table 1.
Patient Information
| Patient # | Age | Sex | Diagnosis | Treatment |
|---|---|---|---|---|
| 1 | 64 | M | GBM 1st recurrence | Bevacizumab + adjuvant immunotherapy* |
| 2 | 45 | M | GBM 1st recurrence | Bevacizumab + adjuvant immunotherapy* |
| 3 | 55 | M | GBM 1st recurrence | Bevacizumab + adjuvant immunotherapy* |
| 4 | 61 | M | GBM 1st recurrence | Bevacizumab + adjuvant immunotherapy* |
| 5 | 75 | M | GBM 1st recurrence | Bevacizumab + adjuvant immunotherapy* and chemotherapy† |
| 6 | 55 | F | GBM 1st recurrence | Bevacizumab + adjuvant chemotherapy† |
| 7 | 40 | M | GBM 1st recurrence | Bevacizumab |
| 8 | 29 | F | GBM 5th recurrence | Bevacizumab + other treatment‡ |
| 9 | 32 | M | GBM 4th recurrence | Bevacizumab + adjuvant chemotherapy† |
| 10 | 52 | M | GBM 1st recurrence | Bevacizumab |
| 11 | 62 | M | GBM 1st recurrence | Bevacizumab + adjuvant immunotherapy* |
Immunotherapy includes Durvalumab, Pembrolizumab, Osimertinib.
Chemotherapy includes Lomustine, Carboplatin.
Other treatment includes TOCA 511 + 5-FC.
Anatomic MRI
In addition to amine CEST-EPI, all patients received the anatomic images according to the international standardized brain tumor imaging protocol [15], including T2-weighted fluid attenuated inversion recovery (FLAIR) images, T2-weighted turbo spin-echo images, diffusion-weighted images, and parameter matched, 1-mm isotropic 3D T1-weighted MPRAGE scans before and following injection of 0.01mg/kg Gd-DTPA and DSC-MRI. The DSC-MRI data was motion-corrected and post-processed with a bidirectional leakage correction algorithm [16] to generate the relative cerebral blood volume (rCBV) maps. All images were registered to post- contrast T1-weighted images for subsequent analyses.
pH-Weighted Amine CEST-EPI
All patients received pH-weighted amine CEST MRI before and after bevacizumab treatment. Amine CEST-EPI was collected on Siemens 3T scanner (Prisma or Skyra, software versions VE11A-C; Erlangen, Germany) with a previously described CEST-EPI [13] or CEST- SAGE-EPI sequence [17]. CEST MR acquisition parameters include: field-of-view (FOV) = 240×217mm, matrix size = 128×116, slice thickness = 4 mm with no interslice gap, TE = 27ms for single-echo CEST-EPI and 14.0 ms and 34.1ms for the two gradient echoes using CEST- SAGE-EPI, bandwidth=1628 Hz, and GRAPPA factor = 2 for single-echo CEST-EPI and 3 for CEST-SAGE-EPI. Off-resonance saturation was applied using a pulse train of 3×100ms Gaussian pulses with peak amplitude of 6µT. A total of 29 off-resonance frequencies were sampled at −3.5 to −2.5ppm, −0.3 to +0.3ppm, and +2.5 to +3.5ppm, with increments of 0.1ppm. A reference S0 scan was collected with the same acquisition parameters, without the saturation pulses. The total scan time for CEST EPI was approximately 7.5 minutes.
Clinical post-processing of CEST-EPI consists of affine motion correction (mcflirt; FSL, FMRIB, Oxford, United Kingdom) and B0 correction via a z-spectra based k-means clustering and Lorentzian fitting algorithm [18]. An integral of width of 0.4 ppm was then taken around both the −3.0 and +3.0 ppm (−3.2 to −2.8 and +2.8 to +3.2, respectively) spectral points of the inhomogeneity-corrected data. These data points were combined with the S0 image to calculate the asymmetry in the magnetization transfer ratio (MTRasym) at 3.0 ppm as defined by equation MTRasym(ω) = S(−ω)/S0 − S(ω)/S0, where ω is the offset frequency of interest (3.0ppm). For data from CEST-SAGE-EPI acquisition, the average MTRasym at 3.0 ppm calculated from the first (TE = 14.0 ms) and second (TE = 34.1 ms) gradient echoes were averaged to increase the SNR of the resulting MTRasym images. All resulting maps were registered to high-resolution post-contrast T1-weighted images for subsequent analyses.
Data Analysis and Statistics
All calculations and statistical analysis were performed with MATLAB software (Version R2017b, Mathworks, Inc., Natick, MA, USA). The T2/FLAIR hyperintense lesion (T2 lesion) and contrast enhancing lesion (CE lesion) regions of interest (ROIs) were semi-automatically defined as previously described [7, 8], using the Analysis of Functional NeuroImages (AFNI) software (NIMH Scientific and Statistical Computing Core; Bethesda, MD, USA). Briefly, the general regions of tumor on T2/FLAIR and post-contrast T1-weighted images were first defined manually. Then, FLAIR images and T1-weighted subtraction map images were thresholded by using an empirical threshold to best define the extent of abnormality. Finally, the resulting masks were edited manually to exclude obvious errors. In all ROIs, the median of MTRasym at 3.0ppm was calculated for further analysis. A paired t-test was used to evaluate the difference in MTRasym and tumor volumes before and after bevacizumab treatment. Spearman’s rank correlation test was performed to evaluate the correlation between MTRasym response and volume response, as well as between MRI metrics and patient outcome (PFS). Univariate Cox regression analysis was performed to assess the effect of MRI metrics (baseline, follow-up, and change) as risk factors on PFS. Additional multivariate Cox regression analysis was performed by adding age into the regression model. For the significant risk factors, a Kaplan-Meier log-rank test was used to compare the PFS rate. Difference or correlation was considered significant when p-value is less than 0.05.
RESULTS
Tumor Volume and pH-weighted MTRasym at Baseline and at Follow-up
Volumes of T2 lesions and CE lesions, as well as the median MTRasym within T2 lesions and CE lesions, were quantified for each patient before (median 2 days) and after (median 43 days) bevacizumab treatment. Example anatomic MRI images and MTRasym images from three patients are demonstrated in Figure 1.
Figure 1.

Three patient examples (A: patient #4, B: patient #8, C: patient #11) are demonstrated, with anatomic images (FLAIR and post-contrast T1-weighted images, T1+C) and pH-weighted CEST-EPI images of MTRasym at 3.0ppm at three time points: pre-bevacizumab (baseline), post- bevacizumab (follow-up), and the time of tumor recurrence. Baseline T2 lesion ROIs used for volume and median MTRasym calculation are outlined in red (on FLAIR and post-contrast T1-weighted images) and black (on MTRasym images). The red arrows demonstrate co-localization of residual or new emerging areas of high acidity (MTRasym at 3ppm) at the post-treatment time point and corresponding location of tumor recurrence approximately 2 months later.
At the pre-bevacizumab baseline, the median T2 lesion and CE lesion volumes were 121.1mL (interquartile range [IQR] 110.2–152.2mL) and 17.8mL (IQR 10.7–24.5mL), compared to 46.9mL (IQR 39.7–79.2mL) and 3.57mL (IQR 2.60–8.14mL) at the first follow-up after bevacizumab administration. The relative decrease in volume was significant in both T2 lesion (median 53.5%, IQR 32.8%−66.5%, p = 0.00094, Figure 2(A)) and CE lesion (median 71.4%, IQR 49.2%−84.0%, p = 0.0014, Figure 2(D)). The MTRasym at 3.0ppm after administration of bevacizumab (T2 lesion median 1.30%, IQR 1.13–1.35%; CE lesion median 1.50%, IQR 1.29– 1.89%) was also significantly lower than in pre-treatment lesion measurements (T2 lesion median 1.72%, IQR 1.53–1.80%; CE lesion median 2.24%, IQR 2.15–2.55%), with a median reduction of 24.45% in T2 lesions (IQR 18.39–32.36%, p = 5.4e-6, Figure 2(B)) and 38.01% in CE lesions (IQR 13.41–43.41%, p = 0.00022, Figure 2(E)). The percentage change in MTRasym at 3ppm was strongly correlated with the percentage change in tumor volume (T2 lesion: r = 0.67, p = 0.028; CE lesion: r = 0.82, p = 0.0037; Figure 2(C, F)).
Figure 2.

Paired comparisons of pre- and post-bevacizumab volume response (A, D) and MTRasym at 3.0ppm response (B, E) are plotted. (C) and (F) illustrates the correlation between percentage change in MTRasym at 3ppm and change in volume. Each data point represents one patient, color coded with the order of progression free survival (PFS) length, with light gray representing the shortest PFS and black representing the longest PFS. The correlation test was performed with Spearman’s rank correlation.
Association between pH-weighted MTRasym and Progression-Free Survival
Next, the linear association between change in MRI measurements after bevacizumab and patient outcomes in terms of PFS were examined. A strong negative correlation between change in MTRasym at 3ppm and PFS was observed in both T2 lesions (r = −0.89, p = 0.00026, Figure 3(A)) and CE lesions (r = −0.62, p = 0.044, Figure 3(D)). Post-treatment MTRasym at 3ppm in T2 lesions were also negatively correlated with PFS (r = −0.79, p = 0.0036, Figure 3(B)), although this association was not observed in CE lesions (r = −0.57, p = 0.060, Figure 3(E)). No significant correlations were found between pre-treatment MTRasym at 3ppm and PFS (Figure 3(C, F)).
Figure 3.
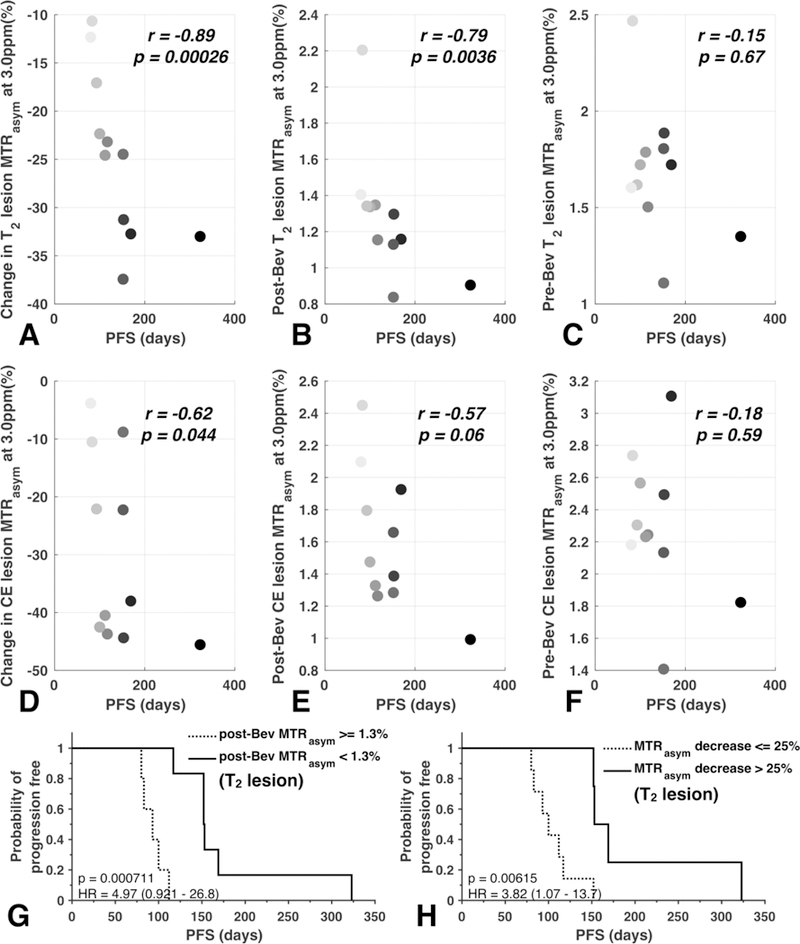
Correlations between PFS and MTRasym features are shown, including change in MTRasym at 3ppm (A, D), post-bevacizumab MTRasym at 3ppm (B, E), and pre-bevacizumab MTRasym at 3ppm (C, F). Each data point represents one patient, color coded with the order of progression free survival (PFS) length, with light gray representing the shortest PFS and black representing the longest PFS. (G) and (H) illustrate Kaplan-Meier survival curves of post-bevacizumab MTRasym at 3ppm and percentage change in MTRasym at 3ppm, both within the area of T2 hyperintensity.
Consistent with the results from the correlation analyses, univariate cox regression analysis also demonstrated a significant association between continuous measures of post-treatment MTRasym at 3ppm and PFS (Table 2; p =0.021, HR = 22.56, HR confidence interval [CI] 1.60–318.92), along with continuous measures of change in MTRasym at 3ppm after therapy in T2 lesions with PFS (p = 0.0064, HR = 1.34, HR-CI 1.09–1.65). Additionally, continuous measures of change in T2 lesion volume (p = 0.040, HR = 1.03, HR-CI 1.00–1.06) and post-treatment rCBV in T2 lesions (p = 0.029, HR = 24.24, HR-CI 1.40–420.33) were also significant using univariate analyses. Continuous measures of change in acidity within T2 lesions, as measured by MTRasym at 3ppm, were also predictive of PFS after accounting for age (Table 2; Cox multivariable regression, p = 0.0092, HR = 1.37, HR-CI 1.08–1.74), whereas the other previously predictors are no longer significant after accounting for age (change in T2 lesion volume: p = 0.10, HR = 1.02, HR-CI 1.00–1.05; post-treatment MTRasym at 3ppm: p = 0.05, HR = 18.47, HR-CI 0.97–330.54; post-treatment rCBV: p = 0.07, HR = 17.30, HR-CI 0.82–366.21). MRI measurements within or involving CE lesions were not significantly associated with PFS.
Table 2.
Cox Proportional-Hazards Model Analysis
| PFS (Univariate) | PFS (Multivariate) | |||||
|---|---|---|---|---|---|---|
| Characteristic | p-value | z-score | HR | p-value | z-score | HR |
| Volume | ||||||
| Baseline | 0.89 | −0.14 | 1.00 (0.98–1.02)* | 0.43 | −0.79 | 0.99 (0.96–1.02)* |
| Follow-up | 0.06 | 1.91 | 1.02 (1.00–1.04)* | 0.16 | 1.40 | 1.02 (0.99–1.04)* |
| Change | *0.04 | 2.06 | 1.03 (1.00–1.06)† | 0.10 | 1.64 | 1.02 (1.00–1.05)† |
| MTRasym | ||||||
| Baseline | 0.20 | 1.29 | 4.83 (0.44–52.95)† | 0.29 | 1.05 | 3.60 (0.33–39.25)† |
| Follow-up | *0.02 | 2.31 | 22.56 (1.60–318.92)† | 0.05 | 1.94 | 18.47 (0.97–330.54)† |
| Change | **0.006 | 2.73 | 1.34 (1.09–1.65)† | **0.009 | 2.61 | 1.37 (1.08–1.74)† |
| rCBV | ||||||
| Baseline | 0.06 | 1.91 | 6.69 (0.96–46.77)‡ | 0.09 | 1.67 | 5.51(0.75–40.68)‡ |
| Follow-up | *0.03 | 2.19 | 24.24 (1.40–420.33)‡ | 0.07 | 1.83 | 17.30 (0.82–366.21)‡ |
| Change | 0.92 | −0.09 | 1.00 (0.97–1.02)† | 0.71 | −0.37 | 0.99 (0.96–1.02)† |
HRs corresponding to 1mL increase.
HRs corresponding to 1% increase.
HRs corresponding to 1-unit increase.
Significance of p-value < 0.05, < 0.01, respectively
Patients with a post-bevacizumab MTRasym at 3ppm within T2 lesions greater than 1.3% had a significantly shorter PFS compared with patients exhibiting lower levels of acidity (Figure 3(G); Log-rank, p = 0.00071, HR = 4.97; median PFS of 152 days compared to 93 days). The log-rank test with cut-off value of 25% relative decrease in T2 lesion MTRasym showed significantly longer PFS in patients with larger decrease in T2 lesion MTRasym (median PFS of 153 days compared to 100 days, HR = 3.82, p = 0.0062, Figure 3(H)).
High Post-treatment MTRasym Predicts Tumor Recurrence Site
Interestingly, in patients who rapidly failed bevacizumab we observed regions of residual or newly emerging high acidity localized to areas of future tumor recurrence (Figure 1, observed in 9 out of 11 patients) occurring around two months prior to radiographic progression. Together with the general association between change in tumor acidity and PFS, these results suggest tumor acidity may be a more clinically meaningful measure of active tumor burden after treatment.
DISCUSSION
In the current study we present preliminary observations using pH-sensitive amine CEST-EPI as an imaging surrogate of early bevacizumab treatment response and early treatment failure. Results suggest larger decreases in tumor acidity, as measured by MTRasym at 3.0ppm, may be associated with better treatment outcome in recurrent GBM patients as measured by PFS, and residual or emergence of new regions of high acidity may provide spatial localization for subsequent tumor progression.
In GBM as with other malignant tumors, structurally abnormal blood vessels within the tumor contribute to spatial and temporal heterogeneity in tumor blood flow, which further leads to alterations in the tumor microenvironment, characterized by interstitial hypertension, hypoxia, and acidosis [19]. Successful vascular normalization after bevacizumab should theoretically improve the aberrant morphology of the tumor vessels, resulting in more efficient vasculature similar to normal vessels [20], thus alleviating excess interstitial hypoxia and acidity. We postulated pH-sensitive amine CEST-EPI could provide an indirect measurement of lactic acid accumulation as a result of abnormal vasculature and metabolism and therefore could serve as a clinical imaging biomarker for treatment response in patients treated with bevacizumab. The decrease in MTRasym at 3.0ppm may reflect improvement of tissue perfusion and normalization of tumor acidity, while high residual MTRasym may indicate the failure of bevacizumab or metabolically active tumor tissue.
The application of CEST MRI in brain tumors has drawn increasing research attention due to the fact that it provides unique information about in vivo tumor microenvironment, complimentary to standard MRI protocols. However, few studies have investigated the use of CEST MRI in GBM treatment response, and none focused specifically on anti-angiogenetic therapies or use of CEST contrast based primarily on fast exchanging amine protons. Sagiyama et al. showed that amide proton transfer (APT) imaging, a subset of CEST MRI resulring long irradiation times, was able to detect molecular signals in glioma induced by chemotherapy, preceding the morphologic changes, in orthotopic tumor mouse model of GBM. The APT signal was also able to differentiate tumors that were resistant to chemotherapy [21]. A more recent study using 7T CEST MRI in newly diagnosed GBM patients also demonstrated the prognostic ability of CEST to differentiate early-progressive and stable disease after first-line treatment [22]. However, none of these studies examined the treatment response in human recurrent glioblastoma patients at clinical field strengths (e.g. 3T).
While our findings may be unique, a significant number of potential imaging biomarkers for evaluation of anti-angiogenic therapies have emerged over the past decade. For example, studies have shown that the volumetric changes in tumor burden quantified using T1 subtraction may be useful for predicting PFS and OS in patients treated with bevacizumab [8]. Additionally, changes in dynamic susceptibility-weighted contrast-enhanced MRI (DSC-MRI) derived relative cerebral blood volume (rCBV) [16, 23] and DSC derived vascular components [24]; 18F- fluorothymidine (FLT) [25] and FDOPA positron emission tomography (PET) [26]; functional diffusion maps [27]; changes in tissue T2 [28]; and changes in MR spectroscopic imaging [29] (among many others) have also demonstrated additional value in predicting outcome in patients treated with bevacizumab. Thus, future work focused on determining which imaging techniques are the most sensitive or provide the best measure of potential therapeutic response to bevacizumab are warranted.
The current pilot study has several important limitations. First, the current results are strongly limited by the small patient number. However, despite the small number of patients, many of the results had adequate statistical power to support our conclusions. For example, the change in MTRasym within T2 hyperintense and CE lesions as a result of bevacizumab was large enough to have more than 99% statistical power (1-β ≈ 0.9985) despite the small sample size (Fig. 2B, E). Similarly, the linear correlation between MTRasym at 3ppm within the T2 hyperintense lesion and PFS was strong enough to result in more than 98% stastistical power (1- β ≈ 0.9818). Other associations that were found to be statistically significant, including the correlation between MTRasym at 3ppm within CE hyperintense lesions and PFS, lacked adequate statistical power (1-β ≈ 0.5333) due to the small sample size. Second, the retrospective nature of this study resulted in variability with regards to the timing between MRI exams and the start of treatment for each patient. While most patients (8/11) were treaded within 1 week of their pre-treatment MRI scan (and 6/11 treated within 2 days of their pre-treatment MRI scan), some patients (2/11) did not receive treatment for more than 2 weeks following their pre-treatment MRI exam. In a more ideal setting, it would be preferred to have a baseline scan and follow-up scans at rigidly prescribed time points for better consistency. In addition, the current study focused only on short-term patient benefit as measured by PFS, but did not focus on long-term survival, since many patients did not expire by the time of this study. It is important to note that while bevacizumab has been shown to prolong PFS in patients with recurrent glioblastoma, no difference in overall survival have been observed from that of more traditional chemotherapies [5]. However, a large number of studies using advanced imaging techniques have managed to predict long-term outcome in patients treated with bevacizumab [8, 16, 23, 25–29]. Thus, future studies focused on additional, clinically relevant long-term survival endpoints and additional patients are critical to confirm our initial findings.
CONCLUSION
In summary, pH-weighted amine CEST MRI appears to have potential to serve as a non-invasive, early imaging biomarker for bevacizumab treatment response and failure. Early decreases MTRasym at 3.0ppm in recurrent GBM after bevacizumab, suggesting reduction in tumor acidity, may be associated with better patient outcome (PFS). In addition, residual or emerging regions of high tumor acidity may provide valuable information regarding the site of tumor recurrence.
Acknowledgments
Funding: American Cancer Society (ACS) Research Scholar Grant (RSG-15–003-01-CCE) (Ellingson); University of California Research Coordinating Committee (Ellingson); UCLA Jonsson Comprehensive Cancer Center Seed Grant (Ellingson); UCLA SPORE in Brain Cancer (NIH/NCI 1P50CA211015–01A1) (Ellingson, Liau, Nghiemphu, Lai, Pope, Cloughesy); NIH/NCI 1R21CA223757–01 (Ellingson).
Footnotes
Compliance with Ethical Standards:
Conflict of Interest:
Ellingson – Advisory Board – Hoffman La-Roche; Siemens; Nativis; Medicenna; MedQIA; Bristol Meyers Squibb; Imaging Endpoints; Agios. Paid Consultant – Nativis; MedQIA; Siemens; Hoffman La-Roche; Imaging Endpoints; Medicenna; Agios. Grant Funding – Hoffman La- Roche; Siemens; Agios; Janssen. Dr. Ellingson also holds a patent on this technology (US Patent #15/577,664; International PCT/US2016/034886).
Cloughesy – Advisory Board - Roche/Genentech, Amgen, Tocagen, NewGen, LPath, Proximagen, Celgene, Vascular Biogenics Ltd, Insys, Agios, Cortice Bioscience, Pfizer, Human Longevity, BMS, Merck, Notable Lab, MedQIA
Ethical approval: All procedures performed in studies involving human participants were in accordance with the ethical standards of the institutional and/or national research committee and with the 1964 Helsinki declaration and its later amendments or comparable ethical standards.
Informed consent:
Informed consent was obtained from all individual participants included in the study.
REFERENCES
- 1.Ostrom QT, Gittleman H, Truitt G, Boscia A, Kruchko C, Barnholtz-Sloan JS: CBTRUS Statistical Report: Primary Brain and Other Central Nervous System Tumors Diagnosed in the United States in 2011–2015. Neuro-Oncology 20: 1–86, 2018 [DOI] [PMC free article] [PubMed] [Google Scholar]
- 2.Stupp R, Mason WP, van den Bent MJ, Weller M, Fisher B, Taphoorn MJ, Belanger K, Brandes AA, Marosi C, Bogdahn U, Curschmann J, Janzer RC, Ludwin SK, Gorlia T, Allgeier A, Lacombe D, Cairncross JG, Eisenhauer E, Mirimanoff RO, European Organisation for R, Treatment of Cancer Brain T, Radiotherapy G, National Cancer Institute of Canada Clinical Trials G: Radiotherapy plus concomitant and adjuvant temozolomide for glioblastoma. N Engl J Med 352: 987–996, 2005 [DOI] [PubMed] [Google Scholar]
- 3.Hottinger AF, Pacheco P, Stupp R: Tumor treating fields: a novel treatment modality and its use in brain tumors. Neuro-Oncology 18: 1338–1349, 2016 [DOI] [PMC free article] [PubMed] [Google Scholar]
- 4.Das S, Marsden PA: Angiogenesis in Glioblastoma. New Engl J Med 369: 1561–1563, 2013 [DOI] [PMC free article] [PubMed] [Google Scholar]
- 5.Chinot OL, Wick W, Mason W, Henriksson R, Saran F, Nishikawa R, Carpentier AF, Hoang-Xuan K, Kavan P, Cernea D, Brandes AA, Hilton M, Abrey L, Cloughesy T: Bevacizumab plus radiotherapy-temozolomide for newly diagnosed glioblastoma. N Engl J Med 370: 709–722, 2014 [DOI] [PubMed] [Google Scholar]
- 6.Wen PY, Macdonald DR, Reardon DA, Cloughesy TF, Sorensen AG, Galanis E, DeGroot J, Wick W, Gilbert MR, Lassman AB, Tsien C, Mikkelsen T, Wong ET, Chamberlain MC, Stupp R, Lamborn KR, Vogelbaum MA, van den Bent MJ, Chang SM: Updated Response Assessment Criteria for High-Grade Gliomas: Response Assessment in Neuro-Oncology Working Group. Journal of Clinical Oncology 28: 1963–1972, 2010 [DOI] [PubMed] [Google Scholar]
- 7.Ellingson BM, Cloughesy TF, Lai A, Nghiemphu PL, Mischel PS, Pope WB: Quantitative volumetric analysis of conventional MRI response in recurrent glioblastoma treated with bevacizumab. Neuro Oncol 13: 401–409, 2011 [DOI] [PMC free article] [PubMed] [Google Scholar]
- 8.Ellingson BM, Kim HJ, Woodworth DC, Pope WB, Cloughesy JN, Harris RJ, Lai A, Nghiemphu PL, Cloughesy TF: Recurrent glioblastoma treated with bevacizumab: contrast-enhanced T1-weighted subtraction maps improve tumor delineation and aid prediction of survival in a multicenter clinical trial. Radiology 271: 200–210, 2014 [DOI] [PMC free article] [PubMed] [Google Scholar]
- 9.Plate KH, Mennel HD: Vascular morphology and angiogenesis in glial tumors. Exp Toxicol Pathol 47: 89–94, 1995 [DOI] [PubMed] [Google Scholar]
- 10.Rong Y, Durden DL, Van Meir EG, Brat DJ: ‘Pseudopalisading’ necrosis in glioblastoma: a familiar morphologic feature that links vascular pathology, hypoxia, and angiogenesis. J Neuropathol Exp Neurol 65: 529–539, 2006 [DOI] [PubMed] [Google Scholar]
- 11.Kato Y, Ozawa S, Miyamoto C, Maehata Y, Suzuki A, Maeda T, Baba Y: Acidic extracellular microenvironment and cancer. Cancer Cell Int 13: 89, 2013 [DOI] [PMC free article] [PubMed] [Google Scholar]
- 12.Wu B, Warnock G, Zaiss M, Lin C, Chen M, Zhou Z, Mu L, Nanz D, Tuura R, Delso G: An overview of CEST MRI for non-MR physicists. EJNMMI Phys 3: 19, 2016 [DOI] [PMC free article] [PubMed] [Google Scholar]
- 13.Harris RJ, Cloughesy TF, Liau LM, Prins RM, Antonios JP, Li D, Yong WH, Pope WB, Lai A, Nghiemphu PL, Ellingson BM: pH-weighted molecular imaging of gliomas using amine chemical exchange saturation transfer MRI. Neuro Oncol 17: 1514–1524, 2015 [DOI] [PMC free article] [PubMed] [Google Scholar]
- 14.Louis DN, Perry A, Reifenberger G, von Deimling A, Figarella-Branger D, Cavenee WK, Ohgaki H, Wiestler OD, Kleihues P, Ellison DW: The 2016 World Health Organization Classification of Tumors of the Central Nervous System: a summary. Acta Neuropathologica 131: 803–820, 2016 [DOI] [PubMed] [Google Scholar]
- 15.Ellingson BM, Bendszus M, Boxerman J, Barboriak D, Erickson BJ, Smits M, Nelson SJ, Gerstner E, Alexander B, Goldmacher G, Wick W, Vogelbaum M, Weller M, Galanis E, Kalpathy-Cramer J, Shankar L, Jacobs P, Pope WB, Yang DW, Chung C, Knopp MV, Cha S, van den Bent MJ, Chang S, Al Yung WK, Cloughesy TF, Wen PY, Gilbert MR, Dev JBTD: Consensus recommendations for a standardized Brain Tumor Imaging Protocol in clinical trials. Neuro-Oncology 17: 1188–1198, 2015 [DOI] [PMC free article] [PubMed] [Google Scholar]
- 16.Leu K, Boxerman JL, Lai A, Nghiemphu PL, Pope WB, Cloughesy TF, Ellingson BM: Bidirectional Contrast agent leakage correction of dynamic susceptibility contrast (DSC)-MRI improves cerebral blood volume estimation and survival prediction in recurrent glioblastoma treated with bevacizumab. J Magn Reson Imaging 44: 1229–1237, 2016 [DOI] [PubMed] [Google Scholar]
- 17.Harris RJ, Yao J, Chakhoyan A, Raymond C, Leu K, Liau LM, Nghiemphu PL, Lai A, Salamon N, Pope WB, Cloughesy TF, Ellingson BM: Simultaneous pH-sensitive and oxygen-sensitive MRI of human gliomas at 3 T using multi-echo amine proton chemical exchange saturation transfer spin-and-gradient echo echo-planar imaging (CEST-SAGE-EPI). Magn Reson Med 80: 1962–1978, 2018 [DOI] [PMC free article] [PubMed] [Google Scholar]
- 18.Yao J, Ruan D, Raymond C, Liau LM, Salamon N, Pope WB, Nghiemphu PL, Lai A, Cloughesy TF, Ellingson BM: Improving B0 Correction for pH-Weighted Amine Proton Chemical Exchange Saturation Transfer (CEST) Imaging by Use of k-Means Clustering and Lorentzian Estimation. Tomography 4: 123–137, 2018 [DOI] [PMC free article] [PubMed] [Google Scholar]
- 19.Jain RK: Normalization of tumor vasculature: an emerging concept in antiangiogenic therapy. Science 307: 58–62, 2005 [DOI] [PubMed] [Google Scholar]
- 20.Winkler F, Kozin SV, Tong RT, Chae SS, Booth MF, Garkavtsev I, Xu L, Hicklin DJ, Fukumura D, di Tomaso E, Munn LL, Jain RK: Kinetics of vascular normalization by VEGFR2 blockade governs brain tumor response to radiation: role of oxygenation, angiopoietin-1, and matrix metalloproteinases. Cancer Cell 6: 553–563, 2004 [DOI] [PubMed] [Google Scholar]
- 21.Sagiyama K, Mashimo T, Togao O, Vemireddy V, Hatanpaa KJ, Maher EA, Mickey BE, Pan E, Sherry AD, Bachoo RM, Takahashi M: In vivo chemical exchange saturation transfer imaging allows early detection of a therapeutic response in glioblastoma. P Natl Acad Sci USA 111: 4542–4547, 2014 [DOI] [PMC free article] [PubMed] [Google Scholar]
- 22.Regnery S, Adeberg S, Dreher C, Oberhollenzer J, Meissner JE, Goerke S, Windschuh J, Deike-Hofmann K, Bickelhaupt S, Zaiss M, Radbruch A, Bendszus M, Wick W, Unterberg A, Rieken S, Debus J, Bachert P, Ladd M, Schlemmer HP, Paech D: Chemical exchange saturation transfer MRI serves as predictor of early progression in glioblastoma patients. Oncotarget 9: 28772–28783, 2018 [DOI] [PMC free article] [PubMed] [Google Scholar]
- 23.Kickingereder P, Wiestler B, Burth S, Wick A, Nowosielski M, Heiland S, Schlemmer HP, Wick W, Bendszus M, Radbruch A: Relative cerebral blood volume is a potential predictive imaging biomarker of bevacizumab efficacy in recurrent glioblastoma. Neuro Oncol 17: 1139–1147, 2015 [DOI] [PMC free article] [PubMed] [Google Scholar]
- 24.LaViolette PS, Cohen AD, Prah MA, Rand SD, Connelly J, Malkin MG, Mueller WM, Schmainda KM: Vascular change measured with independent component analysis of dynamic susceptibility contrast MRI predicts bevacizumab response in high-grade glioma. Neuro-Oncology 15: 442–450, 2013 [DOI] [PMC free article] [PubMed] [Google Scholar]
- 25.Chen W, Delaloye S, Silverman DH, Geist C, Czernin J, Sayre J, Satyamurthy N, Pope W, Lai A, Phelps ME, Cloughesy T: Predicting treatment response of malignant gliomas to bevacizumab and irinotecan by imaging proliferation with [18F] fluorothymidine positron emission tomography: a pilot study. J Clin Oncol 25: 4714–4721, 2007 [DOI] [PubMed] [Google Scholar]
- 26.Harris RJ, Cloughesy TF, Pope WB, Nghiemphu PL, Lai A, Zaw T, Czernin J, Phelps ME, Chen W, Ellingson BM: F-18-FDOPA and F-18-FLT positron emission tomography parametric response maps predict response in recurrent malignant gliomas treated with bevacizumab. Neuro-Oncology 14: 1079–1089, 2012 [DOI] [PMC free article] [PubMed] [Google Scholar]
- 27.Ellingson BM, Cloughesy TF, Lai A, Mischel PS, Nghiemphu PL, Lalezari S, Schmainda KM, Pope WB: Graded functional diffusion map-defined characteristics of apparent diffusion coefficients predict overall survival in recurrent glioblastoma treated with bevacizumab. Neuro-Oncology 13: 1151–1161, 2011 [DOI] [PMC free article] [PubMed] [Google Scholar]
- 28.Ellingson BM, Cloughesy TF, Lai A, Nghiemphu PL, Lalezari S, Zaw T, Motevalibashinaeini K, Mischel PS, Pope WB: Quantification of edema reduction using differential quantitative T2 (DQT2) relaxometry mapping in recurrent glioblastoma treated with bevacizumab. Journal of Neuro-Oncology 106: 111–119, 2012 [DOI] [PubMed] [Google Scholar]
- 29.Bohndiek SE, Kettunen MI, Hu DE, Brindle KM: Hyperpolarized C-13 Spectroscopy Detects Early Changes in Tumor Vasculature and Metabolism after VEGF Neutralization. Cancer Research 72: 854–864, 2012 [DOI] [PMC free article] [PubMed] [Google Scholar]