Abstract
Liver fatty acid binding protein (L-FABP) is the major fatty acid binding/”chaperone” protein in hepatic cytosol. Although fatty acids can be derived from the breakdown of dietary fat and glucose, relatively little is known regarding the impact of L-FABP on phenotype in the context of high dietary glucose. Potential impact was examined in wild-type (WT) and Lfabp gene ablated (LKO) female mice fed either a control or pair-fed high glucose diet (HGD). WT mice fed HGD alone exhibited decreased whole body weight gain and weight gain/kcal food consumed—both as reduced lean tissue mass (LTM) and fat tissue mass (FTM). Conversely, LKO alone increased weight gain, lean tissue mass, and fat tissue mass while decreasing serum β-hydroxybutyrate (indicative of hepatic fatty acid oxidation)—regardless of diet. Both LKO alone and HGD alone significantly altered the serum lipoprotein profile and increased triacylglycerol (TG), but in HGD mice the LKO did not further exacerbate serum TG content. HGD had little effect on hepatic lipid composition in WT mice, but prevented the LKO-induced selective increase in hepatic phospholipid, free-cholesterol and cholesteryl-ester. Taken together, these findings suggest that high glucose diet diminished the effects of LKO on the whole body and lipid phenotype of these mice.
Keywords: Liver, fatty acid binding protein, glucose, fructose
Graphical Abstract
INTRODUCTION
Elevated hepatic triacylglycerol (TG) is considered a hallmark of human non-alcoholic fatty liver disease (NAFLD), as determined primarily by magnetic resonance imaging (MRI) or by histology [1]. Relatively few studies have actually determined the hepatic lipid content or composition in NAFLD and determined actual levels of TG [2–5]. Fatty acids comprising hepatic TG are derived from two major sources. The majority (75%) are derived from dietary fat—i.e. released from dietary TG as non-esterified fatty acids (NEFA) into serum or within the liver [6]. Nearly a quarter are derived by de novo synthesis from two carbon units from dietary glucose, fructose, or amino acids [6]. In either case, fatty acids are highly membrane-bound due to their hydrophobicity, and thus require cytosolic binding/”chaperone” proteins for intracellular trafficking/targeting.
Liver fatty acid binding protein (L-FABP) is the major fatty acid chaperone protein in hepatic cytosol, facilitating uptake [7,8] and intracellular transport [9–13]. In short-term action, L-FABP directly targets bound exogenously derived fatty acids to the endoplasmic reticulum (ER) for synthesis of glycerides (e.g. phospholipids, triglycerides) and cholesteryl esters [7,14–16] and, more importantly, to mitochondria or peroxisomes for oxidation [9,17–19]. In longer-term action, L-FABP targets bound exogenously derived fatty acids into the nucleus, wherein the L-FABP/fatty acid complex directly interacts with peroxisome proliferator activated receptor-α (PPARα) to induce transcription of multiple genes in fatty acid uptake and oxidation [20–26]. While the impact of a high fat diet (HFD) on obesity and NAFLD has been examined extensively in rodents, most such studies were in males fed HFD ad libitum and either not fasted or fasted only for a very short time [27–37]. However, ad libitum feeding of a HFD does not discriminate between the known preference for and hyperphagy of HFD vs the proportion of dietary fat. However, more recent studies of paired feeding HFD significantly decreases both obesity-induced NAFLD and obese phenotype as well as markedly altering the impact of Lfabp gene ablation on the dietary phenotype of male and female mice [38,39].
In contrast, little is known regarding the effect of L-FABP on phenotype in the context of a high glucose diet (HGD). Earlier reports suggest that L-FABP may indeed impact the lipid phenotype of HGD-fed mice. In vitro studies with recombinant proteins have shown that: i) glucose directly interacts with L-FABP in vitro to influence its binding of fatty acids [40,41]; ii) glucose binds to PPARα to alter its binding of fatty acids [21]; and iii) L-FABP directly interacts with PPARα to induce a conformational change required for ligand transfer and transcriptional activation [20,23,41,42]. Furthermore, high glucose alters L-FABP/PPARα complex formation and induces conformation alterations [23,41,43,44]. Additionally, high glucose in the medium of cultured primary mouse hepatocytes from wild-type (WT), but not Lfabp gene-ablated mice (LKO), stimulates ligand-induced PPARα transcription of multiple genes in fatty acid uptake and oxidation [24,45]. However, little is known regarding the physiological relevance of these findings—especially in females.
Therefore, the impact of L-FABP on the lipid phenotype was examined in WT and LKO female mice pair-fed a high glucose diet (HGD). The results show that indeed LKO significantly alters the effects of pair-fed HGD on the lipid phenotype of female mice.
MATERIALS AND METHODS
Materials
Antibodies against ABCG5, ABCG8, ACOT1, ACOT7, ACOX1, ACSS2, AMPKa2, APO A1, APO B, Beta Actin (BA), CPT1A, CPT2, FABP1 (L-FABP), FABP2 (I-FABP), FATP4, GCK, HMGCR, HMGCS (cytosolic and mitochondrial), HNF4A, LDLR, LXRα, MAP17, MDR, MTP, RXRA, SR-B1, SREBP1, were purchased from Santa Cruz Biotechnology, Inc (Santa Cruz, CA). Antibodies against ACAT1, ACAT2, ACLY, ACSL1, APOE, BSEP/ABCB11, ChREBP, CYP4A14, ELOVL5, ELOVL6, FATP2, FATP5, G6Pase, GLUT2, IR, PCK1, and PDZK1/ACBP were obtained from Abcam (Cambridge, MA). Other antibodies were purchased as follows: catalase from Meridian Life Science, Inc. (Cincinnati, OH), peroxisome proliferator-activated receptor-α (PPARα; PA1–822A) from ThermoFisher Scientific (Rockford, IL), and 3aHSD from US Biological (Salem, MA). COX IV and GAPDH antibodies were from Life Technologies (Grand Island, NY) and Millipore (Billirica, MA), respectively. Antibodies to GOT, FABP1, SCP2, p-thiolase, and SCPx were prepared as described [46,47].
Animals
All animal protocols were approved by the Institutional Animal Care and Use Committee (IACUC) at Texas A&M University. As described previously, the L-FABP (−/−) mice were generated by homologous recombination deleting all four exons of the L-FABP gene [8] and were maintained on a C57BL/6NCr background to N11 generation (99.95% homogeneity). The wild-type (WT) age-matched female inbred C57BL/6NCr mice were obtained from the National Cancer Institute (Frederick Cancer Research and Developmental Center, Maryland). Prior to the start of the dietary studies, the mice were housed for one week in individual ventilated cage (3–5 animals per cage) with a 12 hr light/dark cycle in a room temperature-controlled facility (25°C) and had ad libitum access to a fixed formula rodent diet (Harlan Teklad Rodent Diet 8604, Madison, WI, USA) and water. Monitoring was accomplished by the presence of sentinels quarterly which were found negative for all known mouse pathogens.
Diet Composition
Defined high glucose diet (HGD) and control pelleted diets were isocaloric, with caloric value of 3.85 kcal/g diet, were obtained commercially from Research Diets, Inc. (New Brunswick, NJ). Both custom diets consisted of 20, 70, and 10 kcal% protein, carbohydrate and fat, respectively, with no significant amounts of phytol or phytoestrogen. Carbohydrates in the control diet (D09010501) were: corn starch (linear and branched polymers of glucose; 660 kcal), maltodextrin 10 (linear polymer of glucose; 140 kcal), sucrose (disaccharide comprised of equal parts of glucose and fructose; 1140 kcal), additional fructose (860 kcal), and dextrose (0 kcal) resulting in 1370 kcal total glucose. Carbohydrates in high glucose diet (HGD, D09010503,) were: corn starch (660 kcal), maltodextrin 10 (140 kcal), sucrose (0 kcal), fructose (620 kcal), and dextrose (1380 kcal)—resulting in 2180 kcal total glucose. Thus the HGD had 1.6-fold more total glucose at the expense of 57% less total fructose.
Dietary Study
Female mice were housed individually in microisolator cages with wire grid tops designed for holding the pelleted food. The mice aged 9 wks were switched from standard rodent chow (Harlan Teklad Rodent Diet 8604, Madison, WI, USA) to a defined control pelleted diet (D09010501, Research Diets, Inc., New Brunswick, NJ) the week before the initiation of the dietary study. Just before the initiation of the dietary study, mice underwent dual-energy X-ray absorptiometry (DEXA) analysis as described below.
The mice were divided into two paired groups of sixteen mice each of L-FABP (−/−) mice and L-FABP (+/+) mice. Within each of the pair-fed groups, eight mice were fed the control pelleted diet while eight were fed the high glucose pelleted diet (HGD). During the twelve-week dietary study, the food intake of each group was paired to within a non-significant margin, by giving the high-glucose group the same amount of food consumed by the paired control group from the previous day. Weight and food intake were measured daily at the same time of day, with food consumption determined by weighing the residual pellets within the wire grid tops as well as from the bedding. The mean food consumption was calculated within each group.
Following the study, the mice were fasted overnight (12h), weighed, and anesthetized by intraperitoneal (IP) injection of ketamine (0.1 mg/g body weight) and xylazine (0.01mg/g body weight). Just before the mice were terminated by cervical dislocation, blood was collected using cardiac puncture. Subsequently, DEXA analysis was performed, followed by necropsy wherein liver and other tissues were removed, flash frozen using dry ice, and stored at −80°C. Serum was isolated from collected blood and stored at −80°C.
DEXA Analysis
The relative proportions of fat tissue mass (FTM) and bone-free lean tissue mass (LTM) was determined using dual-energy X-ray absorptiometry (DEXA) using a Lunar PIXImus densitometer (Lunar Corp., Madison, WI) [39,47]. Calibration was performed through the use of a phantom mouse of known bone mineral density and FTM. Prior to the feeding study, mice were anesthetized and DEXA was performed. Afterwards, mice were injected with the reversal drug yohimbine (0.11 μg/g body weight), warm saline solution for rehydration, and kept warm until fully recovered. DEXA was repeated on each of the terminated mice at the end of the feeding study. To calculate the changes in FTM and LTM, data collected at the initiation of the study was subtracted from the data collected at the termination of the study.
Liver histological analysis
Liver slices were taken near the porta hepatis, placed for 24 h in 10% neutral buffered formalin for fixation and inserted in 70% alcohol-containing individual cassettes as described [47,48]. Samples in cassettes were processed, paraffin was added, the paraffin blocks cut into 4–6 micron sections with a microtome, and individual sections hematoxylin and eosin (H&E) stained for histological evaluation as in [47,48].
Protein determination
Portions of liver (0.1g wet weight) were homogenized in 0.5mL PBS (pH 7.4) using a motor-driven pestle (Tekmar Co, Cincinnati, OH) at 2000 rpm for 5 min. The protein content of the liver homogenate and aliquots of serum or individual lipoprotein fractions (LDL, HDL, VLDL) isolated as described below were measured by Bradford micro-assay (Cat # 500–0001, Bradford Laboratories, Hercules, CA) using Costar 96-well assay plates (Corning, Corning, NY) and Bio Tek Synergy 2 micro-plate reader (Bio Tek Instruments, Winooski, VT).
Serum lipoprotein fractionation
A Cs2CdEDTA density gradient ultracentrifugation method separated serum into VLDL, LDL, and HDL fractions as in [49–52]. Briefly, NBD-(C6-ceramide) was added to each serum sample to label the lipoproteins. NBD-(C6-ceramide)-labeled serum was then applied to a 0.300M Cs2CdEDTA density buffer and centrifuged for 6 h at 120,000 rpm and 5 ◦C in a Beckman OptimaTM TLX-120 Ultracentrifuge equipped with 30◦ fixed angle TLA 120.2 rotor. Lipoprotein particle distribution in each tube after centrifugation was measured with a custom-built fluorescence imaging system, tubes frozen on liquid N2, and VLDL, LDL, and HDL fractions isolated by cutting frozen tubes into sections based on density as in [49]. The protein content of the individual lipoproteins (LDL, HDL, VLDL) was measured by Bradford micro-assay (Cat # 500–0001, Bradford Laboratories, Hercules, CA) as above.
Lipid analysis of liver, serum, and lipoprotein fractions
Portions of liver (0.1g wet weight) were homogenized in 0.5mL PBS (pH 7.4) using a motor-driven pestle (Tekmar Co, Cincinnati, OH) at 2000 rpm for 5 min. Liver homogenate, serum, and individual lipoprotein classes (LDL, HDL, VLDL) isolated from serum were analyzed for individual lipid classes using diagnostic kits (Wako, Richmond, VA) for total cholesterol (TC), free cholesterol (FC), triglyceride (TG), phospholipid (PL), and HDL cholesterol (HDL-C). Cholesteryl ester (CE) levels were calculated by subtraction of FC from TC. Serum non-HDL-C was determined by subtraction of serum HDL-C from serum TC. All diagnostic kits were used as per the manufacturer’s instructions, modified for use with 96-well plates and reader.
Measurement of liver and serum β-hydroxybutyrate
LCFA β-oxidation was examined by measuring the levels of β-hydroxybutyrate (3-HB) [8,47,53,54], using a β-hydroxybutyrate LiquiColor Test (StanBio Laboratory, Boerne, TX). All procedures were as per the manufacturer’s protocol and measuring the resultant enzymatic reactions spectrophotometrically at 505 nm using a BioTek Synergy 2 (BioTek, Winooski, VT).
Western blotting analysis
Liver homogenate was analyzed using Western blotting techniques to determine changes in expression of 55 different proteins involved with lipid metabolism. Also, standard curves were performed for the intracellular lipid-binding proteins, L-FABP, ACBP, and SCP-2, using the respective recombinant proteins purified as described previously [55–57]. For the other proteins normalization of levels was performed using either GAPDH or COX IV. Briefly, each liver homogenate isolated from minced liver in the form of 10 μg protein aliquots was loaded onto 12% tricine polyacrylamide gel electrophoresis (PAGE) gels that were run on a Mini-Protean II cell (Bio-Rad lab, Hercules, CA) at 100 V constant voltage for 1.5–2 hrs at initially 30 mA per gel. The proteins were transferred to nitrocellulose membranes (Bio-Rad) at a constant voltage of 100 V for 2 hrs and the transferred blots were blocked at room temperature for 1hr with 3 % gelatin in TBST (10 mM Tris-HCL, pH 8, 100 mM NaCl, 0.05% Tween-20). After several washings with TBST and incubating overnight with the appropriate dilutions of primary antibodies in 1% gelatin in TBST and again washing with TBST, blots were incubated at room temperature for 2h with a secondary antibody (e.g. alkaline-phosphatase conjugate of goat anti-rabbit IgG) diluted 1:4500 in 1% gelatin TBST. After staining with Sigma Fast 5-bromo-4chloro-3-indolyl phosphate/nitro blue tetrazolim tablets (Sigma, St. Louis, MO), and the blot was imaged using an IS-500 system (Alpha Innotech, San Leandro, CA). Densitometric analysis was performed using NIH Image (http://rsbweb.nih.gov/nih-image).
Statistical Analysis
Statistical analysis of the data was performed using either t-test or one-way ANOVA using statistical analysis software (SigmaPlot 12.5, San Jose, CA). Values represent the mean ± SEM and in the statistical hypothesis test, the null hypothesis was rejected for p<0.05 and those results were considered statistically significant.
RESULTS
Lfabp gene ablation (LKO) and pair-fed high glucose diet (HGD) oppositely affect whole body weight gain.
Although L-FABP plays a major role in dietary fatty acid metabolism and obesity, especially in the context of high dietary fat [19], little is known regarding L-FABP’s impact on body weight when increasing fatty acid is derived from dietary glucose. Ad libitum feeding high carbohydrate diets has been shown to increase [58,59] or not change [60] weight gain in rodents. However, ad libitum high carbohydrate studies varied both carbohydrate and fat in the diet—thereby complicating interpretation due to the known preference of rodents for consumption of fat [61]. Therefore, the effect of Lfabp gene ablation (LKO) on food intake and body weight was examined in mice fed control versus high glucose diet (HGD) in which the proportions of carbohydrate, protein, and fat were maintained constant as described in Supplemental Fig. 1 and Methods.
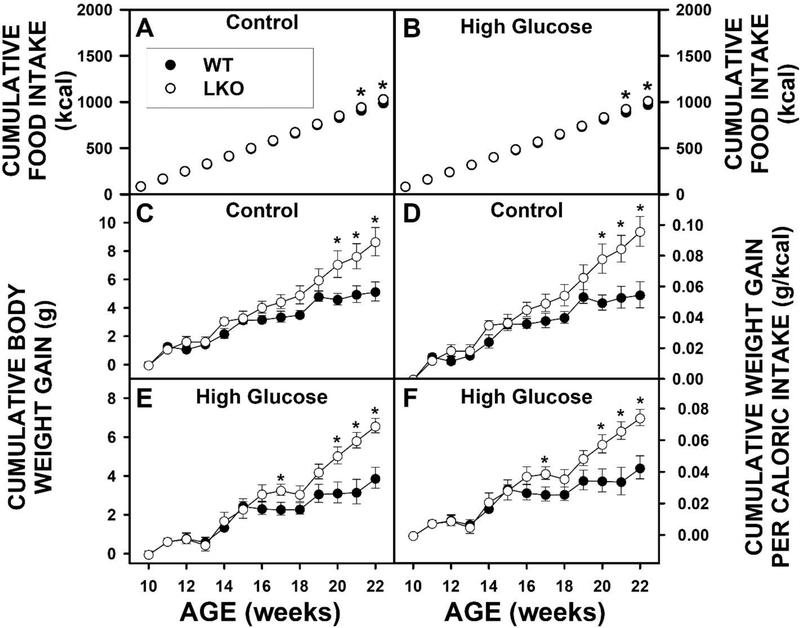
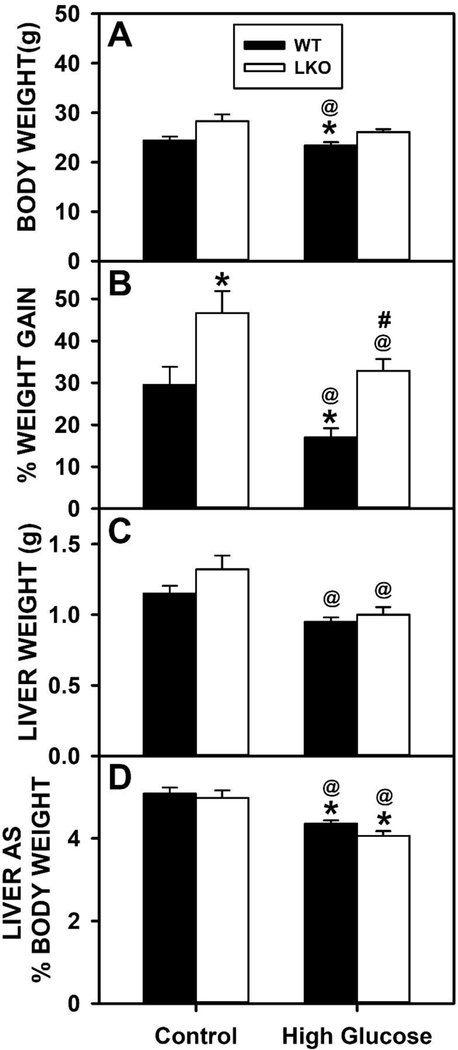
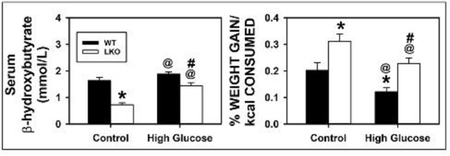
Wild-type (WT) and LKO mice fed control diet overall had similar cumulative food consumption (kcal) over time, except for a slight increase after 22 wk (Fig. 1A). Likewise, WT and LKO mice fed a high glucose diet (HGD) also had similar cumulative food consumption (kcal) over time, except for the same slight increase after 22 wk (Fig. 1B). LKO significantly increased cumulative body weight gain (g) (Fig. 1C,E) and cumulative weight gain/caloric intake (Fig. 1D,F) regardless of diet. When body weight was measured at the conclusion of the dietary study, HGD and LKO oppositely affected final weight. HGD alone significantly decreased the % Weight Gain (Fig. 2A) and % Weight Gain/kcal Food Consumed (Fig. 2B). In contrast, LKO alone increased the % Weight Gain (Fig. 2A) and % Weight Gain/kcal Food Consumed (Fig. 2B) in control fed mice. Likewise, in HGD fed mice LKO also increased the % Weight Gain (Fig. 2A) and % Weight Gain/kcal Food Consumed (Fig. 2B), but did not restore weight gain to the same level as in LKO controls.
Figure 1. Time course of the impact of Lfabp gene ablation (LKO) and pair-fed high glucose diet (HGD) on food consumption and whole body weight gain.
Wild-type (L-FABP +/+; WT) and L-fabp gene ablated (L-FABP −/−; LKO) female mice were placed on control (CO) diet or pair-fed HGD for 12 wks as described in Methods. Food consumption and body weight were measured daily and summed weekly as described in Methods: A. Cumulative food intake of control fed mice (kcal); B. Cumulative food intake of pair-fed HGD mice (kcal); C. Cumulative body weight gain (g) of control fed mice); D) cumulative weight gain per calorie intake (g/kcal) of control fed mice; E. Cumulative body weight gain (g) of pair-fed HGD mice); F) cumulative weight gain per calorie intake (g/kcal) of pair-fed HGD mice. Solid circles refer to WT mice while open circles refer to LKO mice. Values represent the mean ± SEM, n=6–8. Statistical analysis was * p≤ 0.05 vs WT mice.
Figure 2. Cumulative impact of Lfabp gene ablation (LKO) and pair-fed high glucose diet (HGD) on food consumption and whole body weight gain.
All conditions were as described in legend of Fig. 1. Food consumption and body weight gain were measured daily and summed at the end of the dietary study. At the end of the dietary study, mice were fasted overnight, livers harvested, and livers analyzed by histological analysis to determine degree of hepatocyte vacuolation as described in Methods. Solid bars refer to WT mice while and open bars refer to LKO mice. A. Weight gain in g; B. % Weight gain; C. Liver weight (g); D. Liver weight as % Body weight. Values represent the mean ± SEM, n=6–8. Statistical analysis was as follows: * p≤ 0.05 vs WT mice on control diet; @ p≤ 0.05 vs LKO mice on control diet; #p≤ 0.05 vs WT mice on HGD.
Taken together, these data indicate that HGD had little effect on cumulative food consumption due to paired feeding, but decreased total weight gain—opposite to studies where the proportions of dietary carbohydrate and fat were not held constant [58–60].
Lfabp gene ablation (LKO) and pair-fed high glucose diet (HGD) both increase whole body fat tissue mass: dual emission x-ray absorptiometry (DEXA).
To determine if the LKO-induced increase and HGD-induced decrease in body weight was associated with altered lean tissue mass (LTM) or fat tissue mass (FTM), all mice were subjected to non-invasive DEXA at the beginning and end of the dietary study as described in Methods.
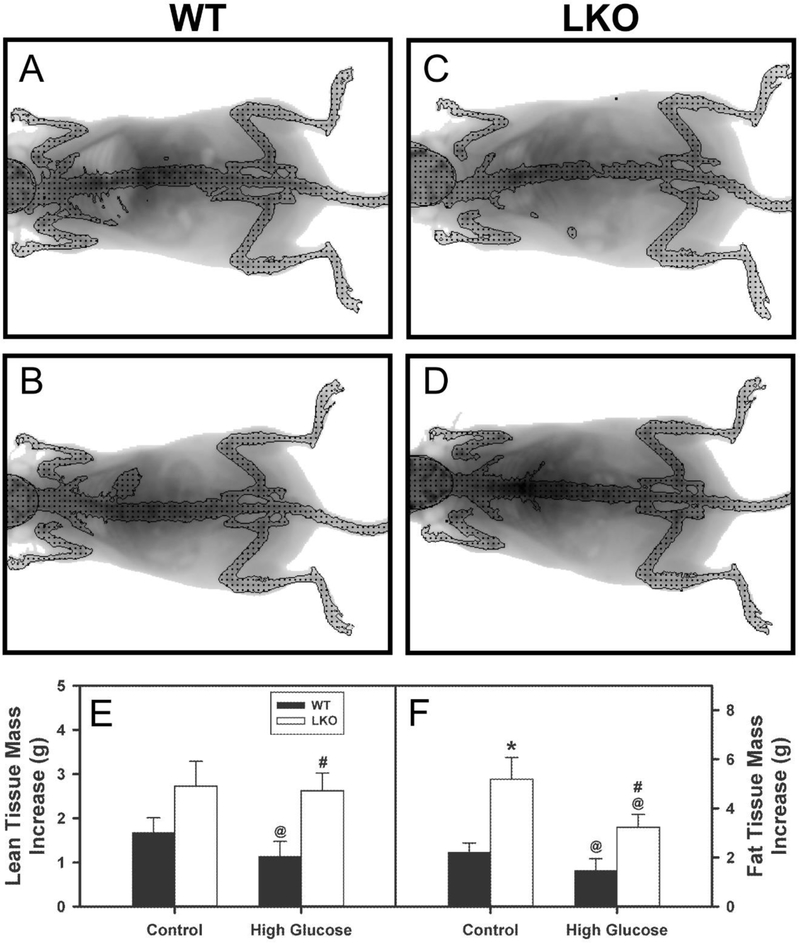
At the end of the dietary study, WT HGD fed mice appeared less obese than those fed control food as shown in representative images (Fig. 3B vs 3A). DEXA analysis of multiple mice both at the beginning and end of the dietary study confirmed that the leaner-appearing phenotype of WT mice HGD was associated with both decreased (LTM, Fig. 3E) and decreased (FTM, Fig. 3F). In contrast, in control-fed mice LKO alone significantly increased FTM (Fig. 3F) with a lesser but non-significant trend toward increased LTM (Fig. 3E). In HGD mice, LKO significantly increased both LTM (Fig. 3E) and FTM (Fig. 3F).
Figure 3. Effect of Lfabp gene ablation (LKO) and pair-fed high glucose diet (HGD) on whole body phenotype, lean tissue mass (LTM) and fat tissue mass (FTM): Dual emission X-ray absorptiometry (DEXA).
All conditions were as described in legend of Fig. 1. At the beginning and end of the HGD dietary study, FTM and LTM were determined by DEXA in female WT (Solid bar) and LKO (Open bar) mice fed control- or HGD as described in Methods. A. WT mice on control diet; B, WT mice on HGD; C. LKO mice on control diet; D. LKO mice on HGD diet; E. Gain in lean tissue mass (LTM, g); and E. Gain in fat tissue mass (FTM, g). Values represent the mean ± SEM, n=6–8. Statistical analysis was as follows: * p≤ 0.05 vs WT mice on control diet; @ p≤ 0.05 vs LKO mice on control diet; and #p≤ 0.05 vs WT mice on HGD.
Taken together, these data indicate that in WT mice the HGD alone decreased weight gain, LTM, and FTM. Conversely, LKO alone increased weight gain, FTM, and LTM, but less so in LKO mice fed HGD.
Lfabp gene ablation (LKO) and pair-fed high glucose diet (HGD) differentially alter liver phenotype: gross morphology, histology, steatosis, and lipid composition.
Since ad libitum fed diets rich in glucose are known to induce NAFLD [6], it was important to determine the impact of pair-fed HGD and LKO on liver histology and lipid level.
Gross analysis of isolated livers indicated that in WT mice the pair-fed HGD alone significantly decreased both Liver Weight (g, Fig. 2C) and Liver Weight as % Body Weight (Fig. 2D). In contrast, LKO alone did not affect Liver Weight (Fig. 2C) or Liver Weight as % Body Weight (Fig. 2D) regardless of diet.
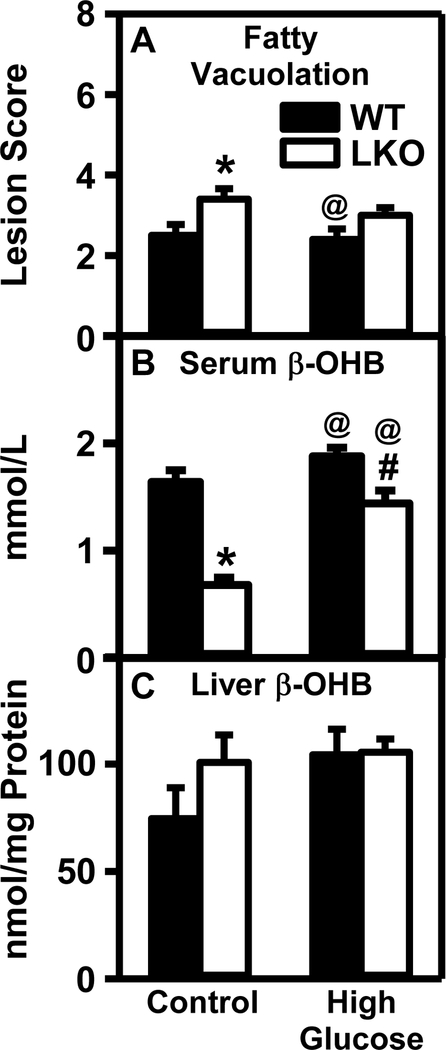
Histological analysis as described in Methods, indicated that HGD alone did not induce hepatocyte vacuolation (Fig. 4A) and did not induce hepatocyte necrosis, inflammation, or mitosis regardless of diet (data not shown). In contrast, vacuolation was induced by LKO in control-fed mice and in HGD mice the LKO trended to increase vacuolation (Fig. 4A).
Figure 4. Impact of Lfabp gene ablation (LKO) and pair-fed high glucose diet (HGD) on liver hepatocyte morphology and β–hydroxybutyrate levels:
All conditions were as described in legends of Fig. 1,2. At the end of the dietary study, livers and serum were obtained as described in Methods. Panel A. Liver was analyzed by histological analysis to determine degree of hepatocyte vacuolation as described in Methods. β-hydroxybutyrate levels were determined for serum (Panel B) and liver (Panel C). Solid bars refer to WT mice while and Open bars refer to LKO mice. Values represent the mean ± SEM, n=6–8. Statistical analysis was as follows: * p≤ 0.05 vs WT mice on control diet; @ p≤ 0.05 vs LKO mice on control diet; #p≤ 0.05 vs WT mice on HGD.
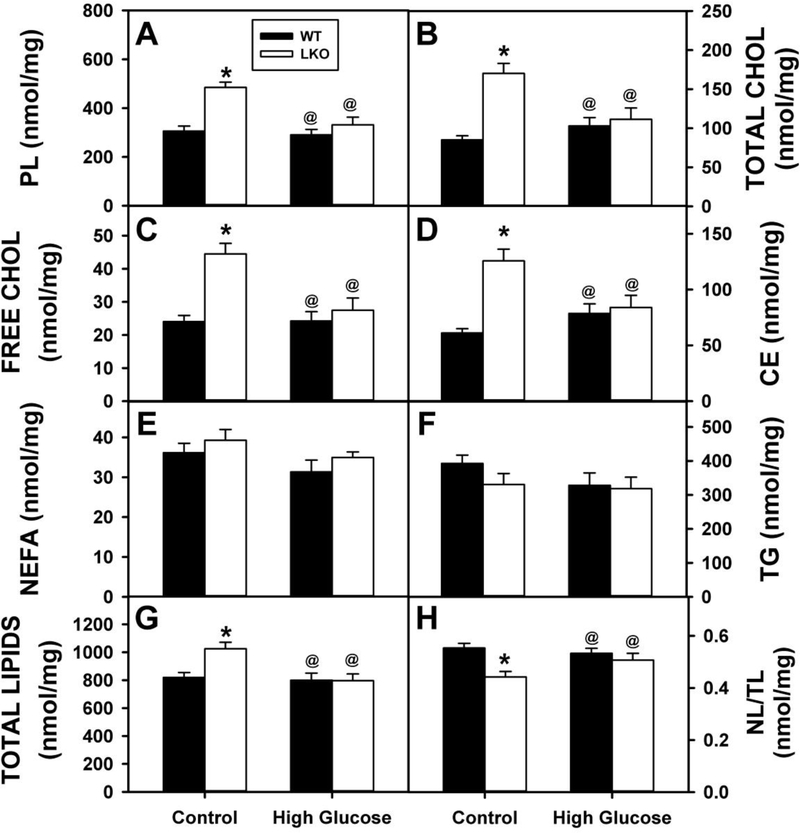
To determine whether the effects of HGD and LKO on liver weight and morphology (vacuolation) were associated with hepatic lipid accumulation, each liver was analyzed for lipid class composition as described in Methods. In WT mice, HGD alone had no effect on hepatic content of any of the lipid classes examined (Fig. 5A–H). In contrast, in control-fed mice the LKO alone significantly increased hepatic phospholipid (Fig. 5A), total cholesterol (Fig. 5B), free cholesterol (Fig. 5C) and cholesteryl ester (Fig. 5D) resulting in increased total lipid (Fig. 5G) while decreasing the neutral lipid/total lipid ratio (Fig. 5H). However, LKO alone had no effect on non-esterified fatty acid (Fig. 5E) or triacylglyceride (Fig. 5F). While serum β-hydroxybutyric acid, a physiological marker of hepatic fatty acid oxidation was not altered by HGD alone, it was decreased by LKO alone (Fig. 4B). In contrast, in HGD mice the LKO had no effect on hepatic lipid composition (Fig. 5A–H) but nevertheless decreased serum level of β-hydroxybutyric acid (Fig. 4B). These changes were selective since neither HGD alone, LKO alone, nor both together altered serum glucose, insulin, or glucagon (Supplemental Fig. 2A–C) or liver β-hydroxybutyric acid (Fig. 4C) or glucose (Supplemental Figure 3).
Figure 5. Impact of Lfabp gene ablation (LKO) and pair-fed high glucose diet (HGD) on liver lipid content.
All conditions were as described in legends of Fig. 1, 2. At the end of the dietary study, liver was collected from WT (Solid bar) and LKO (Open bar) mice for lipid extraction and analysis as described in Methods: A. PL=phospholipid (nmol/mg); B. Total Cholesterol (nmol/mg); C. Free Cholesterol (nmol/mg); D. Cholesteryl ester (nmol/mg); E. NEFA=Non-esterified fatty acid (nmol/mg); F. TG=triacylglycerol (nmol/mg); G. TL, total lipids (nmol/mg); H. NL/TL=(Neutral lipid)/(Total lipid) molar ratio. Neutral lipid = TG + CE. Values represent the mean ± SEM, n=6–8. Statistical analysis performed as described in Methods was as follows: * p≤ 0.05 vs WT mice on control diet; @ p≤ 0.05 vs LKO mice on control diet; and #p≤ 0.05 vs WT mice on HGD.
In summary, pair-fed HGD alone decreased liver weight without altering liver histology or lipid content/composition—in marked contrast to an ad libitum fed high glucose diet [62]. In contrast, while LKO alone also did not induce hepatic TG accumulation, it increased most lipid classes (PL, TC, C, CE)—effects abolished by pair-fed HGD. Likewise, the LKO-induced induced decrease in serum β-hydroxybutyric acid (consistent with decreased hepatic fatty acid oxidation) was counteracted in part by pair-fed HGD.
Lfabp gene ablation (LKO) and pair-fed high glucose diet (HGD) selectively alter serum lipids: increased serum triglyceride (TG) content.
Since the above data indicated that LKO alone, but not HGD alone or both together, induced hepatic accumulation of most lipid classes (but not TG), it was important to determine if the latter was associated with increased TG in serum. Therefore, fasted serum was collected at the end of the dietary study and analyzed for lipid composition as described in Methods.
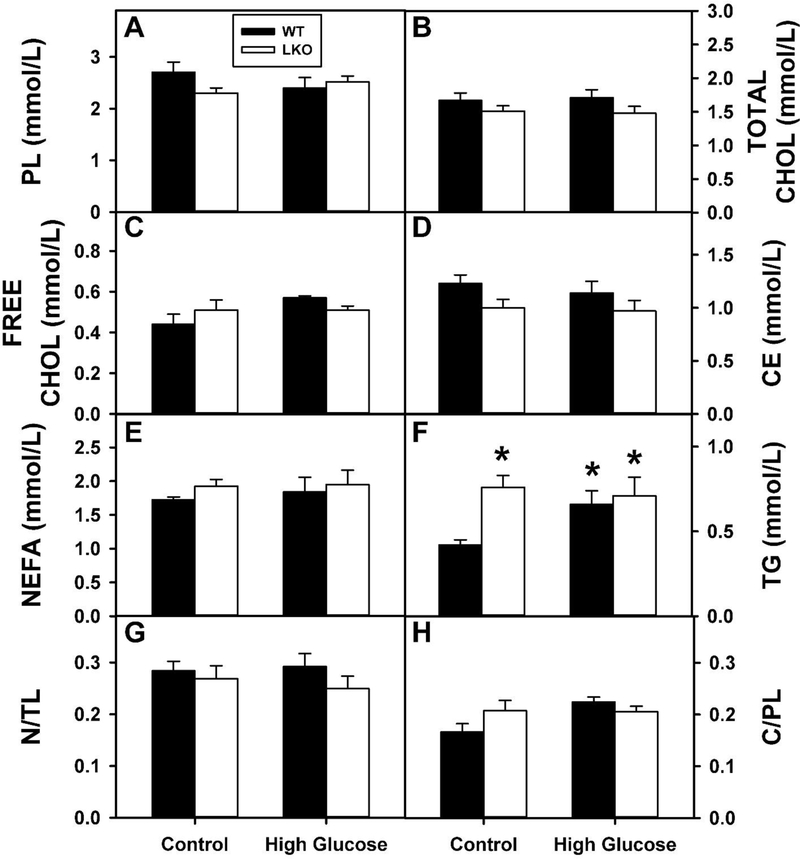
In WT mice the HGD alone significantly increased serum TG (Fig. 6F), but not other individual lipid classes (Fig. 6A–E), neutral/total lipid ratio (Fig. 6G) or cholesterol/phospholipid ratio (Fig. 6H). In control-fed mice, LKO alone also significantly increased serum TG (Fig. 6F), but not other individual lipid classes (Fig. 6A–E), neutral/total lipid ratio (Fig. 6G) or cholesterol/phospholipid ratio (Fig. 6H). In contrast, in pair-fed HGD mice LKO had no effect on serum lipid composition (Fig. 6A–H). Thus, either pair-fed HGD alone or LKO alone selectively increase serum triacylglycerol—suggesting altered serum distribution of TG-rich lipoproteins.
Figure 6. Effect of Lfabp gene ablation (LKO) and pair-fed high glucose Diet (HGD) on serum lipid content.
All conditions were as described in legends of Fig. 1, 2. At the end of the dietary study, fasting serum was collected from WT (Solid bar) and LKO (Open bar) mice for lipid extraction and analysis as described in Methods: A. PL=phospholipid (mmol/L); B. Total Cholesterol (mmol/L); C. Free Cholesterol (mmol/L); D. CE=cholesteryl ester (mmol/L); E. NEFA=Non-esterified fatty acid (mmol/L); F. TG=triacylglycerol (mmol/L); G. NL/TL=[neutral lipid]/[total lipid] ratio. Neutral lipid refers=(TG + CE). H. C/PL=(Free Cholesterol)/Phospholipid ratio. Values represent the mean ± SEM (n=6–8). Statistical analysis performed as described in Methods was as follows: * p≤ 0.05 vs WT mice on control diet. No other statistical significant differences were observed between groups.
Lfabp gene ablation (LKO) and pair-fed high glucose diet (HGD) differentially alter serum lipoprotein profile and protein content.
Since both HGD alone and LKO alone impacted serum TG, it was important to determine if either reflected altered serum distribution of TG-rich lipoproteins in fasted serum (VLDL, LDL, HDL). To begin to address this question, sera were subjected to Cesium density gradient centrifugation and profile examined with NBD-ceramide as described in Methods.
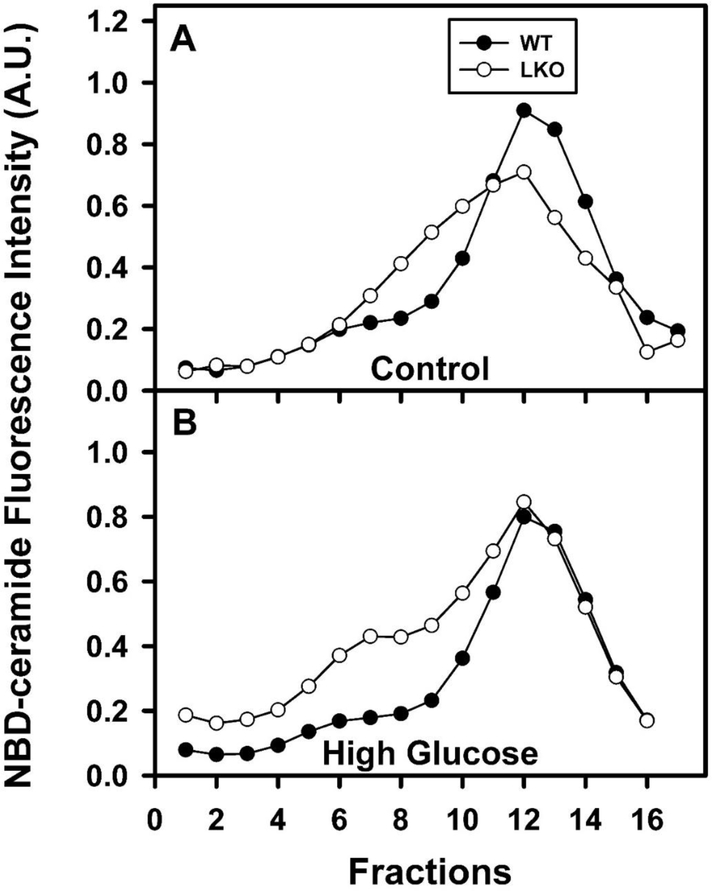
Representative profiles of all groups are shown in Fig. 7 where based on density, fractions 1–4 are enriched in VLDL (Fig. 7, left), fractions 5–8 are enriched in LDL (Fig. 7, middle shoulder), and fractions 9–16 are enriched in HDL (Fig. 7, right peak). In control-fed mice, HGD alone essentially decreased in parallel the entire profile of NBD-ceramide fluorescence intensity in the lipoprotein classes (Fig. 7B vs 7A solid circles). In contrast, LKO alone, decreased the fractions containing HDL and shifted profile to lower density, primarily the fractions containing LDL (Fig. 7A). Likewise, in HGD fed mice the LKO also decreased the NBD-ceramide fluorescence intensity in the HDL containing fractions and shifted them towards lower density, i.e. LDL, VLDL (Fig. 7B vs 7A open circles).
Figure 7. Effect of Lfabp gene ablation (LKO) and pair-fed high glucose diet (HGD) on serum lipoprotein profile.
All conditions were as described in legends of Fig. 1,2. At the end of the dietary study, fasting serum was collected for ultracentrifugation and determination of serum lipoprotein profile as described in Methods. Representative serum lipoprotein profiles for wild-type (WT) and LKO mice on (A) control diet and (B) HDG, respectively. Closed circles refer to WT mice while open circles refer to LKO mice.
Together, these NBD-ceramide profile data indicated that, the relative distribution of lipoprotein classes followed the pattern HDL >>> LDL > VLDL in all groups. However, HGD and LKO both significantly shifted the relative proportions of these lipoprotein sub-fractions.
Lfabp gene ablation (LKO) and pair-fed high glucose diet (HGD) alter serum lipoprotein protein and total lipid content.
To further characterize the protein and lipid composition changes accounting for the above altered lipoprotein profiles, the gradient fractions corresponding to densities of VLDL, fractions corresponding to densities of LDL, and fractions corresponding to densities of HDL from each group of mice were separately pooled for protein and lipid analysis as described in Methods.
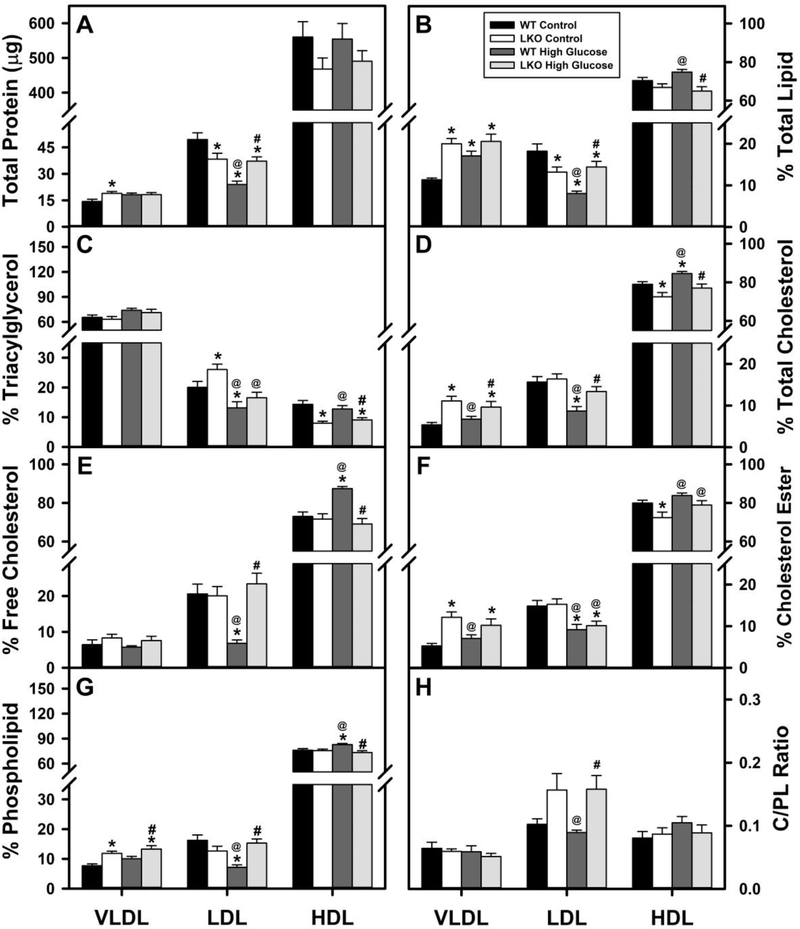
The total protein in the lipoprotein fractions was distributed into HDL >>> LDL > VLDL (Fig. 8A), consistent with the known protein distribution among these lipoprotein classes and confirming the NBD-ceramide profiles above. In WT mice, the HGD did not alter the total protein content of VLDL or HDL, but decreased that of LDL by nearly 50% (Fig. 8A). In contrast, in control-fed mice the LKO alone also did not alter the protein content in the HDL fraction, but decreased that of LDL while slightly increasing that of VLDL (Fig. 8A). In pair-fed HGD mice, LKO did not further alter the total protein in HDL or VLDL, but increased that of the LDL fraction (Fig. 8A).
Figure 8. Impact of Lfabp gene ablation (LKO) and pair-fed high glucose diet (HGD) on serum VLDL, LDL, and HDL protein content and lipid composition.
All conditions were as described in legends of Fig. 1,2. At the end of the dietary study, fasting serum was collected from wild-type (WT) and LKO mice for lipoprotein profiling as in Fig. 8 and individual lipoprotein fraction (VLDL, LDL, HDL) isolation as described in Methods. One aliquot of each VLDL, LDL, and HDL fraction was used for determination of protein content (A) as described in Methods while the remainder was used for lipid extraction and individual class distribution also as described in Methods: B. % Total lipid; C. % Triacylglycerol; D. % Total Cholesterol; E. % Free Cholesterol; F. % Cholesterol Ester; G, % Phospholipid; H. C/PL ratio (Free Cholesterol)/Phospholipid ratio. In each panel the bars in each group refer from left to right indicate WT control diet (black bar); LKO control diet (open bar); WT HGD (dark shaded bar); LKO HGD (light shaded bar). Values represent the mean ± SEM (n=6–8). Statistical analysis was performed within each lipoprotein class as described in Methods as follows: * p≤ 0.05 vs WT mice on control diet; @ p≤ 0.05 vs LKO mice on control diet; and #p≤ 0.05 vs WT mice on HGD.
The % Total Lipid of the three lipoprotein fractions differed dramatically in the order HDL >> LDL > VLDL as expected from their known densities and positions in the density gradients (Fig. 8B). In WT mice the pair-fed HGD alone increased the % Total Lipid in VLDL and HDL while decreasing that in LDL (Fig. 8B). In control-fed mice, the LKO alone likewise increased the % total lipid in VLDL, decreased that in LDL, while decreasing that in LDL (Fig. 8B). In HGD mice the LKO increased the % Total Lipid in both VLDL and LDL, while decreasing that in HDL (Fig. 8B).
Taken together with HGD’s impact on the respective protein contents (Fig. 8A), these data indicated that pair-fed HGD alone selectively increased the ratio of Total Lipid/Total Protein in VLDL and HDL. In contrast, in control-fed mice the LKO alone selectively decreased the ratio of Total Lipid/Total Protein in VLDL and HDL, but not LDL. In HGD mice the LKO selectively increased the ratio of Total Lipid/Total Protein in VLD but decreased that in HDL. Based on lipoprotein spherical shape with protein primarily at the surface, these data suggested that overall the pair-fed HGD alone decreased while LKO alone increased the size of VLDL and HDL, respectively.
Lfabp gene ablation (LKO) and pair-fed high glucose diet (HGD) alter serum lipoprotein class lipid composition.
The lipoprotein classes (VLDL, LDL, and HDL) isolated from Cesium density gradients above were further subjected to lipid class compositional analysis as described in Methods. This allowed determination of whether the LKO- and/or HGD-induced increases in serum TG, liver phospholipid and cholesterol, and/or whole body FTM reported in the preceding sections were associated with altered lipid class composition of select serum lipoprotein fractions.
The lipoprotein class distribution of triacylglycerol (TG) was in the order VLDL >>> LDL > HDL as expected (Fig. 8C). In WT mice the HGD alone did not alter TG content of VLDL or HDL, but decreased that in LDL (Fig. 8C). LKO alone likewise did not alter TG content of VLDL, but in LDL towards retention concomitant with less appearing in HDL (Fig. 8C). In HGD mice, the LKO did not alter the relative proportions of TG of either VLDL or LDL, but decreased that in HDL (Fig. 8C).
HDL was the most total cholesterol-rich (Fig. 8D), free cholesterol-rich (Fig. 8E), and cholesteryl-ester rich (Fig. 8E) lipoprotein fraction followed by LDL and then VLDL. In general in WT mice, the HGD alone did not alter VLDL total, free or esterified cholesterol (Fig. 8D–F), decreased that of LDL total, free and esterified cholesterol (Fig. 8D–F), and increased that of HDL total, free and esterified (Fig. 8E–F). In control-fed mice the LKO increased VLDL total cholesterol (Fig. 8D)—selectively cholesteryl-ester (Fig. 8E), did not alter those in LDL (Fig. 8D–F), and decreased that of HDL total cholesterol (Fig. 8D)—selectively free cholesterol (Fig. 8E). In HGD mice the LKO increased total cholesterol, selectively cholesteryl ester in VLDL and LDL (Fig. 8D–F) and decreased that of HDL total cholesterol (Fig. 8D)—selectively free cholesterol (Fig. 8E).
In WT mice fed HGD alone also selectively decreased phospholipid content of LDL while increasing that of HDL (Fig. 8G), LKO alone selectively increased PL content of VLDL (Fig. 8G), and in HGD mice the LKO increased PL content of VLDL and LDL while decreasing that in HDL (Fig. 8G). In general, these changes in phospholipid overall paralleled those of lipoprotein content of Total Protein.
Together these data indicated that the LKO- (but not pair-fed HGD)- induced increase in serum TG was associated with a shift in towards retention in LDL at the expense of a TG in the HDL. While no HGD- or LKO-induced alterations were noted in serum total cholesterol (or either free cholesterol or cholesteryl ester) or phospholipid, analysis of the individual lipoprotein classes revealed marked and selective differential changes. Finally, LKO (regardless of diet) selectively increased the LDL cholesterol/phospholipid ratio (C/PL)—suggesting greater rigidity of the surface monolayer surrounding LDL (Fig. 8H).
Lfabp gene ablation (LKO) and pair-fed high glucose diet (HGD) decrease hepatic expression of proteins/enzymes involved fatty acid synthesis and desaturation.
If the HGD- and/or LKO- induced changes in liver and serum lipids were associated with altered expression of hepatic fatty acid anabolic enzymes was determined.
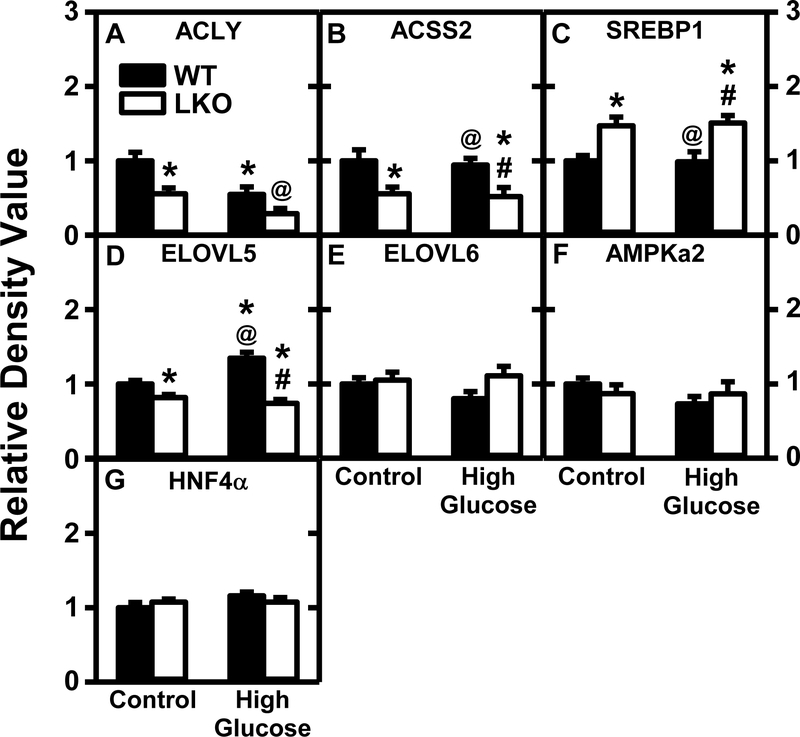
As expected for fasting WT mice, HGD alone decreased hepatic mRNA levels of the rate limiting enzymes in de novo fatty acid synthesis, i.e. Acaca, Acss2, and/or Fasn (Supplemental Table 1), as well as hepatic protein levels of other important enzymes involved in de novo fatty acid synthesis such as ACLY (Fig. 9A) and ACSS2 (Fig. 9B). However, HGD alone did not decrease protein levels of inhibitors of ACC [AMPKA2 (Fig. 9F)], fatty acid elongation [ELOVL5 (Fig. 9D), ELOVL6 (Fig. 9E)]. With regards to nuclear receptors in de novo fatty acid synthesis, HGD alone did alter protein level of SREBP1 (Fig. 9C) and HNF4α (Fig. 9G), or mRNA level of Hnf4a (Supplemental Table 1) but did increase Srebpf1 mRNA (Supplemental Table 1).
Figure 9. Lfabp gene ablation (LKO) and pair-fed high glucose diet (HGD) alter hepatic protein levels of enzymes and receptors in de novo fatty acid synthesis.
All conditions were as in legends of Fig. 1,2 except that SDS-PAGE and Western blotting were performed to determine relative hepatic protein levels of the following groups of key proteins in de novo lipogenesis: Group 1, de novo fatty acid biosynthesis, i.e. ACLY (Fig. 9A; Supplemental Fig. 10A, 16B,17B), ACSS2 (Fig. 9B; Supplemental Fig. 10A); Group 2, elongation, i.e. ELOVL5 (Fig. 9D; Supplemental Fig. 17B), ELOVL6 (Fig. 9E; Supplemental Fig. 7A); Group 3, regulation (activity or transcription), i.e. AMPKa2 (Fig. 9F; Supplemental Fig. 17C), SREBP1 (Fig. 9C; Supplemental Fig. 12B), HNF4α (Fig. 9G; Supplemental Fig. 6A). Western blot images for each protein (n=7) along with GAPDH, COX4, or β-actin housekeeper for normalization are shown in the respective Supplemental Figures 4–17. Western blots of ACC1, ACC2, and FASN were attempted several times under different conditions, but failed. WT (Black bars) and LKO (Open bars). Values represent the mean ± SEM, n=7, with statistical significance indicated as follows: * p≤ 0.05 vs WT mice on control diet; @ p≤ 0.05 vs LKO mice on control diet; and #p≤ 0.05 vs WT mice HGD.
While LKO alone did not alter hepatic protein levels of enzymes involved in de novo fatty acid synthesis such as AMPKa2 (Fig. 9F), it decreased protein level of ACLY (Fig. 9A) and ACSS2 (Fig. 9B) despite increased SREBP1 protein (Fig. 9C) and mRNA (Supplemental Table 1). However, LKO had relatively little impact on protein levels of enzymes in fatty acid elongation [ELOVL5 (Fig. 9D), ELOVL6 (Fig. 9E)].
In HGD mice, the LKO further altered hepatic expression by: i) not altering hepatic protein levels of AMPKa2 (Fig. 9F), while significantly increasing SREBP1 (Fig. 9C), decreasing ACSS2 (Fig. 9B), and decreasing ELOVL5 (Fig. 9D). However, these changes in protein levels only correlated with mRNA transcription of some of these genes (Supplemental Tables 1,5).
Impact of Lfabp gene ablation (LKO) and pair-fed high glucose diet (HGD) on hepatic expression of proteins/enzymes involved exogenous fatty acid uptake and intracellular fatty acid/fatty acyl-CoA transport/targeting.
It was also important to determine if the HGD- and/or LKO- induced changes in liver and serum lipids were associated with altered expression of hepatic fatty acid transport proteins.
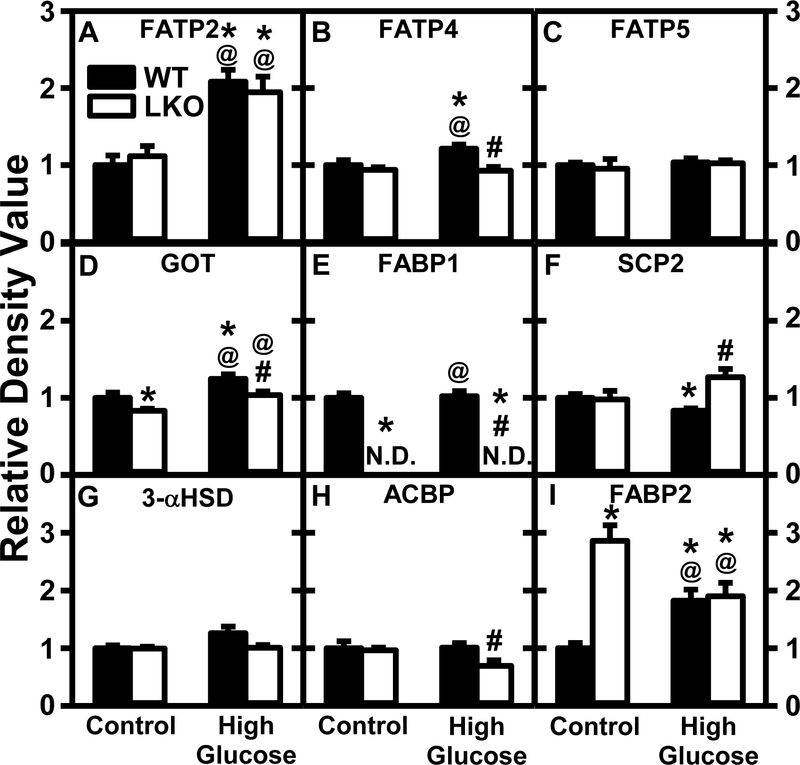
In WT mice HGD alone: i) increased hepatic protein levels of all membrane fatty acid translocase proteins examined, especially FATP2 (Fig. 10A) and less so FATP4 (Fig. 10B), FATP5 (Fig. 10C), and GOT (Fig. 10D). Concomitant decreases in mRNA levels of some membrane fatty acid translocase proteins (Fatp1) and trends to do so in others (Fatp2) were observed (Supplemental Table 1); ii) decreased liver protein level of cytosolic fatty acid/fatty acyl-CoA binding protein SCP-2 (Fig. 10F) and Scp-2 mRNA transcription (Supplemental Table 1). Although liver protein levels of most other cytosolic fatty acid/fatty acyl-CoA binding/transport proteins including were unaltered (Fig. 10A,G,H), that of the much less prevalent cytosolic fatty acid binding protein-2 (i.e. intestinal fatty acid binding protein, FABP2) was increased 2-fold (Fig. 10I). The HGD-induced changes in SCP-2 (but not FABP1 or ACBP) correlated with changes in mRNA transcription (Supplemental Table 1).
Figure 10. Pair-fed high glucose diet (HGD) has greater effect than Lfabp gene ablation (LKO) on protein levels of key liver fatty acid transporters.
All conditions were as in legend of Fig. 9 except that SDS-PAGE and Western blotting were performed to determine relative hepatic protein levels of: Group 1: membrane fatty acid transport proteins, i.e. FATP2 (Fig. 10A; Supplemental Fig. 7B), FATP4 (Fig. 10B; Supplemental Fig. 11A), and FATP5 (Fig. 10C; Supplemental Fig. 11B) and GOT (Fig. 10D; Supplemental Fig. 12A); Group 2: cytosolic fatty acid/fatty acyl CoA binding proteins, i.e. FABP1 (Fig. 10E; Supplemental Fig. 4A, 9B, 12A), SCP2 (Fig. 10F; Supplemental Fig. 6B, 8B,13A), 3-αHSD (Fig. 10G; Supplemental Fig. 10A), ACBP (Fig. 10H; Supplemental Fig. 8A, 11B), and FABP2 (Fig. 10I; Supplemental Fig. 10B). Western blot images for each protein (n=7) along with GAPDH, COX4, or β-actin housekeeper for normalization are shown in the respective Supplemental Figs. 4–17. WT (Black bars) and LKO (Open bars). Values represent the mean ± SEM, n=7, with statistical significance indicated as follows: * p≤ 0.05 vs WT mice on control diet; @ p≤ 0.05 vs LKO mice on control diet; and #p≤ 0.05 vs WT mice HGD.
In contrast, LKO alone: i) did not alter protein levels of most membrane fatty acid translocase proteins [FATP2, FATP4, FATP5 (Fig. 10A–C)] but slightly increased that of GOT (Fig. 10D). This was consistent with no alterations in mRNA transcription of those examined (Supplemental Table 1); ii) completely ablated FABP1 protein (Fig. 10E) and fabp1 mRNA transcription (Supplemental Table 1). Protein (Fig. 10F–I) and mRNA (Supplemental Table 1) levels of most other cytosolic fatty acid/fatty acyl CoA binding proteins were not changed.
In HGD mice, the LKO further altered hepatic expression by: i) significantly decreasing protein levels of several membrane fatty acid translocases [FATP4 (Fig. 10B), GOT (Fig. 10D)]. However, in HGD mice the LKO did not significantly alter mRNA transcription of membrane fatty acid translocases (Supplemental Table 1); ii) concomitantly increasing hepatic protein levels of SCP2 (Fig. 10F) while decreasing that of ACBP (Fig. 10H)—changes that roughly correlated with mRNA levels (Supplemental Table 1).
Thus, the inability of HGD to increase hepatic TG was associated at least in part with decreased expression of FABP1 not compensated for by upregulation of most other cytosolic fatty acid binding/chaperone proteins or membrane fatty acid translocases. In HGD fed mice, the LKO further upregulated some (e.g. SCP-2) but did not or decreased hepatic expression of most other cytosolic and membrane fatty acid transporters.
L-fabp gene ablation (LKO) and pair-fed high glucose diet (HGD) increase hepatic expression of proteins/enzymes involved in glucose uptake, glycolysis, gluconeogenesis, and nuclear receptors in glucose-derived lipogenesis.
Hepatic level of glucose derived fatty acids and glycerides is determined not only by enzymes in de novo fatty synthesis, but also glucose metabolism. This possibility was examined by liver Western blotting and mRNA quantitation of glucose catabolic or anabolic enzymes as described in Methods.
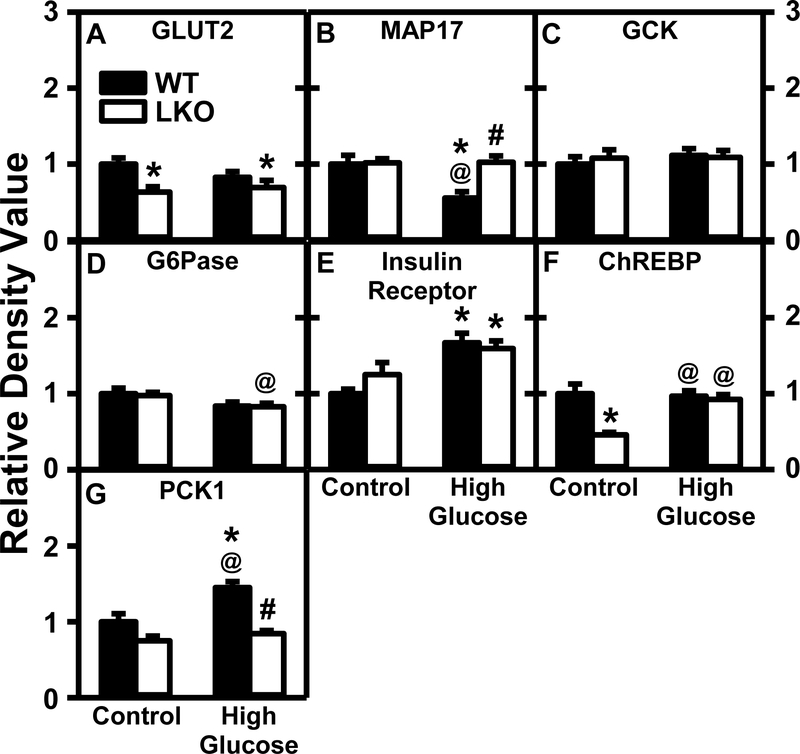
In WT mice the HGD alone did not significantly alter hepatic protein level of the major plasma membrane glucose transporter, GLUT2 (Fig. 11A)—despite decreased mRNA transcription (Supplemental Table 2). Further, HGD alone decreased the hepatic protein level of MAP17 (Fig. 11B)—a protein that potentiates the activity of glucose transporters. HFG alone also had no effect on hepatic protein level of glucose degradative enzymes glucokinase (GCK, Fig. 11C) and glucose-6-phosphatase (G6Pase, Fig. 11D)—consistent with unaltered mRNA transcription of Gck, G6pc, phosphofructokinase (Pfk1) (Supplemental Table 2). With regards to other proteins regulating glucose uptake, HFD alone increased hepatic protein level of the plasma membrane insulin receptor (Fig. 11E), but not the protein level of the nuclear receptor carbohydrate response element binding protein (ChREBP, Fig. 11F)—despite decreased Chrebp mRNA (Supplemental Table 2). Finally, HGD alone increased hepatic protein level (Fig. 11G), but not mRNA transcription (Supplemental Table 2), of phosphoenolpyruvate carboxykinase (PCK1), the key enzyme in gluconeogenesis.
Figure 11. Impact of Lfabp gene ablation (LKO) and pair-fed high glucose diet (HGD) on protein levels of key liver enzymes/proteins in hepatic glucose metabolism.
All conditions were as described in Fig. 9 except that SDS-PAGE and Western blotting were performed to determine relative hepatic protein levels of the following groups of key proteins in hepatic glucose metabolism: Group 1: Glucose uptake, i.e. GLUT2 (Fig. 11A; Supplemental Fig. 16A), MAP17 (Fig. 11B; Supplemental Fig. 16B); Group 2: glucose metabolism, i.e. GCK (Fig. 11C; Supplemental Fig. 17A), G-6-Pase (Fig. 11D; Supplemental Fig. 11A); Group 3: regulation of glucose uptake, i.e. insulin receptor (Fig. 11E; Supplemental Fig. 11A), ChREBP (Fig. 11F; Supplemental Fig. 13A); and Group 4: gluconeogenesis, i.e. PCK1 (Fig. 11G; Supplemental Fig. 17B). Western blot images for each protein (n=7) along with GAPDH, COX4, or β-actin housekeeper for normalization are shown in the respective Supplemental Figs. 4–17. WT (Black bars) and LKO (Open bars). Values represent the mean ± SEM, n=7, with statistical significance indicated as follows: * p≤ 0.05 vs WT mice on control diet; @ p≤ 0.05 vs LKO mice on control diet; and #p≤ 0.05 vs WT mice HGD.
In contrast, LKO alone significantly decreased liver protein levels of GLUT2 (Fig. 11A)-consistent with unaltered mRNA transcription of Glut2 (Supplemental Table 2), unaltered protein level of ChREBP (Fig. 11F), and unaltered mRNA level of Chrebp (Supplemental Table 2). Protein levels of MAP17, GCK, G6Pase, insulin receptor, and PKC1 were unaltered (Fig. 11B,D,E,G) despite significant alterations in the mRNA transcripts of several (e.g. Gck, G6pc, Pck1) (Supplemental Table 2).
In HGD fed mice the LKO did not further alter the impact of HGD alone on hepatic protein levels of these proteins except for the key protein in gluconeogenesis, i.e. PCK1, which was decreased (Fig. 11G) while its mRNA level was unaltered (Supplemental Table 2).
Taken together, these findings indicate that overall pair-fed HGD alone increases hepatic expression of the insulin receptor (recruits GLUT2 to plasma membrane for glucose uptake) and PCK1 (gluconeogenic enzyme)—effects counteracted at least in part by decreased MAP17 (GLUT2 facilitator). In contrast, LKO alone overall decreased hepatic level of the key protein involved in glucose uptake (i.e. GLUT2) while decreasing ChREBP and trending to decrease PCK1—together suggesting decreased glucose. In pair-fed HGD mice the LKO blocked the HGD-induced decrease in MAP17 and PCK1. Together, these findings indicate that both HGD and LKO significantly alter glucose uptake/metabolism.
Impact of L-fabp gene ablation (LKO) and pair-fed high glucose diet (HGD) on hepatic expression of proteins/enzymes involved in mitochondrial fatty acid β-oxidation:
Since HGD and/or LKO altered hepatic levels of esterified lipids (PL, CE) and serum lipoprotein esterified lipids (TG, CE, PL), it was important to determine if these changes were associated with altered transcriptions of hepatic proteins/enzymes in mitochondrial fatty acid β-oxidation.
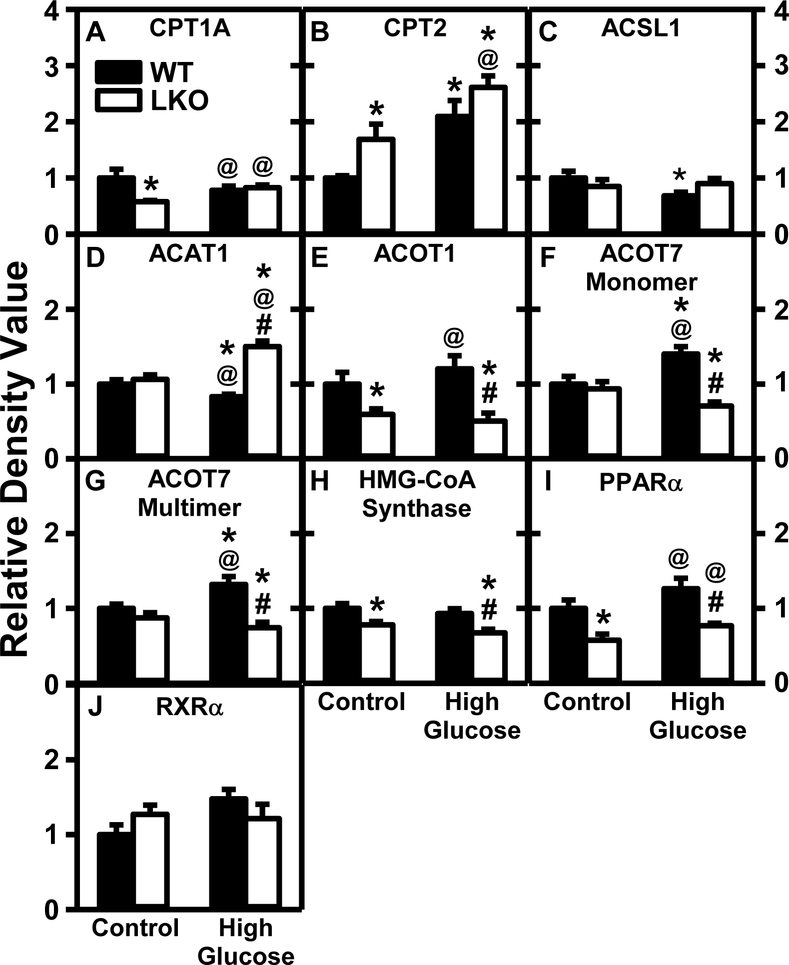
In WT mice the HGD alone significantly increased liver protein level of some enzymes/nuclear receptors in mitochondrial fatty acid β-oxidation [CPT2 (Fig. 12B), ACOT7 (Fig. 12F,G)], but not the rate limiting enzyme CPT1A (Fig. 12A), and even reduced those of others [ACSL1 (Fig. 12C), ACAT1 (Fig. 12D)] while leaving the remainder unaltered (Fig. 12E, H, I]. Respective mRNA transcripts encoding for some but not other of these proteins correlated with the liver levels of the respective protein translation products (Supplemental Table 3).
Figure 12. Lfabp gene ablation (LKO), but not pair-fed high glucose diet (HGD), diminish hepatic protein levels of key liver enzymes/proteins in mitochondrial β-fatty acid oxidation.
All conditions were as described in Fig. 9 except that SDS-PAGE and Western blotting were performed to determine relative hepatic protein levels of the following groups of key proteins in mitochondrial β-fatty acid oxidation: Group 1: fatty acid uptake across mitochondrial membranes into mitochondrial matrix, i.e. CPT1A (Fig. 12A; Supplemental Fig. 6A), CPT2 (Fig. 12B; Supplemental Fig. 6B), ACSL1 (Fig. 12C; Supplemental Fig. 7A,16B); Group 2: mitochondrial matrix enzymes in fatty acid oxidation, i.e. ACAT1 (Fig. 12D; Supplemental Fig. 7B), ACOT1 (Fig. 12E; Supplemental Fig. 8A), ACOT7 (Fig. 12F monomer and 12G multimer; Supplementary Fig. 8B), HMG-CoA synthase mitochondrial (Fig. 12H; Supplemental Fig. 9A); Group 3: nuclear regulatory proteins of mitochondrial fatty acid oxidative enzymes, i.e. PPARα (Fig. 12I; Supplemental Fig. 9B), RXRα (Fig. 12J; Supplemental Fig. 9C). Western blot images for each protein (n=7) along with GAPDH, COX4, or β-actin housekeeper for normalization are shown in the respective Supplemental Figs. 4–17. WT (Black bars) and LKO (Open bars). Values represent the mean ± SEM, n=7, with statistical significance indicated as follows: * p≤ 0.05 vs WT mice on control diet; @ p≤ 0.05 vs LKO mice on control diet; and #p≤ 0.05 vs WT mice HGD.
LKO alone decreased liver protein of CPT1A, the rate limiting enzyme in mitochondrial oxidation (Fig. 12A), ACOT1 (Fig. 12E), HMG-CoA Synthase (Fig. 12H), and PPARα (Fig. 12I), but increased that of CPT2 (Fig. 12B). Except for decreased Hmgcs mRNA, these changes were overall not associated with corresponding changes in mRNA transcription of these and other mitochondrial fatty acid oxidative genes (Supplemental Table 3).
In HGD fed mice, LKO also decreased hepatic protein levels of ACOT1 (Fig. 12E), HMG-CoA Synthase (Fig. 12H), and PPARα (Fig. 12I) as well as ACOT7 (Fig. 12F,G) while increasing ACAT1 (Fig. 12D). Again, the respective mRNA changes poorly correlated with corresponding changes in protein levels of these and other mitochondrial fatty acid oxidative genes (Supplemental Table 3).
Taken together, HGD alone had little overall effect on the mitochondrial fatty acid oxidative genes—consistent with little or no change in serum and liver β-hydroxybutyrate (Fig. 4B,C). Regardless of diet, however, LKO overall decreased mitochondrial fatty acid oxidative genes—consistent with decreased serum β-hydroxybutyrate (Fig. 4B).
Effect of L-fabp gene ablation (LKO) and pair-fed high glucose diet (HGD) on hepatic expression of proteins/enzymes involved in peroxisomal fatty acid β-oxidation and endoplasmic reticulum fatty acid ω-oxidation:
Fatty acid oxidation occurs not only in mitochondria, but also peroxisomes and endoplasmic reticulum. Thus, Western blotting and rtPCR was performed to determine impact of LKO and HGD on hepatic protein and/or mRNA levels of these proteins/enzymes.
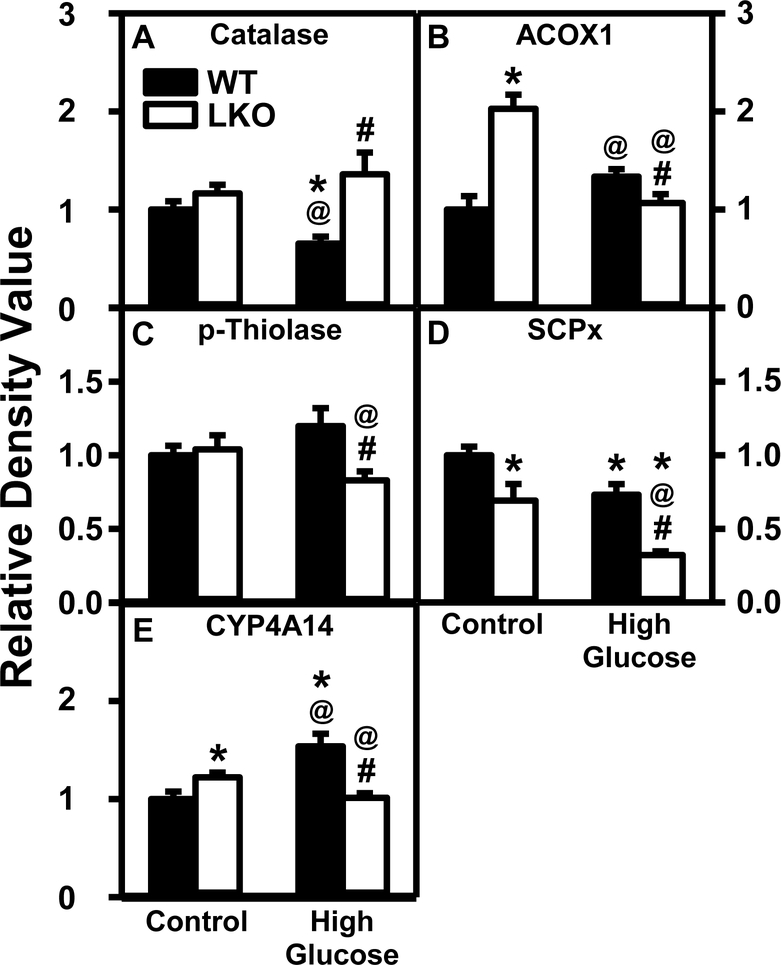
In WT mice the HGD alone significantly decreased liver protein levels of peroxisomal proteins [i.e. catalase (Fig. 13A) and SCP-x (Fig. 13D)] while not altering ACOX1 (Fig. 13B) or p-thiolase (Fig. 13C). Concomitantly, HGD increased the endoplasmic reticulum protein CYP4A14 (Fig. 13E). Liver mRNA transcription of Scp2 and Acox2 also decreased while that of Acox1 and Cyp4a14 did not (Supplemental Table 3). LKO alone increased hepatic peroxisomal protein level of ACOX1 (Fig. 13B) while decreasing that of SCP-x (Fig. 13D). LKO also increased endoplasmic reticulum protein CYP4A14 (Fig. 13E). However, these changes were not associated with altered transcription of the respective mRNAs (Supplemental Table 3). In HGD fed mice the LKO decreased hepatic protein levels of peroxisomal ACOX1 (Fig. 13B), p-thiolase (Fig. 13C), and SCP-x (Fig. 13D) while increasing only catalase (Fig. 13A). Likewise in HGD fed mice the LKO decreased liver level of the endoplasmic reticulum CYP4A14 (Fig. 13E).
Figure 13. Lfabp gene ablation (LKO) and pair-fed high glucose diet (HGD) differentially alter liver protein levels of key enzymes/proteins in peroxisomal and endoplasmic reticulum fatty acid oxidation.
All conditions were as described in Fig. 9 except that SDS-PAGE and Western blotting were performed to determine relative hepatic protein levels of: Group 1: peroxisomal proliferation, i.e. catalase (Fig. 13A; Supplemental Fig. 4A); Group 2; peroxisomal fatty acid β–oxidation, i.e. ACOX1 (Fig. 13B; Supplemental Fig. 4B), pthiolase (Fig. 13C; Supplemental Fig. 5A); Group 3, peroxisomal fatty acid β- and α-oxidation, i.e. SCPx (Fig. 13D; Supplemental Fig. 5B); Group 4, endoplasmic reticulum ω-oxidation, i.e. CYP4A14 (Fig. 13E; Supplemental Fig. 4B). Western blot images for each protein (n=7) along with GAPDH, COX4, or β-actin housekeeper for normalization are shown in the respective Supplemental Figs. 4–17. WT (Black bars) and LKO (Open bars). Values represent the mean ± SEM, n=7, with statistical significance indicated as follows: * p≤ 0.05 vs WT mice on control diet; @ p≤ 0.05 vs LKO mice on control diet; and #p≤ 0.05 vs WT mice HGD.
Taken together, these findings that HGD alone did not overall alter key hepatic proteins in peroxisomal fatty acid β-oxidation, but increased the key protein in endoplasmic reticulum fatty acid ω-oxidation. In contrast, LKO alone overall appeared to increase key proteins in peroxisomal fatty acid β-oxidation and endoplasmic reticulum fatty acid ω-oxidation—but not in HGD fed mice.
L-fabp gene ablation (LKO) and pair-fed high glucose diet (HGD) differentially impact hepatic expression of proteins/enzymes involved in lipoprotein assembly/secretion/metabolism.
Hepatic levels of fatty acids/glycerides and cholesterol are determined not only by de novo synthesis, but also by hepatic levels of proteins involved in lipoprotein uptake and secretion. Therefore, the impact of pair-fed HGD on hepatic levels of key proteins in these pathways was determined by Western blotting and mRNA analysis.
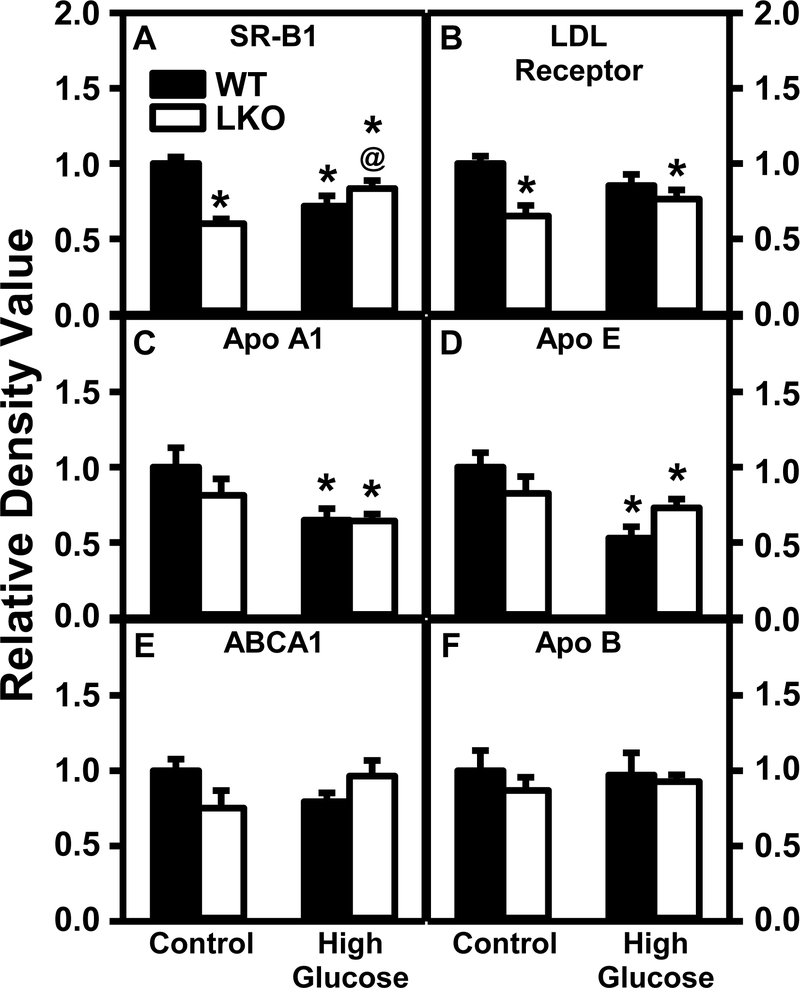
With regards to proteins involved in lipoprotein uptake in WT mice, the HGD alone decreased hepatic protein levels of key proteins in HDL cholesterol uptake [scavenger receptor B1, SRB1 (Fig. 14A)] and trended to decrease that of the LDL receptor (Fig. 14B). LKO alone also decreased hepatic protein level of SRB1 (Fig. 14A) and LDL receptor (Fig. 14B). However, LKO did not further alter the impact of HGD alone on protein levels of these receptors. With regards to proteins involved in lipoprotein secretion, HGD alone significantly decreased hepatic levels of key proteins for HDL formation including apolipoproteinA1 (ApoA1, Fig. 14C) and ApoE (Fig. 14D), despite no increase in ApoA1 mRNA or ApoA2 mRNA (Supplemental Table 4). However, HGD alone had no effect on hepatic level of ABCA1, the key protein involved in cholesterol efflux to nascent HDL (Fig. 14E). Conversely, although HGD alone did not alter the protein level of apolipoprotein B (ApoB) (Fig. 14F) or Apob mRNA (Supplemental Table 4), it decreased transcription of Mttp mRNA (Supplemental Tables 4,5). MTTP is responsible for loading triglycerides and other lipids onto ApoB for formation/secretion of nascent VLDL. HGD alone also decreased hepatic mRNA transcription of Pltp, but not Lpl, key proteins involved in degradation and remodeling serum lipoproteins, but not of Srebpf2 encoding for multiple proteins in cholesterolgenesis (Supplemental Table 3). LKO had little effect on expression of protein levels of ApoA1, ApoE, ABCA1, or ApoB (Figs. 14 C–F) regardless of diet.
Figure 14. Lfabp gene ablation (LKO) and pair-fed high glucose diet (HGD) both decrease key liver receptors/proteins in lipoprotein-mediated cholesterol uptake.
All conditions were as described in Fig. 9 except that SDS-PAGE and Western blotting were performed to determine relative hepatic protein level of key lipoprotein receptors in cholesterol uptake [i.e. SR-B1 (Fig. 14A; Supplemental Fig. 9A), LDL receptor (Fig. 14B; Supplemental Fig. 9B, 15A)] as well as key apoproteins involved in nascent HDL secretion [apolipoproteinA1 (ApoA1, Fig. 14C; Supplemental Fig. 12B); ApoE (Fig. 14D; Supplemental Fig. 13A); ABCA1, (Fig. 14E; Supplemental Fig. 10B)], and nascent VLDL secretion/metabolism, i.e. apolipoprotein B (ApoB) (Fig. 14F; Supplemental Fig. 13B). Western blot images for each protein (n=7) along with GAPDH, COX4, or β-actin housekeeper for normalization are shown in the respective Supplemental Figs. 4–17. Western blots of MTTP were attempted several times under different conditions, but failed. WT (Black bars) and LKO (Open bars). Values represent the mean ± SEM, n=7, with statistical significance indicated as follows: * p≤ 0.05 vs WT mice on control diet; @ p≤ 0.05 vs LKO mice on control diet; and #p≤ 0.05 vs WT mice HGD.
Thus, overall pair-fed HGD alone, LKO alone, or both together: i) decreased liver protein levels of SRB1 and LDL receptor responsible for uptake of HDL and LDL, respectively; ii) altered the contents of apolipoproteins A1 and E—key components of nascent HDL secretion and HDL mediated reverse cholesterol, respectively; and ii) decreased transcription of Mttp mRNA which codes for MTTP protein that facilitates assembly/transport of lipids to apoB for nascent VLDL formation.
Effect of L-fabp gene ablation (LKO) and pair-fed high glucose diet (HGD) on hepatic expression of proteins/enzymes involved in de novo cholesterol synthesis and metabolism:
The possibility that HGD- and/or LKO-induced changes in hepatic cholesterol (C, CE) and serum lipoprotein cholesterol (C, CE) was associated with altered expression of proteins/enzymes and mRNA transcription of proteins in cholesterol de novo biosynthesis and degradation was considered.
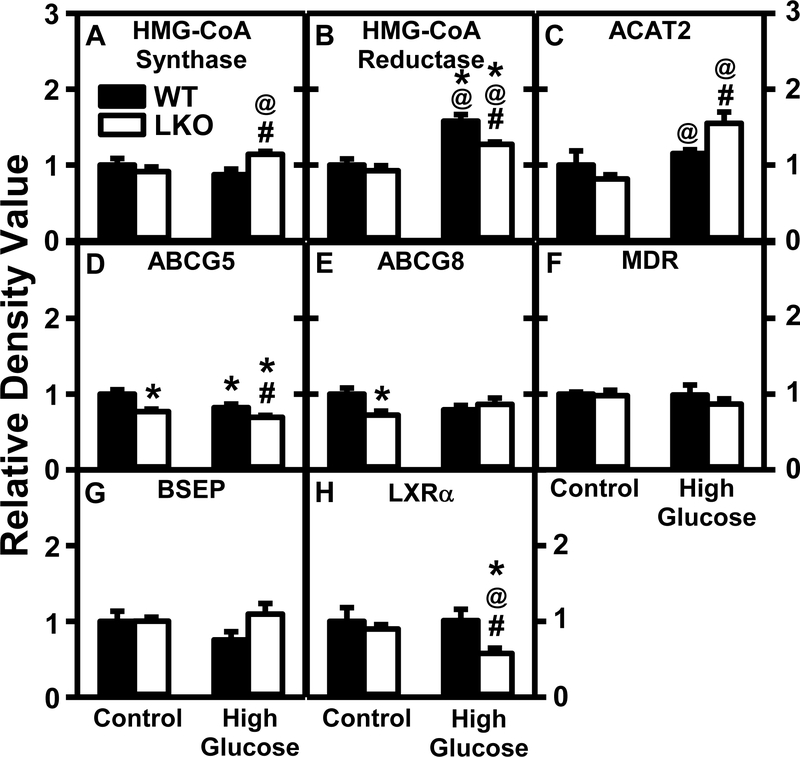
Western blotting revealed that while in WT mice the HGD alone did not alter liver level of HMG-CoA synthase (Fig. 15A), it increased hepatic protein level of HMG-CoA reductase which is the rate limiting enzyme of cholesterol biosynthesis (Fig. 15B). This was not associated with increased Srebf2 mRNA encoding the SREBP2 protein which in the nucleus regulates transcription of these and other genes in cholesterol biosynthesis (Supplemental Table 4). With regards to cholesterol anabolic metabolism, HGD alone had no effect on hepatic protein level of acyl CoA cholesterol acyltransferase, the key enzyme forming cholesteryl esters which are also secreted in native VLDL (ACAT, Fig. 15C)—despite decreased Acat mRNA transcription (Supplemental Table 4). With regards to cholesterol excretion into bile, HGD alone slightly decreased hepatic levels of ABCG5 (Fig. 15D), but not ABCG8 (Fig. 15E)—obligate heterodimers in the bile canalicular membrane mediating cholesterol efflux into bile. Finally, with regards to key enzymes in cholesterol oxidation into bile acids, HGD alone had little effect on transcription of Cyp27A1 and Cyp7A1 mRNAs encoding the major and minor rate limiting enzymes of bile biosynthesis, respectively, or of Baat mRNA encoding BAAT protein for conjugating bile acid with taurine. HGD also did not alter several other proteins needed for cholesterol cotransport into bile such as MDR/ABCB4 which transports phosphatidylcholine across bile canaliculus into bile (Fig. 15F) or its mRNA transcript (Supplemental Table 4) and bile salt export protein (BSEP) which transports bile salts across the bile canaliculus into bile (Fig. 15G). Finally, HGD alone did not alter hepatic protein level of a key nuclear receptor in bile acid metabolism, liver X receptor-α (LXRα, Fig. 15H).
Figure 15. Effect of Lfabp gene ablation (LKO) and pair-fed high glucose diet (HGD) on key liver enzymes/proteins in cholesterol de novo synthesis, esterification, and biliary excretion.
All conditions were as described in Fig. 9 except that SDS-PAGE and Western blotting were performed to determine relative hepatic protein levels of: Group 1: de novo cholesterol synthesis, i.e. HMG-CoA synthase (Fig. 15A; Supplemental Fig. 10B, 16A), HMG-CoA reductase (Fig. 15B; Supplemental Fig. 14A); Group 2, cholesterol esterification, i.e. ACAT2 (Fig. 15C; Supplemental Fig. 14B); Group 3, biliary cholesterol excretion, i.e. ABCG5 (Fig. 15D; Supplemental Fig. 15A), ABCG8 (Fig. 15E; Supplemental Fig. 7A); Group 4, biliary excretion of bile acids or other substances, i.e. MDR (Fig. 15F; Supplemental Figs. 5A, 8A), BSEP (Fig. 15G; Supplemental Fig. 6B, 14B); Group 5, nuclear regulation of genes in cholesterol metabolism, LXRα (Fig. 15H; Supplemental Fig. 15B). Western blot images for each protein (n=7) along with GAPDH, COX4, or β-actin housekeeper for normalization are shown in the respective Supplemental Figs. 4–17. WT (Black bars) and LKO (Open bars). Values represent the mean ± SEM, n=7, with statistical significance indicated as follows: * p≤ 0.05 vs WT mice on control diet; @ p≤ 0.05 vs LKO mice on control diet; and #p≤ 0.05 vs WT mice HGD.
LKO alone had little effect on any of the liver levels of the above proteins (Fig. 15A–C, F–H), except for the two bile canalicular cholesterol transporters (ABCG5, ABCG8) both of which were decreased (Fig. 15D,E). However, LKO alone increased liver mRNA transcripts for Cyp27A1, Cyp7A1, Baat, and Mdr/Abcb4 but not Srebf2 mRNA (Supplemental Table 4).
Conversely, in HGD fed mice the LKO significantly increased liver protein levels of HMG-CoA synthase (Fig. 15A) and ACAT (Fig. 15C) but blocked/diminished the HGD-induced increase in HMG-CoA reductase (Fig. 15B), decrease in ABCG5 (Fig. 15D), and exacerbated that of LXRα (Fig. 15H). While in HFG fed mice the LKO did not further impact the liver levels of multiple mRNA transcripts in bile acid synthesis/excretion (i.e. Cyp27A1, Cyp7A1, Mdr/Abcb4 and Baat), it did increase that of Srebf2 mRNA (Supplemental Table 4).
Together, these data suggested that HFG alone significantly increased hepatic proteins involved in de novo cholesterol synthesis while reducing those in biliary cholesterol excretion. LKO alone suggested decreased proteins in biliary secretion of cholesterol but not of bile acids into bile. Finally, in HGD fed mice the LKO reduced the HGD-induced protein in cholesterol synthesis and biliary secretion while increasing that in cholesterol esterification.
DISCUSSION
It is estimated that world-wide as many as a billion humans are affected by nonalcoholic fatty liver disease (NAFLD) [63]. NAFLD is associated not only with overconsumption of high-fat diets (HFD), but increasing evidence indicates that high intake of sugar-sweetened drinks is also a major risk factor [58–60,64–67]. Since most studies on the impact of high sugar focus on diets high in carbohydrate, high in fructose, and fed ad libitum they do not discriminate between potential food preference, caloric intake, and the role of glucose in the diet. Although the hallmark of NAFLD is hepatic triacylglycerol (TG) accumulation, nearly 25% of TG-derived fatty acid is de novo synthesized from dietary sugar and amino acids rather than originating from dietary fat [6]. However, almost nothing is known regarding the effects of glucose and L-FABP on hepatic TG accumulation—especially in the context of pair-feeding/caloric restriction. To begin to address these issues, wild-type (WT, L-FABP+/+) and Lfabp gene ablated (LKO, LFABP−/−) mice were fed either a defined control-diet or pair-fed isocaloric high glucose diet (HGD). The data provide the following significant new insights.
First, in WT mice the pair-fed HGD alone significantly decreased whole body weight gain—both as lean tissue mass (LTM) and fat tissue mass (FTM). This effect was markedly opposite to the effect of ad libitum fed diets high in glucose which increased whole body weight [58,59,62] and visceral fat [64]. These very different responses are attributable at least in part to increased caloric intake (hyperphagia) of ad libitum fed high glucose diet [62]. In contrast, in the current dietary study, the proportion of glucose within the carbohydrate fraction was increased concomitant with a decrease in fructose. While lower total dietary carbohydrate as fructose would be expected to decrease weight gain [64–67], it is less clear whether lower fructose in the context of constant total carbohydrate, fat and protein would also do so or not. Taken together, these data indicate that increased whole body weight gain and adiposity in response to high glucose diet was highly dependent on the feeding regimen. Since paired-feeding HGD (with constant amounts and proportions total carbohydrate, fat and protein in the diet) does not increase whole body weight gain or adiposity, while ad libitum fed HGD (increased total caloric intake as carbohydrate) increases both, these data suggest that high glucose per se is not significantly contributing to increases to body weight and adiposity.
In marked contrast to pair-fed HGD alone, the ablation of Lfabp (LKO) increases whole body weight gain, both as fat tissue mass (FTM) and lean tissue mass (LTM), on either diets. This was consistent with earlier studies of the impact of LKO in mice fed other types of control- vs a high fat diet (HFD) wherein increased weight gain and/or obesity was observed [19,39,68,69]. Interestingly, the effect of pair-fed HGD on FTM in LKO mice was similar to that of WT mice. This effect suggests that Lfabp gene ablation similarly increases body weight gain and adiposity regardless of dietary glucose versus dietary fat as energy source.
Second, in WT mice the pair-fed HGD did not alter liver weight, histological appearance, triacylglycerol (TG) or other lipid content. The lack of TG accumulation was associated with several opposing factors. Liver protein level changes that favored decreased TG accumulation included: i) Decreased MAP17—a facilitator of GLUT2 mediated glucose uptake; ii) Decreased transcription of Acaca—the rate limiting enzyme in de novo fatty acid synthesis; iii) Complete loss of the major cytosolic fatty acid transport protein (L-FABP) as well as reduced SCP-2 which were compensated for only in part by upregulation of FABP2-a minor FABP family member in liver. These changes were incompletely compensated by increased: i) Insulin receptor which induces GLUT2 translocation to the plasma membrane; ii) Membrane fatty acid transporters (FATP2, FATP4, GOT) which facilitate fatty acid translocation across membranes; iii) Enzymes in fatty acid elongation (ELOVL5) and TG synthesis (ACOT1, ACOT7). Overall, these results are consistent with the known inability of glucose to be converted into free fatty acids [70]. These findings were in marked contrast to ad libitum fed HGD which, while not altering liver weight, nevertheless increased hepatocyte vacuolation and hepatic triacylglyceride (TG) accumulation [62]. The latter increase in hepatic TG was associated with increased enzymes in both de novo fatty acid synthesis and TG synthesis concomitant with decreases in most, but not all (e.g. Acsl, CPT1A) enzymes in fatty acid oxidation [62]. However, in WT mice the HGD did not alter either serum or liver levels of β-hydroxybutyrate—a physiological marker for fatty acid β-oxidation. In future studies beyond the scope of the present investigation, it would be important to further explore the impact of LKO and HGD on lipoprotein secretion rates and additional aspects of lipid/glucose metabolism in vivo and in cultured primary hepatocytes. Taken together, these findings indicate that hepatic TG accumulation, a hallmark of NAFLD, in response to HGD is also highly dependent on the feeding regimen. Unlike ad libitum fed HGD, the pair-fed HGD did not induce fatty liver—suggesting that high glucose per se did not contribute to fatty liver.
With the control diet, LKO increased liver vacuolation was associated with accumulation of membranous polar lipid [phospholipid (PL), free cholesterol (C)] and less so neutral lipid [cholesteryl ester (CE), but not triacylglycerol (TG)]. The inability of LKO alone to alter triacylglycerol in HGD fed mice was consistent with decreased: i) GLUT2 for glucose uptake; ii) enzymes in fatty acid de novo synthesis (ACLY, ACSS2) and elongation (ELOVL5); iii) complete loss of L-FABP, a major cytosolic fatty acid/fatty acyl-CoA transport protein that stimulates glyceride formation [71–73] which was only partially compensated for by upregulation of a minor cytosolic fatty acid binding protein in liver (FABP2) and by decreases in hepatic enzymes (CPT1A, CPT2) leading to net decreased β-oxidation as indicated by decreased serum β-hydroxybutyrate. In additional support of these data, in vitro studies with recombinant proteins (L-FABP, PPARα), transfected cells, and primary hepatocytes have shown that glucose binds/interacts with: i) L-FABP to impact its conformation and alter its ability to bind fatty acids [40,41]; ii) PPARα to alter its binding of fatty acids [21]; iii) L-FABP and PPARα to alter LFABP/PPARα complex formation [23,41,42]; and iv) L-FABP to increase L-FABP-mediated ligand transfer to and activation of PPARα in the nucleus [24,41,45].
The lack of effect of LKO on hepatic TG in response to pair-fed HGD is notable in that LKO significantly exacerbates/increases hepatic TG accumulation in mice pair-fed high fat diet (HFD) [38]. The finding that LKO did not increase hepatic TG accumulation when pair-fed HGD diet was consistent with decreased: i) liver enzymes in de novo lipogenesis (Acaca, ACLY, ACSS2) and elongation (ELOVL5); ii) membrane fatty acid transporters (GOT); iii) complete loss of the major cytosolic fatty acid/fatty acyl-CoA transporter L-FABP which stimulates glyceride formation [14,72,73]. These effects of LKO were counteracted only in part by increased level of SCP-2, another fatty acid/fatty acyl CoA binding protein that stimulates glyceride formation [74,75], and by decreased expression of key proteins in fatty acid oxidation (ACOT7, HMG-CoA synthase, PPARα) resulting in a smaller decrease in serum β-hydroxybutyrate than elicited in control fed mice. These findings indicated that LKO selectively decreased hepatic TG accumulation in response to de novo synthesized fatty acids from pair-fed HGD, but not those from LKO mice pair-fed HFD. This was consistent with 75% of NAFLD being caused by excess caloric consumption of dietary fat while only 25% of NAFLD is associated with excess caloric consumption of carbohydrate [6].
Third, in the WT mice, the pair-fed HGD alone significantly increased serum content of triacylglyceride (TG) and trended towards increased VLDL (the major TG-rich lipoprotein). The increased serum TG was associated with decreased hepatic expression of mRNAs encoding serum proteins in lipoprotein metabolism (Pltp) as well as hepatic protein levels (ACSL1, ACAT1, SCPx) and/or mRNAs (Acsl1, Acot2, Acadl, Acads, Acadvl, Hmgcs1, Acox1, Cyp4a14) of enzymes in fatty acid oxidation. However, in WT mice the HGD did not alter serum and liver levels of β-hydroxybutyrate—a physiological marker for fatty acid β-oxidation. In future studies beyond the scope of the present investigation, it would be important to further explore the impact of LKO and HGD on lipoprotein secretion rates and additional aspects of lipid/glucose metabolism in vivo and in cultured primary hepatocytes. These findings were consistent with human studies with an isocaloric high glucose diet that also increased serum TG and VLDL, attributable to decreased serum TG clearance and/or decreased fatty acid oxidation [76]. It is important to note that earlier in vitro studies with isolated microsomes and recombinant L-FABP protein showed that L-FABP enhances fatty acyl-CoA incorporation into glycerides [14,15,72,73]. Furthermore, studies with transfected cells overexpressing L-FABP and with cultured primary hepatocytes from LKO mice indicated that L-FABP enhances and inhibits fatty acyl-CoA targeting towards fatty acid oxidation, respectively [9,18,26,77]. LKO alone also increased serum TG (with a trend toward increased VLDL) which was associated with several changes in liver including: i) reduced fatty acid oxidation (reduced serum α-hydroxybutyrate) concomitant with decreased protein levels of key fatty acid oxidative enzymes (CPT1A, ACOT1, HMG-CoA synthase) and several mRNA transcripts (Acsl1, Hmgcs1, Acox1, Cyp4a14); iii) decreased protein levels of HDL and LDL receptors (SRB1, LDL-R); iii) completely ablated LFABP which facilitates HDL-mediated cholesterol uptake [25] and impairs liver biliary HDL-cholesterol secretion [26,27]; iv) decreased bile canalicular transporters for excreting cholesterol into bile (ABCG5, ABCG8). This was only compensated in part by increased hepatic protein levels of enzymes/proteins in lipoprotein metabolism (Lpl, Pltp) and complete loss of L-FABP which would reduce production of glyceride substrate for loading of ApoB and nascent VLDL secretion. Levels of key apoproteins and transporters involved (ApoA1, ApoE, ApoB, Mttp) remained unchanged. In HFD-fed mice the LKO did not further exacerbate the HGD-induced increase in serum TG—suggesting that the two effects were not additive. However, the LKO did modestly alter the distribution of TG into LDL vs HDL, depending upon diet. We speculate that, based on these findings, that hepatic secretion of VLDL and its metabolism may be altered in LKO mice. However, before such speculation can be considered valid, in future studies VLDL production and turnover rates in these mice must be determined.
Fourth, although neither pair-fed HGD nor LKO nor both together significantly altered serum levels of other lipids (C, CE, TC, PL, NEFA), the relative distribution of cholesterol and phospholipid was significantly altered within the individual lipoprotein classes. Overall, LKO favored increased cholesterol/phospholipid ratio in LDL, which would be expected to increase the rigidity of the monolayer of lipid surrounding the LDL. While this was associated with increased hepatic expression of proteins involved in serum lipoprotein metabolism (Lpl, Pltp), the increased C/PL ratio may have actually altered the ability of these enzymes to act on the lipoproteins—consistent with the observed LKO-induced increase in TG above as well as the LKO-induced decreased in LDL protein (only in control-fed mice). LKO also decreased the HDL content of total cholesterol and cholesteryl ester in control-fed mice as well as also free cholesterol but only in HGD mice. Indeed, L-FABP is known to play a significant role in decreasing HDL-mediated uptake of cholesterol in cultured primary hepatocytes [51] and impairs liver biliary secretion of HDL-cholesterol [78,79]. Further studies beyond the scope of the present investigation are needed to resolve how HGD and LKO alter the pattern of lipid classes among the serum lipoproteins.
In summary, the pair-fed HGD studies presented herein demonstrated that high glucose per se did not induce weight gain, fat tissue mass (FTM), or fatty liver (TG accumulation)—in marked contrast to prior ad libitum, non isocaloric dietary studies with HGD and/or differed in the proportions of fat, carbohydrate, and protein within the diet [27–30,30–37,62]. In contrast, the studies presented herein were performed under conditions of a paired feeding HGD diet that was isocaloric with the control diet, maintained constant dietary proportions (i.e. fat, carbohydrate, protein), and within the carbohydrate component altered only the proportion of total glucose vs fructose. These data suggest that the impact of HGD on inducing weight gain, obesity, and NAFLD is highly dependent on both feeding regimen and/or altered proportion of total carbohydrate. Since L-FABP is intimately involved not only in fatty acid uptake, but also with intracellular trafficking and metabolic targeting [19,22,24,26,44,45,80], studies were undertaken showing that Lfabp gene ablation (LKO) did not exacerbate pair-fed HGD-induced weight gain, or Fat Tissue Mass (FTM). Further, in pair-fed HGD mice the LKO did not induce TG accumulation (liver, serum), despite the fact that LKO alone induced serum TG accumulation in control-fed mice. Further, pair-fed HGD abolished/reduced LKO’s effect on hepatic and serum accumulation of other lipids (PL, TC, C, CE). Nevertheless, LKO and pair-fed HGD together significantly altered the distribution of lipid classes (TG, TC, C, CE, PL) within individual serum lipoprotein subfractions (VLDL, LDL, HDL) in a complex manner. Taken together, these data suggested that L-FABP may have less impact on liver and serum fatty acid derived from dietary fat than those synthesized de novo within the cell.
Supplementary Material
Highlights.
High glucose diet decreased body weight gain in wild-type mice
LFABP gene ablation increased weight gain on control and high glucose diets
High glucose diet altered serum lipoprotein protein and lipid profile
High glucose diet diminished LFABP gene ablation effect on hepatic and serum lipids
Acknowledgements
This research was supported in part by the US Public Health Service/National Institutes of Health grants RO1 DK41402 (FS, ABK), R25 OD016574 (SM, ABK), and T35 OD010991 (SM, ABK).
Abbreviations:
- ACBP/PDZK1
Acyl CoA binding protein
- ABCG5, ABCG8
ATP binding cassette proteins G5 and G8
- ACOT1, ACOT7
acyl CoA thioesterases 1 and 7
- ACOX1
acyl CoA oxidase
- ACSS2
acyl CoA synthase 2
- ACAT1
acetyl CoA acetyltransferae/acetoacetyl CoA thiolase
- ACAT2
acyl CoA cholesterol acyltransferase 2
- ACLY
ATP citrate lyase
- ACSL1
acyl CoA synthetase long chain family member 1
- AMPKa2
5’-AMP-activated protein kinase catalytic subunit alpha-2
- APOA1, APOB, APOE
apolipoproteins A1, B, and E
- BA
Beta Actin
- BSEP/ABCB11
bile salt export protein/ATP binding cassette B11
- CPT1A, CPT2
carnitine palmitoyl acyltransferases 1A and 2
- ChREBP
carbohydrate response element binding protein
- COX IV
cytochrome c oxidase subunit 4
- CYP4A14
cytochrome P450 4A14
- DEXA
dual emission X-ray absorptiometry
- FTM
fat tissue mass
- FABP1/L-FABP, FABP2/I-FABP
fatty acid binding proteins −1 and −2
- LKO
fatty acid binding protein-1 gene ablated
- ELOVL5, ELOVL6
fatty acid elongases 5 and 8
- FATP2, FABP4, FABP5
fatty acid transport proteins 2, 4, 5
- GCK
glucokinase
- G6Pase
glucose-6-phosphatase
- GLUT2
glucose transport protein 2
- GOT
glutamic oxaloacetic aminotransferase
- GAPDH
glyceraldehyde-3-phosphate dehydrogenase
- 3αHSD
3α-hydroxysteroid dehydrogenase
- IR
insulin receptor
- HDL
high density lipoproteins
- HMGCR
hydroxymethyl CoA reductase
- HMGCSc, HMGCSm
hydroxymethyl CoA synthases cytosolic and mitochondrial subtypes
- HNF4α
hepatocyte nuclear factor 4α
- LTM
lean tissue mass
- LDL
low density lipoprotein
- LDLR
low density lipoprotein receptor
- LXRα
liver X receptor-α
- MAP17
membrane associated protein 17/PDZK1-interacting protein-1
- MDR/Pgp
multidrug resistance protein/ATP binding cassette protein B1
- MTP
microsomal triglyceride transfer protein
- PPARα
peroxisome proliferator-activated receptor-α
- PCK1
protein kinase 1
- RXRα
retinoid X receptor-α
- SR-B1
scavenger receptor B1
- SCP-2
sterol carrier protein 2
- SCP-x
sterol carrier protein x
- SREBP1
sterol regulatory element binding protein-1
- WT
wild-type FABP1
Footnotes
Publisher's Disclaimer: This is a PDF file of an unedited manuscript that has been accepted for publication. As a service to our customers we are providing this early version of the manuscript. The manuscript will undergo copyediting, typesetting, and review of the resulting proof before it is published in its final citable form. Please note that during the production process errors may be discovered which could affect the content, and all legal disclaimers that apply to the journal pertain.
Conflict of interest
The authors declare that they have not conflicts of interest with the contents of this article. Further, the article content is solely the authors’ responsibility and does not necessarily represent the official views of the National Institutes of Health.
REFERENCES
- [1].A Tailleux K Wouters B Staels, Role of PPARs in NAFLD: potential therapeutic targets., Biochim. Biophys. Acta 1821 (2012) pp. 809–818. [DOI] [PubMed] [Google Scholar]
- [2].Puri P, Baillie RA, Wiest MM, Mirshahi F, Choudhury J, Cheung O, Sergeant C, Contos MJ, Sanyal AJ, A lipidomic analysis of nonalcoholic fatty liver disease., Hepatology 46 (2007) pp. 1081–1090. [DOI] [PubMed] [Google Scholar]
- [3].McIntosh AL, Huang H, Storey SM, Landrock K, Landrock D, Petrescu AD, Gupta S, Atshaves BP, Kier AB, Schroeder F, Human FABP1 T94A variant impacts fatty acid metabolism and PPARa activation in cultured human female hepatocytes., Am. J. Physiol. Gastrointest. and Liver Phys 307 (2014) p.G164–G176. [DOI] [PMC free article] [PubMed] [Google Scholar]
- [4].Martin GG, Huang H, McIntosh AL, Kier AB, Schroeder F, Endocannabinoid interaction with human FABP1: impact of the T94A variant., Biochem. 56 (2017) pp. 5147–5159. [DOI] [PubMed] [Google Scholar]
- [5].Martin GG, Landrock D, Dangott LJ, McIntosh AL, Kier AB, Schroeder F, Human FABP1 T94A variant, NAFLD, and Hepatic Endocannabinoid System., Lipids 53 (2018) pp. 27–40. [DOI] [PubMed] [Google Scholar]
- [6].Donnelly KL, Smith CI, Schwarzenberg SJ, Jessurun J, Boldt MD, Parks EJ, Sources of fatty acids stored in liver and secreted via lipoproteins in patients with NAFLD., J. Clin. Invest 115 (2005) pp. 1343–1351. [DOI] [PMC free article] [PubMed] [Google Scholar]
- [7].Murphy EJ, Prows DR, Jefferson JR, Schroeder F, Liver fatty acid binding protein expression in transfected fibroblasts stimulates fatty acid uptake and metabolism, Biochim. Biophys. Acta 1301 (1996) pp. 191–198. [DOI] [PubMed] [Google Scholar]
- [8].Martin GG, Danneberg H, Kumar LS, Atshaves BP, Erol E, Bader M, Schroeder F, Binas B, Decreased liver fatty acid binding capacity and altered liver lipid distribution in mice lacking the liver fatty acid binding protein (L-FABP) gene., J. Biol. Chem 278 (2003) pp. 21429–21438. [DOI] [PubMed] [Google Scholar]
- [9].Atshaves BP, McIntosh AL, Lyuksyutova OI, Zipfel WR, Webb WW, Schroeder F, Liver fatty acid binding protein gene ablation inhibits branched-chain fatty acid metabolism in cultured primary hepatocytes., J. Biol. Chem 279 (2004) pp. 30954–30965. [DOI] [PubMed] [Google Scholar]
- [10].Murphy EJ, L-FABP and I-FABP expression increase NBD-stearate uptake and cytoplasmic diffusion in L-cells., Am. J. Physiol 275 (1998) p.G244–G249. [DOI] [PubMed] [Google Scholar]
- [11].McArthur MJ, Atshaves BP, Frolov A, Foxworth WD, Kier AB, Schroeder F, Cellular uptake and intracellular trafficking of long chain fatty acids, J. Lipid Res 40 (1999) pp. 1371–1383. [PubMed] [Google Scholar]
- [12].Weisiger RA, Cytoplasmic transport of lipids: Role of binding proteins, Comp. Biochem. Physiol 115B (1996) pp. 319–331. [Google Scholar]
- [13].Weisiger RA, Cytosolic fatty acid binding proteins catalyze two distinct steps in intracellular transport of their ligands., Mol. Cell. Biochem 239 (2005) pp. 35–42. [PubMed] [Google Scholar]
- [14].Jolly CA, Hubbell T, Behnke WD, Schroeder F, Fatty acid binding protein: Stimulation of microsomal phosphatidic acid formation., Arch. Biochem. Biophys 341 (1997) pp. 112–121. [DOI] [PubMed] [Google Scholar]
- [15].Jolly CA, Murphy EJ, Schroeder F, Differential influence of rat liver fatty acid binding protein isoforms on phospholipid fatty acid composition: phosphatidic acid biosynthesis and phospholipid fatty acid remodeling., Biochim. Biophys. Acta 1390 (1998) pp. 258–268. [DOI] [PubMed] [Google Scholar]
- [16].Nemecz G and Schroeder F, Selective binding of cholesterol by recombinant fatty acid-binding proteins, J. Biol. Chem 266 (1991) pp. 17180–17186. [PubMed] [Google Scholar]
- [17].Atshaves BP, Storey SM, Petrescu AD, Greenberg CC, Lyuksyutova OI, Smith R, Schroeder F, Expression of fatty acid binding proteins inhibits lipid accumulation and alters toxicity in L-cell fibroblasts., Am. J. Physiol 283 (2002) p.C688–C703. [DOI] [PubMed] [Google Scholar]
- [18].Atshaves BP, Storey S, Huang H, Schroeder F, Liver fatty acid binding protein expression enhances branched-chain fatty acid metabolism., Mol. Cell. Biochem 259 (2004) pp. 115–129. [DOI] [PubMed] [Google Scholar]
- [19].Atshaves BP, Martin GG, Hostetler HA, McIntosh AL, Kier AB, Schroeder F, Liver fatty acid binding protein (L-FABP) and Dietary Obesity., Journal of Nutritional Biochemisty 21 (2010) pp. 1015–1032. [DOI] [PMC free article] [PubMed] [Google Scholar]
- [20].Hostetler HA, McIntosh AL, Atshaves BP, Storey SM, Payne HR, Kier AB, Schroeder F, Liver type Fatty Acid Binding Protein (L-FABP) interacts with peroxisome proliferator activated receptor-α in cultured primary hepatocytes., J. Lipid Res 50 (2009) pp. 1663–1675. [DOI] [PMC free article] [PubMed] [Google Scholar]
- [21].Hostetler HA, Huang H, Kier AB, Schroeder F, Glucose directly links to lipid metabolism through high-affinity interaction with peroxisome proliferator activated receptor-alpha., J. Biol. Chem 283 (2008) pp. 2246–2254. [DOI] [PubMed] [Google Scholar]
- [22].Schroeder F, Petrescu AD, Huang H, Atshaves BP, McIntosh AL, Martin GG, Hostetler HA, Vespa A, Landrock K, Landrock D, Payne HR, Kier AB, Role of fatty acid binding proteins and long chain fatty acids in modulating nuclear receptors and gene transcription., Lipids 43 (2008) pp. 1–17. [DOI] [PubMed] [Google Scholar]
- [23].Velkov T, Interactions between human liver fatty acid binding protein and peroxisome proliferator activated receptor drugs., PPAR Research 2013 (2013) pp. 1–14. [DOI] [PMC free article] [PubMed] [Google Scholar]
- [24].Petrescu AD, Huang H, Martin GG, McIntosh AL, Storey SM, Landrock D, Kier AB, Schroeder F, Impact of L-FABP and glucose on polyunsaturated fatty acid induction of PPARa regulated b-oxidative enzymes., Am. J. Physiol. Gastrointest. and Liver Phys 304 (2013) p.G241–G256. [DOI] [PMC free article] [PubMed] [Google Scholar]
- [25].Atshaves BP, Foxworth WB, Frolov AA, Roths JB, Kier AB, Oetama BK, Piedrahita JA, Schroeder F, Cellular differentiation and I-FABP protein expression modulate fatty acid uptake and diffusion., Am. J. Physiol 274 (1998) p.C633–C644. [DOI] [PubMed] [Google Scholar]
- [26].McIntosh AL, Atshaves BP, Hostetler HA, Huang H, Davis J, Lyuksyutova OI, Landrock D, Kier AB, Schroeder F, Liver type fatty acid binding protein (L-FABP) gene ablation reduces nuclear ligand distribution and peroxisome proliferator activated receptor-alpha activity in cultured primary hepatocytes., Arch. Biochem. Biophys 485 (2009) pp. 160–173. [DOI] [PMC free article] [PubMed] [Google Scholar]
- [27].Kamath S, Chavez AO, Gestaldelli A, et al. , Coordinated defects in hepatic long chain fatty acid metabolism and triglyceride accumulation contribute to insulin resistance in non-human primates., PLoS ONE 6 (2011) p.e27617. [DOI] [PMC free article] [PubMed] [Google Scholar]
- [28].Cambridge C Podrini E.L., Lelliott CJ, White JK, High fat feeding rapidly induces obesity and lipid derangements in C57BL/6N mice., Mammalian Genome 24 (2013) p.251. [DOI] [PMC free article] [PubMed] [Google Scholar]
- [29].Luo Y, Burrington CM, Graff EC, Zhang J, Judd RL, Suksaranjit P, Kaewpoowat Q, Davenport SK, O’Neill AM, Greene MW, Metabolic phenotype and adipose and liver features in the high fat Western diet-induced mouse., Am. J. Physiol. Endocrinol. Metab doi: 10.1152/ajpendo.00319.2015 (2015). [DOI] [PMC free article] [PubMed] [Google Scholar]
- [30].Fengler VHI, Macheiner T, Kessler SM, Czepukojc B, Gemperlein K, Muller R, Kiemer AK, Magnes C, Haybaeck J, Lackner C, Sargsyan K, Susceptibility of different mouse wild-type strains to develop diet induced NAFLD/AFLD associated liver disease., PLoS ONE 11 (2016) p.e0155163. doi: 10.1371/journal.pone.0155163. [DOI] [PMC free article] [PubMed] [Google Scholar]
- [31].Dahlhoff C Desmarchelier C, Sailer M, Furst RW, Haag A, Ulbrich SE, Hummel B, Obeid R, Geisel J, Bader BL, Daniel H, Hepatic methionine homeostasis is conserved in C57BL/6N mice on high-fat diet despite major changes in hepatic one carbon metabolism., PLoS ONE 8 (2013) p.e57387. doi: 10.1371/journal.pone.0057387 [DOI] [PMC free article] [PubMed] [Google Scholar]
- [32].Tessitore A Cicciarelli G, Vecchio F. Del, Gaggiano A, Alesse E, MicroRNA expression analysis in high fat diet induced NAFLD-NASH-HCC progression: Study on C57BL/6J mice., BMC Cancer 16 (2016) p.doi: 10.1186/s12885-015-2j007-1. [DOI] [PMC free article] [PubMed] [Google Scholar]
- [33].Liu C Rajapaks AG, Riedo E, Fellay B, Bernhard MC, Montani J-P, Yang Z, Ming X-F, Targeting arginiase-II protects mice from high fat diet induced hepatic steatosis through suppression of macrophage inflammation., Scientific Reports 6 (2016) p.doi:10:1038/srep20405. [DOI] [PMC free article] [PubMed] [Google Scholar]
- [34].Roychowdhury S McCullough RL, Sanz-Garcia C, Saikia P, Alkhouri N, Matloob A, Pollard KA, McMullen MR, Croniger CM, Nagy LE, Receptor interacting protein 3 protects mice from high fat diet induced liver injury., Hepatology DOI 10.1002/hep.28676 (2016) p.16. [DOI] [PMC free article] [PubMed] [Google Scholar]
- [35].VanSaun MN Lee IK, Washington MK, Matrisian L, Gordon DL, High fat induced hepatic steatosis establishes a permissive microenvironment for colorectal metastases adn promotes primary dysplasia in a murine model., Am. J. Pathol 175 (2009) pp. 355–364. [DOI] [PMC free article] [PubMed] [Google Scholar]
- [36].Duval C Thissen W, Keshtar S, Accart B, Stienstra R, Boekschoten MV, Roskams T, Kersten S, Muller M, Adipose tissue dysfunction signals progression of hepatic steatosis towards NASH in C57BL/6J mice., Diabetes 59 (2010) pp. 3181–3191. [DOI] [PMC free article] [PubMed] [Google Scholar]
- [37].Cotter DG Ercal B, Huang X, Leid JM, d’Avignon DA, Graham MJ, Dietzen DJ, Brunt EM, Patti GJ, Crawford PA, Ketogenesis prevents diet induced fatty liver injury and hyperglycemia., J. Clin. Invest 124 (2014) pp. 5175–5190. [DOI] [PMC free article] [PubMed] [Google Scholar]
- [38].Martin GG Landrock D, Chung S, Dangott LJ, McIntosh AL, Mackie JT, Kier AB, Schroeder F, Loss of fatty acid binding protein-1 alters the hepatic endocannabinoid system response to a high fat diet., J. Lip. Res 58 (2017) pp. 2124–2126. [DOI] [PMC free article] [PubMed] [Google Scholar]
- [39].Atshaves BP McIntosh AL, Kier AB, Schroeder F, High dietary fat exacerbates weight gain and obesity in female liver fatty acid binding protein gene ablated mice., Lipids 45 (2010) pp. 97–110. [DOI] [PMC free article] [PubMed] [Google Scholar]
- [40].Stewart JM Dewling VF, Wright TG, Fatty acid binding to rat liver fatty acid-binding protein is modulated by early glycolytic intermediates, Biochimica. Et. Biophysica. Acta 1391 (1998) pp. 1–6. [DOI] [PubMed] [Google Scholar]
- [41].Hostetler HA Balanarasimha M, Huang H, Kelzer MS, Kaliappan A, Kier AB, Schroeder F, Glucose regulates fatty acid binding protein interaction with lipids and PPARα, J. Lipid Res 51 (2010) pp. 3103–3116. [DOI] [PMC free article] [PubMed] [Google Scholar]
- [42].Smathers RL Galligan JJ, Shearn CT, Fritz KS, Mercer K, Ronis M, Orlicky DJ, Davidson NO, Petersen DR, Susceptibility of L-FABP −/− mice to oxidative stress in early-stage alcoholic liver., J. Lipid Res 54 (2013) pp. 1335–1345. [DOI] [PMC free article] [PubMed] [Google Scholar]
- [43].Hostetler HA Petrescu AD, Kier AB, Schroeder F, Peroxisome proliferator activated receptor alpha (PPARalpha) interacts with high affinity and is conformationally responsive to endogenous ligands., J. Biol. Chem 280 (2005) pp. 18667–18682. [DOI] [PubMed] [Google Scholar]
- [44].Hostetler HA McIntosh AL, Petrescu AD, Huang H, Atshaves BP, Murphy EJ, Kier AB, Schroeder F, Fluorescence Methods to Assess the Impact of Lipid Binding Proteins on Ligand Activated Gene Expression., in: Murphy EJ and Rosenberger TA (Eds.), Methods in Lipid-Mediated Signaling, Methods in Signal Transduction Series, CRC Press-Taylor and Francis Group, LLC, Boca Raton, FL, 2010, pp. 299–348. [Google Scholar]
- [45].Petrescu AD McIntosh AL, Storey SM, Huang H, Martin GG, Landrock D, Kier AB, Schroeder F, High glucose potentiates liver fatty acid binding protein (L-FABP) mediated fibrate induction of PPARa in mouse hepatocytes., Biochim. Biophys. Acta 1831 (2013) pp. 1412–1425. [DOI] [PMC free article] [PubMed] [Google Scholar]
- [46].Atshaves BP Petrescu A, Starodub O, Roths J, Kier AB, Schroeder F, Expression and Intracellular Processing of the 58 kDa Sterol Carrier Protein 2/3-Oxoacyl-CoA Thiolase in Transfected Mouse L-cell Fibroblasts, J. Lipid Res 40 (1999) pp. 610–622. [PubMed] [Google Scholar]
- [47].Atshaves BP Payne HR, McIntosh AL, Tichy SE, Russell D, Kier AB, Schroeder F, Sexually dimorphic metabolism of branched chain lipids in C57BL/6J mice., J. Lipid Res 45 (2004) pp. 812–830. [DOI] [PubMed] [Google Scholar]
- [48].Mackie JT Atshaves BP, Payne HR, McIntosh AL, Schroeder F, Kier AB, Phytol-induced hepatotoxicity in mice., Toxicol. Pathol 37 (2009) pp. 201–208. [DOI] [PMC free article] [PubMed] [Google Scholar]
- [49].Johnson JD Bell NJ, Donahoe EL, Macfarlane RD, Metal ion complexes of EDTA as solutes for density gradient ultracentrifugation: Influence of metal ions., Anal. Chem 77 (2005) pp. 7054–7061. [DOI] [PubMed] [Google Scholar]
- [50].Atshaves BP McIntosh AL, Martin GG, Landrock D, Payne HR, Bhuvanendran S, Landrock K, Lyuksyutova OI, Johnson JD, Macfarlane RD, Kier AB, Schroeder F, Overexpression of sterol carrier protein-2 differentially alters hepatic cholesterol accumulation in cholesterol-fed mice., J. Lipid Res 50 (2009) pp. 1429–1447. [DOI] [PMC free article] [PubMed] [Google Scholar]
- [51].Storey SM McIntosh AL, Huang H, Martin GG, Landrock KK, Landrock D, Payne HR, Kier AB, Schroeder F, Intracellular cholesterol binding proteins enhance HDL-mediated cholesterol uptake in cultured primary mouse hepatocytes., Am. J. Physiol. Gastrointest. and Liver Phys 302 (2012) p.G824–G839. [DOI] [PMC free article] [PubMed] [Google Scholar]
- [52].Storey SM Atshaves BP, McIntosh AL, Landrock KK, Martin GG, Huang H, Johnson JD, Macfarlane RD, Kier AB, Schroeder F, Effect of sterol carrier protein-2 gene ablation on HDL-mediated cholesterol efflux from primary cultured mouse hepatocytes., Am. J. Physiol 299 (2010) pp. 244–254. [DOI] [PMC free article] [PubMed] [Google Scholar]
- [53].Erol E Kumar LS, Cline GW, Shulman GI, Kelly DP, Binas B, Liver fatty acid-binding protein is required for high rates of hepatic fatty acid oxidation but not for the action of PPAR-a in fasting mice, FASEB J. 18 (2004) pp. 347–349. [DOI] [PubMed] [Google Scholar]
- [54].Newberry EP Xie Y, Kennedy S, Buhman KK, Luo J, Gross RW, Davidson NO, Decreased hepatic triglyceride accumulation and altered fatty acid uptake in mice with deletion of the liver fatty acid binding protein gene., J. Biol. Chem 278 (2003) pp. 51664–51672. [DOI] [PubMed] [Google Scholar]
- [55].Bandichhor R Petrescu AD, Vespa A, Kier AB, Schroeder F, Burgess K, Water Soluble through bond energy transfer cassettes in intracellular imaging., Bioconjugate Journal 17 (2006) pp. 1219–1225. [DOI] [PubMed] [Google Scholar]
- [56].Martin GG Hostetler HA, McIntosh AL, Tichy SE, Williams BJ, Russell DH, Berg JM, Spencer TA, Ball JA, Kier AB, Schroeder F, Structure and function of the sterol carrier protein-2 (SCP-2) N-terminal pre-sequence., Biochem. 47 (2008) pp. 5915–5934. [DOI] [PMC free article] [PubMed] [Google Scholar]
- [57].Frolov A Cho TH, Murphy EJ, Schroeder F, Isoforms of rat liver fatty acid binding protein differ in structure and affinity for fatty acids and fatty acyl CoAs., Biochemistry 36 (1997) pp. 6545–6555. [DOI] [PubMed] [Google Scholar]
- [58].Du D Shi Y-H, Le G-W, Oxidative stress induced by high glucose diet in liver of C57BL/6J mice and its underlying mechanism., Mol. Biol. Rep 37 (2010) pp. 3833–3839. [DOI] [PubMed] [Google Scholar]
- [59].Tang L Tang X, Li X, Y.H., X.Z., X. L., Z. Zhou, Effect of high fat or high glucose diet on obesity and visceral adipose tissue in mice., Acta Acad. Med. Sin 36 (2014) pp. 614–619. [DOI] [PubMed] [Google Scholar]
- [60].Sumiyoshi M Sakanaka M, Kimura Y, Chronic intake of high fat and high sucrose diets differentially affects glucose intolerance in mice., J. Nutr 136 (2005) pp. 582–587. [DOI] [PubMed] [Google Scholar]
- [61].Douglass JD Zhou YX, Wu A, Zadrogra JA, Gajda AM, Lackey AI, Lang W, Chevalier KM, Sutton SW, Zhang S-P, Flores CM, Connelly MA, Storch J, Global deletion of monoacylglycerol lipase in mice delays lipid absorption and alters energy homeostasis and diet-induced obesity., J. Lip. Res 56 (2015) pp. 1153–1171. [DOI] [PMC free article] [PubMed] [Google Scholar]
- [62].Softic S Gupta MK, Wang G, Fujisaka S, O’Neill BT, Rao TN, Willoughby J, Harbison C, Fitzgerald K, Ilkayeva O, Newgard CB, Cohen DE, Divergent efffects of glucose and fructose on hepatic lipogenesis and insulin signaling., J. Clin. Invest 127 (2018) pp. 4059–4074. [DOI] [PMC free article] [PubMed] [Google Scholar]
- [63].Loomba R and Sanyal AJ, The global NAFLD epidemic., Nat. Rev. Gastroenterol. Hepatol 10 (2013) pp. 686–690. [DOI] [PubMed] [Google Scholar]
- [64].Softic S Cohen DE, Kahn CR, Role of dietary fructose and hepatic de novo lipogenesis in fatty liver disease., Dig. Dis. Sci 61 (2016) pp. 1282–1293. [DOI] [PMC free article] [PubMed] [Google Scholar]
- [65].Jensen T Abdelmark MF, Sullivan S, Nadeau KJ, Johnson RJ, Fructose and sugar: A major mediator of NAFLD., J. Hepatology 68 (2018) pp. 1063–1075. [DOI] [PMC free article] [PubMed] [Google Scholar]
- [66].Marchesini G Bugianesi E, Gorlani G, Cerrelli F, Lenzi M, Manini R, Natale S, Vanni E, Villanova N, Melchionda N, Rizzetto M, Nonalcoholic fatty liver, steatohepatitis, and the metabolic syndrome., Hepatology 37 (2003) pp. 917–923. [DOI] [PubMed] [Google Scholar]
- [67].York LW Puthalapattu S, Wu GY, NAFLD and low carbohydrate diets., Annu. Rev. Nutr 29 (2009) p.379. [DOI] [PubMed] [Google Scholar]
- [68].Martin GG Atshaves BP, McIntosh AL, Mackie JT, Kier AB, Schroeder F, Liver Fatty Acid Binding Protein GeneAblated Female Mice Exhibit Increased AgeDependent Obesity, J. Nutr 138 (2008) pp. 1859–1865. [DOI] [PMC free article] [PubMed] [Google Scholar]
- [69].Martin GG Atshaves BP, McIntosh AL, Mackie JT, Kier AB, Schroeder F, Liver fatty acid binding protein gene ablation enhances age-dependent weight gain in male mice., Mol. Cell. Biochem 324 (2009) pp. 101–115. [DOI] [PMC free article] [PubMed] [Google Scholar]
- [70].Chong MF Fielding BA, Frayn KN, Mechanisms for the acute effect of fructos on postprandial lipemia., Am. J. Clin. Nutr 85 (2007) pp. 1511–1520. [DOI] [PubMed] [Google Scholar]
- [71].Jolly CA Hubbell T, Behnke WD, Schroeder F, Fatty acid binding protein: stimulation of microsomal phosphatidic acid formation., Arch. Biochem. Biophys 341 (1997) pp. 112–121. [DOI] [PubMed] [Google Scholar]
- [72].Schroeder F Jolly CA, Cho TH, Frolov AA, Fatty acid binding protein isoforms: structure and function., Chem. Phys. Lipids 92 (1998) pp. 1–25. [DOI] [PubMed] [Google Scholar]
- [73].Bordewick U Heese M, Borchers T, Robenek H, Spener F, Compartmentation of hepatic fatty-acid-binding protein in liver cells and its effect on microsomal phosphatidic acid biosynthesis, Biol. Chem. Hoppe-Seyler 370 (1989) pp. 229–238. [DOI] [PubMed] [Google Scholar]
- [74].Jolly CA Chao H, Kier AB, Billheimer JT, Schroeder F, Sterol carrier protein-2 suppresses microsomal acyl CoA hydrolysis., Mol. Cell. Biochem 205 (2000) pp. 83–90. [DOI] [PubMed] [Google Scholar]
- [75].Starodub O Jolly CA, Atshaves BP, Roths JB, Murphy EJ, Kier AB, Schroeder F, Sterol carrier protein-2 immunolocalization in endoplasmic reticulum and stimulation of phospholipid formation., Am. J. Physiol 279 (2000) p.C1259–C1269. [DOI] [PubMed] [Google Scholar]
- [76].Parks EJ Krauss RM, Christiansen MP, Neese RA, Hellerstein MK, Effects of a low fat, high carbohydrate diet on VLDL triglyceride assembly, production and clearance., J. Clin. Invest 104 (1999) pp. 1087–1096. [DOI] [PMC free article] [PubMed] [Google Scholar]
- [77].Storey SM McIntosh AL, Huang H, Martin GG, Landrock KK, Landrock D, Payne HR, Kier AB, Schroeder F, Loss of intracellular lipid binding proteins differentially impacts saturated fatty acid uptake and nuclear targeting in mouse hepatocytes., Am. J. Physiol. Gastrointest. and Liver Phys 303 (2012) p.G837–G850. [DOI] [PMC free article] [PubMed] [Google Scholar]
- [78].Martin GG Atshaves BP, Landrock KK, Landrock D, Storey SM, Howles PN, Kier AB, Schroeder F, Ablating L-FABP in SCP-2/SCP-x null mice impairs bile acid metabolism and biliary HDL-cholesterol secretion., Am. J. Physiol. Gastrointest. and Liver Phys 307 (2014) p.G1130–G1143. [DOI] [PMC free article] [PubMed] [Google Scholar]
- [79].Fuchs M Hafer A, Muench C, Kannenberg F, Teichmann S, Scheibner J, Stange EF, Seedorf U, Disruption of the sterol carrier protein 2 gene in mice impairs biliary lipid and hepatic cholesterol metabolism., J. Biol. Chem 276 (2001) pp. 48058–48065. [DOI] [PubMed] [Google Scholar]
- [80].McIntosh AL Huang H, Atshaves BP, Wellburg E, Kuklev DV, Smith WL, Kier AB, Schroeder F, Fluorescent n-3 and n-6 very long chain polyunsaturated fatty acids: three photon imaging and metabolism in living cells overexpressing liver fatty acid binding protein., J. Biol. Chem 285 (2010) pp. 18693–18708. [DOI] [PMC free article] [PubMed] [Google Scholar]
- [81].Livak KJ and Schmittgen TD, Analysis of relative gene expression data using real-time quantitative PCR and the 2−ΔΔCT method., Methods 25 (2001) pp. 402–408. [DOI] [PubMed] [Google Scholar]
Associated Data
This section collects any data citations, data availability statements, or supplementary materials included in this article.


