

SUMMARY
Cell polarization is important for various biological processes. However, its regulation, particularly initiation, is incompletely understood. Here we investigated mechanisms by which neutrophils break their symmetry and initiate their cytoskeleton polarization from an apolar state in circulation for their extravasation during inflammation. We show here that a local increase in plasma membrane (PM) curvature resulting from cell contact to a surface triggers the initial breakage of the symmetry of an apolar neutrophil and is required for subsequent polarization events induced by chemical stimulation. This local increase in PM curvature recruits SRGAP2 via its F-BAR domain, which in turn activates PI4KA and results in PM PtdIns4P polarization. Polarized PM PtdIns4P is targeted by RPH3A, which directs PIP5K1C90 and subsequent phosphorylated myosin light chain polarization, and this polarization signaling axis regulates neutrophil firm attachment to endothelium. Thus, this study reveals a mechanism for the initiation of cell cytoskeleton polarization.
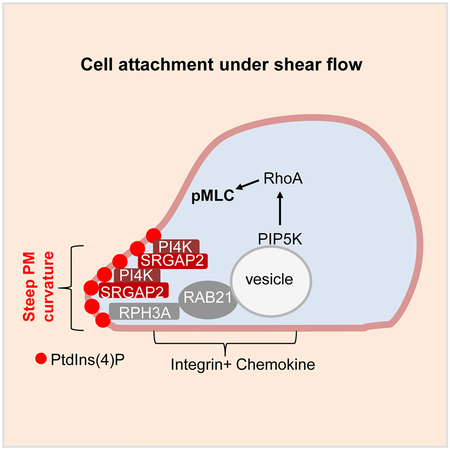
Graphical Abstract
eTOC Blurb
The molecular mechanisms controlling cell polarization are incompletely understood. Ren and Yuan et al. show that local increase in plasma membrane (PM) curvature resulting from cell attachment recruits and polarizes an inverse FBAR domain protein SRGAP2 to initiate cell cytoskeleton polarization, which is important for neutrophil adhesion to endothelium.
INTRODUCTION
Cell migration plays an important role in many biological contexts including embryonic development, wound healing, tumor metastasis, and particularly various aspects of leukocyte biology including leukocyte infiltration, recruitment, trafficking, and homing (de Oliveira, et al., 2016; Nourshargh and Alon, 2014; Kolaczkowska and Kubes, 2013; Ley, et al., 2007). Before a cell can migrate, it has to polarize through spatial reorganization of signaling and structural molecules. Cell polarization is not only necessary for migration, but also confers the directionality of the migration. Primary neutrophils, neutrophil-like cell lines, and Dictyostelium are popular models for studying directional cell migration induced by the gradient of a chemoattractant, which was also known as chemotaxis. Those cells form polarized cytoskeleton structures including lamellar F-actin at the leading edge (the front) and actomyosin at the uropod (the back) upon chemoattractants stimulations. The formation of lamellar F-actin at the front is primarily driven by chemoattractant-activated small GTPase RAC proteins, whereas PIP3-linked mechanisms help to localize, consolidate, and stabilize F-actin polymerization. Chemoattractants also stimulate small GTPase RHOA activation and myosin light chain phosphorylation (pMLC), and induce their localizations at the back of the cell. This “back” polarization, which underlies the formation of the actomyosin structure or uropod, may provide pushing force for cell locomotion, but is more important for neutrophil firm adhesion to the endothelium during infiltration (Hind, et al., 2016; Devreotes and Horwitz, 2015; Nichols, et al., 2015; Xu and Jin, 2015; Graziano and Weiner, 2014; Majumdar, et al., 2014; Woodham and Machesky, 2014; Tang, et al., 2011; Cramer, 2010; Insall, 2010; Xu, et al., 2010; Sanchez-Madrid and Serrador, 2009; Wang, 2009; Gomez-Mouton and Manes, 2007; Ridley, et al., 2003).
While chemoattractants act through their G protein-coupled receptors to provide a chemical input in cell polarization regulation, integrin signaling, as another extracellular chemical input, can also confer neutrophils polarity in the absence of any chemoattractant by inducing PIP5K1C90 polarization (Xu, et al., 2010). During in vivo infiltration, circulating naive neutrophils are captured by integrin-mediated adhesion after selectin-mediated rolling, before they are stimulated by chemoattractants (Kolaczkowska and Kubes, 2013; Ley, et al., 2007). PIP5K1C is one of three PIP5K1 molecules that are responsible for phosphatidylinositol(4,5)-bisphosphate (PtdIns4,5P2) synthesis in most of cells (Clarke, et al., 2007). This PIP5K1C90 polarization has important impacts on chemoattractant-induced polarization and chemotaxis. It is not only important for polarized RHOA activation and pMLC polarization at the uropods, but also to determine the initial cellular polarity, which chemoattractant-induced polarization has to follow initially (Tang, et al., 2011).
It is noteworthy that most of the studies of cell polarization initiated by chemical stimulation (chemoattractant and/or integrin) were done with cells that had already attached to surfaces. Stochastic polarity was suspected to exist in the attached cells, which, in combination with positive feedback circuitry and self-organizing capability of macromolecules such as polymerized actin and myosin and microtubules, was used to explain spontaneous or uniform stimulation-induced cellular polarization (Ladoux, et al., 2016; Woodham and Machesky, 2014; Asnacios and Hamant, 2012; Altschuler, et al., 2008; Sohrmann and Peter, 2003). In this study, we demonstrate that extracellular chemical stimulation is insufficient for breaking cellular symmetry or initiating cytoskeleton polarization in neutrophils. Instead, local increase in plasma membrane (PM) curvature, which results from cell contact to a surface, initiates the breakage of cellular symmetry through polarized localization of an F-BAR-containing protein SRGAP2 and subsequent PM PtdIns4P. These PM curvature-induced polarization events supersede those induced by chemoattractants and integrins.
RESULTS
Attachment Is Required for Neutrophil Polarization.
When neutrophils were stimulated with a chemoattractant, the chemoattractant not only stimulated the formation of F-actin and phosphorylation of MLC, it also caused polarization of F-actin and pMLC (Fig. 1A–B & S1A). Namely, the newly formed lamellar F-actin was localized at one end, whereas pMLC was at the other end of a cell. This is a well-documented phenomenon observed in mouse, human and zebrafish neutrophils regardless under uniform or gradient chemoattractant stimulations (Gao, et al., 2015; Record, et al., 2015; Lam, et al., 2014; Kumar, et al., 2012; Liu, et al., 2010; Shin, et al., 2010; Xu, et al., 2010; Shi, et al., 2009; Subramanian, et al., 2007; Wong, et al., 2007; Francis, et al., 2006; Van Keymeulen, et al., 2006; Bodin and Welch, 2005; Xu, et al., 2005; Srinivasan, et al., 2003; Xu, et al., 2003; Seveau, et al., 2001). However, we realized that such polarization events had only been examined and reported in cells that had been attached to a surface. When we treated mouse neutrophils suspended in physiological media with MIP2, neither F-actin nor pMLC showed polarized localization. Instead, F-actin and pMLC were largely colocalized (Fig. 1B–C & S1B). The same result was also observed with fMLP stimulation of mouse neutrophils (data not shown) and CXCL12 stimulation of mouse primary CD8+ T cells (Fig. S1C). Thus, we concluded that cell attachment was a previously unrealized prerequisite for these polarization events in neutrophils stimulated by chemoattractants.
Figure 1. Neutrophil Polarization Requires Cell Attachment.

Mouse neutrophils attached on fibrinogen (Fn)-coated coverslips (A) or suspended in a microtube (C) were stimulated uniformly with MIP2 (100 nM) for 3 min at room temperature. Cells were stained with Alexa633-phalloidin (for staining F-actin) and anti-pMLC followed with an Alexa488-secondary antibody and observed with a confocal microscope. Reconstructed 3D images of two representative cells per condition are shown. The 3D raw images of Cell 1 in A and Cell 1 in C are shown as Movie S1 and Movie S2 respectively. Quantification of colocalization of pMLC and F-actin is also shown (B). Each data point represents a cell. The experiments were repeated three times. The grid scales (A,C) are 1 μm.
See also Figure S1.
SRGAP2 Is Important for pMLC Polarization.
We hypothesized that cell attachment results in alteration in plasma membrane (PM) curvature, which may be a cue for neutrophil polarization. The BAR (Bin–Amphiphysin–Rvs) domain-containing proteins are known to sense and induce PM curvature (Simunovic, et al., 2015; Suetsugu, et al., 2010; Frost, et al., 2009). We thus performed siRNA screening of BAR domain-containing genes that are expressed in mouse neutrophils based on gene expression analysis. We found that silencing of the Srgap2 (Slit-Robo-GTPase activating protein 2) gene, but not any of other five BAR domain-containing genes, disrupted polarized localization of pMLC upon chemoattractant stimulation (Fig. S2A). We confirmed the importance of SRGAP2 in pMLC polarization by observing defective pMLC polarization in neutrophils isolated from SRGAP2-deficient mice (Fig. 2A & S2B–D). In addition, the SRGAP2 protein and pMLC were co-polarized at the same side of activated neutrophils (Fig. 2B & S2E). None of these BAR domain-containing proteins including Srgap2, however, appeared to be involved in F-actin polarization (Fig. 2A & S2C; data not shown).
Figure 2. Importance of SrGAP2 in Neutrophil Polarization and Adhesion.

A) SRGAP2-deficiency disrupts pMLC polarization. WT or Srgap2−/− neutrophils were stimulated and examined for F-actin and pMLC localization as in Fig. 1A. Each data point represents a cell. The experiments were repeated three times.
B) SRGAP2 is co-polarized with pMLC in stimulated neutrophils. Neutrophils were stimulated as in Fig. 1A and examined for SRGAP2 and pMLC localization by immunostaining with anti-pMLC and anti-SRGAP2 (C14), followed by Alexa488 (green) and Alexa633 (red)-conjugated secondary antibodies, respectively. Reconstructed 3D confocal images of two representative cells per condition are shown. Each data point represents a cell.
C-D) SRGAP2-deficiency impairs neutrophil attachment to endothelial cell under shear flow and ICAM1 binding. Each data point represents a biological replicate. The experiments were repeated three times.
E-G) SRGAP2-null neutrophil showed impaired attachment to endothelium in inflamed cremaster muscle venues. Lethally irradiated WT mice received either WT or Srgap2−/− bone marrow transfer and were subjected to intravital examination two month later. Adhesion (E), transmigration of neutrophils (F), and rolling flux (G), were determined after stimulation of the cremaster muscle with TNFα (0.5 μg) for 4h. Two-tailed Student’s t-Test and two-way Anova test were performed for E,F and G respectively. Each data point represents the observation with one vessel. Three mice were used for each condition.
H-J) SRGAP2-deficiency ameliorates ischemia-reperfusion (IR) injury in the heart. Mice receiving WT or Srgap2−/− bone marrows were subject to ischemia-reperfusion injury. Changes in percentage of ejection fraction (EF%) and fractional shortening (FS%) are shown. Representative images (I) and quantification (J) of infarction areas are also shown. Area at risk (AAR) are identified as the Evans Blue stain negative area, whereas Infarct Size (IS) as the white area within AAR. Each point represents an individual mouse. The experiments were repeated three times and representative results were shown in H-J.
K-M) SRGAP2-deficiency decreases neutrophil infiltration in the injured heart tissues as determined by flow cytometry (K) or quantification of histological images stained with an anti-Ly-6B.2 antibody (L). Representative image of Ly-6B.2-stained sections are shown (M). Each data point (J,K) represents an individual mouse. Each data point (L) represents a random imaging field from one section within similar location of the heart (12 fields from 4 mice). The experiments were repeated three times and representative results were shown in K-M. Scale bars are 1 mm (I) and 0.1 mm (M). The grid scales (A, B) are 1 μm.
See also Figure S2.
SRGAP2 Is Important for Neutrophil Adhesion.
While SRGAP2-deficiency did not grossly alter chemotactic behaviors of neutrophils under a chemoattractant gradient in a Dunn chamber (Fig. S2F), it reduced neutrophil adhesion to endothelial cells in a flow chamber assay (Fig. 2C). Concordantly, SRGAP2-deficient neutrophils showed decreased binding of ICAM1 (Fig. 2D). Moreover, SRGAP2-deficient neutrophils exhibited impaired adhesion to WT endothelia in an intravital microscopic observation of blood vessels in inflamed cremaster muscles (Fig. 2E). There was also a reduction in the number of transmigrated SRGAP2-deficient neutrophils and a lack of TNFα-induced reduction in the number of rolling Srgap2−/− cells in the inflamed vessels (Fig. 2F–G), which could be the result of the reduction in neutrophil adhesion.
We next adopted the cardiac ischemia-reperfusion (IR) model to evaluate if SRGAP2 plays a significant role in neutrophil recruitment in a disease model (Hoyer and Nahrendorf, 2017; Vinten-Johansen, 2004). We generated hematopoietic-loss of SRGAP2 by transferring Srgap2−/− bone marrow into lethally irradiated WT recipient mice. The lack of SRGAP2 in hematopoietic cells ameliorated IR injuries to the hearts by lessening IR-induced changes in percentage of ejection fraction (EF) and fractional shortening (FS) (Fig. 2H & S2G), decreasing the infarction areas (Fig. 2I–J & S2H), and reducing the infiltration of neutrophils into the injured cardiac tissues (Figure 2K–M & S2I). Of note, SRGAP2-deficiency does not affect the number of various leukocytes in circulation (Table S1). Although these results do not prove that SRGAP2-deficiency ameliorates IR-induced cardiac injury exclusively via impairment of neutrophil adhesion and recruitment, they clearly demonstrate an impairment of neutrophil recruitment by SRGAP2-deficiency in an in vivo pathophysiological model. In addition, these cardiac IR phenotypes are consistent with the impairment of neutrophil adhesion and recruitment. Putting all of the data together, we conclude that SRGAP2 regulates pMLC polarization and has an important role in neutrophil adhesion to endothelial cells and recruitment in vivo.
SRGAP2 Regulates RAB21, RPH3A and PIP5K1C90 Polarization.
We have previously characterized a pathway that directs polarization of PIP5K1C90 via directional transport of RAB21 vesicles (Yuan, et al., 2017). Polarized PIP5K1C90 is required for polarized RhoA activation and pMLC localization (Xu, et al., 2010). In addition, neutrophils lacking PIP5K1C90 show similar adhesion phenotypes to those of SRGAP2-null neutrophils (Xu, et al., 2010). Together with the observation that SRGAP2 and PIP5K1C90 were polarized to the same side of stimulated neutrophils (Fig. S3A), we decided to examine if SRGAP2 regulates PIP5K1C90 and RAB21 polarization in neutrophils. The lack of SRGAP2 significantly reduced the number of neutrophils exhibiting polarized localization of PIP5K1C90 or RAB21 (Fig. 3A, B). Of note, in our preparation of primary neutrophils, there were about 20% of cells that failed to respond to any stimulation regardless of assays (migration, polarization, etc) likely due to the lack of maturity or poor cell health status.
Figure 3. SRGAP2 Regulates PIP5K1C90, RAB21 and RPH3A Polarization.

A-C) SRGAP2-deficiency impairs PIP5K, RAB21 and RPH3A polarization. Neutrophils were stimulated as Fig. 1A and stained by anti-PIP5K1C90 (A), anti-RAB21 (B), or anti-RPH3A (C), followed by an Alexa488-conjugated second antibody before imaged by confocal microscopy. Representative optical section images of two cells from each genotype are shown. Quantification of polarization was performed as described in the Star Methods. Each data point represents the average of more than 10 cells per observation field, and the experiment was repeated three times.
D) Co-polarization of RPH3A and SRGAP2 in neutrophils. Neutrophils were stimulated as in Fig. 1A before stained with anti-RPH3A and anti-SRGAP2 (G10) antibodies, followed with Alexa488 (green) and Alexa633 (red) conjugated secondary antibodies, respectively. Representative optical section images of two cells are shown. Each data point represents a cell. The experiments were repeated three times. Scale bars are 3 μm.
See also Figure S3.
In our previous study, we also identified RPH3A as an effector of RAB21, which is required for targeting the RAB21 vesicles to their final polarized destinations, even though how RPH3A directs the polarized vesicle transport remained unknown (Yuan, et al., 2017). While RPH3A-deficiency had no effect on SRGAP2 polarization (Fig. S3B), SRGAP2-deficiency disrupted RPH3A polarization (Fig. 3C). These results, together with the co-polarization of SRGAP2 and RPH3A at the same side of neutrophils (Fig. 3D), suggest that SRGAP2 may be a direct or indirect target for RPH3A and guides RPH3A-associated RAB21 vesicles to their polarized destination.
PM PtdIns4P Shows Polarized Localization in Neutrophils.
The simplest possibility would be that RPH3A binds to SRGAP2 to serve as a direct target. However, we could not detect this interaction using a number of approaches including co-immunoprecipitation in overexpressed cells and pull-down assays using recombinant proteins (data not shown). It is thus possible that there might be an intermediate(s) between SRGAP2 and RPH3A. RPH3A contains C2 domains, which are known to bind to phosphatidylinositol (PtdIns) lipids (Corbalan-Garcia and Gomez-Fernandez, 2014). Our characterization of RPH3A-PtdIns interactions indicated that RPH3A preferentially bound to PtdIns4P (Fig. 4A). Lipid-binding was assessed using a liposome floatation assay (Zhang, et al., 2013; Boswell, et al., 2012), in which liposomes with a composition similar to the inner leaflet of the PM were used. In addition, Ca2+ enhanced this binding (Fig. 4A), which is a common characteristic of C2 domains (Rizo and Sudhof, 1998). Because the F-BAR domain of SRGAP2 can bind to PtdIns4P (Coutinho-Budd, et al., 2012), we decided to investigate if PtdIns4P has a role in neutrophil polarization.
Figure 4. RPH3A Binds to and Polarizes Downstream of PtdIns4P.

A) RAPH3A binds to PtdIns4P, but not other PtdIns lipids as determined by the liposome flotation assay. Calcium (100 μM) was present as indicated and in the right panel. The experiments were repeated three times. The quantification of RPH3A binding to PtdIns4P in the presence or absence of Ca2+ is shown.
B-C) Co-polarization of RPH3A or SRGAP2 with PtdIns4P. Neutrophils were stimulated as in Fig. 1A before being co-stained with anti-RPH3A or anti-SRGAP2 (C14) with anti-PtdIns4P antibodies, followed by Alexa488 (green) and Alexa633 (red) conjugated secondary antibodies as indicated in the figure. Representative optical section images of two cells are shown. The PtdIns4P stain encircled in yellow denotes the Golgi pool. Each data point represents a cell. The experiments were repeated three times.
D) Depletion of PtdIns4P impairs polarization of RPH3A. Neutrophils were transfected with Lyn11-FRB-mCherry and FKBP-SAC at 1:5 ratio and separated into mCherry positive (PM-SAC) and negative (Ctr) pools by FACS. These neutrophils were then stimulated as in Fig. 1A in the presence of 1 μM rapamycin before being stained with anti-RPH3A and Alexa488-conjugated secondary antibody. Representative optical section images of two cells from each condition are shown. Each data point represents the average of more than 10 cells per observation field, and the experiment was repeated four times.
E) PtdIns4P depletion impairs neutrophil attachment to endothelial cell under shear flow and ICAM1 binding. Each data point represents a biological replicate. The experiments were repeated three times.
F) RPH3A-deficiency does not affect PtdIns4P polarization. Neutrophils were stimulated as in Fig. 1A and stained with anti-PtdIns4P. Each data point represents the average of more than 10 cells per observation field, and the experiment was repeated five times.
Scale bars (B-D) are 3 μm.
See also Figure S4.
Despite the abundance of PtdIns4P in the Golgi (De Matteis, et al., 2013), this lipid has been detected in other intracellular locations including PM (De Matteis, et al., 2013; Hammond, et al., 2012; Jethwa, et al., 2012; Nakatsu, et al., 2012; Hammond, et al., 2009). We tested the role of PM PtdIns4P in neutrophil polarization by employing a method reported by Hammond et al (Hammond, et al., 2012). In this system, rapamycin induces rapid recruitment of active sac1 (an S. cerevisiae phosphatase for PtdIns4P) fused to the FKBP protein (designated as FKBPSAC) to PM-anchored Lyn11-FRB to specifically hydrolyze PM PtdIns4P (Fig. S4A). FKBP-SAC and mCherry-tagged Lyn11-FRB plasmids were electroporated at 5:1 ratio into neutrophils, which were subsequently separated into the florescence-positive and negative populations by fluorescence-activated cell sorting (FACS). Given the plasmid ratio in transfection, most of the fluorescent cells should contain FKBP-SAC, and rapamycin should induce PM PtdIns4P depletion in these cells. Even though some of the fluorescence-negative cells may also contain FKBP-SAC, they cannot respond to rapamycin without the PM anchor and thus were used as the control. We validated the depletion system by staining the neutrophils with an anti-PtdIns4P antibody (Hammond, et al., 2012). The antibody detected two obvious pools of signals in the control cells; one is colocalized with the Golgi marker TGN38, whereas the other is non-Golgi and proximal to PM (Fig. S4B). The PM-PtdIns4P depletion system specifically diminished the non-Golgi pool without affecting the Golgi pool, suggesting that the non-Golgi pool is likely the PM PtdIns4P pool (Fig. S4B). This experiment additionally validated the antibody-based PtdIns4P detection system and more importantly revealed that PM PtdIns4P showed polarized localization in stimulated neutrophils. Furthermore, we found that PtdIns4P was co-polarized with RPH3A and SRGAP2 at the same side of stimulated neutrophils (Fig. 4B–C).
PM PtdIns4P Is Important for Neutrophil Polarization.
We next examined the impact of PM PtdIns4P depletion on neutrophil polarization. PM PtdIns4P depletion significantly impaired polarized localization of RPH3A (Fig. 4D), PIP5K1C90 (Fig. S4C), RAB21 (Fig. S4D) or pMLC (Fig S4E). In addition, depletion of PM PtdIns4P also resulted in reductions in firm adhesion of neutrophils to endothelial cells under shear flow and neutrophil ICAM binding (Fig. 4E), the same phenotypes observed for inactivation of SRGAP2 (Fig. 2C–D), RAB21, RPH3A, or PIP5K1C (Yuan, et al., 2017; Xu, et al., 2010). Thus, these data together indicate that PM PtdIns4P has an important role in polarization of PIP5K1C90, RAB21, RPH3A and pMLC. Consistent with our hypothesis that PM PtdIns4P may be the target for RPH3A-directed polarization, RPH3A-deficiency did not affect PtdInd4P polarization in neutrophils (Fig. 4F). Moreover, depletion of PtdIns4,5P2 using the system described by Hammond et al (Hammond, et al., 2012) did not affect PIP5K1C90 polarization (Fig. S4F), while PtdIns4P depletion did not affect Ptdins3,4,5P3 contents or polarization (Fig. S4G) (Kwon, et al., 2007). These results further affirm the conclusion that PtdIns4P, rather than other PtdIns lipids, plays a key role in the PIP5K1C polarization axis.
SRGAP2 Regulates PM PtdIns4P Polarization.
Although PM PtdIns4P depletion affects many of the polarization events described above, it did not affect SRGAP2 polarization (Fig. 5A). However, SRGAP2-deficiency impaired PtdIns4P polarization in neutrophils (Fig. 5B), suggesting that SRGAP2 may act upstream of PtdIns4P polarization. Re-expression of WT SRGAP2 or its GAP activity-deficient mutant, but not the F-BAR domain lacking mutant, restored PtdIns4P polarization impaired by SRGAP2 knockdown in neutrophils (Fig. S5A). These results, together with co-localization of SRGAP2 with PtdIns4P (Fig. 4C), suggest that SRGAP2 may regulate PtdIns4P polarization. Among the four PtdIns kinases that can convert PtdIns to PtdIns4P, silencing of PI4KA, but not others, significantly affected the detection of polarized PM PtdIns4P (Fig. 5C, D & S5B). In fact, PI4KA-silencing reduced PM PtdIns4P content without affecting Golgi PtdIns4P content (Fig. 5C, E and F), whereas PI4KB and PI4K2A knockdown reduced Golgi PtdIns4P contents (Fig. 5C, F). PI4KA silencing also impaired pMLC polarization without affecting F-actin polarization (Fig. S5C), and its effects on PM PtdIn4P polarization and content could be rescued by coexpression of human PI4KA (Fig. S5D). Moreover, we found that PI4KA and SRGAP2 co-immunoprecipitated (Fig. S5E) and that SRGAP2 could stimulate the lipid kinase activity of PI4KA in an in vitro kinase assay (Fig. S5F). These results together provide a mechanism for SRGAP2 to polarize PM PtdIns4P. Namely, polarized localization of SRGAP2 stimulates polarized formation of PtdIns4P, while the interaction of SRGAP2 with PtdIns4P (Coutinho-Budd, et al., 2012) may help to stabilize PtdIns4P polarization and serve as a possible feedforward-local amplification mechanism by recruiting additional SRGAP2, leading to further production of PtdIns4P. Now the question is how SRGAP2 is polarized in neutrophils.
Figure 5. SRGAP2 Polarizes PtdIns4P via PI4KA.

A) PtdIns4P depletion does not impair polarization of SRGAP2. Neutrophils were transfected and treated as in Fig. 4D before being stained with anti-SRGAP2 (G10) and Alexa488 conjugated secondary antibody. Representative optical section images of two cells from each condition are shown. Each data point represents the average of more than 10 cells per observation field, and the experiment was repeated five times.
B) SRPAG2-deficiency impairs PtdIns4P polarization. Neutrophils were stimulated as in Fig. 1A and stained with anti-PtdIns4P and Alexa633 conjugated secondary antibody. Representative optical section images of two cells from each genotype are shown. Each data point represents the average of more than 10 cells per observation field, and the experiment was repeated five times.
C-F) PI4KA is involved in PtdIns4P polarization. Neutrophils were transfected with siRNAs for various PtdInsP kinases for 48 hours and treated as in Fig. 1A before being stained with anti-PtdIns4P and anti-TGN38 antibodies followed by Alexa633 (red) and Alexa488 (green) conjugated secondary antibodies, respectively. Representative confocal optical section images (C) and quantification of PtdIns4P polarization (D) and PM (E) or Golgi (F) PtdIns4P staining intensities are shown. The PM or Golgi PtdIns4P staining intensities are expressed as the ratios of PM or Golgi PtdIns4P to TGN38 staining. Each data point represents the average of more than 10 cells per observation field.
Scale bars (A-C) are 3 μm.
See also Figure S5.
Attachment-induced PM Curvature Polarizes SRGAP2.
Freshly isolated neutrophils in suspension are spherical, but their attachment to a surface would results in cell shape change leading to local alteration in PM curvature. SRGAP2 contains an inverse F-BAR domain, which is recruited to concave curvatures of lipid membranes where it polymerizes and in turn helps to stabilize the curvatures (Sporny, et al., 2017; Charrier, et al., 2012; Guerrier, et al., 2009). Together with our observation that SRGAP2 F-BAR domain is required for PtdIns4P polarization (Fig. S5A), we hypothesized that a local increase in PM curvature around the attachment zone might recruit SRGAP2 via its inverse F-BAR domain. Indeed, while the F-BAR domain of SRGAP2 fused to EGFP (FBAR-GFP) showed non-polarized localization in neutrophils in suspension (Fig. 6A), cells attached to a surface showed increased localization of FBAR-GFP at the cusps above the coverslip, resulting in dorsoventral polarization of FBAR-GFP (Fig. 6B). In other words, more FBAR-GFP is localized ventrally than dorsally. Among these dorsoventrally polarized cells, near one half also displayed noticeable anteroposterior polarization (Fig. 6C, E). When polarization of FBAR-GFP was observed at real time, we noticed that the cells that showed anteroposterior polarization often had movements on the coverslip (probably due to lateral drifting prior to settling onto the surface) before they arrested on the surface (Fig. S6A). Polarization intensified rapidly after the cell came to the stop with the polarization direction conforming to the prior movement direction (Fig. S6A). We interpreted these results to suggest that cell attachment-induced PM curvature increase recruits SRGAP2 to the cusps of cell attachment, leading to dorsoventral polarization of SRGAP2. On the other hand, cell movement on the surface due to lateral drifting results in steeper PM curvature at the trailing end of the cell as schemed in Fig. S6A. The steeper PM curvature would have a higher affinity for SRGAP2, leading to anteroposterior polarization of SRGAP2. If this idea is correct, neutrophils subjected to shear flow, which they normally experience during their attachment to the endothelium during inflammation, would result in increased anteroposterior polarization, as the shear flow would cause even steeper PM curvature at the trailing end by pushing the cell body forward. Indeed, when neutrophils were subjected to shear flow in a flow chamber, there was a significant increase in the percentage of the cells showing anteroposterior polarization of FBAR-GFP (Fig. 6D–E). Importantly, FBAR-GFP polarized in a direction coinciding with the flow direction (Fig. 6D), a phenomenon we have also previously described for PIP5K1C90 polarization (Xu, et al., 2010). Moreover, the GFP-fusion protein with I-Bar of IRSp53, F-Bar of FBP17 or N-Bar of Nadrin2 showed no polarization even under shear flow (data not shown). Furthermore, we observed FBAR-GFP polarization in neutrophils attached to inflamed blood vessels in live zebrafishes in the direction of blood flow (Fig. 6F).
Figure 6. SrGAP2 F-BAR-domain Polarizes upon Attachment Independently of Chemical Stimulation.

A-C) SRGAP2 F-BAR-domain polarizes depending on cell attachment. Neutrophils were cotransfected with SrGAP2 F-BAR-domain-GFP (FBAR-GFP) and TagRFP for 6 hours. They were either embedded in Hydrogel as suspended cells (A) or attached to PK-coated coverslips (B-C) for confocal microscopy. Representative 3D reconstructed images of two independent cells are shown. The 3D raw images are shown as Movie S3 (Cell 1 in A), Movie S4 (Cell 1 in B) and Movie S5 (Cell 1 in C). Dorsal (D)-ventral (V) and anterior (A)-posterior (P) axes are denoted. The experiments were repeated three times.
D-E) Shear flow promotes anteroposterior polarization. Neutrophils were cotransfected as in A and placed in a flow chamber with PK-coated surface. The attached cells were subjected to shear flow (2 dyn/cm2) for 10 min and imaged by a confocal microscope. Representative 3D reconstructed images of two independent cells are shown. The 3D raw images of Cell 1 in D are shown as Movie S6. Each data point represents the average of more than 10 cells per observation field, and the experiment was repeated five times.
F) SrGAP2 F-BAR-domain polarizes in inflamed blood vessels of zebrafish.
G) PTx treatment or integrin neutralization has no effects on SRGAP2 polarization. Neutrophils were pre-treated with a control IgG, a cocktail of neutralizing integrin β1 and β2 antibodies (10 μg/ml), or pertussis toxin (PTx, 1 μg/ml for 2 hr at 37°C) before being subjected to shear flow treatment as in D in a flow chamber with PK-coated surface. Attached cells were stained with anti-SRGAP2 (G10) antibody and imaged by confocal microscopy. Cells showing anteroposterior polarization were scored. Each data point represents the average of more than 10 cells per observation field, and the experiment was repeated three times.
H) Micropipette aspiration leads to polarization of SrGAP2 F-BAR-domain to regions of high concave curvature (relative to the cytosol), namely along the pipette walls and the semi-spherical tip of the aspirated tongue. Membrane-associated TdTomato (memRed) expressing neutrophils from mT/mG mice were transfected with FBAR-GFP. Images of a representative cell are shown. The experiments were repeated ten times.
Scale bars (F,H) are 3 μm, and the grid scales (A-D) are 1 μm.
See also Figure S6.
It is important to note that the polarization of SRGAP2 FBAR-GFP described above occurred on poly-lysine (PK)-coated surfaces in the absence of exogenous chemoattractants or integrin ligands. We further confirmed the independence of FBAR-GFP polarization on chemoattractant or integrin signaling by pre-treating neutrophils with pertussis toxin (PTx) or a cocktail of integrin antibodies. As a validation, PTx treatment blocked MIP2-induced phosphorylation of AKT (Fig. S6B), while the anti-integrin cocktail blocked RPH3A polarization (Fig. S6C) and neutrophil spreading on fibrinogen (Fn) (Fig. S6D). Neither pre-treatment, however, affected attachment-induced SRGAP2 polarization (Fig. 6G). These results suggest that cell attachment-induced SRGAP2 polarization is independent of chemoattractant or integrin signaling and may act upstream of chemoattractant signaling as chemoattractant failed to polarize neutrophils in suspension (Fig. 1B–C).
To further test if changes in membrane curvature actually alter FBAR-GFP recruitment, we used micropipettes to aspirate single neutrophils in suspension to artificially create negative PM curvature (relative to the cytosol). FBAR-GFP was expressed in the neutrophils isolated from the mT/mG mouse (Muzumdar, et al., 2007) that expressed membrane-associated TdTomato fluorescent protein (memRed; used as an internal control). Ratio images of FBARGFP to memRed were generated to more accurately assess FBAR-GFP PM localization. Upon aspiration, rapid increases of FBAR-GFP localization at the PM inside the micropipettes were observed (Fig. 6H). Because the PM inside the micropipette has a higher concave curvature than the PM outside the micropipette, the above observation is consistent with our hypothesis diagramed in Fig. S6A that increased PM curvature leads to efficient recruitment of FBAR-GFP and probably SRGAP2 via its F-BAR domain. We also carried out the aspiration experiment with micropipettes with different orifices, which led to different PM curvatures and quantified FBAR-GFP localization and membrane curvature as described in Fig. S6E. We found a significant positive correlation of PM curvature with FBAR-GFP localization (Fig. 6H and S6F). This provides further support for our hypothesis that, within a certain range, the degree of PM curvature is correlated with FBAR-GFP recruitment.
We also divided the PM inside the pipette into two zones, the tip and tube zones (Fig. S6E), and quantified them separately. There were significant positive correlations between PM curvature and FBAR-GFP localization in both zones (Fig. S6G–H). Because the PM in the tip zone was not and might never have been in contact with any surface, this tip zone correlation result further affirms the conclusion that PM curvature rather than its contact with a surface recruits FBAR-GFP. On the other hand, PMs inside the tube zone are constrained by the pipette walls from forming membrane structures such as the filopodium or protrusion and likely have the same membrane tension. The significant positive correlation observed in this tube zone indicate that changes in membrane tension or formation of membrane structures such as the filopodium or protrusion are unlikely the primary mechanism for SRGAP2 F-BAR domain polarization in neutrophils. We also performed the same experiment with primary mouse CD8+ T cells and observed similar results (Fig. S6I, J). Taken together, our results indicate that a local increase in membrane curvature resulting from initial steps of cell attachment is the primary mechanism for polarization of FBAR-GFP and probably SRGAP2 in neutrophils, T cells, and probably other leukocytes.
Membrane Curvature Increase Drives PM PtdIns4P Polarization.
Next, we wanted to determine if PM PtdIns4P polarizes as FBAR-GFP in a membrane curvature-dependent way, but independently of chemoattractant or integrin stimulation. As we observed with FBAR-GFP, polarized localization of PtdIns4P was detected by the anti-PtdIns4P antibody in neutrophils placed on PK-coated surfaces, but not in cells in suspension (Fig. S7A–B). We also detected PtdIns4P localization using a fluorescent PtdIns4P probe, GFP-P4M. P4M is a protein domain of the SidM protein from L. pneumophila that has a high affinity and specificity for PtdIns4P (Schoebel, et al., 2010; Brombacher, et al., 2009). GFP-P4M works faithfully as a PtdIns4P probe in live cells (Hammond, et al., 2014). We co-expressed TagRFP (Navaroli, et al., 2012) as an internal imaging control. PM GFP-P4M polarized in neutrophils attached to PK-coated surfaced, but not in cells in suspension (Fig. 7A–C). Similar to what we observed for FBARGFP, most of GFP-P4M showed dorsoventral polarization at the cusps of cell attachment (Fig. 7B), less than a half of which also showed anteroposterior polarization (Fig. 7C, E). Shear flow increased the number of anteroposteriorly polarized cells (Fig. 7D–E). Importantly, pre-treatment with either PTx, which blocks chemoattractant signaling, or the anti-integrin cocktail did not affect PM GFP-P4M polarization in attached cells (Fig. 7F). In cells co-expressing GFPP4M and FBAR-TagRFP, these two proteins showed co-polarization to the same side of the cells (Fig. S7C). Finally, we performed the micropipette aspiration experiment to induce controlled PM curvatures while monitoring PM PtdIns4P localization. When neutrophils expressing GFP-P4M and memRed were aspirated, as for FBAR-GFP, significant positive correlations of concave membrane curvatures to GFP-P4M localization were observed (Fig. 7G & S7D–F). Thus, these results demonstrate that PM PtdIns4P, like SRGAP2 FBAR-GFP, polarizes upon cell attachment via local increase in PM curvature independently of chemoattractant or integrin signaling as depicted in Figure S7G.
Figure 7. PM PtdIns4P Polarizes upon Attachment.

A-C) GFP-P4M polarizes depending on cell attachment. Neutrophils were cotransfected with GFP-P4M and TagRFP for 6 hours. They were either embedded in Hydrogel as suspended cells (A) or attached to PK-coated coverslips (B-C) for confocal microscopy. Representative 3D reconstructed images of two independent cells are shown. The experiments were repeated three times.
D-E) Shear flow promotes anteroposterior polarization of GFP-P4M. Neutrophils were transfected and treated as in Fig. 6D. Representative 3D reconstructed images of two independent cells are shown. Each data point represents the average of more than 10 cells per observation field, and the experiment was repeated five times.
F) GFP-P4M polarization does not depend on chemical stimulation. Neutrophils were transfected with GFP-P4M and treated as in Fig. 6G. Cells attached to PK-coated coverslips were imaged by confocal microscopy. Cells showing anteroposterior polarization were scored. Each data point represents the average of more than 10 cells per observation field.
G) Higher membrane curvature generated by micropipette aspiration leads to polarization of GFP-P4M. MemRed expressing neutrophils from mT/mG mouse were transfected with GFPP4M. The bright spots are likely Golgi. Images of a representative cell are shown. The experiments were repeated ten times. Scale bar (G) is 3 μm, and the grid scale (A-D) is 1 μm.
See also Figure S7.
DISCUSSION
In this study, we elucidate mechanisms by which an apolar neutrophil breaks its cellular symmetry to initiate cytoskeleton polarization. The initiation of leukocyte polarization had been assumed to be exclusively dependent on extracellular chemical stimulations including chemoattractants and integrins. We, however, show here that chemical stimulation alone is not sufficient for induction of polarization of lamellar F-actin and pMLC, two prominent cytoskeleton markers, in neutrophils in suspension. Neutrophil contact to a surface is a prerequisite for polarization of these cytoskeleton markers. Our further investigation reveals a mechanism by which cell attachment induces uropod pMLC polarization (Fig. S7G). Namely, increased local PM curvature resulting from cell contact to a surface recruits a F-BAR domain-containing protein SRGAP2, which in turn activates a lipid kinase PI4KA, resulting in PM PtdIns4P polarization. PM PtdIns4P is recognized by RPH3A, an effector of RAB21, leading to polarization of RAB21, PIP5K1C90, and eventually pMLC. Thus, cell contact to a surface or PM curvature change alone can induce some forms of neutrophil polarization, namely SRGAP2 and PM PtdIns4P polarization, independently of chemokine or integrin signaling. However, subsequent polarization of RPH3A, RAB21, PIP5K1C90, and pMLC, as depicted in Fig. S7G, requires both PM curvature change and chemokine\integrin stimulation (Yuan, et al., 2017; Tang, et al., 2011; Xu, et al., 2010).
We show that CD8+ T cells also require PM curvature change for their cytoskeleton polarization. Thus, our findings on cell polarization initiation likely extend beyond neutrophils to other circulating leukocytes. In addition to alteration in PM curvature through cell attachment and pipette pulling described in this study, other forms of cell shape changes including cells squeezing through matrices in 3D migration can also presumably lead to cell polarization through similar mechanisms. Moreover, our findings suggest that caution is warranted for the interpretation of many of the previous observations made with attached cells, as these cells already possess certain forms of polarization that could instruct polarization events controlled by extracellular chemical stimuli and might not have been fully considered in the interpretation of the results. This is particularly true for the interpretation of cell polarization under uniform extracellular chemical stimulation and “spontaneous” polarization. PM curvature-induced cellular polarity unraveled in this study may have unmasked the mystery of “stochastic polarity” that was proposed to be needed for these types of cellular polarization (Ladoux, et al., 2016; Woodham and Machesky, 2014; Asnacios and Hamant, 2012; Altschuler, et al., 2008; Sohrmann and Peter, 2003).
SRGAP2 and its F-BAR domain were shown to recognize concave membrane curvature (Sporny, et al., 2017; Charrier, et al., 2012; Guerrier, et al., 2009). This is consistent with our observation of recruitment of SRGAP2 to the cusps above the coverslip (dorsoventral polarization) when cells were placed on a coverslip (Fig. 6B) due to increases in PM curvature at the cusps. This cell contact-induced dorsoventral SRGAP2 polarization may represent the initial step of breaking cellular symmetry. The anteroposterior polarization of FBAR-GFP (Fig. 6C,D) is the consequence of lateral cell movement during cell settlement in the static experiments or under shear flow. The lateral movement presumably results in a steeper curvature at the trailing end of the cell, leading to increased localization of SRGAP2 via its FBAR domain. This idea is well supported by the significant positive correlation of steeper PM curvature with greater localization of SRGAP2 FBAR-GFP (Fig. S6F) and PtdIns4P probe GFPP4M (Fig. S7D) revealed by the single neutrophil aspiration experiments. Because shear flow is a physiological norm for neutrophils, anteroposterior polarization of SRGAP2 and its downstream events would unsurprisingly occur at a high rate in vivo. Indeed, FBAR-GFP was observed in inflamed blood vessels in vivo under flow in live zebrafish (Fig. 6F).
We showed that PI4KA was required for cell attachment-induced PM PtdIns4P polarization. The stimulation of PI4KA kinase activity by SRGAP2 provides a mechanism for SRGAP2 polarization to lead to PtdIns4P polarization. Although there might be other mechanisms, PI4KA polarization unlikely is one of them, as we could not observe polarization of endogenous or tagged PI4KA by immunostaining or PI4KA-GFP in live cells under the manipulations that caused polarization of SRGAP2 and PtdIns4P (data not shown).
While we have characterized a detailed biochemical mechanism for cell attachment/membrane curvature to regulate “back” polarization of PIP5K1C90 and pMLC, how cell attachment dictates “front” F-actin polarization in response to chemical stimulation remains unknown. We assume that PM curvature changes and proteins that recognize the curvature or cell shape changes may be involved. However, none of the BAR domain-containing proteins we believe that are expressed in neutrophils was involved (Fig. S2A). It is possible that there is a broader functional redundancy or different types of proteins that recognize the membrane curvature/cell shape change are required for the F-actin polarization. Future work is warranted to investigate these questions.
STAR METHODS TEXT
CONTACT FOR REAGENT AND RESOURCE SHARING
Further information and requests for resources and reagents should be directed to and will be fulfilled by the Lead Contact, Dianqing Wu (dan.wu@yale.edu).
EXPERIMENTAL MODEL AND SUBJECT DETAILS
Mice.
The SRGAP2-null mice (SRGAP2Gt(XH102)Byg/Mmcd) were described previously (Charrier, et al., 2012). The RPH3A-null mice (B6;129P2-Rph3atm1Sud/J) were obtained from the Jackson Lab. The mT/mG mice, a double-fluorescent Cre reporter mouse that expresses membrane-targeted tandem dimer Tomato (mT) prior to Cre-mediated excision were kindly provided by Dr. Guangxin Li and Dr. George Tellides (Muzumdar, et al., 2007). Wildtype C57BL mice were purchased from Jackson Lab. Every housing cage contained no more than 5 mice, and breeding cages contained 1 male and up to 2 females. 8 weeks old females were used for primary neutrophils and CD8+ T cells isolation. To induce hematopoietic-loss of SRGAP2, bone marrows from SRGAP2-deficient mice and their WT littermates were transplanted into wildtype recipient mice at 8 weeks old that had been subjected to 1000cGy X-Ray irradiation. Eight weeks later, the transplanted male and female mice were used for intravital observation or heart ischemia/reperfusion (IR) model study respectively. All animal studies were approved by the institutional animal care and use committees of Yale University.
Zebrafish.
Zebrafish were of the Tu/AB background. Zebrafish were maintained as previously described (Zhang, et al., 2008) according to standard protocols. Embryos were obtained through natural spawning. For the establishment of the zebrafish transgenic line expressing GFP-tagged F-BAR domain of mouse SRGAP2 in neutrophils, a fish lysozyme C (Lyz) promoter (Zhang, et al., 2008) and the cDNA encoding FBAR-GFP (residues1–501) were cloned into the tol2-mpx-mCherry plasmid (29585, Addgene) (Yoo, et al., 2010) by replacing the mpx-mCherry fragments. 50pg of the tol2-lyz-FBAR-GFP plasmid and 50pg tol2 transposase mRNA were coinjected into each embryo at one cell stage. About 50 injected embryos were raised to adult and subjected to screening for GFP-expressing progeny embryos according to the green positive cells pattern as previously reported (Zhang, et al., 2008; Hall, et al., 2007). The transgenic founder was further crossed to wild-type fish to produce the stabled transgenic line, referred to as Tg(lyz:FBAR-GFP). To analyze the localization of FBAR-GFP in fish neutrophils attaching to the blood vessels, lyz:FBAR-GFP fish were crossed with Tg(kdrl:mRFP) fish (Yu, et al., 2015). The double positive embryos at 3 days post fertilization (dpf) were chosen for imaging. To induce the neutrophils attachment to the vein wall, a small incision at the ventral fin of anaesthetized 3 dpf lyz:FBAR-GFP / kdrl:mRFP compound transgenic larvae was made using a sterile scalpel followed by mounting in 1% low melting point agarose (Sigma) in the E3 medium (5 mM NaCl, 0.17 mM KCl, 0.33 mM CaCl2, 0.33 mM MgSO4, 10−% Methylene Blue). Spinning-disk confocal microscopy was performed using the Improvision UltraVIEW VoX system (Perkin-Elmer) built on a Nikon Ti-E inverted microscope, equipped with water-immersion lenses (40X) and controlled by Volocity (Improvision) software. Embryos were kept in a heated chamber at 29°C during the whole imaging duration. In particular, the posterior cardinal vein (PCV) area above the yolk extension was illuminated. The Z stack images were acquired with plane sectioning at 0.3 μm. All animal studies were approved by the institutional animal care and use committees of Yale University.
Cell Lines.
HEK293T (ATCC® CRL-3216™) cells and mouse endothelial cells (Wang, et al., 2008) were cultured in Dulbecco’s Modified Eagle’s Medium supplemented with 10% fetal bovine serum (FBS), 4 mM L-glutamine and 100 unit penicillin and streptomycin. And cells were kept in a 5% CO2 incubator at 37°C. Transient transfection with HEK293T cells was carried out using Lipofectamine Plus (Life Technologies), and samples were collected 24 hr after transfection.
METHOD DETAILS
Neutrophil Preparation and Transfection.
Murine neutrophils were purified from bone marrows as previously described (Zhang, et al., 2010). Briefly, bone marrow cells collected from mice were treated with the ACK buffer (155 mM NH4Cl, 10 mM KHCO3 and 127 μM EDTA) for red blood cell lysis, followed by a discontinuous Percoll density gradient centrifugation. Neutrophils were collected from the band located between 81% and 62% of Percoll. Transient transfection of neutrophils were done as previously described (Yuan, et al., 2017; Basit, et al., 2016; Simunovic, et al., 2015; Loison, et al., 2014; Zhang, et al., 2013; Tang, et al., 2011; Xu, et al., 2010; Zhang, et al., 2010; Sun, et al., 2007). In brief, three million neutrophils were electroporated with 1.6 μg endotoxin-free plasmids or 300 nM of siRNA using the human monocyte nucleofection kit (Lonza, Switzerland) with an Amaxa electroporation system. The cells were then cultured for overnight in the medium supplied with the kit containing 10% FBS and 25 ng/ml recombinant GM-CSF (PeproTech, Rocky Hill, NJ). Cell sorting was done by a FACS Aria sorter (BD, San Jose, CA).
Immunostaining and Observation of Neutrophils.
Neutrophils were fixed with 4% Paraformaldehyde for 10 min and permeabilized with 0.01% saponin for 5 min and blocked with 2% BSA in PBS for 1hr. Cells were then incubated with 1:100 diluted primary antibodies in blocking buffer at 4°C for overnight. Next day, secondary antibodies with conjugated fluorescent probes (Alexa488 colored in green and Alexa633 colored in red in the figures) were 1:200 in blocking buffer and incubated with cells for 1hr at room temperature. Slides were prepared with the mounting medium containing DAPI, and imaged under a Leica SP5 confocal microscopy.
Quantification of polarization of immunostained proteins in neutrophils were done as previously described (Yuan, et al., 2017). Briefly, if the florescence intensity in 25% of the cell periphery is accounted more than 50% of the total florescence intensity of the cell periphery, we call the cell polarized.
For colocalization quantification, Z stack images of consecutive optical planes spaced by 0.2 μm were acquired to cover the whole cell volume using confocal microscopy. Pearson’s coefficient was determined using Imaris 7.2.3. The 3D images were reconstructed using Imaris 7.2.3 with a surface rendering model, and further adjusted with Image J (v1.48K).
For the imaging of neutrophils under suspension condition, the immunostained cells (staining in a microtube) or live cells were resuspended with CyGEL™, and loaded onto a coverslip, then incubated for 10 min at 37°C, followed by imaging under a confocal microscope.
Flow Chamber Assay.
To examine neutrophil adherence to endothelial cells under shear stress, mouse endothelial cells (Wang, et al., 2008) were cultured to confluency on 10ng/ml fibrinogen (Fn) coated coverslips and treated with 50 ng/ml TNFα (Peprotech) for 4 hours at 37°C. The coverslips containing the endothelial ce ll layer were washed with PBS and placed in a flow chamber apparatus (GlycoTech). The WT and Srgap2 deficient neutrophils labeled with 1 μM CFSE (5-[and 6]-carboxyfluorescein diacetate succinimidyl esters) (Thermo Fisher Scientific) and 1 μM Far-Red (Thermo Fisher Scientific) respectively were mixed at 1:1 ratio, and flowed into the chamber at a shear flow rate of 1 dyn/cm2. The adherent cells were then examined and counted under a fluorescence microscope. We alternated the labeled group in the study to completely eliminate the possibility of any influence from the dye.
To examine polarization in neutrophils adhered to polylysine (PK)-coated coverslips under shear stress, neutrophils were allowed to sediment to the coverslips for 10 min in the flow chamber. The sheer stress was gradually ramped up to 2 dyn/cm2 for 10 min before being imaged by a confocal microscope.
ICAM-binding Assay.
The assay was carried out as previously described (Konstandin, et al., 2006). The ICAM-1-Fc-F(ab’)2 complexes was generated by incubating Alexa Fluor® 647-conjugated AffiniPure goat anti-human Fcγ fragment-specific IgG F(ab’)2 fragments (Jackson Immunobiology) and ICAM-1-Fc (100 μg/ml, R&D) at 4°C for 30 min in PBS. Neutrophils, which were resuspended at 0.5 × 10⁶ cells/ml in PBS containing 0.5% BSA, 0.5 mM Mg2+ and 0.9 mM Ca2+, were mixed with the ICAM-1-Fc-F(ab’)2 complexes in the presence or absence of fMLP for 2 min. The reactions were terminated by adding 4% paraformaldehyde. After 5 min, fixation was stopped by adding 3-ml ice-cold FACS buffer (1% BSA in PBS). Cells were pelleted, resuspended in 300 μl of FACS buffer, and analyzed on a BD LSRII flow cytometer.
Integrin Blocking and Neutrophil Spreading.
For blocking the integrin by the anti-integrin antibody cocktail, neutrophils were incubated with the integrin β1 and β2 antibodies (10 μg/ml each) for 30 min at RT before the assays. For neutrophil spreading assay, neutrophils were kept on the ice for 1 hour and then placed onto Fn coated coverslips for 15 minutes. The cells were fixed with 4% paraformaldehyde and imaged under a phase contrast microscopy.
In vitro Chemotaxis Assay in a Dunn Chamber.
The chemotaxis assay using a Dunn chamber was carried out as previously described (Zhang, et al., 2010). We analyzed wildtype and mutant neutrophils simultaneously by labeling the cells with different tracing dyes. We alternated the labeled group in the study to completely eliminate the possibility of any influence from the dye. Time-lapse image series were acquired at 30-second intervals for 30 mins and were analyzed using the MetaMorph image analysis software as described in (Zhang, et al., 2010). We normally obtain two parameters to quantify neutrophil chemotaxis: average directional errors and motility. The average directional error measures the angle between the cell migration direction and the gradient direction and reflects how well a cell follows the gradient. Motility is cell migration speed. MIP2 (100nM) was used as the chemoattractant in this study.
Intravital Microscopy.
For intravital observations, mice were injected intrascrotally with recombinant mouse TNFα (0.5μg; R&D Systems; MN, USA) in 200 μl of saline for 4h prior to recording. To visualize neutrophils, rat monoclonal antibody RB6–8C5 against mouse Ly-6G (Gr-1) conjugated to PE (2μg in 200ul saline; Thermo Fisher Scientific, USA) was injected intravenously into the tail vein after TNFα stimulation. To visualize the vasculature of the cremaster muscle, mice were injected with 10 μg rat mAb against mouse PECAM-1 [eBioscience San Diego, CA, USA Clone 390, which has been previously reported not to interfere with leukocyte recruitment (Tasaka, et al., 2003; Christofidou-Solomidou, et al., 1997)] conjugated to Alexa647 (Thermo Fisher Scientific, Eugene, OR, USA). A mixture of 10 mg/kg xylazine (Bayer Inc., Animal Health, Toronto, ON, Canada) and 200 mg/kg ketamine hydrochloride (Rogar/STB Inc., Montreal, QC, Canada) was injected intraperitoneally to anesthetize mice. In all protocols, the left jugular vein was cannulated to administer additional anesthetics or antibodies. The mouse cremaster muscle was used to study neutrophil recruitment as previously described (Liu, et al., 2005) with the exception that neutrophil extravasation was visualized with spinning-disk confocal microscopy using a 20× water/0.95 immersion objective to focus the excitation onto the sample (Olympus, Center Valley, PA, USA). A 512×512 pixel back-thinned electron-multiplying charge-coupled device camera (C9100–13, Hamamatsu) was used for fluorescence detection. Volocity software (Improvision) was used to acquire and analyze images. A neutrophil was considered to be adherent if it remained stationary for more than 30 s, and total leukocyte adhesion was quantified as the number of adherent cells within a 100 μm length of venule during 5 min. Rolling flux is counted via the number of leukocytes/neutrophils that pass through the 100 um/min. Leukocyte emigration was defined as the number of cells in the extravascular space within a 200×300 microns area (0.06 mm2) adjacent to the observed venule.
Echocardiography.
Transthoracic 2-dimensional M-mode echocardiogram measurements were performed to analyze cardiac function using the Vevo770 system equipped with a 35-MHz transducer (Visualsonics, Toronto, Canada). Briefly, Mice were anaesthetized with inhalation of 1.5–2% isoflurane, and the left ventricular (LV) wall thickness, LV end-systolic diameter, and LV end-diastolic diameter were measured. Percentage of fractional shortening (FS%) and ejection fraction (EF%) were calculated as described (Wasilewski, et al., 2016). The measurements were performed before the surgery and at 24 hr after heart I/R.
Murine Heart Ischemia/reperfusion (IR) Models.
Myocardial I/R injury was induced in mice as described previously (Wang, et al., 2014). Briefly, the mice were anesthetized by 5.0% isoflurane, intubated and ventilated using a rodent ventilator. Anesthesia was maintained by inhalation of 1.5% to 2% isoflurane driven by 100% oxygen flow. Body temperature was regulated at 37°C by surface water heating. The hearts were exposed and the left anterior descending (LAD) coronary artery was ligated with an 8–0 silk ligature. After occlusion for 45 min, the coronary artery was reperfused by releasing the suture knot. 24 hours after reperfusion, the hearts were removed and perfused with saline. The infarct size was examined by TTC (2,3,5-triphenyltetrazolium chloride) staining. For TTC staining, the heart was perfused with 1% Evans Blue, and then sliced and incubated in 2% TTC for 15 min at 37 °C, and then kept in 4% PFA prior to acquiring images. Ratios of infarct size vs. ventricle area were measured and expressed as a percentage. For FACS analysis, heart was homogenized and digested in Dulbecco’s Modified Eagle Medium (DMEM) medium plus 10% FBS and Penicillin-Streptomycin (50 U/mL) with 2mg/ml collagenase for 1.5h at 37°C. The single cell suspension was subjected to antibodies staining and followed by flow analysis. For the neutrophils immunohistochemistry analysis, paraffin sections with the heart after I/R procedure were prepared and stained with an anti-Ly-6B.2 antibody.
Blood Cell Counts.
A Hemavet system (Drew Scientific), which is a multiparameter, automated hematology analyzer designed for in vitro diagnostic use, was used to count the leukocyte numbers in circulating blood.
Immunoprecipitation.
HEK293T cells were lysed in a cell lysis buffer (20 mM Tris-HCl, pH 7.5, 150 mM NaCl, 1% NP-40, 5 mM EDTA, Roche’s protease inhibitor cocktail, Roche’s phosphatase inhibitor cocktail). After removing insoluble materials by centrifugation, immunoprecipitation was carried out by adding various antibodies and Protein A/G-PLUS-agarose beads into supernatants. Immunocomplexes were washed three times with lysis buffer before the SDS sample buffer was added for SDS-PAGE analysis.
Preparation of Recombinant Proteins.
His-tagged RPH3A and SRGAP2 (502–1038 aa) were expressed in E. coli BL21(DE3) and purified by affinity chromatography using Ni-NTA agarose beads (GE Healthcare). Proteins were dialyzed to a buffer containing 20 mM HEPES, pH 7.5, 100 mM KCl, 0.1% Triton X-100, 0.2 mM EGTA, 10% glycerol, and 1 mM DTT.
Buoyant Density Flotation of Liposome Assay.
The assay was performed as previously described (Boswell, et al., 2012) with modifications. Liposomes were consisted of 87% phosphocholine (PC) and 9% phosphatidylserin (PS), which were purchased from Avanti Polar Lipids, with or without 4% individual phosphoinositide. Liposomes were generated by sonication using a bath sonicator. They were then incubated with His-RPH3A proteins (14 μg/ml) for 30 min on ice in 75 μl of 25 mM HEPES, pH 7.4, 100 mM KCl, 10% glycerol, and 1 mM DTT (reconstitution buffer). Liposomes binding reactions were conducted in the absence of Ca2+ (0.2 mM EGTA) or presence of 100 μM of free Ca2+. 75 μl of 80% Accudenz was added to the binding reaction to yield a final concentration of 40% Accudenz. 30% Accudenz and reconstitution buffers were then layered on top and centrifuged for 4 h in a TLA100 rotor at 32,000 rpm. The liposome layer was collected for Western analysis.
PI4KA Lipid Kinase Assay.
The kinase assay was performed as previously described (Baskin, et al., 2016) with modifications. Briefly, HA-tagged PI4KA protein was immunoprecipitated from HEK293T cells expressing PI4KA-HA and reconstituted in the kinase buffer (9802, Cell signaling). Liposomes containing 2μg C16-PtdIns (Echelon Biosciences) generated by sonication in the kinase buffer, γ33P-labelled ATP (15 μCi), and cold ATP (50 μM) were mixed with PI4KA-HA protein and incubated with or without recombinant SRGAP2 protein for 30 min at 37°C. The reaction was quenched by the addition of 700 μl of 2:1 chloroform/methanol containing 10 μg/ml Folch fraction (brain phosphoinositides) and 400 μl of 0.1M HCl. The organic extracts were dried, resuspended in a small amount of 1:1 chloroform/methanol, and analyzed by thin-layer chromatography (mobile phase is 14:32:24:30:64 water/acetic acid/methanol/acetone/chloroform). PtdIns(4)P was quantified by autoradiography using a STORM 860 system (Molecular Dynamics).
CD8+ T cells Preparation and Transfection.
Murine CD8+ T cells were isolated from the spleens of female mice (8 weeks old) with the CD8+ T cell isolation kit according to the manufacturer’s instructions (Miltenyi Biotec, 130-104-075). Primary CD8+ T cells were cultured in RPMI 1640 medium (Gibco, 11875–093) supplemented with 10% FBS, penicillin (100 U/ml), streptomycin (100 μg/ml), 2-mercaptoethanol (500 μM), and HEPES (10 mM) at 37°C in the presence of anti-CD3e (10 ug/ml) and anti-CD28 (10 μg/ml) for 24 h before transfection. Three million CD8+ T cells were electroporated with 1.6 μg endotoxin-free plasmids using Mouse T Cell Nucleofector™ Kit (VPA-1006, Lonza, Switzerland) with an Amaxa electroporation system. The cells were then cultured for overnight in the culture media provided by the kit prior to micropipette aspiration assay.
CD8+ T cells Immunostaining.
For immunofluorescence staining, freshly isolated CD8+ T cell were stimulated with CXCL12 (2 μM) for 30s at 37°C min either in suspension or att ached to a Fn-coated coverslip, and fixed with 4% Para-formaldehyde, then followed by the same procedure as neutrophils immunofluorescence staining described above.
Micropipette Aspiration Assay.
The micropipette pulling experiment was performed as previously reported (Stachowiak, et al., 2014). Briefly, micropipettes with long tapers >1 cm were drawn from borosilicate capillaries (WPI, Sarasota, FL, 1 mm OD, 0.58 mm ID) using a Sutter P-1000 puller (Novato, CA). Tips were cut at 1.5–4 μm diameter using a Narishige MF-830 microforge (Tokyo, Japan) using a small molten glass bead. Observation chambers consisted of a pair of glass coverslips (#1.5, Waldemar Knittel Glasbearbeitungs-GmbH, Braunschweig, Germany) separated by 3 mm, attached to a metal block using vacuum grease. The coverslips were pretreated twice with 30% KOH in Ethanol with sonication for 5’ each, followed by twice washing in sterile-filtered H2O with sonication for 5’. The chamber and pipettes were filled with 0.5% BSA in HBSS with calcium, magnesium (14025092, Thermo Fisher). Neutrophils or CD8+ cells were suspended in the same solution, and introduced into a corner of the observation chamber. Aspiration pressure was controlled using a hydrostatic system. The pressure difference between the two reservoirs was continuously read using a pressure sensor (Validyne DP-15) and transducer (Model CD223, Validyne Engineering, Northridge, CA). Gentle suction was applied with the micropipette (mounted on a Narishige MHW-3 3-axis manipulator) to pick up and lift the neutrophil above the coverslip. Time lapse images were recorded every 6 seconds with an Ultraview spinning disk confocal microscope (Perkin-Elmer Life Sciences) equipped with a Hamamatsu C9100 EM-CCD camera and Nikon TE2000-E inverted microscope, and controlled by Volocity (Improvision) software. Images were further processed using ImageJ. (v1.48K).
QUANTIFICATION AND STATISTICAL ANALYSIS
Statistical tests were performed with GraphPad Prism software (version 7.0). All data are presented as the mean ± SEM. Comparisons between multiple treatments were made using one-way or two-way Anova tests. Comparisons between the mean variables of 2 groups were made by two-tailed Student’s t test. P values of P < 0.05 (*, P < 0.05; **, P < 0.01, ***, P < 0.001) were considered to indicate statistical significance. Detailed statistical information about the number of biological replicates, number of cells, and number of animals can be found in the figure legends.
Supplementary Material
Movie S1. 3D raw images for Cell 1 in Fig. 1A. F-actin (red) and pMLC (green). Related to Figure 1A.
Movie S2. 3D raw images for Cell 1 in Fig. 1C. F-actin (red) and pMLC (green). Related to Figure 1C.
Movie S3. 3D raw images for Cell 1 in Fig. 6A. FBAR-GFP (green) and TagRFP (red). Related to Figure 6A.
Movie S4. 3D raw images for Cell 1 in Fig. 6B. FBAR-GFP (green) and TagRFP (red). Related to Figure 6B.
Movie S5. 3D raw images for Cell 1 in Fig. 6C. FBAR-GFP (green) and TagRFP (red). Related to Figure 6C.
Movie S6. 3D raw images for Cell 1 in Fig. 6D. FBAR-GFP (green) and TagRFP (red). Related to Figure 6D.
Highlights.
Cell attachment is required for chemical-induced cytoskeleton polarization.
Cell attachment induces local PM curvature increase to recruit and polarizes SRGAP2.
Polarized SRGAP2 induces sequential polarization of PtdIns4P, PIP5K1C90 and pMLC.
This SRGAP2 polarization signaling axis regulates neutrophil firm adhesion.
ACKNOWLEDGEMENT:
We thank Michelle Orsulak for technical assistance, Pietro De Camilli for providing PIP5K1C antibody (Di Paolo, et al., 2002) and human PI4KA cDNA, Guangxin Li and George Tellides for the mT/mG mice, Felix Rivera-Molina and Derek K. Toomre for assistance with spinning disk microscopy, and Elias Lolis for the MIP2 proteins (Rajasekaran, et al., 2012). The work is supported by NIH grants to D.W. (R35HL135805), W.T. (R01HL145152), E.K. (R01GM108954, R01GM114513), Z.S. (R01HL125885), F.P. (R01NSNS067557) and the Snyder Mouse Phenomics Resources Laboratory and Live Cell Imaging Facility, both of which were funded by the Snyder Institute for Chronic Diseases at the University of Calgary.
Footnotes
Publisher's Disclaimer: This is a PDF file of an unedited manuscript that has been accepted for publication. As a service to our customers we are providing this early version of the manuscript. The manuscript will undergo copyediting, typesetting, and review of the resulting proof before it is published in its final citable form. Please note that during the production process errors may be discovered which could affect the content, and all legal disclaimers that apply to the journal pertain.
COMPETING INTERESTS
The authors declare that they have no competing interests.
REFERENCES:
- Altschuler SJ, Angenent SB, Wang Y, and Wu LF (2008). On the spontaneous emergence of cell polarity. Nature 454, 886–9. [DOI] [PMC free article] [PubMed] [Google Scholar]
- Asnacios A, and Hamant O (2012). The mechanics behind cell polarity. Trends Cell Biol 22, 584–91. [DOI] [PubMed] [Google Scholar]
- Basit A, Tang W, and Wu D (2016). shRNA-Induced Gene Knockdown In Vivo to Investigate Neutrophil Function. Methods Mol Biol 1407, 169–77. [DOI] [PubMed] [Google Scholar]
- Baskin JM, Wu X, Christiano R, Oh MS, Schauder CM, Gazzerro E, Messa M, Baldassari S, Assereto S, Biancheri R, et al. (2016). The leukodystrophy protein FAM126A (hyccin) regulates PtdIns(4)P synthesis at the plasma membrane. Nat Cell Biol 18, 132–8. [DOI] [PMC free article] [PubMed] [Google Scholar]
- Bodin S, and Welch MD (2005). Plasma membrane organization is essential for balancing competing pseudopod- and uropod-promoting signals during neutrophil polarization and migration. Mol Biol Cell 16, 5773–83. [DOI] [PMC free article] [PubMed] [Google Scholar]
- Boswell KL, James DJ, Esquibel JM, Bruinsma S, Shirakawa R, Horiuchi H, and Martin TF (2012). Munc13–4 reconstitutes calcium-dependent SNARE-mediated membrane fusion. J Cell Biol 197, 301–12. [DOI] [PMC free article] [PubMed] [Google Scholar]
- Brombacher E, Urwyler S, Ragaz C, Weber SS, Kami K, Overduin M, and Hilbi H (2009). Rab1 guanine nucleotide exchange factor SidM is a major phosphatidylinositol 4-phosphate-binding effector protein of Legionella pneumophila. J Biol Chem 284, 4846–56. [DOI] [PMC free article] [PubMed] [Google Scholar]
- Charrier C, Joshi K, Coutinho-Budd J, Kim JE, Lambert N, de Marchena J, Jin WL, Vanderhaeghen P, Ghosh A, Sassa T, et al. (2012). Inhibition of SRGAP2 function by its human-specific paralogs induces neoteny during spine maturation. Cell 149, 923–35. [DOI] [PMC free article] [PubMed] [Google Scholar]
- Christofidou-Solomidou M, Nakada MT, Williams J, Muller WA, and DeLisser HM (1997). Neutrophil platelet endothelial cell adhesion molecule-1 participates in neutrophil recruitment at inflammatory sites and is down-regulated after leukocyte extravasation. J Immunol 158, 4872–8. [PubMed] [Google Scholar]
- Clarke JH, Richardson JP, Hinchliffe KA, and Irvine RF (2007). Type II PtdInsP kinases: location, regulation and function. Biochem Soc Symp, 149–59. [DOI] [PubMed] [Google Scholar]
- Corbalan-Garcia S, and Gomez-Fernandez JC (2014). Signaling through C2 domains: more than one lipid target. Biochim Biophys Acta 1838, 1536–47. [DOI] [PubMed] [Google Scholar]
- Coutinho-Budd J, Ghukasyan V, Zylka MJ, and Polleux F (2012). The F-BAR domains from srGAP1, srGAP2 and srGAP3 regulate membrane deformation differently. J Cell Sci 125, 3390–401. [DOI] [PMC free article] [PubMed] [Google Scholar]
- Cramer LP (2010). Forming the cell rear first: breaking cell symmetry to trigger directed cell migration. Nat Cell Biol 12, 628–32. [DOI] [PubMed] [Google Scholar]
- De Matteis MA, Wilson C, and D’Angelo G (2013). Phosphatidylinositol-4-phosphate: the Golgi and beyond. BioEssays : news and reviews in molecular, cellular and developmental biology 35, 612–22. [DOI] [PubMed] [Google Scholar]
- de Oliveira S, Rosowski EE, and Huttenlocher A (2016). Neutrophil migration in infection and wound repair: going forward in reverse. Nature reviews. Immunology 16, 378–91. [DOI] [PMC free article] [PubMed] [Google Scholar]
- Devreotes P, and Horwitz AR (2015). Signaling networks that regulate cell migration. Cold Spring Harb Perspect Biol 7, a005959. [DOI] [PMC free article] [PubMed] [Google Scholar]
- Di Paolo G, Pellegrini L, Letinic K, Cestra G, Zoncu R, Voronov S, Chang S, Guo J, Wenk MR, and De Camilli P (2002). Recruitment and regulation of phosphatidylinositol phosphate kinase type 1 gamma by the FERM domain of talin. Nature 420, 85–9. [DOI] [PubMed] [Google Scholar]
- Francis SA, Shen X, Young JB, Kaul P, and Lerner DJ (2006). Rho GEF Lsc is required for normal polarization, migration, and adhesion of formyl-peptide-stimulated neutrophils. Blood 107, 1627–35. [DOI] [PMC free article] [PubMed] [Google Scholar]
- Frost A, Unger VM, and De Camilli P (2009). The BAR domain superfamily: membrane-molding macromolecules. Cell 137, 191–6. [DOI] [PMC free article] [PubMed] [Google Scholar]
- Gao K, Tang W, Li Y, Zhang P, Wang D, Yu L, Wang C, and Wu D (2015). Front-signal-dependent accumulation of the RHOA inhibitor FAM65B at leading edges polarizes neutrophils. J Cell Sci 128, 992–1000. [DOI] [PMC free article] [PubMed] [Google Scholar]
- Gomez-Mouton C, and Manes S (2007). Establishment and maintenance of cell polarity during leukocyte chemotaxis. Cell Adh Migr 1, 69–76. [DOI] [PMC free article] [PubMed] [Google Scholar]
- Graziano BR, and Weiner OD (2014). Self-organization of protrusions and polarity during eukaryotic chemotaxis. Curr Opin Cell Biol 30C, 60–67. [DOI] [PMC free article] [PubMed] [Google Scholar]
- Guerrier S, Coutinho-Budd J, Sassa T, Gresset A, Jordan NV, Chen K, Jin WL, Frost A, and Polleux F (2009). The F-BAR domain of srGAP2 induces membrane protrusions required for neuronal migration and morphogenesis. Cell 138, 990–1004. [DOI] [PMC free article] [PubMed] [Google Scholar]
- Hall C, Flores MV, Storm T, Crosier K, and Crosier P (2007). The zebrafish lysozyme C promoter drives myeloid-specific expression in transgenic fish. BMC developmental biology 7, 42. [DOI] [PMC free article] [PubMed] [Google Scholar]
- Hammond GR, Fischer MJ, Anderson KE, Holdich J, Koteci A, Balla T, and Irvine RF (2012). PI4P and PI(4,5)P2 are essential but independent lipid determinants of membrane identity. Science 337, 727–30. [DOI] [PMC free article] [PubMed] [Google Scholar]
- Hammond GR, Machner MP, and Balla T (2014). A novel probe for phosphatidylinositol 4-phosphate reveals multiple pools beyond the Golgi. J Cell Biol. 205, 113–26. [DOI] [PMC free article] [PubMed] [Google Scholar]
- Hammond GR, Schiavo G, and Irvine RF (2009). Immunocytochemical techniques reveal multiple, distinct cellular pools of PtdIns4P and PtdIns(4,5)P(2). The Biochemical journal 422, 23–35. [DOI] [PMC free article] [PubMed] [Google Scholar]
- Hind LE, Vincent WJ, and Huttenlocher A (2016). Leading from the Back: The Role of the Uropod in Neutrophil Polarization and Migration. Dev Cell 38, 161–9. [DOI] [PMC free article] [PubMed] [Google Scholar]
- Hoyer FF, and Nahrendorf M (2017). Neutrophil contributions to ischaemic heart disease. European heart journal 38, 465–472. [DOI] [PubMed] [Google Scholar]
- Insall RH (2010). Understanding eukaryotic chemotaxis: a pseudopod-centred view. Nat Rev Mol Cell Biol 11, 453–8. [DOI] [PubMed] [Google Scholar]
- Jethwa N, Fili N, and Larijani B (2012). Acute depletion of plasma membrane phospholipids-dissecting the roles of PtdIns(4)P and PtdIns(4,5)P2. Journal of chemical biology 5, 137–9. [DOI] [PMC free article] [PubMed] [Google Scholar]
- Kolaczkowska E, and Kubes P (2013). Neutrophil recruitment and function in health and inflammation. Nat Rev Immunol 13, 159–75. [DOI] [PubMed] [Google Scholar]
- Konstandin MH, Sester U, Klemke M, Weschenfelder T, Wabnitz GH, and Samstag Y (2006). A novel flow-cytometry-based assay for quantification of affinity and avidity changes of integrins. J Immunol Methods 310, 67–77. [DOI] [PubMed] [Google Scholar]
- Kumar S, Xu J, Perkins C, Guo F, Snapper S, Finkelman FD, Zheng Y, and Filippi MD (2012). Cdc42 regulates neutrophil migration via crosstalk between WASp, CD11b, and microtubules. Blood 120, 3563–74. [DOI] [PMC free article] [PubMed] [Google Scholar]
- Kwon Y, Hofmann T, and Montell C (2007). Integration of phosphoinositide- and calmodulin-mediated regulation of TRPC6. Mol Cell 25, 491–503. [DOI] [PMC free article] [PubMed] [Google Scholar]
- Ladoux B, Mege RM, and Trepat X (2016). Front-Rear Polarization by Mechanical Cues: From Single Cells to Tissues. Trends in cell biology 26, 420–433. [DOI] [PMC free article] [PubMed] [Google Scholar]
- Lam PY, Fischer RS, Shin WD, Waterman CM, and Huttenlocher A (2014). Spinning disk confocal imaging of neutrophil migration in zebrafish. Methods Mol Biol 1124, 219–33. [DOI] [PMC free article] [PubMed] [Google Scholar]
- Ley K, Laudanna C, Cybulsky MI, and Nourshargh S (2007). Getting to the site of inflammation: the leukocyte adhesion cascade updated. Nature reviews. Immunology 7, 678–89. [DOI] [PubMed] [Google Scholar]
- Liu L, Cara DC, Kaur J, Raharjo E, Mullaly SC, Jongstra-Bilen J, Jongstra J, and Kubes P (2005). LSP1 is an endothelial gatekeeper of leukocyte transendothelial migration. J Exp Med 201, 409–18. [DOI] [PMC free article] [PubMed] [Google Scholar]
- Liu L, Das S, Losert W, and Parent CA (2010). mTORC2 regulates neutrophil chemotaxis in a cAMP- and RhoA-dependent fashion. Developmental cell 19, 845–57. [DOI] [PMC free article] [PubMed] [Google Scholar]
- Loison F, Zhu H, Karatepe K, Kasorn A, Liu P, Ye K, Zhou J, Cao S, Gong H, Jenne DE, et al. (2014). Proteinase 3-dependent caspase-3 cleavage modulates neutrophil death and inflammation. J Clin Invest 124, 4445–58. [DOI] [PMC free article] [PubMed] [Google Scholar]
- Majumdar R, Sixt M, and Parent CA (2014). New paradigms in the establishment and maintenance of gradients during directed cell migration. Curr Opin Cell Biol 30, 33–40. [DOI] [PMC free article] [PubMed] [Google Scholar]
- Muzumdar MD, Tasic B, Miyamichi K, Li L, and Luo L (2007). A global double-fluorescent Cre reporter mouse. Genesis 45, 593–605. [DOI] [PubMed] [Google Scholar]
- Nakatsu F, Baskin JM, Chung J, Tanner LB, Shui G, Lee SY, Pirruccello M, Hao M, Ingolia NT, Wenk MR, et al. (2012). PtdIns4P synthesis by PI4KIIIalpha at the plasma membrane and its impact on plasma membrane identity. J Cell Biol 199, 1003–16. [DOI] [PMC free article] [PubMed] [Google Scholar]
- Navaroli DM, Bellve KD, Standley C, Lifshitz LM, Cardia J, Lambright D, Leonard D, Fogarty KE, and Corvera S (2012). Rabenosyn-5 defines the fate of the transferrin receptor following clathrin-mediated endocytosis. Proc Natl Acad Sci U S A 109, E471–80. [DOI] [PMC free article] [PubMed] [Google Scholar]
- Nichols JM, Veltman D, and Kay RR (2015). Chemotaxis of a model organism: progress with Dictyostelium. Curr Opin Cell Biol 36, 7–12. [DOI] [PubMed] [Google Scholar]
- Nourshargh S, and Alon R (2014). Leukocyte Migration into Inflamed Tissues. Immunity 41, 694–707. [DOI] [PubMed] [Google Scholar]
- Rajasekaran D, Keeler C, Syed MA, Jones MC, Harrison JK, Wu D, Bhandari V, Hodsdon ME, and Lolis EJ (2012). A model of GAG/MIP-2/CXCR2 interfaces and its functional effects. Biochemistry 51, 5642–54. [DOI] [PMC free article] [PubMed] [Google Scholar]
- Record J, Malinova D, Zenner HL, Plagnol V, Nowak K, Syed F, Bouma G, Curtis J, Gilmour K, Cale C, et al. (2015). Immunodeficiency and severe susceptibility to bacterial infection associated with a loss-of-function homozygous mutation of MKL1. Blood 126, 1527–35. [DOI] [PMC free article] [PubMed] [Google Scholar]
- Ridley AJ, Schwartz MA, Burridge K, Firtel RA, Ginsberg MH, Borisy G, Parsons JT, and Horwitz AR (2003). Cell migration: integrating signals from front to back. Science 302, 1704–9. [DOI] [PubMed] [Google Scholar]
- Rizo J, and Sudhof TC (1998). C2-domains, structure and function of a universal Ca2+-binding domain. The Journal of biological chemistry 273, 15879–82. [DOI] [PubMed] [Google Scholar]
- Sanchez-Madrid F, and Serrador JM (2009). Bringing up the rear: defining the roles of the uropod. Nat Rev Mol Cell Biol 10, 353–9. [DOI] [PubMed] [Google Scholar]
- Schoebel S, Blankenfeldt W, Goody RS, and Itzen A (2010). High-affinity binding of phosphatidylinositol 4-phosphate by Legionella pneumophila DrrA. EMBO reports 11, 598–604. [DOI] [PMC free article] [PubMed] [Google Scholar]
- Seveau S, Eddy RJ, Maxfield FR, and Pierini LM (2001). Cytoskeleton-dependent membrane domain segregation during neutrophil polarization. Mol Biol Cell 12, 3550–62. [DOI] [PMC free article] [PubMed] [Google Scholar]
- Shi Y, Zhang J, Mullin M, Dong B, Alberts AS, and Siminovitch KA (2009). The mDial formin is required for neutrophil polarization, migration, and activation of the LARG/RhoA/ROCK signaling axis during chemotaxis. J Immunol 182, 3837–45. [DOI] [PubMed] [Google Scholar]
- Shin ME, He Y, Li D, Na S, Chowdhury F, Poh YC, Collin O, Su P, de Lanerolle P, Schwartz MA, et al. (2010). Spatiotemporal organization, regulation and functions of tractions during neutrophil chemotaxis. Blood. [DOI] [PMC free article] [PubMed] [Google Scholar]
- Simunovic M, Voth GA, Callan-Jones A, and Bassereau P (2015). When Physics Takes Over: BAR Proteins and Membrane Curvature. Trends Cell Biol 25, 780–92. [DOI] [PMC free article] [PubMed] [Google Scholar]
- Sohrmann M, and Peter M (2003). Polarizing without a c(l)ue. Trends in cell biology 13, 526–33. [DOI] [PubMed] [Google Scholar]
- Sporny M, Guez-Haddad J, Kreusch A, Shakartzi S, Neznansky A, Cross A, Isupov MN, Qualmann B, Kessels MM, and Opatowsky Y (2017). Structural History of Human SRGAP2 Proteins. Mol Biol Evol 34, 1463–1478. [DOI] [PMC free article] [PubMed] [Google Scholar]
- Srinivasan S, Wang F, Glavas S, Ott A, Hofmann F, Aktories K, Kalman D, and Bourne HR (2003). Rac and Cdc42 play distinct roles in regulating PI(3,4,5)P3 and polarity during neutrophil chemotaxis. J Cell Biol. 160, 375–85. [DOI] [PMC free article] [PubMed] [Google Scholar]
- Stachowiak MR, Laplante C, Chin HF, Guirao B, Karatekin E, Pollard TD, and O’Shaughnessy B (2014). Mechanism of cytokinetic contractile ring constriction in fission yeast. Dev Cell 29, 547–561. [DOI] [PMC free article] [PubMed] [Google Scholar]
- Subramanian KK, Jia Y, Zhu D, Simms BT, Jo H, Hattori H, You J, Mizgerd JP, and Luo HR (2007). Tumor suppressor PTEN is a physiological suppressor of chemoattractant-mediated neutrophil functions. Blood. [DOI] [PMC free article] [PubMed] [Google Scholar]
- Suetsugu S, Toyooka K, and Senju Y (2010). Subcellular membrane curvature mediated by the BAR domain superfamily proteins. Seminars in cell & developmental biology 21, 340–9. [DOI] [PubMed] [Google Scholar]
- Sun CX, Magalhaes MA, and Glogauer M (2007). Rac1 and Rac2 differentially regulate actin free barbed end formation downstream of the fMLP receptor. J Cell Biol 179, 239–45. [DOI] [PMC free article] [PubMed] [Google Scholar]
- Tang W, Zhang Y, Xu W, Harden TK, Sondek J, Sun L, Li L, and Wu D (2011). A PLCbeta/PI3Kgamma-GSK3 signaling pathway regulates cofilin phosphatase slingshot2 and neutrophil polarization and chemotaxis. Dev Cell 21, 1038–50. [DOI] [PMC free article] [PubMed] [Google Scholar]
- Tasaka S, Qin L, Saijo A, Albelda SM, DeLisser HM, and Doerschuk CM (2003). Platelet endothelial cell adhesion molecule-1 in neutrophil emigration during acute bacterial pneumonia in mice and rats. Am J Respir Crit Care Med 167, 164–70. [DOI] [PubMed] [Google Scholar]
- Van Keymeulen A, Wong K, Knight ZA, Govaerts C, Hahn KM, Shokat KM, and Bourne HR (2006). To stabilize neutrophil polarity, PIP3 and Cdc42 augment RhoA activity at the back as well as signals at the front. J Cell Biol. 174, 437–45. [DOI] [PMC free article] [PubMed] [Google Scholar]
- Vinten-Johansen J (2004). Involvement of neutrophils in the pathogenesis of lethal myocardial reperfusion injury. Cardiovascular research 61, 481–97. [DOI] [PubMed] [Google Scholar]
- Wang F (2009). The signaling mechanisms underlying cell polarity and chemotaxis. Cold Spring Harbor perspectives in biology 1, a002980. [DOI] [PMC free article] [PubMed] [Google Scholar]
- Wang X, Ha T, Zou J, Ren D, Liu L, Zhang X, Kalbfleisch J, Gao X, Williams D, and Li C (2014). MicroRNA-125b protects against myocardial ischaemia/reperfusion injury via targeting p53-mediated apoptotic signalling and TRAF6. Cardiovascular research 102, 385–95. [DOI] [PMC free article] [PubMed] [Google Scholar]
- Wang Z, Liu B, Wang P, Dong X, Fernandez-Hernando C, Li Z, Hla T, Claffey K, Smith JD, and Wu D (2008). Phospholipase C beta3 deficiency leads to macrophage hypersensitivity to apoptotic induction and reduction of atherosclerosis in mice. J Clin Invest 118, 195–204. [DOI] [PMC free article] [PubMed] [Google Scholar]
- Wasilewski MA, Grisanti LA, Song J, Carter RL, Repas AA, Myers VD, Gao E, Koch WJ, Cheung JY, Feldman AM, et al. (2016). Vasopressin Type 1A Receptor Deletion Enhances Cardiac Contractility, beta-Adrenergic Receptor Sensitivity and Acute Cardiac Injury-induced Dysfunction. Clinical science (London, England : 1979). [DOI] [PMC free article] [PubMed] [Google Scholar]
- Wong K, Van Keymeulen A, and Bourne HR (2007). PDZRhoGEF and myosin II localize RhoA activity to the back of polarizing neutrophil-like cells. J Cell Biol. 179, 1141–8. [DOI] [PMC free article] [PubMed] [Google Scholar]
- Woodham EF, and Machesky LM (2014). Polarised cell migration: intrinsic and extrinsic drivers. Curr Opin Cell Biol 30, 25–32. [DOI] [PubMed] [Google Scholar]
- Xu J, Wang F, Van Keymeulen A, Herzmark P, Straight A, Kelly K, Takuwa Y, Sugimoto N, Mitchison T, and Bourne HR (2003). Divergent signals and cytoskeletal assemblies regulate self-organizing polarity in neutrophils. Cell 114, 201–14. [DOI] [PubMed] [Google Scholar]
- Xu J, Wang F, Van Keymeulen A, Rentel M, and Bourne HR (2005). Neutrophil microtubules suppress polarity and enhance directional migration. Proc Natl Acad Sci U S A 102, 6884–9. [DOI] [PMC free article] [PubMed] [Google Scholar]
- Xu W, Wang P, Petri B, Zhang Y, Tang W, Sun L, Kress H, Mann T, Shi Y, Kubes P, et al. (2010). Integrin-induced PIP5K1C kinase polarization regulates neutrophil polarization, directionality, and in vivo infiltration. Immunity 33, 340–50. [DOI] [PMC free article] [PubMed] [Google Scholar]
- Xu X, and Jin T (2015). The Novel Functions of the PLC/PKC/PKD Signaling Axis in G Protein-Coupled Receptor-Mediated Chemotaxis of Neutrophils. Journal of immunology research 2015, 817604. [DOI] [PMC free article] [PubMed] [Google Scholar]
- Yoo SK, Deng Q, Cavnar PJ, Wu YI, Hahn KM, and Huttenlocher A (2010). Differential regulation of protrusion and polarity by PI3K during neutrophil motility in live zebrafish. Dev Cell 18, 226–36. [DOI] [PMC free article] [PubMed] [Google Scholar]
- Yu JA, Castranova D, Pham VN, and Weinstein BM (2015). Single-cell analysis of endothelial morphogenesis in vivo. Development 142, 2951–61. [DOI] [PMC free article] [PubMed] [Google Scholar]
- Yuan Q, Ren C, Xu W, Petri B, Zhang J, Zhang Y, Kubes P, Wu D, and Tang W (2017). PKN1 Directs Polarized RAB21 Vesicle Trafficking via RPH3A and Is Important for Neutrophil Adhesion and Ischemia-Reperfusion Injury. Cell reports 19, 2586–2597. [DOI] [PMC free article] [PubMed] [Google Scholar]
- Zhang Y, Bai XT, Zhu KY, Jin Y, Deng M, Le HY, Fu YF, Chen Y, Zhu J, Look AT, et al. (2008). In vivo interstitial migration of primitive macrophages mediated by JNK-matrix metalloproteinase 13 signaling in response to acute injury. Journal of immunology (Baltimore, Md. : 1950) 181, 2155–64. [DOI] [PubMed] [Google Scholar]
- Zhang Y, Tang W, Jones MC, Xu W, Halene S, and Wu D (2010). Different roles of G protein subunits beta1 and beta2 in neutrophil function revealed by gene expression silencing in primary mouse neutrophils. J Biol Chem 285, 24805–14. [DOI] [PMC free article] [PubMed] [Google Scholar]
- Zhang Y, Tang W, Zhang H, Niu X, Xu Y, Zhang J, Gao K, Pan W, Boggon TJ, Toomre D, et al. (2013). A network of interactions enables CCM3 and STK24 to coordinate UNC13D-driven vesicle exocytosis in neutrophils. Dev Cell 27, 215–26. [DOI] [PMC free article] [PubMed] [Google Scholar]
Associated Data
This section collects any data citations, data availability statements, or supplementary materials included in this article.
Supplementary Materials
Movie S1. 3D raw images for Cell 1 in Fig. 1A. F-actin (red) and pMLC (green). Related to Figure 1A.
Movie S2. 3D raw images for Cell 1 in Fig. 1C. F-actin (red) and pMLC (green). Related to Figure 1C.
Movie S3. 3D raw images for Cell 1 in Fig. 6A. FBAR-GFP (green) and TagRFP (red). Related to Figure 6A.
Movie S4. 3D raw images for Cell 1 in Fig. 6B. FBAR-GFP (green) and TagRFP (red). Related to Figure 6B.
Movie S5. 3D raw images for Cell 1 in Fig. 6C. FBAR-GFP (green) and TagRFP (red). Related to Figure 6C.
Movie S6. 3D raw images for Cell 1 in Fig. 6D. FBAR-GFP (green) and TagRFP (red). Related to Figure 6D.