
Figure 6. Spatial and molecular organization of neuronal clusters enriched in genes relevant to social behaviors.
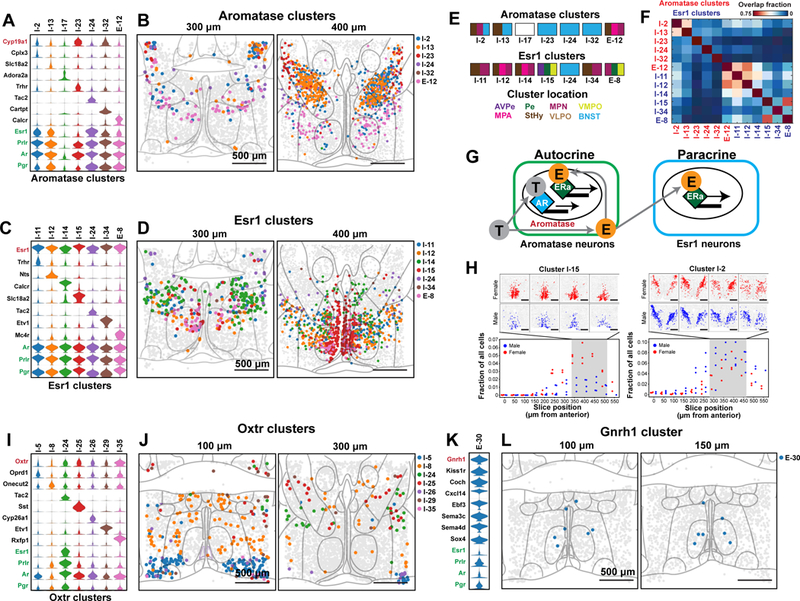
(A) Expression distributions of selected marker genes and genes of interest for neuronal clusters enriched in aromatase (Cyp19a1). Expression distributions are calculated as in Fig. 2. (B) Spatial distributions of neuronal clusters depicted in (A). Two of the twelve slices from a female mouse sample are depicted. Nuclei boundaries depicted in light gray are as defined in Fig. 5A. (C, D) As in (A, B) but for clusters enriched in estrogen receptor alpha (Esr1). (E) Schematic showing the nuclei spanned by individual clusters, as indicated by the color subdivisions of the rectangles, colored identically to the nuclei abbreviations listed below. The nuclei abbreviations are as defined in Figs. 3F, 5B. I-17 is not colored because it was found at the edge of our imaged region and falls outside of the boundaries of the nearest imaged nuclei, the VLPO (Table S9). (F) Average overlap fraction between aromatase-enriched clusters and Esr1-enriched clusters for all measured animals. Cluster I-24 is enriched in both aromatase and Esr1 and only listed only once. (G) Models of autocrine and paracrine signaling. Circulating testosterone (gray T) can activate cells expressing androgen receptor (AR) or, in cells expressing aromatase, can be converted to estrogen (orange E). Autocrine: In cells co-expressing aromatase and Esr1, estrogen produced in these cells can activate estrogen receptor (ERa) in the same cells. Paracrine: Estrogen produced by aromatase-enriched cells can activate ERa in nearby cells enriched with Esr1. (H) Comparison of the fraction of cells that belong to the specified neuronal clusters (I-15 or I-2) for all male (blue) and female (red) replicates as a function of the anterior-posterior position of the slices. Above each panel are the spatial distribution of the cluster in four slices from a single female (red) and male (blue) replicate. (I, J) As in (A, B) but for clusters enriched in oxytocin receptor (Oxtr). (K, L) As in (A, B) but for a cluster enriched in gonadotropin releasing hormone 1 (Gnrh1). MERFISH revealed 8, 15, and 19 Aromatase-, Esr1- and Oxtr-enriched clusters, respectively, with only the 7 most enriched clusters depicted for each.