

Abstract
Aim:
The purpose of this study was to evaluate the accuracy of implant casts generated with splinted and nonsplinted impression techniques with multiple parallel and nonparallel implants.
Materials and Methods:
In this experimental study, two edentulous maxillary stainless steel models with seven implant analogs in the central incisor, canine, premolar, and first molar region simulating clinical condition were used (control groups). In one master model, implant analogs were placed parallel to each other, whereas in another model, analogs were placed with a tilt-to-longitudinal axis. Forty stone casts were made from each model using splined and nonsplinted technique using polyether with open-tray technique. Then, the difference in the distance between the master cast and experimental cast in three dimensions was measured by coordinate-measuring machine. One-way ANOVA, post hoc Bonferroni test, and unpaired t-test were used for data analysis.
Results:
Statistical comparisons were made using ANOVA test, post hoc test, and unpaired t-test. Splinted technique with parallel implants generated interimplant distance values closest to the master model, followed by nonsplinted technique with parallel implants, splinted technique with angulated implants, and nonsplinted technique with angulated implants.
Conclusions:
Splinted impression technique exhibited higher accuracy than the other technique studies in both parallel and angulated implants.
Keywords: Accuracy, master cast, splinted
INTRODUCTION
In completely edentulous patients, prosthetic rehabilitation with implants is a very reliable and predictable treatment option. According to the Branemark System concept, placement of the implants should be fairly upright. An overall decrease in quantity of bone makes the ideal placement of implants more difficult in the maxilla. In severely resorbed ridges, placing angulated implants is a very suitable and appropriate alternative treatment option to bone augmentation and sinus lift procedures.[1,2,3] There are several clinical advantages associated with the tilting of implants in the residual crestal bone. It increases the degree of implant-to-bone contact area and thus increases the primary stability of implant. Moreover, it results in a better load distribution situation due to longer distance between the implants which allows the elimination of the cantilevers.[4]
To record the three-dimensional (3D) intraoral relationships among the implants and adjacent structures, the most critical clinical step is impression making. First step in achieving an accurate and passively fitting prosthesis is the reproduction of intraoral relationship of implants through impression procedures.[5] Laboratory errors due to inaccuracies during impression making may result in lack of precision and misfit of prosthesis in fixed and implant-supported prosthesis that can lead to mechanical and biological complications.[6,7] Mechanical complications resulting in prosthesis misfit such as occlusal[3] discrepancies, screw and abutment loosening, and fracture of the prosthetic or implant components are seen. Biological complications from plaque accumulation due to marginal discrepancies may affect soft or hard tissues around the implants.[6,8]
To obtain the maximum accuracy of the implant position, recent developments in impression techniques have been regarded more than other issues as it is a critical step to precisely transfer the spatial relationships of implants from mouth to master cast to ensure fit of implant-retained prosthesis.[9,10]
Most of the studies evaluated the impression accuracy in ideal conditions with various methods. Although nonparallel implants are commonly encountered in clinical situations, there are only a few studies to evaluate the effect of angulated implants on the accuracy of the impression.[6]
Hence, this study aims to compare the implant cast accuracy of angulated and parallel implants with splinted and nonsplinted impression techniques.
MATERIALS AND METHODS
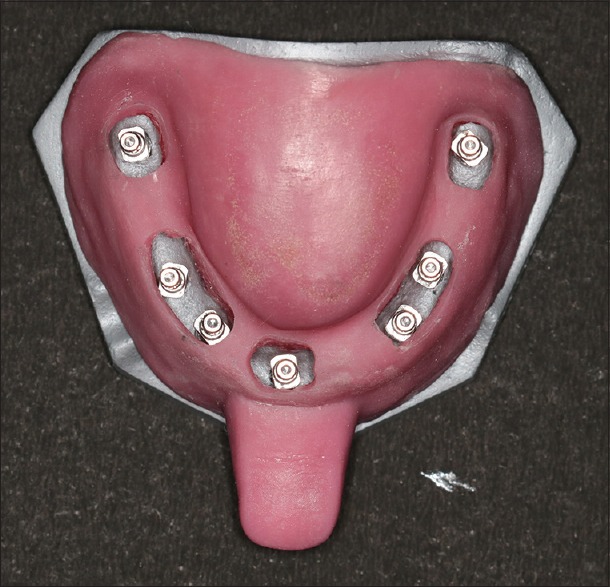
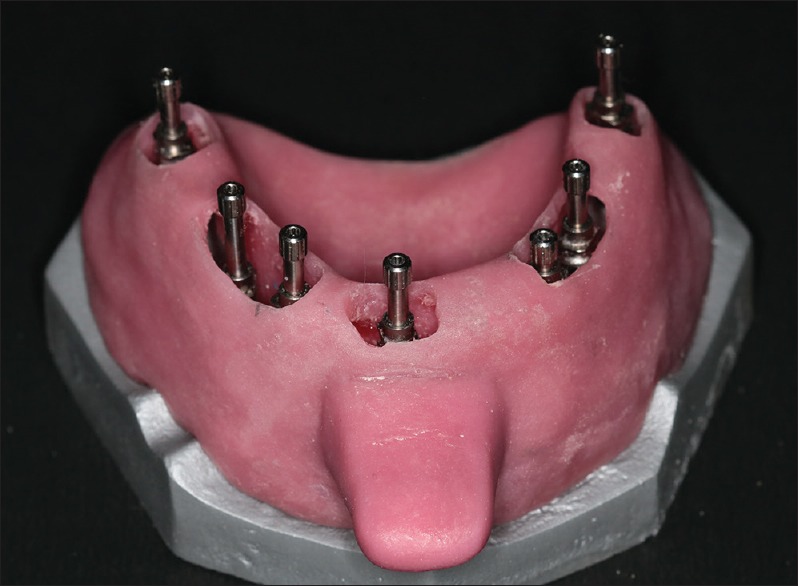
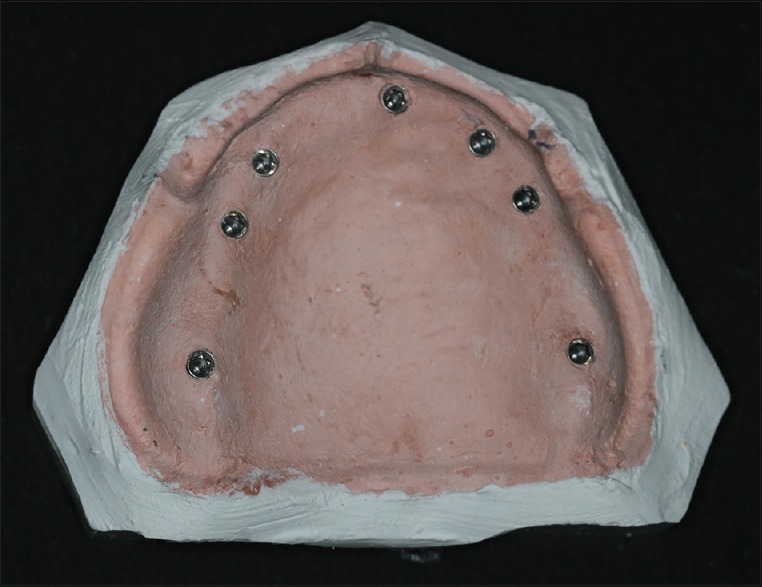
Two stainless steel edentulous maxillary models were fabricated by duplicating an ideal maxillary edentulous cast. Seven implant analogs (ADIN Dental Implant Systems Ltd., Afula, Israel, RS5737, Internal Hex) were drilled parallel to each other in one master model [Figure 1], whereas in the other master model, longitudinal axis of implant analogs was angulated in relation to horizontal plane [Figure 2]. One of the implant analogs in the central incisor region numbered as A was placed parallel to the long axis of the implant master model, implant analogs in the bilateral canine region numbered as B and G were given a tilt of 15°, and implant analogs in the bilateral premolar region numbered as C and F were given a tilt of 20° while analogs in the bilateral first molar region numbered as D and E were given a tilt of 30°. 3D interimplant distance of both the master models were simulated using coordinate-measuring machine (CMM), and angulation was measured and marked by analyzing through CMM [Figures 3 and 4]. Central implant was placed perpendicular to the surface in both the models, and the other implants in model with angulated implants had divergence/convergence from the central component.
Figure 1.
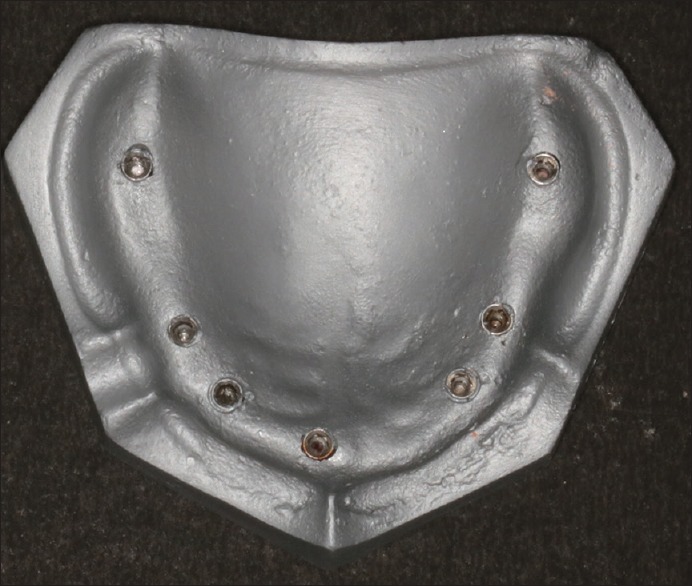
Implant master model (Group 1)
Figure 2.
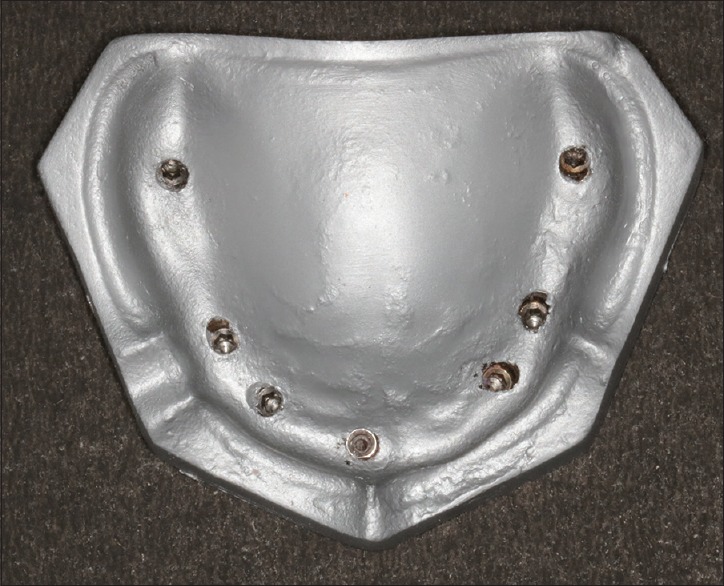
Implant master model (Group 2)
Figure 3.
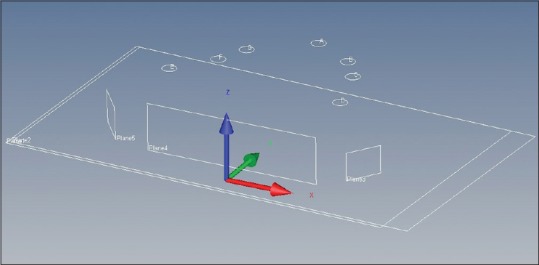
Implant master model (Group 1) measurements on coordinate-measuring machine
Figure 4.
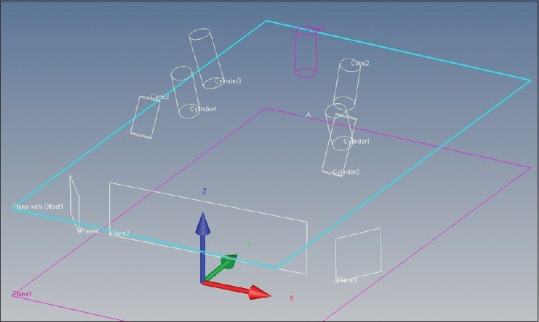
Implant master model (Group 2) measurements on coordinate-measuring machine
A 4-mm thick polyethylene vacuuform sheet was adapted over the implant master model with impression posts screwed in the implant analogs to provide uniform space for impression material. The window was made in the center in the adapted vacuuform sheet and was also trimmed 2-mm short of sulcular extension, thus creating stop to guide tray positioning while impression making. An alginate impression of master model with the sheet adapted was made and to obtain a single cast on which all custom trays molded. Two sheets of modeling wax (Y Dents; No. 2 wax; MDM Corporation) were adapted over the cast, and wax-up was completed for the tray. During the wax-up, sections of wax were removed over the impression posts. After the wax-up, custom tray was fabricated in heat-cure acrylic resin (DPI; Dental Products Pvt. Ltd.). The tray handles were made of autopolymerizing acrylic resin (DPI; Dental Products Pvt. Ltd.). In this way, custom trays were fabricated for both the master models with stop and tray flange projections for standardized seating of tray. Trays thus obtained were open in the region of open-tray transfer copings to provide an access to posts while impression making [Figures 5–7].
Figure 5.
Custom tray for model with parallel implants
Figure 7.
Screwed in impression copings with open tray for impression
Figure 6.
Custom tray for model with angulated implants
In master model with angulated implants, impression copings when placed were much closer to each other due to angulations as compared to the model with parallel implants. Therefore, tray design was modified according to the angulations of the implants in both the groups for easy insertion and removal during impression making.
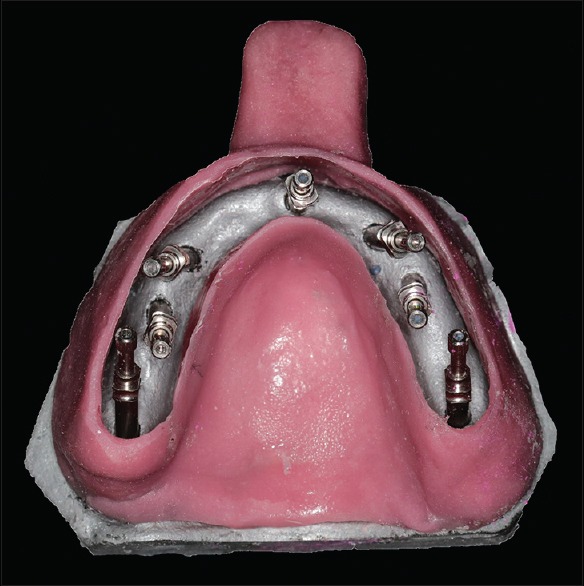
Impressions were made of both the models with parallel and angulated implants [Figure 8]. Polyether material (3M ESPE, Impregum, medium consistency) was used for all impressions as it shows the greatest torque values which are favorable for the manipulation of a pickup impression.
Figure 8.
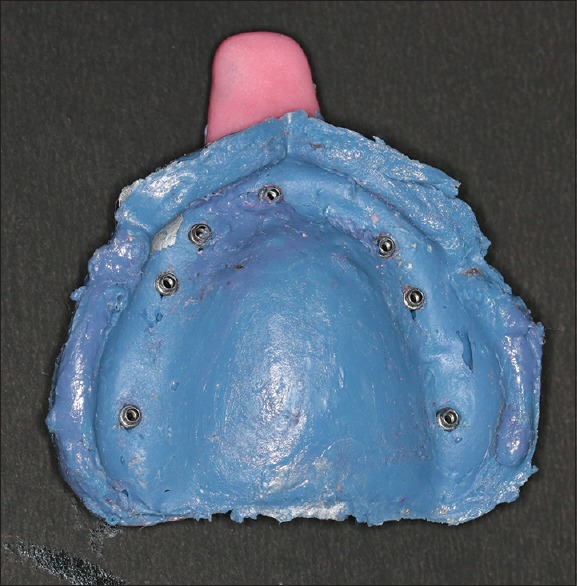
Posts retained in impression
Both the groups were further divided into four subgroups based on impression techniques. Ten impressions were made for each of the subgroups.
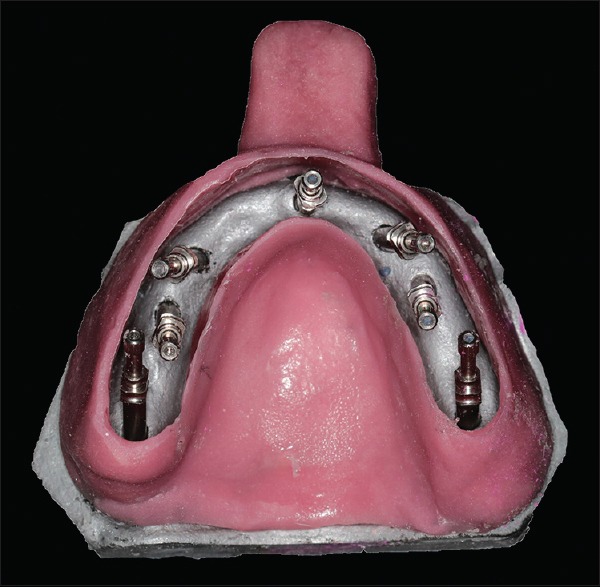
In first subgroup (Subgroup 1 nonsplinted [NS]) impression copings were not splinted to each other. Open-tray transfer copings were screwed to the implant analogs. Impressions were made. Open-tray transfer copings were exposed through the open-tray access after removing the impression material. The impression material was allowed to set for 10 min. The open-tray transfer was then unscrewed through the custom-tray access opening. The impression was removed from the master model with open-tray transfer in it. Implant analogs were placed over the transfer copings and tightened with driver through the open end of the tray. Impression was poured in die stone. Ten impressions were made and ten casts were obtained [Figure 9].
Figure 9.
Cast obtained
In the second subgroup (Subgroup 1 splinted [S]), the impression copings were splinted to each other using prefabricated acrylic resin (Pattern resin, GC Corp.) bars [Figure 10]. Pattern resin was mixed and loaded into a disposable syringe. The resin was manipulated and injected as per manufacturer's recommendation into a drinking straw to form uniform size bars to be used as splinting material. Resin pattern was allowed to set for 24 h and sectioned to appropriate length with cutting disk to bridge spaces between the adjacent transfer copings. Then, the ends of resin bar were luted to the transfer copings with pattern resin using a brush-bead technique. Acrylic resin bars were fabricated 24 h before using them to reduce the polymerization shrinkage of resin.
Figure 10.
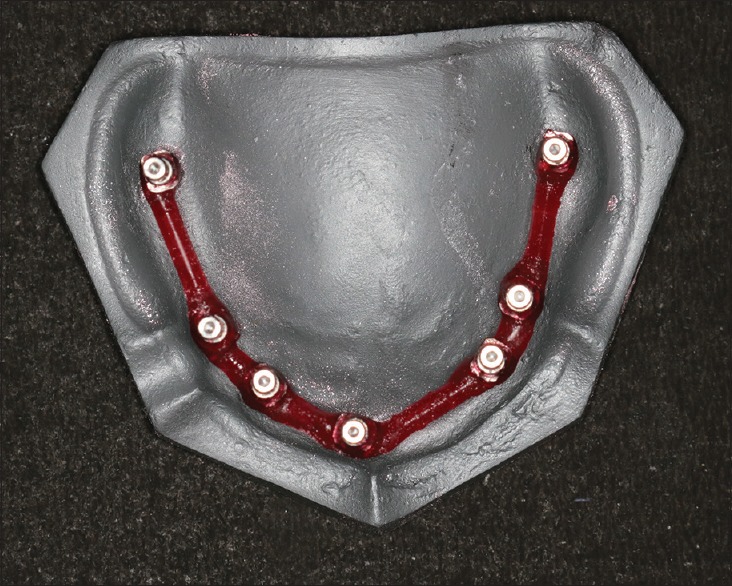
Splinting with prefabricated pattern resin bar
The objective of this technique is to minimize the effects of acrylic resin polymerization shrinkage and standardize dimensions of pattern resin bars by prefabricating acrylic resin bars and ease of intraoral application for splinting transfer copings. When a large volume of acrylic resin is used to splint transfer copings intraorally (using dental floss/threads), distortion may result from polymerization shrinkage. Intraoral splinting of transfer copings can be accomplished without need for excessive bulk of acrylic resin at the time of final impression minimizing the effects of polymerization shrinkage.
The tray was coated with a thin layer of tray adhesive and allowed to dry for 10 min. Impressions were made. Open-tray transfer copings were exposed through the open-tray access [Figure 11]. The impression material was allowed to set for 10 min. The open-tray transfer copings were then unscrewed through the custom tray access opening. The impression was removed from the master model with open-tray transfer copings in it. Implant analogs were placed over the transfer copings and tightened with driver through the open end of the tray. Impression was poured in die stone to obtain cast with the implant analogs in it. Ten impressions were made and ten casts were obtained.
Figure 11.
Screwed in impression copings with open tray for impression
In the third and fourth subgroups (Subgroup 2NS and Subgroup 2), the procedure of impression making was similar to Subgroup 2NS and Subgroup 2S, respectively, except that the model is having angulated implants. Ten impressions were made similarly and ten casts were obtained for each subgroup.
Measurement protocol
The 3D distance between the seven implant analogs were measured using CMM (ZEISS) [Figure 12]. CMM used was a mechanical probe with an accuracy of 0.001 mm and resistance to environmental influence. In all the subgroups, the base of the cast was taken as z-axis and used as reference plane to inculcate uniformity in measurements in three dimensions. Open-tray transfer copings were screwed over the implant analogs, and the center of the copings was used for measurements in x-axis and y-axis. The centroid of Point A lays at the origin (0, 0, 0).
Figure 12.
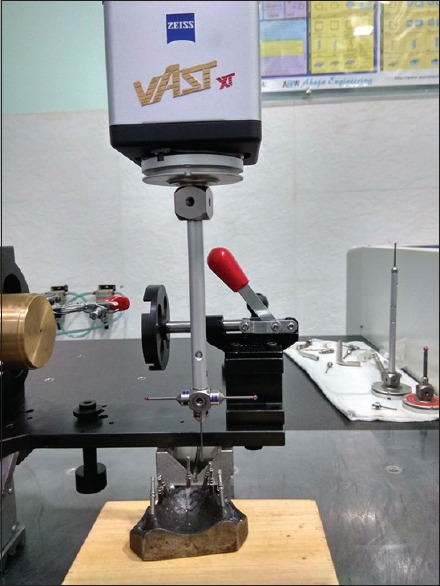
Transfer coping screwed in implant analog for interimplant distance measurement
The probe tip of the CMM possessing a diameter of 0.3 mm was directed along the circumference of each of the transfer copings. The coordinates of centroids and angles of tilt of impression copings were calculated. The angles of tilt of the impression copings were equal to the angles of tilt of analogs. The scanned configuration was then subjected to the mathematical analysis.
The 3D distance (x-axis, y-axis, and z-axis) measured were A–E, B–G, C–F, C–G, D–F, D–E, D–G, and A–F [Figure 13]. Various studies have been carried out using lesser number of implants (2 or 4). Very few studies have been performed with maximum number of implants. In this study, seven implants were used to simulate a clinical condition of severe atrophic edentulous maxilla requiring fixed implant-supported prosthesis. Hence, the maximum interimplant distances (A–E, B–G, C–F, D–F, D–E, D–G, and A–F) were made possible to ensure the better reliability in the results of the study resulting in making this study more clinically significant. All the measurements were recorded three times by the same operator, and the mean value was calculated.
Figure 13.
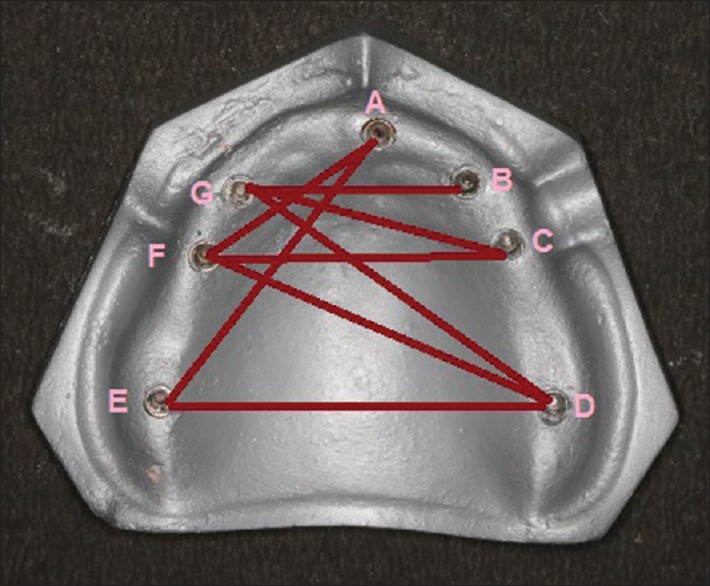
Interimplant distances measured
Statistical analysis
The measurements of the stone casts obtained with four impression techniques were compared with master model values, tabulated, and statistically analyzed using one-way ANOVA test (P < 0.001 considered as significant difference), post hoc Bonferroni test for the intergroup comparisons, and unpaired t-test for comparison of mean differences.
RESULTS
Table 1 and Graph 1 depicts the summarization of the mean difference and standard deviation of interimplant distances such as A–E, B–G, C–F, C–G, D–F, D–E, D–G, and A–F compared from control values on master models. A significant difference (P < 0.001) was found among the four subgroups. The mean difference was found to be maximum in angulated splinted group (Subgroup 2NS; 1.80, 1.48, 1.94, 1.54, 1.60, 1.45, 1.59, and 1.21), followed by angulated splinted (Subgroup 2S; 1.20, 1.06, 1.53, 1.13, 1.16, 1.05, 1.12, and 0.85), parallel nonsplinted (Subgroup 1NS; 0.70, 0.64, 0.94, 0.69, 0.68, 0.64, 0.59, and 0.51), and parallel splinted (Subgroup 1S; 0.16, 0.13, 0.31, 0.28, 0.24, 0.21, 0.12, and 0.16) groups.
Table 1.
Subgroup comparison of mean difference and standard deviation
| Interimplant distance | Mean difference and SD | Subgroup 1NS | Subgroup 1S | Subgroup 2NS | Subgroup 2S |
|---|---|---|---|---|---|
| A-E | Mean difference | 0.70 | 0.16 | 1.80 | 1.20 |
| SD | 0.39 | 0.27 | 0.32 | 0.22 | |
| B-G | Mean difference | 0.64 | 0.13 | 1.48 | 1.06 |
| SD | 0.36 | 0.40 | 0.56 | 0.23 | |
| C-F | Mean difference | 0.94 | 0.31 | 1.94 | 1.53 |
| SD | 0.43 | 0.30 | 0.29 | 0.39 | |
| C-G | Mean difference | 0.69 | 0.28 | 1.54 | 1.13 |
| SD | 0.37 | 0.39 | 0.36 | 0.27 | |
| D-F | Mean difference | 0.68 | 0.24 | 1.60 | 1.16 |
| SD | 0.35 | 0.44 | 0.58 | 0.36 | |
| D-E | Mean difference | 0.64 | 0.21 | 1.45 | 1.05 |
| SD | 0.11 | 0.18 | 0.18 | 0.34 | |
| D-G | Mean difference | 0.59 | 0.12 | 1.59 | 1.12 |
| SD | 0.14 | 0.21 | 0.37 | 0.25 | |
| A-F | Mean difference | 0.51 | 0.16 | 1.21 | 0.85 |
| SD | 0.14 | 0.57 | 0.25 | 0.37 |
SD: Standard deviation, S: Splinted, NS: Nonsplinted
Graph 1.
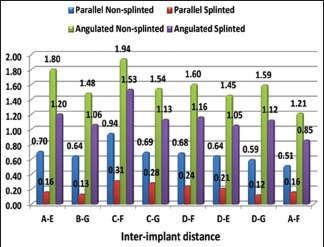
Intersubgroup comparison of mean difference
In Table 2 and Graph 2, the intragroup comparison of mean difference of interimplant distances such as A–E, B–G, C–F, C–G, D–F, D–E, D–G, and A–F among parallel splinted (Subgroup 1S) and parallel nonsplinted (Subgroup 1NS) groups was done using the unpaired t-test. The mean difference was found to be significantly more in parallel nonsplinted (Subgroup 1NS; 0.70, 0.64, 0.94, 0.69, 0.68, 0.64, 0.59, and 0.51) in comparison to parallel splinted (Subgroup 1S) groups.
Table 2.
Unpaired t-test for intragroup comparison between parallel nonsplinted (Subgroup 1 nonsplinted) and parallel splinted (Subgroup 1 splinted) groups
| Model with parallel implants | Group | Difference | t-test | P | |||
|---|---|---|---|---|---|---|---|
| Subgroup 1NS | Subgroup 1S | ||||||
| Mean difference | SD | Mean difference | SD | ||||
| A-E | 0.70 | 0.39 | 0.16 | 0.27 | 0.54 | 2.702 | 0.007* |
| B-G | 0.64 | 0.36 | 0.13 | 0.40 | 0.51 | 3.639 | <0.001* |
| C-F | 0.94 | 0.43 | 0.31 | 0.30 | 0.63 | 2.935 | 0.001* |
| C-G | 0.69 | 0.37 | 0.28 | 0.39 | 0.41 | 3.690 | <0.001* |
| D-F | 0.68 | 0.35 | 0.24 | 0.44 | 0.44 | 3.675 | <0.001* |
| D-E | 0.64 | 0.11 | 0.21 | 0.18 | 0.43 | 3.636 | <0.001* |
| D-G | 0.59 | 0.14 | 0.12 | 0.21 | 0.46 | 3.586 | <0.001* |
| A-F | 0.51 | 0.14 | 0.16 | 0.57 | 0.36 | 2.513 | 0.025* |
*Significant difference (P<0.05). SD: Standard deviation, S: Splinted, NS: Nonsplinted
Graph 2.
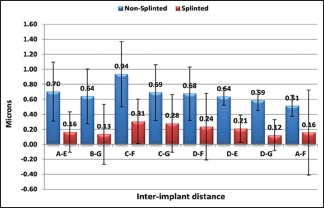
Intragroup comparison of mean difference with standard deviation between parallel nonsplinted (Subgroup 1NS) and parallel splinted (Subgroup 1S) groups
In Table 3 and Graph 3, intragroup comparison of mean difference of interimplant distances such as A–E, B–G, C–F, C–G, D–F, D–E, D–G, and A–F among angulated nonsplinted (Subgroup 2NS) and angulated splinted (Subgroup 2S) groups was done using the unpaired t-test. The mean difference was found to be significantly less in angulated splinted (Subgroup 2S; 1.20, 1.06, 1.53, 1.13, 1.16, 1.05, 1.12, and 0.85) in comparison to angulated nonsplinted (Subgroup 2NS; 1.80, 1.48, 1.94, 1.54, 1.60, 1.45, 1.59, and 1.21) groups.
Table 3.
Unpaired t-test for intragroup comparison between angulated nonsplinted (Subgroup 2 nonsplinted) and angulated splinted (Subgroup 2 splinted) groups
| Model with angulated implants | Group | Difference | t-test | P | |||
|---|---|---|---|---|---|---|---|
| Subgroup 1NS | Subgroup 1S | ||||||
| Mean difference | SD | Mean difference | SD | ||||
| A-E | 1.80 | 0.32 | 1.20 | 0.22 | 0.59 | 4.843 | 0.001* |
| B-G | 1.48 | 0.56 | 1.06 | 0.23 | 0.42 | 2.196 | 0.041* |
| C-F | 1.94 | 0.29 | 1.53 | 0.39 | 0.41 | 2.679 | 0.016* |
| C-G | 1.54 | 0.36 | 1.13 | 0.27 | 0.42 | 2.914 | 0.009* |
| D-F | 1.60 | 0.58 | 1.16 | 0.36 | 0.44 | 2.033 | 0.037* |
| D-E | 1.45 | 0.18 | 1.05 | 0.34 | 0.40 | 3.253 | 0.004* |
| D-G | 1.59 | 0.37 | 1.12 | 0.25 | 0.47 | 3.314 | 0.004* |
| A-F | 1.21 | 0.25 | 0.85 | 0.37 | 0.35 | 2.514 | 0.022* |
*Significant difference (P<0.05). SD: Standard deviation, S: Splinted, NS: Nonsplinted
Graph 3.
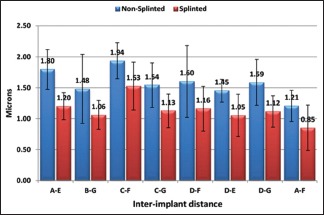
Intragroup comparison of mean difference with standard deviation between angulated nonsplinted (Subgroup 2NS) and angulated splinted (Subgroup 2S) groups
Table 4 and Graph 4, depicts the comparison of mean difference of interimplant distances such as A–E, B–G, C–F, C–G, D–F, D–E, D–G, and A–F among parallel splinted (Subgroup 1S) and angulated splinted (Subgroup 2S) groups using the unpaired t-test. It was evaluated that the mean difference was significantly less among parallel splinted (Subgroup 1S; 0.70, 0.64, 0.94, 0.69, 0.68, 0.64, 0.59, and 0.51) in comparison to angulated splinted (Subgroup 2S; 1.80, 1.48, 1.94, 1.54, 1.60, 1.45, 1.59, and 1.21) groups.
Table 4.
Unpaired t-test for intergroup comparison for splinted impression technique
| Inter implant distance | Subgroup 1S | Subgroup 2S | Mean difference | t-test | P | ||
|---|---|---|---|---|---|---|---|
| Mean difference | SD | Mean difference | SD | ||||
| A-E | 0.70 | 0.39 | 1.80 | 0.32 | −1.09 | −6.826 | <0.001* |
| B-G | 0.64 | 0.36 | 1.48 | 0.56 | −0.84 | −3.994 | 0.001 |
| C-F | 0.94 | 0.43 | 1.94 | 0.29 | −1.00 | −6.068 | <0.001* |
| C-G | 0.69 | 0.37 | 1.54 | 0.36 | −0.85 | −5.200 | <0.001* |
| D-F | 0.68 | 0.35 | 1.60 | 0.58 | −0.93 | −4.300 | <0.001* |
| D-E | 0.64 | 0.11 | 1.45 | 0.18 | −0.82 | −11.905 | <0.001* |
| D-G | 0.59 | 0.14 | 1.59 | 0.37 | −1.00 | −8.026 | <0.001* |
| A-F | 0.51 | 0.14 | 1.21 | 0.25 | −0.69 | −7.594 | <0.001* |
*Significant difference (P<0.05). SD: Standard deviation, S: Splinted
Graph 4.
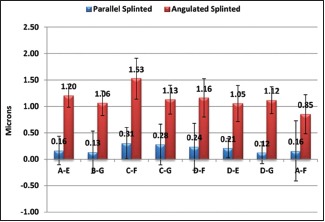
Comparison of mean difference with standard deviation for splinted impression technique
In Table 5 and Graph 5, the comparison of mean difference of interimplant distances such as A–E, B–G, C–F, C–G, D–F, D–E, D–G, and A–F among parallel nonsplinted (Subgroup 1NS) and angulated nonsplinted (Subgroup 2NS) groups was done using the unpaired t-test. The mean difference was found to be significantly less among parallel nonsplinted (Subgroup 1NS; 0.70, 0.64, 0.94, 0.69, 0.68, 0.64, 0.59, and 0.51) in comparison to angulated nonsplinted (Subgroup 2NS; 1.80, 1.48, 1.94, 1.54, 1.60, 1.45, 1.59, and 1.21) groups.
Table 5.
Unpaired t-test for intergroup comparison for nonsplinted impression technique
| Interimplant distance | Subgroup 1NS | Subgroup 2NS | Mean difference | t-test | P | ||
|---|---|---|---|---|---|---|---|
| Mean difference | SD | Mean difference | SD | ||||
| A-E | 0.70 | 0.39 | 1.80 | 0.32 | −1.09 | −6.826 | <0.001* |
| B-G | 0.64 | 0.36 | 1.48 | 0.56 | −0.84 | −3.994 | 0.001 |
| C-F | 0.94 | 0.43 | 1.94 | 0.29 | −1.00 | −6.068 | <0.001* |
| C-G | 0.69 | 0.37 | 1.54 | 0.36 | −0.85 | −5.200 | <0.001* |
| D-F | 0.68 | 0.35 | 1.60 | 0.58 | −0.93 | −4.300 | <0.001* |
| D-E | 0.64 | 0.11 | 1.45 | 0.18 | −0.82 | −11.905 | <0.001* |
| D-G | 0.59 | 0.14 | 1.59 | 0.37 | −1.00 | −8.026 | <0.001* |
| A-F | 0.51 | 0.14 | 1.21 | 0.25 | −0.69 | −7.594 | <0.001* |
*Significant difference (P<0.05). SD: Standard deviation, NS: Nonsplinted
Graph 5.
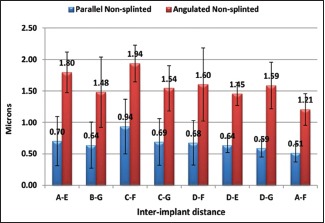
Comparison of mean difference with standard deviation for nonsplinted impression technique
DISCUSSION
The accuracy of implant cast is directly proportional to the impression technique which ultimately leads to passive fit implant prosthesis. There are various techniques that can be used for impression in multiple unit implant-supported prosthesis with advantages and disadvantages associated with each technique. The present study was conducted to compare the implant cast accuracy of angulated and parallel implants with splinted and nonsplinted impression technique.
In the context of the present investigation, two stainless steel master models were used with seven similar implant analogs drilled in it. According to Misch,[11] the minimum implant number for a completely edentulous maxillary fixed prosthesis is usually seven. Stainless steel models were selected to make impressions that prevent wear and tear of model while making multiple impressions. Forty casts were obtained from impressions of master models using splinted and nonsplinted impression technique. Each sample obtained was subjected to 3D (x-axis, y-axis, and z-axis) interimplant distance analysis. The results obtained were subjected to statistical analysis, and the means of the interimplant distances obtained were compared with those of stainless steel master model.
The present investigation showed that splinted technique with parallel implants generated interimplant distance values closest to the master model, thereby being the most accurate technique, followed by nonsplinted technique with parallel implants. The splinting resists the rotation and translation of the impression copings within an impression after detachment of implants from impression, followed by placement of implant analogs.
Results of the present research study totally agree with the work conducted by Assif et al.[12] and Tarib et al.[13] in which they suggested that the splinting of impression copings would be beneficial to obtain an accurate impression. However, it was found that more studies were in favor with the result of the present study.[14]
In the present study, splinted technique in angulated implants exhibited greater accuracy as compared to nonsplinted technique in parallel implants. This result was in accordance with the study conducted by Assuncao et al.[15] and Cabral and Guedes[16] that reported less accurate impressions with angulated implants than parallel implants with four or five implants in experimental cast. Similarly, Tsagkalidis et al.[17] also concluded that splinted impression technique exhibited a higher accuracy than the other techniques studied when increased implant angulations at 25° were involved.
Some studies did not show significant result in splinting and nonsplinting technique. According to the study by Lee et al.,[18] it was concluded that there was no significant difference in the accuracy between the unsplinted and splinted methods in pickup impression techniques. This study also had two implants in master model with 10° divergence angle. In clinical conditions, divergence between implants may often be >8°.
However, few studies reported in literature did not favor the result of this study and suggested nonsplinted technique. Inturregui et al.[19] suggested that nonsplinted technique was better than splinted technique. In this study, only two abutments were placed in the master model, and rigid fixation of impression transfer copings altered setting expansion of dental stone which ultimately resulted in distortion of interabutment relationship from the master cast. These studies concluded that the reason for variation in impression accuracy was not as a result of splinting technique.
In literature, various studies regarding role of splinting in impression making are present where only 2–4 implants were considered, but studies simulating clinical condition with multiple implants aimed at fixed implant-supported prosthesis are not present. As described by Misch,[11] seven implants were used in the present study depicting the placement of implants in clinical condition. Hence, the maximum interimplant distances (A–E, B–G, C–F, D–F, D–E, D–G, and A–F) were made possible to ensure the better reliability in the results of the study resulting in making this study more clinically significant. Angulations used in the present study also showed ideal and maximum angulations that are preferred in severe atrophic maxilla. Furthermore, distortion of the implant impressions was evaluated 3D with the highest possible resolution in small dimensions by CMM.
This study is limited by the following factors that temperature, humidity, moisture, and saliva in oral cavity could affect the setting of acrylic resin splinting. In addition, because of different extent of undercut or difference in anatomy, the force and path of impression tray removal were considered to be different from experimental studies. While interpreting implant impression accuracy, the machining tolerance was not considered as it is also an important factor affecting accuracy.[20] Comparisons between implant impressions with copings that can be digitally scanned intraorally and superimposed may provide the foundation for future research.
Therefore, the influence of the above-mentioned parameters should be considered in future research as they may affect the precision and passive fit of the prosthesis.
CONCLUSIONS
Within the limitations of study, it was concluded that:
The dimensional accuracy of casts obtained from splinted technique for parallel implants was greater than the splinted technique for angulated implants with interimplant distance values closer to implant master model
The dimensional accuracy of casts obtained from nonsplinted technique for parallel implants was greater than the nonsplinted technique for angulated implants with interimplant distance values closer to implant master model
The implant cast dimensional accuracy obtained from splinted technique was greater than the nonsplinted technique for parallel implants with interimplant distance values closer to implant master model
The dimensional accuracy of casts obtained from splinted technique was greater than the nonsplinted technique for angulated implants with interimplant distance values closer to implant master model
Within the limitations of this study, it was concluded that when seven or multiple parallels or nonparallel implants are used, the splinted technique could be recommended for ensuring accuracy and passive fit of implant-retained prosthesis. Parallel implants with splinted technique showed interimplant distance values closest to implant master model, and angulated implants with nonsplinted technique showed maximum deviation from the master model values.
The selection of technique is based on clinical situation as well as clinician's preference. There is no uniform consensus that describes the most accurate and most efficient impression technique; hence, further investigations are required in this field to decide the reliability of different impression techniques.
Financial support and sponsorship
This was a self-funded study.
Conflicts of interest
There are no conflicts of interest.
REFERENCES
- 1.Asawa N, Bulbule N, Kakade D, Shah R. Angulatedimplants: An alternative to bone augmentation and sinus liftprocedure: Systemic review. J Clinic Diag Res. 2015;9:10–3. doi: 10.7860/JCDR/2015/11368.5655. [DOI] [PMC free article] [PubMed] [Google Scholar]
- 2.Patel MP, Anilkumar S, Chaukramath R, Gopalkrishnan S. Rehabilitation of edentulous maxillary arch with implant- assisted fixed complete prosthesis using multi- unit straight and angulated abutments. Eur J Prosthodont. 2016;4:37–40. [Google Scholar]
- 3.Oltra DP, Marti EC, Ali JA, Diago MP. Rehabilitation of the atrophic maxilla with tilted implants: Review of literature. J Oral Implantol. 2013;39:625–32. doi: 10.1563/AAID-JOI-D-11-00068. [DOI] [PubMed] [Google Scholar]
- 4.Aparicio C, Perales P, Rangert B. Tilted implants as an alternative to maxillary sinus grafting: A clinical, radiologic, and periotest study. Clin Implant Dent Relat Res. 2001;3:39–49. doi: 10.1111/j.1708-8208.2001.tb00127.x. [DOI] [PubMed] [Google Scholar]
- 5.Selvaraj S, Dorairaj J, Mohan J, Simon P. Comparison of implant cast accuracy of multiple implant impression technique with different splinting materials: An in vitro study. J Indian Prosthodont Soc. 2016;16:167–75. doi: 10.4103/0972-4052.167937. [DOI] [PMC free article] [PubMed] [Google Scholar]
- 6.Sorrentino R, Gherlone EF, Calesini G, Zarone F. Effect of implant angulation, connection length, and impression material on the dimensional accuracy of implant impressions: An in vitro comparative study. Clin Implant Dent Relat Res. 2010;12(Suppl 1):e63–76. doi: 10.1111/j.1708-8208.2009.00167.x. [DOI] [PubMed] [Google Scholar]
- 7.Prakash S, Chowdhary R. Impression techniques and impression materials in dental implant supported restorations: A systemic review. Int J Recent Sci Res. 2016;7:10285–95. [Google Scholar]
- 8.Baig MR. Multi-unit implant impression accuracy: A review of the literature. Quintessence Int. 2014;45:39–51. doi: 10.3290/j.qi.a30769. [DOI] [PubMed] [Google Scholar]
- 9.Wee AG. Comparison of impression materials for direct multi-implant impressions. J Prosthet Dent. 2000;83:323–31. doi: 10.1016/s0022-3913(00)70136-3. [DOI] [PubMed] [Google Scholar]
- 10.Balouch F, Jalalian E, Nikkheslat M, Ghavamian R, Toopchi Sh, Jallalian F, et al. Comparison of dimensional accuracy between open-tray and closed-tray implant impression technique in 15 angled implants. J Dent (Shiraz) 2013;14:96–102. [PMC free article] [PubMed] [Google Scholar]
- 11.Misch CE. 1st ed. USA: Mosby Publication; 2005. Dental Implant Prosthetics; pp. 285–90. [Google Scholar]
- 12.Assif D, Marshak B, Nissan J. A modified impression technique for implant- supported restoration. J Prosthet Dent. 1994;71:589–91. doi: 10.1016/0022-3913(94)90442-1. [DOI] [PubMed] [Google Scholar]
- 13.Tarib NA, Seong TW, Chuen KM, Kun MS, Ahmad M, Kamarudin KH, et al. Evaluation of splinting implant impression techniques: Two dimensional analyses. Eur J Prosthodont Restor Dent. 2012;20:35–9. [PubMed] [Google Scholar]
- 14.Buzayan MM, Yunus NB. Passive fit in screw retained multi-unit implant prosthesis understanding and achieving: a review of the literature. J Indian Prosthodont Soc. 2014;14:16–23. doi: 10.1007/s13191-013-0343-x. [DOI] [PMC free article] [PubMed] [Google Scholar]
- 15.Assuncao WG, Filho HG, Zaniquelli O. Evaluation of transfer impressions for osseointegrated implants at various angulations. Implant Dent. 2004;13:358–66. doi: 10.1097/01.id.0000144509.58901.f7. [DOI] [PubMed] [Google Scholar]
- 16.Cabral LM, Guedes CG. Comparative analysis of 4 impression techniques for implants. Implant Dent. 2007;16:187–94. doi: 10.1097/ID.0b013e3180587b3f. [DOI] [PubMed] [Google Scholar]
- 17.Tsagkalidis G, Tortopidis D, Mpikos P, Kaisarlis G, Koidis P. Accuracy of three different impression techniques for internal connection angulated implants. J Prosthet Dent. 2015:1–7. doi: 10.1016/j.prosdent.2015.05.005. [DOI] [PubMed] [Google Scholar]
- 18.Lee H, So JS, Hochstedler JL, Ercoli C. The accuracy of implant impressions: A systematic review. J Prosthet Dent. 2008;100:285–91. doi: 10.1016/S0022-3913(08)60208-5. [DOI] [PubMed] [Google Scholar]
- 19.Inturregui JA, Aquilino SA, Ryther JS, Lund PS. Evaluation of three impression techniques for osseointegrated oral implants. J Prosthet Dent. 1993;69:503–9. doi: 10.1016/0022-3913(93)90160-p. [DOI] [PubMed] [Google Scholar]
- 20.Ma T, Nichollas JI, Rubenstein JE. Tolerance measurements of various implant components. Int J Oral Maxillofac Implants. 1997;12:371–5. [PubMed] [Google Scholar]