

Abstract
Background:
One key barrier to proper management of common cardio-metabolic conditions such as diabetes and hypertension in primary care is inadequate adherence to treatment, which, in many cases, results from inadequate follow-up at scheduled appointments. In addition to provider and health system level factors, individual patient level factors are also associated with attendance at follow-up appointments.
Objective:
To document the association of diabetic, hypertensive diabetic, and hypertensive patient's demographic and clinical factors with showing up inadequately at scheduled appointments.
Methods:
A record-based retrospective follow-up study was conducted in an urban primary health center of Puducherry from January to March 2015. Registered diabetic, hypertensive diabetic, and hypertensive patients who made at least one visit between July and December 2014 were included. Data on demographic factors, clinical factors, and dates of visits to the clinic were collected from case records of patients and were entered in EpiData entry version 3.1. Analysis was performed using R statistical package.
Results:
Out of 366 patients, 79% were females and 70.2% were aged >50 years. It was found that 183 (50%) were diabetic, 266 (72.7%) were hypertensive, and 115 (31.4%) were hypertensive diabetic. Out of 366 patients, all the five follow-up visits were attended by 185 (50.6%) patients, and “adequate follow-up” was found in 123 (33.6%) patients. Young, underweight, and obese patients were more likely to have inadequate follow-up.
Conclusion:
Family physicians should give special attention to these groups in their routine practice along with providing targeted health education and implementing full proof mechanisms to track them.
Keywords: Diabetes, factors, hypertension, missed appointments, primary care
Introduction
Non-communicable diseases (NCD) are the leading cause of adult morbidity and mortality worldwide.[1] Globally, among all NCDs, diabetes, hypertensive heart disease, ischemic heart disease, and stroke account for 2.4%, 0.7%, 7.3%, and 4.9% of the total disability-adjusted life years (DALYs), respectively. For India, the above-mentioned figures are 2.2%, 0.6%, 8.7%, and 3.5%, respectively.[2] Common cardio-metabolic conditions such as diabetes, hypertension, co-existing diabetes, and hypertension increase the risk of heart disease and stroke by several folds. It has been projected that the mortality due to NCDs will increase to 44 million deaths by 2020.[3] It is quite clear that tackling NCDs is going to be a huge challenge for India's existing health system, particularly for family physicians and primary care practitioners, who are the backbone of the health system. The National Programme for Prevention and Control of Cancer, Diabetes, Cardiovascular Diseases and Stroke (NPCDCS) initiated in 2010 stresses on management of NCDs through early diagnosis, treatment, and follow-up through NCD clinics.[3] Under the NPCDCS, NCD clinics are being implemented across the country in the primary health care system. As per the reports received from the states till 2016–2017, around 22.4 million persons attended NCD clinics.[3]
One of the key challenges in the management of common NCDs is the lack of adequate adherence to follow-up and treatment because of the chronic nature of the disease and the need for long-term medications.[4,5,6] In NCD clinics functioning in public primary care settings, where drugs are provided free of cost; missed appointments lead to sub-optimal disease control, thereby, defeating one of the most important purposes of providing free drugs. Missed appointments have been reported to be a global challenge to the healthcare providers across different types of diseases.[4,7] Adherence to subsequent visits are used as a marker for overall medical adherence despite lack of clear evidence.[8,9,10] One missed appointment further increases the frequency of missing subsequent visits, thereby increasing the risk of hospitalization and emergencies.[11] It was also found that non-adherence to follow-up causes staff dissatisfaction, inadequate use of available resources, and suboptimal health outcomes,[7] poor control of chronic illness, reduced clinic efficiency, and mortality.[8] This issue of missed appointments and irregular follow-up has much bigger implications on low and middle income countries including India, where the health system is already overburdened.
It has been evident from various studies that patient characteristics combined with contextual factors have a potential effect on clinical outcomes.[4,11] Individual characteristics such as age, socio-economic status, race, education, occupation, distance from primary health care facilities,[4,5,7,11] history of other chronic conditions,[4] prior history of missing follow-ups,[11] poor knowledge about the disease concerned, exposure to side effect of medications, and lack of reminders[5,8] are found to be associated with non-adherence to follow-up. However, to the best of our knowledge, we could not find a study in India which had used routinely maintained data to document patient level demographic and clinical characteristics among patients attending any NCD clinic in a primary care context and explore which of these are the factors associated with missed appointments. Thus, the present study was contemplated to document the association of demographic and clinical factors of patients with showing up inadequately at scheduled appointments among diabetic, hypertensive diabetic, and hypertensive patients.
Methods
The present study was conducted in an urban publicly funded primary health center of Puducherry. This health center caters to an urban population of about 9,500 residing in four urban wards of Puducherry. This center runs a weekly NCD clinic on Wednesdays between 2:00 pm and 4:30 pm, apart from general outpatient clinics in the morning and weekly special clinics such as antenatal check-up clinic and a clinic for under-five children. Apart from physicians, the care providing team consists of a staff nurse, a laboratory technician, a pharmacist, and an attendant. Paper based case file records are maintained at the health center. The outpatient department (OPD) card is made at negligible cost. and all the investigations and drugs are provided free of cost. Thus, out-of-pocket expenditure of patients is almost nil.
As a usual practice of the center, the total number of diabetic, diabetic hypertensive, and hypertensive patients registered in the NCD clinic at one point of time is divided into four batches of roughly equal number of patients i.e., A, B, C, and D. Patients are given scheduled appointment dates for subsequent follow-up visit after 4 weeks. Those who missed the scheduled appointment were, however, not denied care, if they turned up in the NCD clinic before or after the date of scheduled appointment.
The present study was a record-based retrospective follow-up study. Data were collected during January 2015 to March 2015. Data from paper-based, routinely maintained, case files of patients were entered in an electronic format in EpiData entry version 3.1 by trained medical interns. The EpiData entry form was designed by a researcher (AM) who had experience in designing EpiData entry forms. AM trained medical interns in data entry into EpiData. Variables entered from case sheets were name, age, gender, religion, occupation, income, diagnosis for which registered in the NCD clinic (diabetes, hypertension), date of clinic visits, measured height, weight and body mass index (BMI), fasting blood sugar (FBS), post prandial blood sugar (PPBS), serum triglyceride (TG), serum total cholesterol (TC) serum low-density lipoprotein (LDL) cholesterol and high density lipoprotein (HDL) cholesterol. We operationally defined the date of first visit within the study period i.e., 1st July 2014 to 31st December 2014 as the baseline visit. Data on the most recent values of FBS, PPBS, serum TG, TC, LDL, and HDL cholesterol with respect to the baseline visit, which were available in the case files of patients were collected.
For the purpose of analysis, BMI was classified as underweight (<18.5 kg/m2), normal weight (18.5–25 kg/m2), overweight (25–30 kg/m2), and obese (>30 kg/m2).[12] Total cholesterol levels were classified as desirable (<200 mg/dl), borderline high (200–239 mg/dl), and high (≥240 mg/dl).[13] LDL cholesterol was classified as desirable (<130 mg/dl), borderline high (130–59 mg/dl), and high (≥160 mg/dl).[13] Serum triglyceride was classified as normal (<150 mg/dl), borderline high (150–199 mg/dl), and high (≥200 mg/dl).[13] Similarly, low HDL cholesterol level was defined as levels <40 mg/dl.[13] FBS was classified as high if the FBS was ≥110 mg/dl, and PPBS was classified as high if PPBS was ≥180 mg/dl.[14] We operationally defined “timely follow-up visits” as visits attended in an acceptable time limit (i.e., within ± 7 days of scheduled appointment). “Adequate follow-up” was operationally defined as the attendance at all the five scheduled follow-up appointments after the baseline visit, with at least four of them being “timely follow-up visits.” We also conducted a separate analysis based only on whether attendance at all five visits were made or not (without considering whether “timely follow-up visits” were made or not).
Data were exported from EpiData entry to Microsoft Excel 2007, and analysis was performed using R statistical package.[15] Proportions were calculated for categorical variables, and means and medians were calculated, along with standard deviation (SD) and inter-quartile range (IQR), respectively. The Chi-square test was used to compare proportions among groups. The P value <0·05 was considered to be significant. Because of the issue of missing data, we did not use logistic regression analysis.
Results
A total of 366 patients were included in the study. Among them, 77 (21%) were males and 289 (79%) were females. The mean (SD) age of the patients was 56.4 ± 11.5 years, the mean (SD) age of males being 57.4 ± 12.7 years, and that of females being 56.1 ± 11.2 years. Majority of the patients i.e., 292 (79.8%) were Hindu by religion. Most patients i.e., 270 (73.8%) were either homemakers or were unemployed. The characteristics of the patients as per the baseline visit are described in Table 1. It was found that of the 366 patients, 183 (50%) were diabetic and 266 (72.7%) were hypertensive. In addition, 115 (31.4%) of the patients had co-existing diabetes and hypertension. The mean (SD) BMI was found to be 28.3 ± 6.3 kg/m2. The mean (SD) TG level was 189.7 ± 44.1 mg/dl, whereas that of LDL and HDL cholesterol was 119.0 ± 41.2 mg/dl and 44.6 ± 11.5 mg/dl, respectively. The mean (SD) FBS and PPBS were 131.2 ± 51.6 mg/dl and 205.2 ± 85.1 mg/dl, respectively. Table 2 provides a comparison of demographic and clinical characteristics of diabetic, hypertensive, and hypertensive diabetic patients.
Table 1.
Socio-demographic and clinical characteristics of patients registered at a NCD clinic of an urban primary health center of Puducherry, July-December, 2014 (n=366)
| Characteristic | Category | n (%) |
|---|---|---|
| Age | <30 | 4 (1.1%) |
| 30-49 | 105 (28.7%) | |
| 50-69 | 198 (54.1%) | |
| ≥70 | 59 (16.1%) | |
| Gender | Male | 77 (21.0%) |
| Female | 289 (79.0%) | |
| Religion | Hindu | 292 (79.8%) |
| Christian | 71 (19.4%) | |
| Muslim | 03 (0.8%) | |
| Occupation | Unemployed/Homemaker | 270 (73.8%) |
| Unskilled | 62 (16.9%) | |
| Semi-skilled | 23 (6.3%) | |
| Skilled | 11 (3.0%) | |
| BMI (kg/m2)& | Underweight | 13 (4.3%) |
| Normal | 111 (36.6%) | |
| Overweight | 112 (37.0%) | |
| Obese | 67 (22.1%) | |
| FBS (mg/dl)* | Normal | 113 (46.1%) |
| High | 132 (53.9%) | |
| PPBS (mg/dl)* | Normal | 208 (84.9%) |
| High | 37 (15.1%) | |
| Total cholesterol (mg/dl)^ | Desirable | 161 (59.9%) |
| Borderline high | 73 (27.1%) | |
| High | 35 (13.0%) | |
| LDL cholestero (mg/dl)^ | Desirable | 166 (61.7%) |
| Borderline high | 58 (21.6%) | |
| High | 45 (16.7%) | |
| HDL cholesterol (mg/dl)^ | Low | 169 (62.8%) |
| Normal | 100 (37.2%) | |
| Triglyceride (mg/dl) | Normal | 188 (69.2%) |
| Borderline high | 42 (15.6%) | |
| High | 40 (14.8%) | |
| Diagnosed conditions# | Diabetes present | 183 (50.0%) |
| Diabetes absent | 183 (50.0%) | |
| Hypertension present | 266 (72.7%) | |
| Hypertension absent | 100 (27.3%) | |
| Co-existing diabetes and hypertension | Present | 115 (31.4%) |
| Absent | 251 (68.6%) |
&For this variable, n=303; data of 63 patients missing. *For these variables, n=245; data of 121 patients missing. ^For these variables, n=269; data of 97 patients missing. #n≠366 here as many (115 patients) have co-existing diabetes and hypertension
Table 2.
Comparison of characteristics of patients with only diabetes, only hypertension, and co-existing diabetes and hypertension registered at a NCD clinic of an urban primary health centre of Puducherry, July-December, 2014
| Characteristic | Categories | Patients with diabetes (n=183) | Patients with hypertension (n=266) | Patients with co-existing diabetes and hypertension (n=115) |
|---|---|---|---|---|
| Age | Mean (SD) | 56.4 (10.4) | 58.3 (10.2) | 58.4 (9.9) |
| <30 | 13 (7.1) | 10 (3.7) | 03 (2.6) | |
| 30-49 | 113 (61.7) | 151 (56.8) | 67 (58.3) | |
| 50-69 | 55 (30.1) | 104 (39.1) | 44 (38.3) | |
| ≥70 | 02 (1.1) | 01 (0.4) | 01 (0.8) | |
| Gender | Male | 39 (21.3) | 55 (20.7) | 24 (20.9) |
| Female | 144 (78.7) | 211 (79.3) | 91 (79.1) | |
| Religion | Hindu | 143 (78.1) | 216 (81.2) | 91 (79.1) |
| Christian | 39 (21.3) | 48 (18.0) | 24 (20.9) | |
| Muslim | 01 (0.5) | 02 (0.8) | 0 (0.0) | |
| Occupation | Unemployed/Homemaker | 140 (76.5) | 196 (73.7) | 89 (77.4) |
| Unskilled | 25 (13.7) | 43 (16.2) | 13 (11.3) | |
| Semi-skilled | 11 (6.0) | 18 (6.8) | 08 (7.0) | |
| Skilled | 07 (3.8) | 09 (3.3) | 05 (4.3) | |
| BMI (kg/m2) | Mean (SD) | 27.2 (8.0) | 29.2 (26.4) | 28.1 (9.3) |
| Underweight | 54 (29.8) | 08 (3.5) | 02 (2.0) | |
| Normal | 62 (34.3) | 81 (3.6) | 30 (31.3) | |
| Overweight | 28 (15.5) | 86 (37.7) | 43 (44.8) | |
| Obese | 37 (20.4) | 53 (23.2) | 21 (21.9) | |
| FBS (mg/dl) | Mean (SD) | 150.0 (57.6) | 124.0 (44.0) | 143.0 (51.9) |
| Normal | 44 (29.5) | 96 (51.9) | 31 (33.0) | |
| High | 105 (70.5) | 89 (48.1) | 63 (67.0) | |
| PPBS (mg/dl) | Mean (SD) | 229.0 (85.1) | 190.0 (75.3) | 220.0 (79.4) |
| Normal | 112 (75.2) | 64 (75.3) | 73 (77.7) | |
| High | 37 (24.8) | 21 (24.7) | 21 (22.3) | |
| Total cholesterol (mg/dl) | Mean (SD) | 185.0 (43.5) | 193.0 (43.8) | 190.0 (42.1) |
| Desirable | 91 (65.0) | 122 (57.0) | 56 (61.5) | |
| Borderline high | 30 (21.4) | 64 (29.9) | 22 (24.2) | |
| High | 19 (13.6) | 28 (13.1) | 13 (14.3) | |
| LDL cholesterol (mg/dl) | Mean (SD) | 113.0 (37.3) | 122.0 (41.1) | 116.0 (35.7) |
| Desirable | 96 (68.6) | 125 (58.4) | 59 (64.8) | |
| Borderline high | 25 (17.8) | 52 (24.3) | 20 (22.0) | |
| High | 19 (13.6) | 37 (17.3) | 12 (13.2) | |
| HDL cholesterol (mg/dl) | Mean (SD) | 43.6 (11.0) | 46.1 (11.7) | 46.3 (11.4) |
| Normal | 82 (58.6) | 145 (67.8) | 61 (67.0) | |
| Low | 58 (41.4) | 69 (32.2) | 30 (33.0) | |
| Triglyceride (mg/dl) | Mean (SD) | 148 (72.2) | 129 (64.1) | 146 (76.2) |
| Normal | 86 (61.4) | 156 (72.6) | 58 (63.7) | |
| Borderline high | 25 (17.9) | 31 (14.4) | 15 (16.5) | |
| High | 29 (20.7) | 28 (13.0) | 18 (19.8) |
The median days for the first follow-up visit was 24 (IQR 14), whereas the median for the subsequent visits i.e., second, third, fourth, and fifth was 28 days. The total number of visits (including one baseline visit and five follow-up visits) of 366 patients during the study period was 1,853. Seven patients out of 366 did not turn up at any of the scheduled follow-up appointments. Out of the 366 patients, the first follow-up visit was attended by 358 patients (97.8%), second by 343 (93.7%), third by 326 (89.1%), fourth by 275 (75.1%), and the fifth by 185 (50.6%). Out of these, 207/358 (57.8%), 266/343 (77.6%), 262/326 (80.4%), 217/275 (78.9%), and 155/185 (83.8%) were “timely follow-up visits” made during the first, second, third, fourth, and fifth follow-up visits, respectively [Figure 1].
Figure 1.
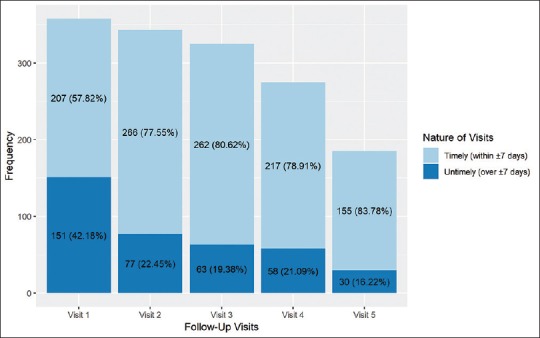
Proportions of “timely follow-up visits” made at scheduled appointments by patients registered at a NCD clinic of an urban primary health center of Puducherry, July–December, 2014 (N = 366)
Out of total 366, “adequate follow-up” was found in 123 (33.6%) patients. Table 3 shows the association between various demographic and clinical characteristics and “adequate follow-up visits.” It was found that age was associated with adequacy of follow-up visits, and that individuals with younger age were more likely to have inadequate follow-up visits as compared to those who were older. Similarly, BMI was also found to be associated. Those having extremes of BMI i.e., underweight and obese were more likely to have inadequate follow-up as compared to normal weight and overweight individuals. Table 4 shows the association between attendance at all five follow-up visits without considering whether visits were “timely follow-up visits” or not. It was found that BMI was the only factor that was significantly associated with attendance at all five follow-up visits in this analysis.
Table 3.
Factors associated with “adequate follow-up”# by patients registered at a NCD clinic of an urban primary health center of Puducherry, July-December, 2014 (n=366)
| Characteristic | Category | Follow-up, n (%) | P | ||
|---|---|---|---|---|---|
| Adequate | Inadequate | Total | |||
| Age | <30 | 01 (25.0) | 03 (75.0) | 04 | 0.047* |
| 30-49 | 24 (22.9) | 81 (77.1) | 105 | ||
| 50-69 | 75 (37.9) | 123 (62.1) | 198 | ||
| ≥70 | 23 (39.0) | 36 (61.0) | 59 | ||
| Gender | Male | 24 (31.2) | 53 (68.8) | 77 | 0.709 |
| Female | 99 (34.3) | 190 (65.7) | 289 | ||
| Religion | Hindu | 104 (35.6) | 188 (64.4) | 292 | 0.171 |
| Christian | 19 (26.8) | 52 (73.2) | 71 | ||
| Muslim | 0 (0.0) | 03 (100.0) | 03 | ||
| Occupation | Unemployed/Homemaker | 90 (33.3) | 180 (66.6) | 270 | 0.952 |
| Employed | 63 (65.6) | 33 (34.4) | 96 | ||
| BMI (kg/m2)& | Underweight | 3 (23.1) | 10 (76.9) | 13 | 0.001* |
| Normal | 44 (39.6) | 67 (60.4) | 111 | ||
| Overweight | 55 (49.1) | 57 (50.9) | 112 | ||
| Obese | 14 (20.9) | 53 (79.1) | 67 | ||
| Diabetes | Present | 57 (31.1) | 126 (68.9) | 183 | 0.376 |
| Absent | 66 (36.1) | 117 (63.9) | 183 | ||
| Hypertension | Present | 92 (34.6) | 174 (65.4) | 266 | 0.517 |
| Absent | 31 (31.0) | 69 (69.0) | 100 | ||
| Diabetes with Hypertension@ | Present | 46 (40.0) | 69 (60.0) | 115 | |
| Absent | 77 (30.7) | 174 (69.3) | 251 | ||
| FBS (mg/dl)^ | Normal | 50 (44.2) | 63 (55.8) | 113 | 0.374 |
| High | 51 (38.6) | 81 (61.4) | 132 | ||
| PPBS (mg/dl)^ | Normal | 88 (42.3) | 120 (57.7) | 208 | 0.414 |
| High | 13 (35.1) | 24 (64.9) | 37 | ||
| Total cholesterol (mg/dl)$ | Normal | 90 (55.9) | 71 (44.1) | 161 | 0.860 |
| Borderline high | 38 (52.1) | 35 (47.9) | 73 | ||
| High | 19 (54.3) | 16 (45.7) | 35 | ||
| LDL cholesterol (mg/dl)$ | Normal | 66 (39.8) | 100 (60.2) | 166 | 0.727 |
| Borderline | 20 (34.5) | 38 (65.5) | 58 | ||
| High | 16 (35.6) | 29 (64.4) | 45 | ||
| HDL cholesterol (mg/dl)$ | Normal | 60 (35.5) | 109 (64.5) | 169 | 0.289 |
| Low | 42 (42.0) | 58 (58.0) | 100 | ||
| Triglyceride (mg/dl) | Normal | 110 (58.5) | 78 (41.5) | 188 | 0.024 |
| Borderline high | 24 (57.1) | 18 (42.9) | 42 | ||
| High | 14 (35.0) | 26 (65.0) | 40 | ||
#Attendance at all five scheduled follow-up visits with at least four “timely follow-up visits” i.e.,, within ± 7 days of the scheduled visits. *Statistically significant (P<0.05). &For BMI, N=303; data of 63 patients missing. @n≠366 here as many (115 patients) have co-existing diabetes and hypertension. ^For these variables, n=245; data of 121 patients missing. $For these variables, n=269; data of 97 patients missing
Table 4.
Factors associated with attendance at all five follow-up visits# of patients registered at a NCD clinic of an urban primary health center of Puducherry, July-December, 2014 (n=366)
| Characteristic | Category | Attendance at all five follow-up visits, n (%) | P | ||
|---|---|---|---|---|---|
| Yes | No | Total | |||
| Age | <30 | 02 (50.0) | 02 (50.0) | 04 | 0.211 |
| 30-49 | 46 (43.8) | 59 (56.2) | 105 | ||
| 50-69 | 101 (51.0) | 97 (49.0) | 198 | ||
| ≥70 | 36 (61.0) | 23 (39.0) | 59 | ||
| Gender | Male | 34 (44.2) | 43 (55.8) | 77 | 0.207 |
| Female | 151 (52.2) | 138 (47.8) | 289 | ||
| Religion | Hindu | 151 (51.7) | 141 (48.3) | 292 | 0.180 |
| Christian | 34 (47.9) | 37 (52.1) | 71 | ||
| Muslim | 0 (0.0) | 03 (100.0) | 03 | ||
| Occupation | Unemployed/Homemaker | 134 (49.6) | 136 (50.4) | 270 | 0.556 |
| Employed | 51 (53.1) | 45 (46.9) | 96 | ||
| BMI (kg/m2)& | Underweight | 04 (30.8) | 09 (69.2) | 13 | 0.005* |
| Normal | 59 (53.2) | 52 (46.8) | 111 | ||
| Overweight | 76 (67.9) | 36 (32.1) | 112 | ||
| Obese | 31 (46.3) | 36 (53.7) | 67 | ||
| Diabetes | Present | 98 (53.6) | 85 (46.4) | 183 | 0.250 |
| Absent | 87 (47.5) | 96 (52.4) | 183 | ||
| Hypertension | Present | 136 (51.1) | 130 (48.9) | 266 | 0.717 |
| Absent | 49 (49.0) | 51 (51.0) | 100 | ||
| Diabetes with Hypertension@ | Present | 66 (57.4) | 49 (42.6) | 115 | 0.076 |
| Absent | 119 (47.4) | 132 (52.6) | 251 | ||
| FBS (mg/dl)^ | Normal (<110) | 74 (56.0) | 58 (44.0) | 132 | 0.099 |
| High (≥110) | 75 (66.4) | 38 (33.6) | 113 | ||
| PPBS (mg/dl)^ | Normal (<180) | 128 (61.5) | 80 (38.5) | 208 | 0.583 |
| High (≥180) | 21 (56.8) | 16 (43.2) | 37 | ||
| Total cholesterol (mg/dl)$ | Normal (<200) | 62 (38.5) | 99 (61.5) | 161 | 0.782 |
| Borderline High (≥200-<240) | 25 (34.2) | 48 (65.8) | 73 | ||
| High (≥240) | 19 (54.3) | 16 (45.7) | 35 | ||
| LDL cholesterol (mg/dl)$ | Normal (<130) | 92 (55.4) | 74 (44.6) | 166 | 0.969 |
| Borderline(≥130-<160) | 32 (55.2) | 26 (44.8) | 58 | ||
| High (≥160) | 24 (53.3) | 21 (46.7) | 45 | ||
| HDL cholesterol (mg/dl)$ | Normal (≥40) | 91 (53.8) | 78 (46.2) | 169 | 0.615 |
| Low (<40) | 57 (57.0) | 43 (43.0) | 100 | ||
| Triglyceride (mg/dl) | Normal | 75 (39.9) | 113 (60.1) | 188 | 0.195 |
| Borderline high | 17 (40.5) | 25 (59.5) | 42 | ||
| High | 10 (25.0) | 30 (75.0) | 40 | ||
#Attendance at all five scheduled follow-up visits but without considering whether the visits were “timely follow-up visits” or not. * Statistically significant (P<0.05). & For BMI, n=303; data of 63 patients missing. @n≠366 here as many (115 patients) have co-existing diabetes and hypertension. ^For these variables, n=245; data of 121 patients missing. $For these variables, n=269; data of 97 patients missing
Discussion
In our study, 79% of the patients were females. In a record based study conducted in primary care NCD clinics of South Africa and in cardiology and endocrinology clinics of a tertiary care hospital in Nigeria, similar findings were reported, where the majority of patients were females i.e., around 74.2% and 60%, respectively.[4,5] In addition, in our study, less than 30% of the patients were aged less than 50 years of age. This was slightly higher than the study conducted at Nigeria who reported that only 14.7% hypertensive, and 23% diabetic patients were aged 50 years or less.[5] The low registration of males and younger population in the NCD clinic in our study can be attributed to the day timings of the clinic, when most males and younger population is out for work. Lower registration of younger patients also points toward the lower prevalence of diabetes and hypertension in this age group.
In the study done in South Africa,[4] 34% of patients had diabetes, 73% had hypertension, and another 34% had co-existing diabetes and hypertension. In our study, very similar figures were seen for hypertension and co-existing diabetes and hypertension, but diabetes was seen in much higher proportions i.e., in 50% of patients. The reason for higher number of diabetes patients registered could be because of difference in the prevalence of diabetes among the general population between the two countries, or other factors such as medication and healthcare providers’ availability, clinical profile, and status of diabetes complications among patients, and patients’ knowledge, beliefs, and preferences regarding visit to the concerned NCD clinics.
The proportion of overweight and obese patients among registered patients in our study was high. This was matching with a previous study conducted in similar settings but in a rural population.[16] Similarly, in a study conducted in Turkey on diabetes patients[17] and in a study conducted in Bangladesh on hypertensive patients,[18] it was reported that the mean (SD) BMI of the patients were 28.6 (3.3) kg/m2 and 25.9 (3.39) kg/m2, respectively. In our study, lipid profile was found to be deranged in about 40–60% patients which was similar to the results of the studies previously conducted in Turkey and Bangladesh.[17,18,19] In a study, conducted in Turkey among diabetic patients, it was found that almost all the diabetic patients had uncontrolled diabetes (range 109-339 mg/dl), which was around 54% in our study.[17]
In the present study, with increase in the number of follow-up visits after the baseline visit, there was a gradual decline in attendance to the scheduled visits. In addition, the proportion of inadequate follow-up was significantly higher among younger patients, underweight, and obese patients. In a study at Ethiopia out of all diabetes patients registered in an NCD weekly clinic in primary care settings, approximately 25% patients did not turn up for follow-up appointments,[20] and in a Bangladesh study report, there were 16.7% of hypertensive and 13.0% of diabetic patients who missed >30% of scheduled medical appointments.[18] In one study, younger adults were found to miss appointments more frequently in a diabetic clinic as compared to their older counterparts.[21] Younger patients usually go out for work during daytime and so are more prone to missing appointments. In addition, it has been proved through earlier studies that obesity is associated with uncontrolled diabetes.[22] In our study, although not found to be statistically significant, with uncontrolled diabetes found in over 50% patients and a high proportion of patients suffering from lipid abnormalities, it is quite possible that those who were obese also had deranged blood sugar and lipid abnormalities, leading to more complications, resulting in them seeking care elsewhere as well, thus, resulting in missed appointments and untimely visits. It is also possible that because of obesity, several co-morbid conditions could have also set in, for example, osteoarthritis, etc., thus, limiting the mobility of patients. Although the numbers were small, we could not ascertain the reason why underweight patients also had inadequate follow-up, but this could also be related to higher metabolic complications in them resulting in weight loss. Family physicians working in primary and secondary level NCD clinics are in a unique position to track such specific groups of patients. The potential role of mobile health (mHealth) as an effective tool for appointment reminders for provision of care in NCDs has already been realized[23,24,25] and is also being utilized in many settings. This could be helpful for family physicians and the allied healthcare staff working in the family physician's team in tracking and following up obese and younger patients.
The strengths of the study are that it had used routinely collected data of a clinic functioning in primary care, which is of help in improving health services. Family physicians working in both government and private clinics for NCDs can use routinely recorded paper-based or electronic medical record data to analyze and understand the factors associated with inadequate follow-up in their specific practice settings. In addition, according to our knowledge, there is no such published study from India, which has documented the demographic and clinical factors associated with missed scheduled appointments in a NCD clinic functioning in primary care.
There are some limitations as well. Because the study relies solely on routinely collected data, missing data was a problem. It is difficult to ascertain the exact reason of these missing data. We are not sure whether the missing data was because of the missed appointments by patients, poor documentation by healthcare providers, and refusal by patients for the undergoing laboratory tests or any other issues. In addition, as the routine clinic timings are during daytime working hours, we found that majority of registered patients were females. This could have an effect on generalizabilty of the results, although we also found that there was not much difference in the profile of registered male and female patients in terms of socio-demographic characteristics, clinical factors and factors associated with missed visits. The operational definitions of “adequate follow-up” and “timely follow-up visits” were arbitrarily framed, which bring in an element of subjectivity. However, in the absence of well accepted definitions regarding what should be called good and timely follow-up visits in the Indian settings, we thought that our definitions, which were framed according to clinical experience in NCD clinics in primary care, would serve as a starting point to highlight the issue. Data on tobacco use, physical activity, and diet were not available, which are also important cardio-metabolic factors. Nevertheless, BMI, to some extent, can be taken as a proxy measure for diet and physical activity.
Family physicians and primary care practitioners should give special attention to younger, obese, and underweight patients, and they can then be followed up by community health workers/Anganwadi workers through home visits or through telephonic follow-up calls, or mobile reminders. This group of patients should be given special attention by giving targeted health education to make them understand the importance of timely follow-up visits.
Conclusions
We found that age and BMI were significantly associated with inadequate follow at scheduled visits, with higher proportions of inadequate follow-up among younger, obese, and underweight patients as compared to their non-obese and older counterparts. Giving special attention to these groups while tracking patients having inadequate follow-up along with health education can improve the adequacy of follow-up.
Financial support and sponsorship
Nil.
Conflicts of interest
There are no conflicts of interest.
References
- 1. NCD_Guidelines.pdf [Internet]. [cited 2018 Jul 29] Available from: http://www.nrhmhp.gov.in/sites/default/files/files/NCD_Guidelines.pdf .
- 2.WHO | NCD mortality and morbidity [Internet]. WHO. [cited 2018 Jul 29] Available from: http://www.who.int/gho/ncd/mortality_morbidity/en/
- 3.Directorate General Of Health Services [Internet]. [cited 2018 Oct 2] Available from: http://dghs.gov.in/content/1363_3_NationalProgrammePreventionControl.aspx .
- 4.Magadzire BP, Mathole T, Ward K. Reasons for missed appointments linked to a public-sector intervention targeting patients with stable chronic conditions in South Africa: Results from in-depth interviews and a retrospective review of medical records. BMC FamPract. 2017;18:82. doi: 10.1186/s12875-017-0655-8. [DOI] [PMC free article] [PubMed] [Google Scholar]
- 5.Akinniyi AA, Olamide OO. Missed medical appointment among hypertensive and diabetic outpatients in a tertiary healthcare facility in Ibadan, Nigeria. Trop J Pharm Res. 2017;16:1417–24. [Google Scholar]
- 6.WHO | Preventing chronic diseases: a vital investment [Internet] WHO; [cited 2018 Oct 2]. Available from: http://www.who.int/chp/chronic_disease_report/en/ [Google Scholar]
- 7.Samuels RC, Ward VL, Melvin P, Macht-Greenberg M, Wenren LM, Yi J, et al. Missed appointments missed appointments: Factors contributing to high no-show rates in an urban pediatrics primary care clinic, factors contributing to high no-show rates in an urban pediatrics primary care clinic. ClinPediatr (Phila) 2015;54:976–82. doi: 10.1177/0009922815570613. [DOI] [PubMed] [Google Scholar]
- 8.Nwabuo CC, Dy SM, Weeks K, Young JH. Factors associated with appointment non-adherence among African-Americans with severe, poorly controlled hypertension. PLoSOne. 2014;9:e103090. doi: 10.1371/journal.pone.0103090. [DOI] [PMC free article] [PubMed] [Google Scholar]
- 9.Bell RL, Curb JD, Friedman LM, McIntyre KM, Payton-Ross C. Enhancement of visit adherence in the national beta-blocker heart attack trial. Control Clin Trials. 1985;6:89–101. doi: 10.1016/0197-2456(85)90114-x. [DOI] [PubMed] [Google Scholar]
- 10.Smith EO, Curb JD, Hardy RJ, Hawkins CM, Tyroler HA. Clinic attendance in the hypertension detection and follow-up program. Hypertension. 1982;4:710–5. doi: 10.1161/01.hyp.4.5.710. [DOI] [PubMed] [Google Scholar]
- 11.Williamson AE, Ellis DA, Wilson P, McQueenie R, McConnachie A. Understanding repeated non-attendance in health services: A pilot analysis of administrative data and full study protocol for a national retrospective cohort. BMJ Open. 2017;7:e014120. doi: 10.1136/bmjopen-2016-014120. [DOI] [PMC free article] [PubMed] [Google Scholar]
- 12.WHO. Obesity: Preventing and managing the global epidemic. Report of a WHO consultation. World Health Organ Tech Rep Ser. 2000;894:1–253. [PubMed] [Google Scholar]
- 13.National Institutes of Health. ATP III guidelines at-a-glance quick desk reference. NIH Publication. 2001 May (01-3305) [Google Scholar]
- 14.Aschner P. New IDF clinical practice recommendations for managing type 2 diabetes in primary care. Diabetes Res ClinPract. 2017;132:169–70. doi: 10.1016/j.diabres.2017.09.002. [DOI] [PubMed] [Google Scholar]
- 15.R Core Team. R: A language and environment for statistical computing. R Foundation for Statistical Computing, Vienna, Austria. 2017. Available form: https://www.R-project.org/
- 16.Majumdar A, Chinnakali P, Vinayagamoorthy V, Daya PA, Shidam UG, Roy G. Screening for hypertension and selected cardiovascular risk factors among adults attending a primary health center in Puducherry, India. Int J Prev Med. 2014;5:1616–20. [PMC free article] [PubMed] [Google Scholar]
- 17.Ozder A. Lipid profile abnormalities seen in T2DM patients in primary healthcare in Turkey: A cross-sectional study. Lipids Health Dis. 2014;13:183. doi: 10.1186/1476-511X-13-183. [DOI] [PMC free article] [PubMed] [Google Scholar]
- 18.Choudhury KN, Mainuddin AKM, Wahiduzzaman M, Islam SMS. Serum lipid profile and its association with hypertension in Bangladesh. Vasc Health Risk Manag. 2014;10:327–32. doi: 10.2147/VHRM.S61019. [DOI] [PMC free article] [PubMed] [Google Scholar]
- 19.Gordon L, Ragoobirsingh D, Morrison EYA, Choo-Kang E, McGrowder D, Martorell E. Lipid profile of type 2 diabetic and hypertensive patients in the Jamaican population. J Lab Physicians. 2010;2:25–30. doi: 10.4103/0974-2727.66709. [DOI] [PMC free article] [PubMed] [Google Scholar]
- 20.Mamo Y, Seid E, Adams S, Gardiner A, Parry E. A primary healthcare approach to the management of chronic disease in Ethiopia: An example for other countries. Clin Med. 2007;7:228–31. doi: 10.7861/clinmedicine.7-3-228. [DOI] [PMC free article] [PubMed] [Google Scholar]
- 21.Low SK, Khoo JK, Lim SC, Sum CF. Missed appointments at a diabetes centre: Not a small problem. Ann Acad Singapore. 2016;45:1–5. [PubMed] [Google Scholar]
- 22.Yousefzadeh G, Shokoohi M, Najafipour H. Inadequate control of diabetes and metabolic indices among diabetic patients: A population based study from the Kerman Coronary Artery Disease Risk Study (KERCADRS) Int J Health Policy Manag. 2014;4:271–7. doi: 10.15171/ijhpm.2015.06. [DOI] [PMC free article] [PubMed] [Google Scholar]
- 23.Pujari S. Be He@lthy Be Mobile: Digital health for the SDGs[Internet] [cited 2018 Nov 8]. Available from: http://www.who.int/global-coordination-mechanism/working-groups/mhealth.pdf .
- 24.Majumdar A, Kar SS, S GK, Palanivel C, Misra P. mHealth in the prevention and control of non-communicable diseases in India: Current possibilities and the way forward. J ClinDiagn Res. 2015;9:LE06–10. doi: 10.7860/JCDR/2015/11555.5573. [DOI] [PMC free article] [PubMed] [Google Scholar]
- 25.Doocy S, Paik K, Lyles E, Tam HH, Fahed Z, Winkler E, et al. Pilot testing and implementation of a mHealth tool for non-communicable diseases in a humanitarian setting. PLoSCurr Disasters [Internet] 2017 Jun 5 [cited 2018 Sep 25] Available from: http://currents.plos.org/disasters/article/pilot-testing-and-implementation-of-a-mhealth-tool-for-non-communicable-diseases-in-ahumanitarian-setting/ [DOI] [PMC free article] [PubMed]