

Abstract
Aims:
Adult African American (AA) women have one third of the hepatic insulin clearance of European American (EA) women. This lower hepatic (but not extra-hepatic) insulin clearance in AA individuals is associated with higher plasma insulin concentrations. This study aims to understand whether impairment of hepatic insulin clearance is seen in AA individuals since childhood, possibly suggesting that genetic/epigenetic factors, rather than lifestyle only, contribute to this.
Materials and methods:
A total of 203 children (105 male and 98 female (55 AA, 88 EA and 60 Hispanic American [HA]; ages, 7–13 years; mean BMI, 19 kg/m2)) underwent the frequently-sampled intravenous glucose tolerance test (FSIGT) at the University of Alabama at Birmingham, General Clinical Research Center and Department of Nutrition Sciences. Glucose, insulin and C-peptide levels were measured and hepatic and extra-hepatic insulin clearances were calculated using mathematical modelling.
Results:
Fractional hepatic insulin extraction (FEL) was lower in AA than in EA children (mean (SD), 19% (20%) vs 33% (20%); P = 0.0007). Adjusting for age, Tanner stage and body fat, FEL was lower in AA than in EA children (P = 0.0012), and there was a slight sex-related difference (FEL, 24% (10%) vs 29% (10%) in boys vs girls; P = 0.04). Extra-hepatic insulin clearance did not differ with ethnicity (27 (12), 21 (12) and 24 (28) mL/kg/min for AA, HA and EA children, respectively; P > 0.05).
Conclusions:
At a young age, FEL is lower in AAs than in EAs, which does not rule out genetic/epigenetic factors. These differences are related to hyperinsulinaemia and, over time, could possibly contribute to metabolic disorders in AA individuals.
Keywords: insulin resistance, insulin secretion, liver
1 |. INTRODUCTION
Diabetes incidence is 2.4-fold higher in African American (AA) women,1 1.5-fold higher in AA men1 and 1.6-fold higher in Hispanic American (HA) individuals2 compared to Caucasian counterparts. The causes of these differences among ethnic groups remain unknown. One possible mechanism could relate to differences in insulin degradation rates. Adult AA women have two-thirds lower hepatic insulin first-pass extraction clearance than their European American (EA) counterparts,3 although no difference was found concerning the extra-hepatic component. The impairment of hepatic insulin clearance in AA individuals, together with a higher insulin secretion rate, could be related to the increased peripheral hyperinsulinaemia in AA compared to EA individuals.3 Higher insulin in the blood is associated with insulin resistance.4,5 Therefore, it is possible that long-term hyperinsulinaemia contributes to insulin resistance in AA individuals.6–8 Concerning HA individuals, their hepatic insulin clearance seems to be more similar to that of EA individuals; thus, its relationship with hyperinsulinaemia needs to be determined. In general, whether persistent hyperinsulinaemia can actually cause type 2 diabetes remains controversial, as the multiple interactions between glucose and insulin make it difficult to understand causality. Recently, it has been shown in animal models that moderate reductions in insulin levels can protect against progressive weight gain, insulin resistance and hyperglycaemia.9 Persistent hyperinsulinaemia could lead to type 2 diabetes through insulin resistance, as compensatory mechanisms of hypersecretion. However, in the long term, beta-cells could become unable to compensate for insulin resistance through secretion, leading then to hyperglycaemia.
The question arises as to the explanation for lower insulin clearance in AA individuals, and less so in the HA ones. Lifestyle among ethnic groups varies, including differences in diet, sleep and smoking habits, alcohol consumption and exercise. Therefore, lifestyle alone could be responsible for the lower rates of hepatic insulin degradation previously observed in AAs. However, it is also possible that differences in insulin clearance among ethnic groups could be related to genetic or epigenetic causes.7 One might expect that, while genetic or epigenetic factors would come into play throughout life, most lifestyle effects per se might be less evident in younger individuals, plausibly because they take a longer time to build up. Thus, we considered it of interest to ask whether ethnic differences in insulin clearance could be observed in young children before most effects of lifestyle play a major role. If the difference in insulin clearance rates found in adults has been present since childhood, this would suggest that genetic factors are, at least, not to be excluded. In this report we examine insulin clearance rates, hepatic vs extra-hepatic, to determine whether the differences previously seen between EA and AA individuals, and possibly also HA individuals, can be detected in children.
It has been problematic to differentiate between hepatic and extra-hepatic clearance mechanisms in sizeable groups, as traditional methods of measuring clearance do not yield such information. Using a recently introduced modelling approach that employs insulin and C-peptide data during the frequently-sampled intravenous glucose tolerance test (FSIGT), we are able to estimate hepatic vs extra-hepatic insulin clearance rates.10 In the present work, we have applied this novel method to 7- to 13-year-old EA, AA and HA children of both sexes. The results reveal that hepatic first-pass clearance per se is markedly lower in AA than in EA children. This difference suggests that the lesser rate of hepatic degradation appears before most lifestyle factors have had a major effect and, thus, genetic/epigenetic characteristics could be contributors.
2 |. MATERIALS AND METHODS
2.1 |. Clinical study
The participants in this study have been described previously.11 These included 203 children without major illness or medical conditions, of both sexes, between the age of 7 and 13 years, and with a minimum body weight (BW) of 20 kg. These data were part of a cross-sectional cohort study assessing population differences in metabolic phenotypes.11 Only participants with complete data for glucose, insulin and C-peptide throughout the FSIGT were included in the analysis. Children were classified according to parental report as EA (n = 88), HA (n = 60) or AA (n = 55). Of these, 38% of EAs, 65% of HAs and 33% of AAs had impaired fasting glucose values (ie, 100–125 mg/dL). All were assessed by a paediatrician to be at Tanner stage ≤3. Participants and parents signed written informed assent and consent, respectively. The study was approved by the Institutional Review Board for Human Use at the University of Alabama at Birmingham.
2.2 |. Protocol
Pubertal status, anthropometric measurements and body composition, assessed by dual-energy X-ray absorptiometry (DXA), were evaluated during the first visit.11 Participants were provided with a list of common foods and their carbohydrate content, in order to ensure consumption of at least 250 g carbohydrates for 3 days before the second visit, which was within 30 days of the first. During the second visit, the following took place. On the evening before testing, participants received a standard meal consisting of 50% energy from carbohydrate, 30% energy from fat and 20% energy from protein. After an overnight fast, they underwent FSIGT the following morning, starting at 7:00 am.
2.3 |. Frequently-sampled intravenous glucose tolerance test
Insulin sensitivity, insulin secretion and insulin clearance were determined from results of the FSIGT, following a previously described protocol.6 Two blood samples were collected at baseline. At t = 0, a bolus of glucose (50% dextrose, 300 mg/kg) was injected intravenously. Insulin (0.02 U/kg) was subsequently administered intravenously over the 5-minute period from 20 to 25 minutes. A reduced 25-sample protocol was used, in which post injection blood was sampled (2.0 mL) at 2, 3, 4, 5, 6, 8, 10, 12, 15, 19, 20, 21, 22, 24, 26, 28, 30, 35, 40, 50, 60, 70 and 240 minutes.6
2.4 |. Laboratory analyses
Glucose, insulin and C-peptide were analysed in the Metabolism Core Laboratory of the General Clinical Research Center and Nutrition Obesity Research Center at the University of Alabama at Birmingham. Glucose was measured in 10 μL of sera using an Ektachem DT II System (Johnson & Johnson Ortho Clinical Diagnostics, Rochester, New York). This analysis had a mean intra-assay coefficient of variation (CV) of 0.61% and a mean inter-assay CV of 1.45%. Insulin was assayed in duplicate 100 μL aliquots with reagents from Linco Research (St. Charles, Missouri). Assay sensitivity was 3.35 μIU/mL; mean intra-assay CV was 3.49%; and mean inter-assay CV was 5.57%. C-peptide from all FSIGT samples was assayed in duplicate 25 μL aliquots with double-antibody radioimmunoassay reagents (Diagnostic Products, Los Angeles, California). Assay sensitivity was 0.318 ng/mL; mean intra-assay CV was 3.57%; and mean inter-assay CV was 5.59%.
2.5 |. Calculation of hepatic and extra-hepatic insulin clearance
C-peptide and insulin secretion are assumed to be equimolar. The insulin secretion rate (ISR) was calculated using C-peptide deconvolution, with a two-compartment representation and assumed kinetic parameters.12 Knowing the ISR, both hepatic and extra-hepatic insulin clearance rates were calculated for each individual using a recently published modelling method (Figure 1).10 In this approach, delivery of insulin to the liver at any time is assumed to be the sum of the current ISR plus the rate of insulin returning to the liver from the bloodstream, which is equal to the hepatic plasma flow rate times the plasma insulin concentration. Delivery of insulin into plasma includes the secreted insulin that survives first-pass hepatic extraction plus the rate of IV insulin infusion during periods when insulin is infused. The model estimates parameters for hepatic insulin extraction, extra-hepatic insulin degradation, and distribution volume for insulin. Both linear and saturable models of hepatic insulin extraction are estimated for each participant and the preferred model is selected.10 In this study, the linear clearance model was preferred for all participants. Thus, three parameters were estimated for each participant: hepatic fractional extraction (FEL), extra-hepatic clearance (CLP), and distribution volume. Further details and the full equations have been published previously (Polidori et al.).10
FIGURE 1.
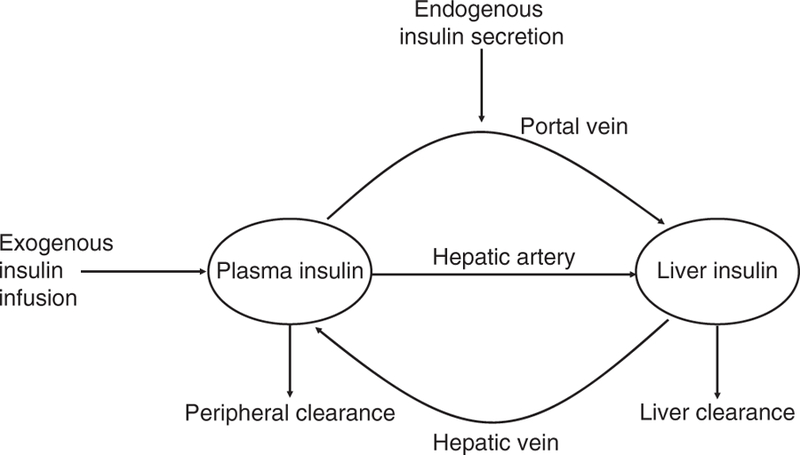
Graphical representation of the mathematical model proposed in Reference 10
2.6 |. Parameter estimation and statistical analysis
Parameters were estimated using a nonlinear least squares algorithm (lsqnonlin in Matlab, version R2017a). For each participant, the preferred model (linear or saturable) was chosen using the Akaike Information Criterion.13 Agreement between modelled and measured insulin concentrations was quantified using the weighted residual square sum. Data are presented as mean (standard deviation [SD]) unless otherwise stated. To examine ethnicity and sex-related differences, two-way ANOVA was conducted, with Bonferroni post hoc tests of group differences. Analysis of covariance was also used to examine differences in hepatic and extra-hepatic clearance, with age, Tanner stage and percent of body fat from DXA as covariates; P values <0.05 were considered statistically significant. Statistical analysis was conducted with Matlab, version R2017a and MedCalc, version 18.
3 |. RESULTS
The study group comprised 43% EA, 30% HA and 27% AA children. Anthropometrics, basal plasma concentrations and area under the curve (AUC) for the 203 participants are shown in Table 1, divided according to ethnicity (see File S1 for further details and the few sex-related differences). Insulin sensitivity (SI) and acute insulin response (AIRg) from the FSIGT are also summarized in Table 1; more information on these parameters can be obtained from a previous publication.11 Few children in the study were obese (EA, 6%; HA, 15%; AA, 7%) according to BMI percentile (obtained from CDC charts representative at the time of data collection).
TABLE 1.
Demographic information, acute insulin response, insulin sensitivity, fasting serum concentrations and ISR and AUC values for EA, HA and AA children.
| EA | HA | AA | |
|---|---|---|---|
| N | 88 | 60 | 55 |
| N male | 42 | 29 | 34 |
| N female | 46 | 31 | 21 |
| Age range (min-max years) | 7–13 | 7–12 | 7–12 |
| Tanner stage range (min-max) | 1–3 | 1–3 | 1–3 |
| BW (kg) | 37 (10) | 28 (4) | 37 (10) |
| BMI (kg/m2) | 18 (3)* | 15 (1) | 18 (3)* |
| Body fat (%) | 22 (8)* | 29 (8) | 20 (10)* |
| AIRg (μU/mL·min) | 585 (365)*,¤ | 1194 (1119) | 1026 (737) |
| SI (10−4 min−1/μU/mL) | 7 (3)* | 5 (5) | 5 (4) |
| Fasting plasma glucose (mg/dL) | 98 (18) | 101 (6) | 97 (11) |
| Fasting plasma insulin (pmol/L) | 69 (29)* | 97 (51) | 75 (34)* |
| Fasting plasma C-peptide (pmol/L) | 473 (179)* | 644 (375) | 427 (162)* |
| Fasting ISR (pmol/min) | 72 (26)* | 101 (59) | 64 (22)* |
| AUC(glucose)0–20 min (mg/dL·h) | 70 (7)*,¤ | 74 (7) | 66 (8)* |
| AUC(insulin)0–20 min (pmol/L·h) | 105 (59)* | 206 (174) | 168 (116) |
| AUC(C-peptide)0–20 min (pmol/L·h) | 435 (179)* | 680 (329) | 498 (194)* |
| AUC(ISR)0–20 min (pmol/min·h) | 175 (89)¤ | 202(110) | 271 (176)* |
| AUC(glucose)20–60 min (mg/dL·h) | 343 (30)* | 357 (38) | 340 (25)* |
| AUC(insulin)20–60 min (pmol/L·h) | 315 (156)* | 440 (245) | 324 (135)* |
| AUC(C-peptide)20–60 min (pmol/L·h) | 1674 (760)*,¤ | 2224 (988) | 1507 (623)* |
| AUC(ISR)20–60 min (pmol/min·h) | 289 (212)* | 371 (227) | 250 (157)* |
P < 0.05 vs HA
P < 0.05 vs AA with two-way ANOVA.
Of note, SI difference among ethnicity disappears when correcting for the covariates, while AIRg difference is maintained
Abbreviations: EA, European American; HA, Hispanic American; AA, African American; BW, body weight; BMI, body mass index; AIRg, acute insulin response; SI, insulin sensitivity; ISR, insulin secretion rate; AUC, area under the curve.
Mean measured plasma glucose, insulin, C-peptide concentrations and the calculated ISR are shown in Figure 2, separated according to ethnicity.
FIGURE 2.
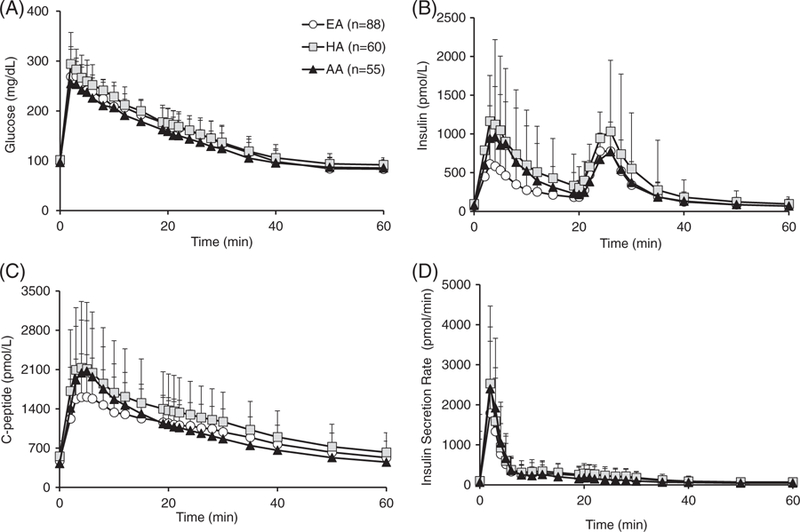
A, Average plasma glucose, B, insulin, C, C-peptide measurements, and D, calculated insulin secretion rate for EA (white circles), HA (grey squares) and AA (black triangles) children, during the first 60 minutes of the test. Abbreviations: EA, European American; HA, Hispanic American; AA, African American
3.1 |. Modelling results
The model we used10 allowed adequate description of plasma insulin concentrations in all groups, with mean (SD) normalized root square error equalling 12% (5%) in each ethnicity (see average weighted residuals online in File S1). Figure 3A,B shows average hepatic and extra-hepatic insulin clearance contribution for the three ethnicities. Hepatic insulin clearance differed with ethnicity, being lower in AA compared to EA children (FEL = 19% (20%) vs 33% (20%); P = 0.0007), while no sex-related differences were evident. When adjusting for age, Tanner stage and percentage of fat from DXA, hepatic insulin clearance still differed with ethnicity, with FEL being lower in AA than in EA children (P = 0.0012), while there were slight but still significant sex-related differences (FEL = 24% (10%) vs 29% (10%), respectively, in boys vs girls; P = 0.04). Extra-hepatic insulin clearance (CLP) was not impacted by ethnicity or sex-related differences, even after adjusting for covariates.
FIGURE 3.
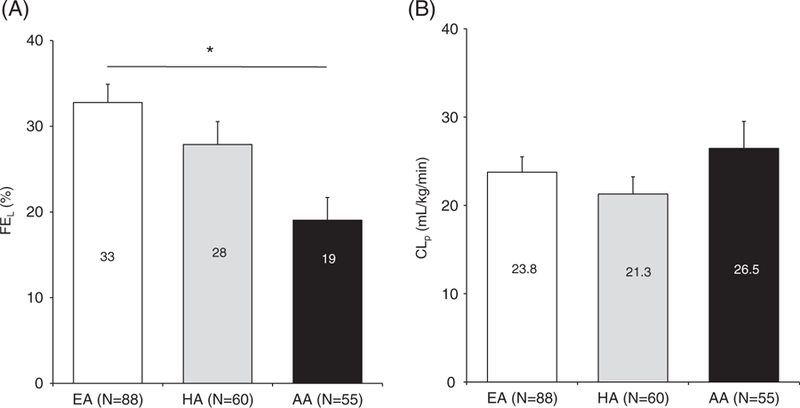
Hepatic insulin fraction, extra-hepatic insulin clearance indices in EA vs HA and AA children (panels A and B, respectively). Data are given as mean + SE. *P = 0.0007 in AA vs EA children with two-way ANOVA and P = 0.0012 after covariates correction. Abbreviations: CLp, extra-hepatic insulin clearance; FEL, hepatic insulin fraction; EA, European American; HA, Hispanic American; AA, African American; SE, standard error
The absence of a relationship between age and hepatic clearance is further demonstrated by linear regression, showing that older children do not demonstrate reduced clearance compared to younger children. As a result, there was no evidence of an age effect on clearance, considering either the entire data set (R = −0.1; P > 0.05) or the data set divided according to ethnicity (EA, R = −0.2; P > 0.05; AA, R = −0.1; P > 0.05; HA, R = 0.02; P > 0.05).
4 |. DISCUSSION
AA individuals are known to be more disposed to developing type 2 diabetes than are EAs. The extent to which the cause is genetic or lifestyle related (eg, obesity, poor physical activity, smoking status, alcohol intake) remains unclear.7,8,14 Previous studies in AA and HA cohorts have associated the lower whole-body metabolic insulin clearance rate with the development of type 2 diabetes.15 While genetic studies that identified regions on chromosomes 15 and 20 that might influence insulin clearance have been published concerning HA individuals,16 similar studies have not yet been undertaken for EA and AA individuals.
Because of its possible association with the development of type 2 diabetes, the assessment of insulin clearance in different ethnicities is very important. Insulin is cleared by the liver, but also by other tissues including the kidneys and muscle.10 Methods to measure total body insulin degradation rates have been proposed, based on both oral tests17,18 and the FSIGT.15,19 However, an approach to assess the hepatic and the extra-hepatic component separately has been introduced only recently.10
Using this new approach we have demonstrated that hepatic, but not extra-hepatic, insulin clearance is two thirds lower in AA than in EA non-diabetic adult women.3 This showed that, in AA women, there is a relationship between decreased hepatic insulin clearance and hyperinsulinaemia. However, the causality of these changes remains to be explored. It is not known whether hypersecretion precedes changes in clearance and the resulting hyperinsulinaemia leads to clearance impairment, or whether lower clearance is an early change leading to hyperinsulinaemia and insulin resistance, followed by compensatory increases in insulin secretion.
Our previous results3 showed that reduced hepatic clearance in AA individuals concerns adults for whom we can assume a certain lifestyle is already established. Lifestyle-related factors vary and include sleep habits, obesity, smoking status, alcohol consumption, diet and physical exercise. As these factors could differ between AA and EA individuals,16 one could hypothesize that lifestyle might account for the lower hepatic insulin clearance in AA compared to EA individuals. However, while most lifestyle differences among ethnic groups are well established for adults, they may play a lesser role for children; smoking and alcohol consumption are usually not relevant to young children, even if other characteristics such as obesity, fat distribution, diet and physical exercise may already begin to have an effect. To determine the underlying causes of differences in insulin clearance among ethnic groups, we sought to analyse its components in children of different ethnicities.
The results previously reported concerning adult EA and AA women3 are strongly confirmed here: hepatic insulin clearance is 74% lower in AA than in EA children. This is in accordance with insulin hyposecretion and lower concentrations observed in the first 20 minutes of the FSIGT in EA vs AA children; mean AUC0–20 min for plasma insulin is 60% higher in AA than in EA children. Insulin concentrations in this time frame are also lower in EA as compared to HA children, even if the difference in terms of secretion is not significant. In the second part of the test, that is, after exogenous insulin, the occurence of insulinaemia does not differ between AA and EA children, while it is higher in HA children than in EA and AA children, which is confirmed by the higher correspondent ISR (Table 1 and File S1). As AA individuals have greater AIRg and lower FEL compared to EA individuals, both increased secretion and decreased hepatic clearance contribute to the higher plasma insulin levels in AA individuals. It is not yet established whether reduced hepatic clearance is a consequence of enhanced secretion, possibly as part of an adaptive response occurring within the first few years of life. However, mean values of hepatic insulin clearance in HA children fell between the values in AA and EA children, without significant differences.
Fasting plasma insulin is higher in HA children than in the AA and EA ones (Table 1). Historically, hyperinsulinaemia has been associated with insulin resistance.20 Basal insulin increases with level of obesity, suggesting that insulin degradation might decline accordingly.21 In the present study (Table 1), HA children show higher basal secretion, with basal ISR and C-peptide values greater than those for both EAs and AAs, and with AIRg values higher for HAs than for EAs. Concerning a possible association between insulin resistance and basal hyperinsulinaemia in HA children, it is unlikely in this study, as SI is slightly lower in HA than in EA children (P = 0.04) (Table 1). In fact, obese children tended to be less insulin sensitive,22 and even if HA children had the highest obesity rates (see Results), the SI impairment is lost when adjusting for percentage of body fat (Table 1).
In the actual cohort, the saturable model10 was not chosen for any subject, based on the Akaike Information Criterion, showing that linearity of insulin kinetics was sufficient in all children. One could argue that the impairment of hepatic insulin extraction in AA children could be explained by the saturation of insulin uptake at higher insulin concentrations, which, potentially, might remain undetected in the current analysis. Saturation of insulin clearance might play a role, although not necessarily, at insulin levels exceeding 300 μU/mL.23 Insulin concentrations are lower than 300 μU mL in 93% of participants (Figure 2A); therefore, the linearity option seems to have been reasonably applied here.
Our previous results in adults, and our results now in children, are consistent with those recently reported concerning differences in insulin clearance for adolescents and adults; however, different methods were used which do not allow assessment of both hepatic and extra-hepatic components. AA adult men and women, and young girls, were shown to have lower hepatic insulin clearance, higher AIRg and decreased SI values as compared to the same population of EA individuals.24,25 However, other former results in children were mixed; no difference in hepatic clearance was found in overweight HA young girls, compared to their AA counterparts,26 while, in children of normal weight, hepatic extraction was lower in AAs compared with HAs.26 In the present study, only a relatively small portion of the total number of participants was obese according to BMI percentile. Compared to other studies,27 the analysed cohort in this one is uniquely larger, and comprises children of a wider age range who underwent FSIGT, including both male and female participants; sex was not considered in the work by Goran et al.27 and no information about it was included. Moreover, to the best of our knowledge, hepatic and extra-hepatic components of insulin clearance in young children of different ethnicities are dissected here for the first time, as the result of a new mathematical modeling approach.10 The present data support the conclusion that, in a sizable cohort, hepatic, but not extra-hepatic, insulin clearance is lower in AA children between 7 and 13 years of age.
Lower hepatic insulin clearance in AA children could corroborate the hypothesis that hepatic insulin clearance might be, in part, genetically/epigenetically inherited. To further investigate this hypothesis, the partial correlation analysis was applied to insulin clearance components and genetic admixture scores (African, European and Amerindian).11 We found that FEL is positively correlated with European admixture (r = 0.26; P < 0.001) and is negatively correlated with African admixture (r = −0.24; P < 0.001), while there is no relationship between admixtures and CLP. We also assessed whether there was a relationship between FEL and total dietary intake or diet composition, as these factors could differ among ethnic groups,28 despite the young age. Partial correlations were performed between FEL and total food intake, percentage of calories from carbohydrate, fat and protein in each ethnic group, and in the entire cohort. No significant relationship was seen, and only one of the partial correlations had a P value <0.05 (FEL vs percentage of calories from fat in the EA group; r = 0.27). On the other hand, the correlation between FEL and age showed that FEL did not decrease with age in children between 7 and 13 years of age. Although this age range is quite narrow, if lifestyle factors only were involved in the impairment, it should be more evident in the older children, which was not the case. Therefore, it is possible that the few lifestyle differences among children could potentially exacerbate expression of genetic ethnic differences in terms of metabolic outcomes, such as insulin clearance impairment. Further studies are needed to specifically investigate the contribution of diet to insulin clearance.
The expression of enzymes associated with hepatic insulin degradation could be reduced in AA individuals, and perhaps also in HAs. Liver insulin degradation begins when insulin is bound by its receptor and the receptor-bound complex is internalized into the endosomes through endocytosis; later, the endosome acidifies and insulin is dissociated from the receptor within the vesicle.29 Historically, the insulin degrading enzyme (IDE) is thought to be responsible for the postbinding insulin degradation process that precedes acidification.29 Recently, enzyme CEACAM1 has been shown to promote the rate of uptake of the insulin-receptor complex.30 IDE and/or CEACAM1 expression might be specifically reduced, inactivated or genetically altered in AAs, and possibly in HAs, because of genetic inheritance. Inactivation of CEACAM1 has been related to hyperinsulinaemia, insulin resistance, dyslipidaemia and visceral adiposity in transgenic mice31 through downregulation of insulin receptors and increased hepatic lipogenesis.26,31 The decreased expression of CEACAM1 could be related to type 2 diabetes through insulin resistance, but this remains controversial; a study32 has demonstrated its relationship to obesity and fatty liver, but not to diabetes. The number or activity of hepatic insulin receptors might be genetically lower in certain ethnicities,33 reducing their availability for binding and endocytosis. Also, liver size could be smaller in AA individuals, as previously suggested,33 and might be responsible for impaired hepatic insulin clearance.
In conclusion, hepatic and extra-hepatic insulin clearance rates are both estimated for the first time in young children of different ethnicities in this work, revealing lower hepatic insulin clearance in AA compared to EA children. Because of the young age of participants, this difference might be connected also to genetic heritability, rather than to lifestyle only. Further genetic studies are needed for confirmation, and to clarify the molecular mechanisms that regulate insulin clearance.
Supplementary Material
ACKNOWLEDGMENTS
The content of this paper was previously presented, in part, at The Obesity Society (TOS) annual meeting, Washington DC, November 2017, and at the 78th Scientific Session ADA, Orlando, Florida, June 2018.
Funding information
This study was supported by grants from the National Institute of Diabetes and Digestive and Kidney Diseases (DK067426), the National Institutes of Health: Nutrition Obesity Research Center (DK56336), the National Institutes of Health General Clinical Research Center (M01-RR00032).
R. N. B. is supported by grants from the National Institute of Diabetes and Digestive and Kidney Diseases (DK27619, DK29867) and from Astra Zeneca and Janssen Research & Development. B. A. G. is supported by grants from the National Institute of Diabetes and Digestive and Kidney Diseases (R01DK096388, P30 DK56336). J. R. F. is supported by grants from the National Institute of Diabetes and Digestive and Kidney Diseases (R01DK096388, P30 DK56336)
Footnotes
Conflict of interest
D. C. P. is a full-time employee of Janssen Research & Development. R. N. B. is an advisory board member of Ingredion. F. P., B. A. G and J. R. F. have no duality of interest to declare.
SUPPORTING INFORMATION
Additional supporting information may be found online in the Supporting Information section at the end of the article.
REFERENCES
- 1.Meier JJ, Veldhuis JD, Butler PC. Pulsatile insulin secretion dictates systemic insulin delivery by regulating hepatic insulin extraction in humans. Diabetes 2005;54:1649–1656. [DOI] [PubMed] [Google Scholar]
- 2.Chukwueke I, Cordero-MacIntyre Z. Overview of type 2 diabetes in Hispanic Americans. Int J Body Compos Res 2010;8(Supp):77–81. [PMC free article] [PubMed] [Google Scholar]
- 3.Piccinini F, Polidori DC, Gower BA, Bergman RN. Hepatic but not extra-hepatic insulin clearance is lower in African American than in European American women. Diabetes 2017;66:2564–2570. [DOI] [PMC free article] [PubMed] [Google Scholar]
- 4.Rizza RA, Mandarino LJ, Genest J, Baker BA, Gerich JE. Production of insulin resistance by hyperinsulinemia in man. Diabetologia 1985;28: 70–75. [DOI] [PubMed] [Google Scholar]
- 5.Katalano KJ, Maddux BA, Szary J, Youngren JF, Goldfine ID, Schaufele F. Insulin resistance induced by hyperinsulinemia coincides with a persistent alteration at the insulin receptor tyrosine kinase domain. PLoS One 2014;9:e108693. [DOI] [PMC free article] [PubMed] [Google Scholar]
- 6.Chandler-Laney PC, Phadke RP, Granger WM, et al. Age-related changes in insulin sensitivity and β-cell function among European-American and African-American Women. Obesity (Silver Spring) 2011; 19:528–535. [DOI] [PMC free article] [PubMed] [Google Scholar]
- 7.Osei K, Schuster DP, Owusu SK, Amoah AG. Race and ethnicity determine serum insulin and C-peptide concentrations and hepatic insulin extraction and insulin clearance: comparative studies of three populations of West African ancestry and white Americans. Metabolism 1997;46:53–58. [DOI] [PubMed] [Google Scholar]
- 8.Dowse GK, Zimmet PZ, Alberti KGMM, et al. Serum insulin distribution and reproducibility of the relationship between 2-hr insulin and plasma glucose level in Asian, Indian, Creole, and Chinese Mauritians. Metabolism 1993;42:1232–1241. [DOI] [PubMed] [Google Scholar]
- 9.Page MM, Johnson JD. Mild suppression of hyperinsulinemia to treat obesity and insulin resistance. Trends Endocrinol Metab 2018;29:389–399. [DOI] [PubMed] [Google Scholar]
- 10.Polidori DC, Bergman RN, Chung ST, Sumner AE. Hepatic and extra-hepatic insulin clearance are differentially regulated: results from a model-based analysis of intravenous glucose tolerance data. Diabetes 2016;65:1556–1564. [DOI] [PMC free article] [PubMed] [Google Scholar]
- 11.Klimentidis YC, Divers J, Casazza K, Beasley TM, Allison DB, Fernandez JR. Ancestry-informative markers on chromosomes 2, 8, and 15 are associated with insulin-related traits in a racially diverse sample of children. Hum Genomics 2011;5:79–89. [DOI] [PMC free article] [PubMed] [Google Scholar]
- 12.Van Cauter E, Mestrez F, Sturis J, Polonsky KS. Estimation of insulin secretion rates from C-peptide levels. Diabetes 1992;41:368–377. [DOI] [PubMed] [Google Scholar]
- 13.Burnham KP, Anderson DR. Model Selection and Multimodel Interference. A Practical Information-theoretic Approach New York: Springer; 2002. [Google Scholar]
- 14.Dowling H, Pi-Sunyer FX. Race dependent health risks of upper body obesity. Diabetes 1993;42:537–543. [PubMed] [Google Scholar]
- 15.Lee CC, Haffner SM, Wagenknecht LE, et al. Insulin clearance and the incidence of type 2 diabetes in Hispanics and African Americans: the IRAS family study. Diabetes Care 2013;36:901–907. [DOI] [PMC free article] [PubMed] [Google Scholar]
- 16.Guo X, Cui J, Jones MR, et al. Insulin clearance: confirmation as highly heritable trait, and genome-wide linkage analysis. Diabetologia 2012; 55:2183–2192. [DOI] [PMC free article] [PubMed] [Google Scholar]
- 17.Campioni M, Toffolo G, Basu R, Rizza RA, Cobelli C. Minimal model assessment of hepatic insulin extraction during an oral test from standard insulin kinetic parameters. Am J Physiol Endocrinol Metab 2009; 297:E941–E948. [DOI] [PMC free article] [PubMed] [Google Scholar]
- 18.Piccinini F, Dalla Man C, Vella A, Cobelli C A model for the estimation of hepatic insulin extraction after a meal. IEEE Trans Biomed Eng 2016;63:1925–1932. [DOI] [PMC free article] [PubMed] [Google Scholar]
- 19.Toffolo G, Campioni M, Basu R, Rizza RA, Cobelli C. A minimal model of insulin secretion and kinetics to assess hepatic insulin extraction. Am J Physiol Endocrinol Metab 2006;290:E169–E176. [DOI] [PubMed] [Google Scholar]
- 20.Adam TC, Hasson RE, Lane CJ, et al. Fasting indicators of insulin sensitivity: effects of ethnicity and pubertal status. Diabetes Care 2011;34: 994–999. [DOI] [PMC free article] [PubMed] [Google Scholar]
- 21.Gallagher D, Albu J, He Q, et al. Small organs with a high metabolic rate explain lower resting energy expenditure in African American than in white adults. Am J Clin Nutr 2006;83:1062–1067. [DOI] [PMC free article] [PubMed] [Google Scholar]
- 22.ter Horst KW, Gilijamse PW, Koopman KE, et al. Insulin resistance in obesity can be reliably identified from fasting plasma insulin. Int J Obes (Lond) 2015;39:1703–1709. [DOI] [PubMed] [Google Scholar]
- 23.Ferrannini E, Cobelli C. The kinetics of insulin in man. I General aspects. Diabetes Metab Rev 1987;3:335–363. [DOI] [PubMed] [Google Scholar]
- 24.Faber OK, Hagen C, Binder C, et al. Kinetics of human connecting peptide in normal and diabetic subjects. J Clin Invest 1978;62: 197–203. [DOI] [PMC free article] [PubMed] [Google Scholar]
- 25.Goree LL, Darnell BE, Oster RA, Brown MA, Gower BA. Association of free fatty acids with insulin secretion and action among African-American and European-American girls and women. Obesity (Silver Spring) 2010;18:247–253. [DOI] [PMC free article] [PubMed] [Google Scholar]
- 26.Hasson RE, Adam TC, Davis JN, Watanabe RM, Goran MI. Compensatory responses to insulin resistance in obese African-American and Latina girls. Pediatr Obes 2013;8:68–73. [DOI] [PubMed] [Google Scholar]
- 27.Goran MI, Bergman RN, Cruz ML, Watanabe R. Insulin resistance and associated compensatory responses in African-American and Hispanic children. Diabetes Care 2002;25:2184–2190. [DOI] [PubMed] [Google Scholar]
- 28.Casazza K, Dulin-Keita A, Gower BA, Fernandez JR. Differential influence of diet and physical activity on components of metabolic syndrome in a multiethnic sample of children. J Am Diet Assoc 2009;109: 236–244. [DOI] [PMC free article] [PubMed] [Google Scholar]
- 29.Duckworth WC, Bennet RG, Hamel FG. Insulin degradation: progress and potential. Endocr Rev 1998;19:608–624. [DOI] [PubMed] [Google Scholar]
- 30.Heinrich G, Ghadieh HE, Ghanem SS, et al. Loss of hepatic CEACAM1: a unifying mechanism linking insulin resistance to obesity and non-alcoholic fatty liver disease. Front Endocrinol (Lausanne) 2017;8:8. [DOI] [PMC free article] [PubMed] [Google Scholar]
- 31.Deangelis AM, Heinrich G, Dai T, et al. Carcinoembryonic antigen-related cell adhesion molecule 1: a link between insulin and lipid metabolism. Diabetes 2008;57:2296–2303. [DOI] [PMC free article] [PubMed] [Google Scholar]
- 32.Lee W The CEACAM1 expression is decreased in the liver of severely obese patients with or without diabetes. Diagn Pathol 2011;6:40. [DOI] [PMC free article] [PubMed] [Google Scholar]
- 33.Lockwood DH, Hamilton CL, Livingston JN. The influence of obesity and diabetes in the monkey on insulin and glucagon binding to liver membranes. Endocrinology 1979;104:76–81. [DOI] [PubMed] [Google Scholar]
Associated Data
This section collects any data citations, data availability statements, or supplementary materials included in this article.