Abstract
Abnormal telomere lengths have been linked to cancer and other hematologic disorders. Determination of mean telomere content (MTC) is traditionally performed by Southern blotting and densitometry, giving a mean telomere restriction fragment (TRF) value for the total cell population studied. Here, we compared a quantitative Polymerase Chain Reaction approach (qPCR) and a flow cytometric approach, fluorescence in situ hybridization (Flow-FISH), to evaluate telomere content distribution in total patient peripheral blood mononuclear cells or specific cell populations. Flow-FISH is based on in situ hybridization using a fluorescein-labeled peptide nucleic acid (PNA) (CCCTAA)3 probe and DNA staining with propidium iodide. We showed that both qPCR and Flow-FISH provide a robust measurement, with Flow-FISH measuring a relative content longer than qPCR at a single cell approach and that TRF2 fluorescence intensity did not correlate with MTC. Both methods showed comparable telomere content reduction with age, and the rate of relative telomere loss was similar.
Keywords: telomere, qPCR, Flow-FISH, TRF2
INTRODUCTION
Telomeres are repeating nucleotide sequences of TTAGGG found at the end of eukaryotic chromatids that maintain the integrity and limit the degradation of chromosomal material (1,2). These sequences prevent the truncation of chromosomes during cell division cycles, and decrease in length with each cell division. Telomerase reverse transcriptase extends the 3’ end preserving its contents for further cell division cycles (3–5). Dysfunction of telomerase and atypical telomere lengths have been linked to cancer and patterns in cell mortality (6–9).
Hematologic disorders in which hematopoietic stem and progenitor cells from the bone marrow are attacked and killed by auto-reactive T-lymphocytes lead to a decrease in production of circulating blood cells (10), and can be fatal in more severe cases (11). Recent studies indicate that aplastic anemia patients with shorter telomeres at diagnosis have lower survival rates and a dramatic increase in the likelihood of evolution to myeloid neoplasms (myeloidysplastic syndromes and acute myelogenous leukemia) (12–17). In addition to being linked to aplastic anemia, telomere length is related to the aging process (cellular senescence) and to multiple forms of cancer (18,19), thus the ability to quantify telomere content in patients with aplastic anemia or other telomere attrition diseases is critical for optimal medical care (12,13,20).
The Shelterin complex, which is formed by six telomere-specific proteins associated with the telomeric sequence TTAGGG, protects chromosome ends during cell division (21). Within the Shelterin complex, TRF2 serves to protect telomeres through two pathways that are initiated on free DNA ends (22). Consistent with their role in protecting telomere content, indirect immunofluorescence indicated that both TRF1 and TRF2 bind to duplex telomeric DNA in vivo and are more abundant on telomeres with long TTAGGG repeat tracts (23).
Telomere restriction fragment analysis (TRF) using southern blot analysis was the earliest developed technique for the measurement of telomere content (2,17). Considered as the standard for all other techniques, TRF is less technical when it comes to instrumentation requirements. Restriction enzymes digest all nontelomeric regions; the remaining fragments correspond to telomeric repeats and subtelomeric regions. The fragment is resolved using agarose gel electrophoresis and detected using southern blot technique with a labeled telomere probe. With a resolution of 1 kb, TRF requires 0.5–10 μg of DNA to perform the experiment. TRF has a maximum resolution of around 20 kb because of the separative nature of gel electrophoresis. Furthermore, TRF tends to overstate actual telomere repeats, as variant telomere repeat regions and subtelomeric regions are also included in the measurement.
Currently, quantitative polymerase chain reaction (qPCR) (an assay which amplifies nucleic acids in order to detect and quantify a targeted DNA sequence) is the methodology used to measure telomeres in patients with these disorders in a number of clinical centers (24). Flow cytometry fluorescent in situ hybridization (Flow-FISH), a novel cytogenetic technique in which flow cytometry and fluorescent in situ hybridization are combined allowing for the quantification of repetitious DNA base pairs, is a new and effective way of quantifying telomere content at a single cell level. It is also a good assay to use as quality control in confirming data, using control cells such as bovine thymocytes along with leukocytes in each staining, or a qPCR control in every run (15). It has the potential to be more discerning than qPCR through the addition of fluorescent antibodies, which allows for the differentiation of numerous classes and subsets of cells. In this study, we assessed and compared mean telomere content (MTC) measured by Flow-FISH and qPCR, as well as testing the hypothesis that the intensity of intracellular staining of the protein TRF2 reflects telomere content.
MATERIALS AND METHODS
Patients
Written informed consent for all procedures and research collections was obtained on an Institutional Review Board-approved protocol in accordance with the declaration of Helsinki and reviewed by National Heart Lung and Blood institutional review board (protocol #09-H-0239). Cord blood samples were obtained from National Institutes of Health’s department of transfusion medicine.
Cell Preparation
Patient peripheral blood mononuclear cell (PBMCs) samples were obtained through Ficoll density centrifugation using lymphocyte separation medium (MP Biomedicals, LLC, Santa Ana, CA) from whole blood according to the manufacturer’s protocol. A human T-cell leukemia (1301) cell line from Sigma Aldrich, human cord blood cells (CB), and commercial PBMCs from Accucell (named CHI control in our experiment) were used as control samples. The 1301 cell line was cultured according to Sigma Aldrich recommendations in RPMI 1640 (Gibco, Life Technologies, Grand Island, NY) with 10% fetal bovine serum (Sigma Life Sciences), penicillin, streptomycin, and glutamine (Gibco, Life Technologies, St. Louis, MO). After purchase of the 1301 cell line, subsequent cells were obtained from four passages after reaching a maximum of 1 × 10⁶ viable cells/ml in culture; cells were stored at −196°C.
Wash and Hybridization
PBMCs were processed according to the Dako telomere PNA Kit/FITC protocol with slight modifications (Dako North America, Carpinteria, CA). The 1301 cell line and CHI controls were used for the evaluation of repeated measurements, and patient PBMCs or CB were combined with 1301 control cells and washed in PBS. The solutions included 1 × 10⁶ viable cells/ml of CHI with 1 × 10⁶ viable cells/ml of 1301 in quadruplicate as control samples, and 1 3 106 viable cells/ml of patient PBMCs or CB samples with 1 × 10⁶ viable cells/ml of 1301 in quadruplicate as patient samples. Cells were counted with a Beckman Coulter Vi-Cell for all procedures. The mixtures were pelleted at 600 g for 10 min, and the pellets were resuspended using Dako 70% formamide ready-to-use hybridization solution for two samples and Dako 70% formamide ready-to-use telomere PNA probe/FITC hybridization solution for the remaining two samples of each quadruplicate cell mixture. All samples were heated to 82°C for 10 minutes to ensure denaturation of telomeric DNA and then placed in the dark at room temperature overnight to allow for hybridization.
All samples were washed with the provided Dako wash solution through heating to 40°C for 10 minutes, and then vortexed and centrifuged twice at 600 g for 10 minutes. 0.5 ml of Dako DNA staining solution (B515: FITC and G610: PI) was added to each pellet, and samples were incubated at 4°C for 3 hours to ensure telomeric DNA staining had occurred before flow cytometry analysis.
Flow Cytometry Flow-FISH
Quantumtm Molecules of Equivalent Soluble Fluorochrome (Quantum MESF 5 beads premix, Bangs Laboratories, Fishers, IN) beads were used for the standardization of fluorescence intensity units in order to perform quantitative fluorescence cytometry for Flow-FISH. One blank microsphere population and four microsphere populations with surface-labeled FITC in increasing amounts were acquired. The beads were run on the same day as the experiment, directly before the samples. The same fluorescence settings (PMT, voltage, and compensation) were used as when acquiring the stained cell samples to establish a calibration curve relating instrument channel values to standardized fluorescence intensity units. Cells were primarily gated on SSC by FSC to identify dead cells and exclude debris. From this gate, SSC-height by SSC-area were plotted to exclude cell doublets and ensure single cells analysis. The plot was then set for PI (G610) by FITC (B515) and gated on sample cells and 1301 cells in order to observe the median fluorescence intensity (MFI) of hybridized PNA probe to telomeric DNA. All experiments were acquired on a LSR Fortessa™ flow cytometer equipped with 355, 407, 488, 532, and 638 nm laser lines using DIVA™ 8 software (BD, San Jose, CA) (Supporting Information Table 1). Instrument performance was tested daily using Control Setup and Tracking (CST) beads from BD. A minimum of 20,000 events was acquired for each sample, and analyses were performed using FlowJo vX.0.7 (Treestar, San Carlos, CA).
Flow Cytometry TRF2 Intracellular Staining
Single-cell suspensions from viably cryopreserved samples were thawed and washed once in PBS. After washing, cells were incubated for 15 minutes in presence of LIVE/DEAD Aqua Fixable Viability Dye (Invitrogen, Carlsbad, CA), followed by a wash in staining buffer (PBS supplemented with 2% normal mouse serum; Gemini Bioproducts, West Sacramento, CA). Cell lines used were all obtained from ATCC [(Manassas, VA); CA46, CCRF, CMK, C2–55, D11, HL-60, Hela, JK-10, KG1α, Raji, SKW86, ST486, THP2] and stained directly for intracellular TRF2. PBMCs from healthy donors were stained for 30 minutes with CD3, CD4, CD8, CD19, and CD14 (BD) (Online Table 2). Intracellular TRF2 (AbCam, Cambridge, MA) staining was performed after staining of the cells for surface antigens using FOXp3 permeabilization buffer to permeabilize the cells (Ebiosciences Affymetrix, San Diego, CA) (Supporting Information Fig. 2). All experiments were acquired on a LSR Fortessa flow cytometer equipped with 355, 407, 488, 532, and 638 nm laser lines using DIVA 8 software (BD). As previously performed for Flow-FISH, Quantum™ Molecules of Equivalent Soluble Fluorochrome (Quantum MESF 5 beads premix in Alexa 647, Bangs Laboratories) beads were used for the standardization of fluorescence intensity units. Results were reported as MESF of TRF2 in total cell populations for cell lines and in different cell subsets. Analysis was performed using FlowJo vX.0.7.
MFI Data Analysis
FITC Median Fluorescence Intensity (MFI) of the telomeric DNA was analyzed using the analysis template document referred to in Baerlocher et al. (25–28). MFI values were converted to MESF values using a regression generated from the Quantum MESF bead values provided by Bangs Laboratories, based on lot bead number. Telomere content was calculated by comparing the difference of MESF hybridized and nonhybridized PNA samples in duplicate, and presented as average values of MTC. Alexa 647 Quantum beads were used in a similar way to convert TRF2 MFI to MESF (Supporting Information Fig. 1).
Quantitative PCR Telomere Content Analysis
Patient’s PBMCs DNA were extracted using the Promega Maxwell 16 instrument. MTC were measured using the Qiagen Rotor-Gene Q real-time cycler with a modified Qiagen CLIA-certified qPCR method as reported (29,30). About 1.6 ng genomic DNA samples were run in triplicate using the Rotor-Gene SYBR Green Kit (Qiagen). Primers for telomeric repeats (FP 5′-GGTTTGTTTGGGTTTGGGTTTGGGTTTGGGTTTGGGTT-3′ and RP 5′-GGCTTGCCTTACCCTTACCCTTACCCTTACCCTTACCCT-3′) and human 60S acidic ribosomal protein P0 as single gene control (FP 5′-CCCATTCTATCATCAACGGGTACAA-3′ and RP 5′-CAGCAAGTGGGAAGGTGTAATCC-3′) were used. All telomere content calculations were based on the single copy gene ratio (T/S) and calculated as [Ct(telomere)/Ct(single gene)]. Each sample was then calculated from a normalized mean single copy gene ration of a reference sample using the equation [2−(ΔCtx − ΔCtr) = 2−ΔΔCt]. Reproducibility between runs was ensured by reference samples.
TRF, Southern Blotting Analysis
Telomere measurements were carried out following the protocol of the TeloTAGGG Telomere Length Assay Kit (Roche, Pleasanton, CA) with slight modifications. About 500 ng of DNA extracted from PBMCs were digested with Hinfl and RsaI enzymes for 10 minutes at 37°C and then for 2 minutes at 60°C. Samples were run on a 0.8% agarose gel for 4 hours at 120 V. The gel was submerged in HCl, denatured, and neutralized before telomere fragments were transferred to a nylon membrane for 24 hours. The DNA was fixed by baking the membrane at 80°C for 2 hours. A DIG-labeled telomeric probe was hybridized to the membrane for 3 hours at 42°C. After a series of stringent washes and incubation with the secondary anti-DIG antibody, the telomeric DNA was detected by chemiluminescent imaging. Images were analyzed by the program ImageQuantTL (GE Healthcare Bio-Sciences, Piscataway, NJ), and the telomere content was calculated by the equation: TRF mean=∑ODi/∑(ODi/Li), where ODi is the chemiluminescent signal and Li is the length of the TRF fragment at position i.
Statistical Analysis
Data obtained with cells from one donor were considered as one experiment (n). Statistical analysis performed on the results included the calculation of mean, standard deviation of the mean, and P values by use of a paired Mann-Whitney test (nonparametric T-test). Correlations between parameters were calculated using Spearman Correlation and Spearman r factor was reported. Linear regression was measured for telomere attrition and age, and the slope m was reported with R2 coefficient of correlation. The significance level was set as P=0.05, and the P values are given for each series of experiments.
RESULTS
MTC by Flow FISH
MESF analysis of cell line 1301
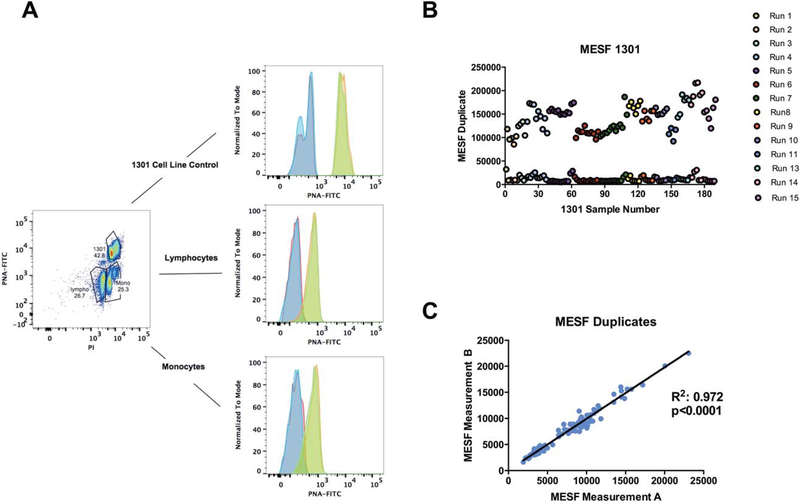
PBMCs were stained according to the Dako protocol, and samples were acquired on a flow cytometer. Differences in 1301 MFI of PNA probed and unprobed samples indicated successful hybridization of PNA probe to telomere nucleotide repeats (Fig. 1A)
Figure 1.
Flow gating strategy and MESF values of 1301 cell line. Representative 1301 cell lines were used in all Flow-FISH runs (n=15) according to the Dako protocol. Each sample was analyzed in duplicate in the presence of 1301. Gating strategy for unprobed and probed samples, and results are plotted for fluorescent molecule intensity MESF for 1301 duplicates. A. Gating scheme for Flow-FISH experiment and MFI differences of lymphocytes, monocytes, and the 1301 cell line. The 1301 and samples from donor are separated using PI signal. Overlay of FITC fluorescence intensity for duplicate unprobed (blue and red) vs. duplicate PNA probed samples (green and orange) in each subpopulation (1301 (top), lymphocytes (middle), monocytes (bottom)). B. MESF values of 1301 control cells. MESF values were calculated using MESF beads conjugated to FITC to create a standard curve, which was then used to find the mean telomere content. Upper line is probed and lower line is unprobed. C. MESF values of duplicate samples from all runs with 1301 control cells.
MESF values were proportional with MFI values with 11,532 ± 5,669 for unprobed 1301 samples and 142,714 ± 29,021 for probed 1301 samples across 15 separate runs (Fig. 1B). Across all runs, we observed an intra assay CV of 33.9% for unprobed and 10.7% for probed, while the inter assay CV was 50.9% for unprobed and 21.1% for probed. The intra assay R2 for duplicates was 0.973 with a mean CV of 4.62% (Fig. 1C).
MESF analysis of samples
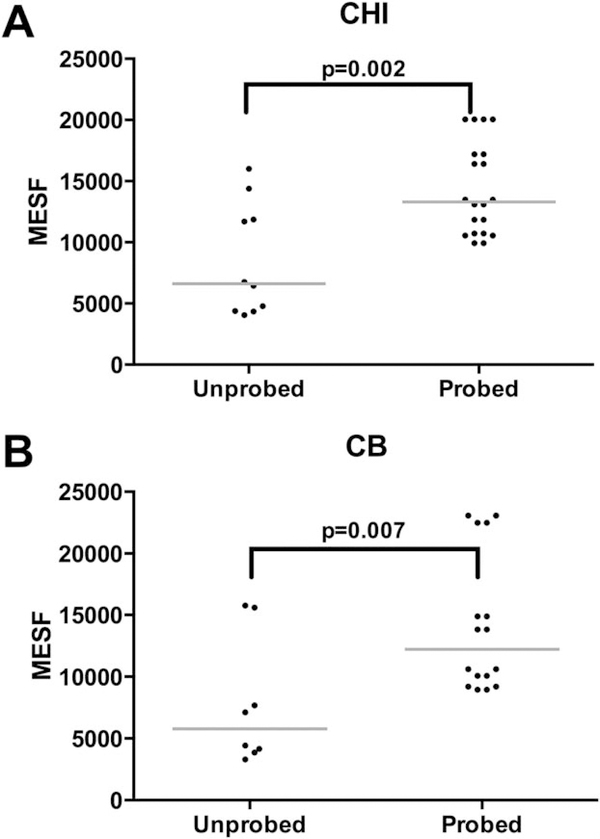
MESF values of CHI and CB control samples also displayed significant differences between probed and unprobed samples. For CHI samples, the median MESF difference was 6,686.3 and the inter assay CV was 53.0% for unprobed and 26% for probed (P= 0.002) (Fig. 2A).
Figure 2.
MESF values of CHI and cord blood controls samples. A. MESF values of CHI control cells with PNA unprobed vs. probed samples. B. MESF values of cord blood control cells with PNA unprobed vs. probed samples.
For CB samples, the median MESF difference was 6,445.8 and the inter assay CV was 66.4% for unprobed and 40.5% for probed (P= 0.007) (Fig. 2B).
The duplicate MTC values generated from all MESF values for all samples, n=53, had a robust CV of 9.3% and a R2 of 0.61 with a telomere range of ~5 to ~16 kb.
MTC by qPCR
Analysis of flow-FISH controls
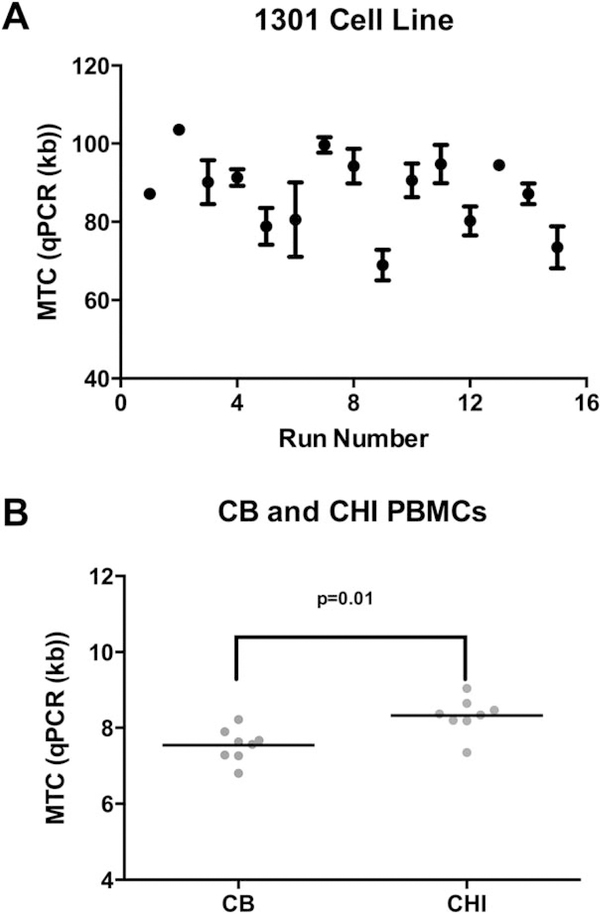
With the Flow-FISH technique, the calculation of telomere content is based on the standard telomere content of the 1301 cell line control. Our estimation of the 1301 telomere content was calculated from repeated measurements by qPCR across 15 different runs (Fig. 3A). With an established 1301 cell line telomere content of 88.9 kb, we normalized our Flow-FISH telomere contents accordingly. The CHI and CB controls that were used for Flow-FISH were also measured by qPCR on seven different runs, averaging at 8.37 and 7.64 kb respectively (P=0.01) (Fig. 3B). The CV across these different runs was 7.47% for CHI and 5.65% for CB.
Figure 3.
Measurements of MTC (kb) using quantitative polymerase chain reaction (qPCR) in 1301 cell line, cord blood, and CHI control cells. A. Average MTC and standard error of the mean measured with qPCR in 1301. (n=15). B. Average MTC in Cord Blood and CHI control cells measured with qPCR. (n=8).
Analysis of samples
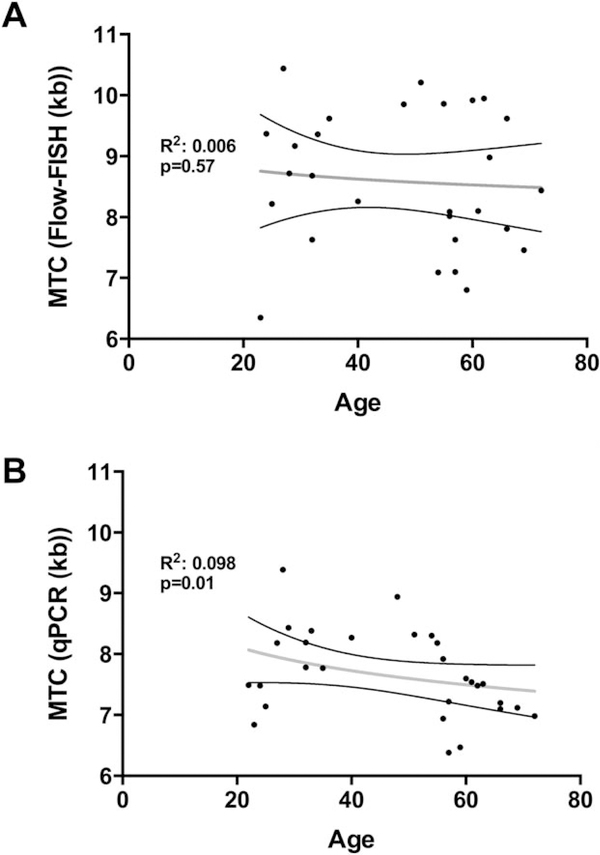
In samples from healthy patients, telomere attrition measurements are associated with aging. To compare both methods, we plotted the MTC of healthy patient samples measured by both methods vs. age (n=37). The linear regression coefficient of age vs. telomere content in kb was calculated with Flow-FISH (Fig. 4A) and with qPCR (Fig. 4B). Coefficient of regression were R2=0.006 and not significant for Flow-FISH and R2= 0.09 (P=0.01) for qPCR.
Figure 4.
Telomere length erosion with aging measured by Flow-FISH and qPCR. A. Linear regression of age vs. telomere content in kb measured with Flow-FISH.B. Linear regression of age vs. telomere content in kb measured with qPCR.
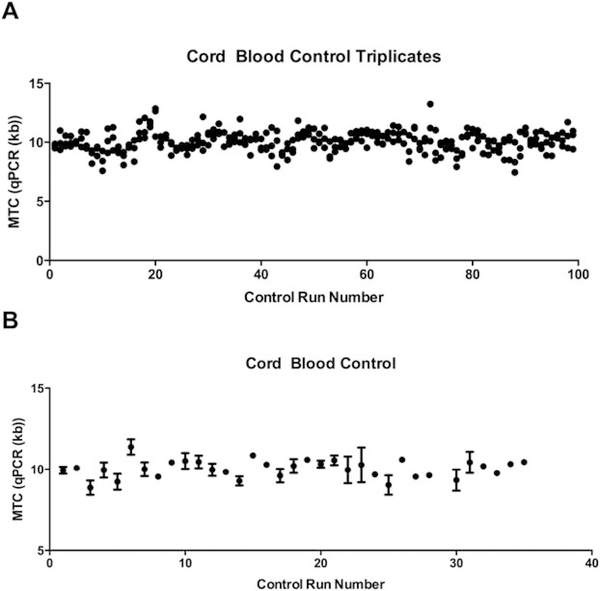
In addition to healthy patient samples, the accuracy of our qPCR measurements were validated by the measurements of three CB control samples on each qPCR run, with each sample run in triplicate (Fig. 5A). Using the data from 35 runs of qPCR, we found the CV of our repeated CB controls to be 5.43% between runs and the CV to be 3.39% within a run. Since the average telomere content of human PBMCs range from 4 to 14 kb by our qPCR methodology, we have accepted an error range of 0.6 kb in our qPCR telomere measurements.
Figure 5.
Cord blood control cells measured using qPCR. A. Mean telomere content in kb of cord blood control samples run in triplicate measured with qPCR. B. Mean telomere content in kb of cord blood control samples per run measured with qPCR.
The MTC was measured in the PBMCs of 21 healthy individuals and 11 patients with short telomere-associated diseases, mainly bone marrow failure patients. The rate of telomere attrition by age, as measured by the slope of telomere content vs. age, was significantly higher in the unhealthy group with an average difference of up to 50% in telomere content between healthy and unhealthy individuals of the same age. As previously reported for both cohorts, we observed a more rapid telomere attrition rate in the younger age range of 10–30 years before a tapering of MTC throughout the older ages.
MTC by TRF2 Measurement
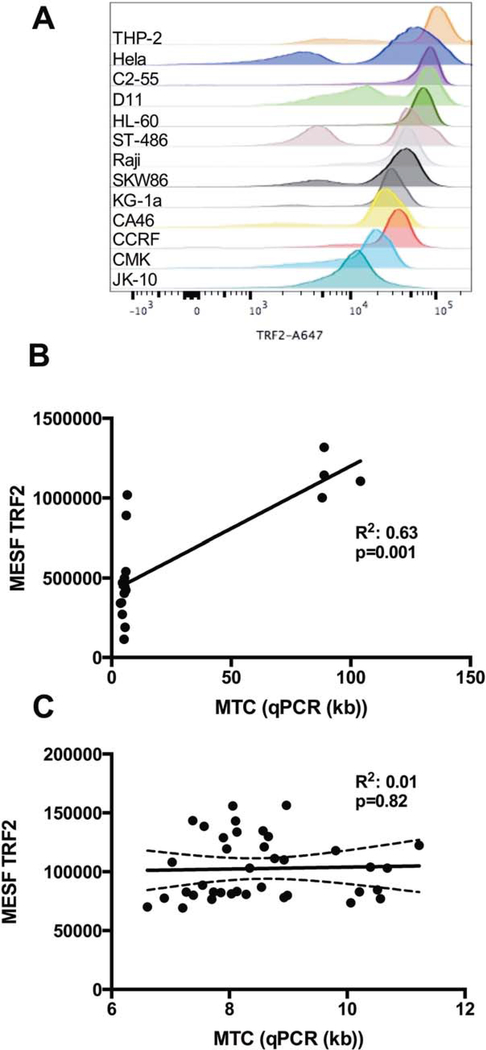
As with the Flow-FISH technique, the 1301 cell line was used for the calculation of MTC, and as a control in every experiment where TRF2 was measured. We first measured TRF2 fluorescence intensity in different cell lines (CA46, CCRF, CMK, C2–55, D11, HL-60, Hela, JK-10, KG1a, Raji, SKW86, ST486, THP2), available in our laboratory and converted them to MESF using Quantum beads without extracellular staining (Fig. 6A). We observed a positive correlation between the MTC measured by qPCR and the MESF of TRF2 with a R2 of 0.62 (P=0.0002) (Fig.6B).
Figure 6.
TRF2 measurements in different cell lines and PBMCs. A. TRF2 measurements of different cell lines, representation of A647 fluorescence intensity (from top to bottom, THP2, Hela, C2–55, D11, HL-60, ST486, Raji, SKW86, KG-1a, CA46, CCRF, CMK, JK-10.) B. Comparison of MTC measured with qPCR vs. MESF of TRF2 of cell lines. C. Comparison of MTC measured with qPCR in PBMC samples vs. MESF of TRF2 for all cell types.
The same PBMCs from healthy donor samples used in our FF and qPCR experiments were then stained for CD3, CD4, CD8, CD19, CD14, and TRF2. There was no correlation between the MTC from qPCR and MESF of TRF2 with a R2 of 0.001 in all samples (Fig. 6C). When looking at different cell subsets as identified by lineage marker expression, there was also no significant correlation between the MESF of TRF2 and MTC, (CD4-T cells R2 of 0.003, CD8-T cells R2 of 0.24, B-cells R2 of 0.27, and monocytes R2 of 0.3) (data not shown). Other than in cell lines, we could not use the MESF of TRF2 as a surrogate for MTC and did not use TRF2 staining further in our method comparison.
Methods Comparison
Comparison of controls
Our control CHI and CB samples were tested on multiple runs for both Flow-FISH and qPCR. Flow-FISH showed a consistently higher mean measurement of 10.29 ± 2.51 kb versus 8.02 ± 0.46 kb for CHI and 9.95 ± 0.73 kb vs.7.84 ± 0.41 kb for CB but the differences were not statistically significant.
Comparison of samples
We quantified telomere content in 11 healthy volunteers, with an age range of 24–69 years old, in three different runs by both qPCR and Flow-FISH. We measured correlation per run, and the R2 value varied from 0.41 to 0.57. The three runs were averaged, and telomere contents were plotted (data not shown). The average R2 value was 0.41. As samples were run for both Flow-FISH and qPCR, ideal telomere content measurements should be identical. Our data showed a consistent linear relationship of a R2 of 0.36 for Flow-FISH and a R2 of 0.34 for qPCR.
In our study, we used qPCR as a reference technique for our telomere content measurements. Nevertheless, for a limited number of PBMC samples (n=11), the measurement was tested via TRF in addition to Flow-FISH and qPCR. We found that each assay provided similar linear regressions in relation to age and telomere content with slopes of m=−0.017, −0.026, and −0.022 respectively (Data not shown). TRF comparison is used as a baseline for the effectiveness of Flow-FISH and qPCR analysis. A direct comparison of telomere contents measured by both Flow-FISH and those by TRF from this cohort and our controls resulted in a slope of m=0.89 with a R2 of 0.43. Conversely, the correlation between qPCR and TRF telomere contents had a slope of m=0.46 with a R2 of 0.34.
DISCUSSION
We compared a quantitative PCR approach, qPCR, and two flow cytometric approaches, Flow-FISH and TRF2 staining for determination of MTC. While the qPCR technique is effective for the rapid processing of samples in mass, it requires a number of standards, quality controls, and calibrations to ensure reproducibility between experiments. There has been difficulty in maintaining reliable qPCR data across research centers due to DNA degradation and differences between single copy loci comparisons. In addition, the qPCR assay assumes a high quality of telomeric DNA across samples. The Flow-FISH method measures the fluorescence intensity of stained telomeres in individual cells, from which both the MTC and its spread can be interpreted from a given sample. The telomere contents of distinct cell populations can also be analyzed by antibody staining for specific surface markers in conjunction with Flow-FISH.
Flow-FISH telomere measurement assays are undoubtedly a very powerful technique (25,28,31), and the use of commercial kits allows for a robust and reproducible method that is easily adaptable compared to an in-house assay. Shelterin is emerging as a protein complex with DNA remodeling activity that acts together with several associated DNA repair factors to change the structure of the telomeric DNA, creating a T loop and protecting chromosome ends. While the stoichiometry of the Shelterin complex would hint at a correlation between the protein content from the complex (TRF2) (32) and the size of telomeres, the measurement of telomere content using this surrogate measurement appears ineffective other than in cell lines. This would likely be due to a variable number of T-loops that can be positive for TRF2 staining and change the fluorescence regardless of telomere length. Thus, the measurement of MTC should be performed directly on genetic material.
Comparatively, data from all techniques performed displayed similar trends when it comes to the same patient samples (33). Both techniques could detect telomeres between 5 and 16 kb, and the correlation measured of 0.41 was similar to previously described measurements by other groups (34). In our study, the assays produced similar results, with Flow-FISH showing consistently higher measurements, but not significantly different.
Flow-FISH measurements used MESF beads, allowing conversion of fluorescence intensity into fluorescent molecules, which is necessary when running experiments on different flow cytometers. In our experiments, the MESF conversion only slightly improved the CV, but all our data were acquired on the same flow cytometer. Indeed, being able to standardize data acquired in different laboratories through the use of MESF is a unique and valuable characteristic of Flow-FISH. The transformation of MFI into MESF allows for standardization across multiple runs, which reduces interassay variations. Some reports showed slightly lower interassay mean CVs with Flow-FISH compared to ours: 3.3% compared to 7.4% for lymphocytes (35,36). On the other hand, the inter-assay and intra-assay mean CVs of qPCR was similar to those reported, at 3.3% compared to 3.13% and 5.4% compared to 5.22% respectively (33).
In comparison to these reported CVs, our assays indicate that qPCR is better optimized for measuring telomeres for a larger patient volume and for greater consistency from run to run. The tightness of repeated measurements and the ability to handle samples in mass are due to the automation of pipetting in qPCR. Automation is more difficult to achieve in Flow-FISH because of the series of different re-suspension steps with varying time lapses in between them. Hence, the same number of samples would require more manpower to measure telomeres via Flow-FISH. Other publications have shown Flow-FISH to be more accurate (15), but an international collaborative study published in 2014 showed that inter-laboratory assays were the biggest variance of the telomere measurements reaching up to 20% (16).
Ultimately, our findings suggest that detection of TRF2 protein does not correlate with MTC, and when measuring telomere content, regardless of technique, a consistent method is vital to ensure accuracy and precision between assays. This is especially important when using these techniques as tools to diagnose very short or very long telomeres at the limit of reliable detection. This can help us to assess the risks associated with extreme telomere lengths and decide the appropriate therapy.
When there were a limited number of samples, TRF analysis was performed, and showed that each assay provided similar linear regressions in relation to age and telomere content. With the ability to analyze whole cells and with the least amount of disruption to cell systems, the Flow-FISH technique is arguably the most biologically embodying in contrast to qPCR and TRF analyses (33). qPCR and TRF analyses require a number of destructive steps before quantification of telomeres can take place. Lysis of cells may expose nucleic materials to DNAses present in the cell itself or introduce damage from chemical lysis buffers. With DNA degradation, these steps may result in longer telomere lengths in qPCR because of increased access to the telomeric regions.
The caveat to flow-FISH also originates from its strengths. Probing of telomeric regions of DNA requires numerous steps for the PNA probe to permeate through the outer cell membrane and the nucleic membrane for hybridization. If the PNA probe is unable to correctly bind to telomeric regions, fluorescence intensities will misrepresent telomere content. qPCR and TRF techniques leave DNA readily exposed to reagents that directly quantify telomeric repeats allowing for less complex mechanistic measurements.
Despite these limitations, each method can be better developed to accurately and precisely measure telomere content in the clinical setting. In the field of bone marrow failure diseases, aplastic anemia, pulmonary hypertension, or simply cellular senescence and aging, telomere size has proven to be a useful biomarker (6,7,9,12–14,37–39). Deciding to use one technique over another should be considered on a laboratory basis, depending on the conditions of that specific laboratory.
Supplementary Material
ACKNOWLEDGMENTS
This work supported by the NIH, NHLBI, and CHI intramural research program.
Footnotes
The authors have no conflict of interest to declare.
LITERATURE CITED
- 1.Moyzis RK. The human telomere. Sci Am 1991;265:48–55. [DOI] [PubMed] [Google Scholar]
- 2.Moyzis RK, Buckingham JM, Cram LS, Dani M, Deaven LL, Jones MD, Meyne J, Ratliff RL, Wu JR. A highly conserved repetitive DNA sequence, (TTAGGG)n, present at the telomeres of human chromosomes. Proc Natl Acad Sci U S A 1988;85: 6622–6626. [DOI] [PMC free article] [PubMed] [Google Scholar]
- 3.Donaldson L, Fordyce C, Gilliland F, Smith A, Feddersen R, Joste N, Moyzis R, Griffith J. Association between outcome and telomere DNA content in prostate cancer. J Urol 1999;162:1788–1792. [PubMed] [Google Scholar]
- 4.Griffith JK, Bryant JE, Fordyce CA, Gilliland FD, Joste NE, Moyzis RK. Reduced telomere DNA content is correlated with genomic instability and metastasis in invasive human breast carcinoma. Breast Cancer Res Treat 1999;54:59–64. [DOI] [PubMed] [Google Scholar]
- 5.Levy T, Agoulnik I, Atkinson EN, Tong XW, Gause HM, Hasenburg A, Runnebaum IB, Stickeler E, Mobus VJ, Kaplan AL, et al. Telomere length in human white blood cells remains constant with age and is shorter in breast cancer patients. Anticancer Res 1998;18:1345–1349. [PubMed] [Google Scholar]
- 6.Calado R, Young N. Telomeres in disease. F1000 Med Rep 2012;4:8. [DOI] [PMC free article] [PubMed] [Google Scholar]
- 7.Calado RT. Telomeres and marrow failure. Hematology Am Soc Hematol Educ Program 2009:338–343. [DOI] [PubMed] [Google Scholar]
- 8.Calado RT, Regal JA, Kajigaya S, Young NS. Erosion of telomeric single-stranded overhang in patients with aplastic anaemia carrying telomerase complex mutations. Eur J Clin Invest 2009;39:1025–1032. [DOI] [PMC free article] [PubMed] [Google Scholar]
- 9.Calado RT, Young NS. Telomere diseases. N Engl J Med 2009;361:2353–2365. [DOI] [PMC free article] [PubMed] [Google Scholar]
- 10.Young NS, Scheinberg P, Calado RT. Aplastic anemia. Curr Opin Hematol 2008;15: 162–168. [DOI] [PMC free article] [PubMed] [Google Scholar]
- 11.Adamski MG, Gumann P, Baird AE. A method for quantitative analysis of standard and high-throughput qPCR expression data based on input sample quantity. PLoS One 2014;9:e103917. [DOI] [PMC free article] [PubMed] [Google Scholar]
- 12.Brummendorf TH, Rufer N, Baerlocher GM, Roosnek E, Lansdorp PM. Limited telomere shortening in hematopoietic stem cells after transplantation. Ann N Y Acad Sci 2001;938:1–7. discussion 7–8. [DOI] [PubMed] [Google Scholar]
- 13.Brummendorf TH, Rufer N, Holyoake TL, Maciejewski J, Barnett MJ, Eaves CJ, Eaves AC, Young N, Lansdorp PM. Telomere length dynamics in normal individuals and in patients with hematopoietic stem cell-associated disorders. Ann N Y Acad Sci 2001;938:293–303. discussion 303–4. [DOI] [PubMed] [Google Scholar]
- 14.Calado RT, Cooper JN, Padilla-Nash HM, Sloand EM, Wu CO, Scheinberg P, Ried T, Young NS. Short telomeres result in chromosomal instability in hematopoietic cells and precede malignant evolution in human aplastic anemia. Leukemia 2012;26:700–707. [DOI] [PMC free article] [PubMed] [Google Scholar]
- 15.Gutierrez-Rodrigues F, Santana-Lemos BA, Scheucher PS, Alves-Paiva RM, Calado RT. Direct comparison of flow-FISH and qPCR as diagnostic tests for telomere length measurement in humans. PLoS One 2014;9:e113747. [DOI] [PMC free article] [PubMed] [Google Scholar]
- 16.Martin-Ruiz CM, Baird D, Roger L, Boukamp P, Krunic D, Cawthon R, Dokter MM, van der Harst P, Bekaert S, de Meyer T, et al. Reproducibility of telomere length assessment: an international collaborative study. Int J Epidemiol 2014; [DOI] [PMC free article] [PubMed] [Google Scholar]
- 17.Kimura M, Stone RC, Hunt SC, Skurnick J, Lu X, Cao X, Harley CB, Aviv A. Measurement of telomere length by the Southern blot analysis of terminal restriction fragment lengths. Nat Protoc 2010;5:1596–1607. [DOI] [PubMed] [Google Scholar]
- 18.Muezzinler A, Zaineddin AK, Brenner H. A systematic review of leukocyte telomere length and age in adults. Ageing Res Rev 2013;12:509–519. [DOI] [PubMed] [Google Scholar]
- 19.Muezzinler A, Zaineddin AK, Brenner H. Body mass index and leukocyte telomere length in adults: a systematic review and meta-analysis. Obes Rev 2014;15:192–201. [DOI] [PubMed] [Google Scholar]
- 20.Young NS. Telomere biology and telomere diseases: implications for practice and research. Hematology Am Soc Hematol Educ Program 2010;2010:30–35. [DOI] [PMC free article] [PubMed] [Google Scholar]
- 21.Scherthan H, Jerratsch M, Li B, Smith S, Hulten M, Lock T, de Lange T. Mammalian meiotic telomeres: protein composition and redistribution in relation to nuclear pores. Mol Biol Cell 2000;11:4189–4203. [DOI] [PMC free article] [PubMed] [Google Scholar]
- 22.Takai KK, Hooper S, Blackwood S, Gandhi R, de Lange T. In vivo stoichiometry of shelterin components. J Biol Chem 2010;285:1457–1467. [DOI] [PMC free article] [PubMed] [Google Scholar]
- 23.Doksani Y, Wu JY, de Lange T, Zhuang X. Super-resolution fluorescence imaging of telomeres reveals TRF2-dependent T-loop formation. Cell 2013;155:345–356. [DOI] [PMC free article] [PubMed] [Google Scholar]
- 24.Cawthon RM. Telomere measurement by quantitative PCR. Nucleic Acids Res 2002;30:e47. [DOI] [PMC free article] [PubMed] [Google Scholar]
- 25.Baerlocher GM, Lansdorp PM. Telomere length measurements in leukocyte subsets by automated multicolor flow-FISH. Cytometry Part A 2003;55A:1–6. [DOI] [PubMed] [Google Scholar]
- 26.Baerlocher GM, Lansdorp PM. Telomere length measurements using fluorescence in situ hybridization and flow cytometry. Methods Cell Biol 2004;75:719–750. [DOI] [PubMed] [Google Scholar]
- 27.Baerlocher GM, Mak J, Tien T, Lansdorp PM. Telomere length measurement by fluorescence in situ hybridization and flow cytometry: tips and pitfalls. Cytometry 2002; 47:89–99. [DOI] [PubMed] [Google Scholar]
- 28.Baerlocher GM, Vulto I, de Jong G, Lansdorp PM. Flow cytometry and FISH to measure the average length of telomeres (flow FISH). Nat Protoc 2006;1:2365–2376. [DOI] [PubMed] [Google Scholar]
- 29.Mendez-Bermudez A, Hills M, Pickett HA, Phan AT, Mergny JL, Riou JF, Royle NJ. Human telomeres that contain (CTAGGG)n repeats show replication dependent instability in somatic cells and the male germline. Nucleic Acids Res 2009;37:6225–6238. [DOI] [PMC free article] [PubMed] [Google Scholar]
- 30.Zhao Y, Sfeir AJ, Zou Y, Buseman CM, Chow TT, Shay JW, Wright WE. Telomere extension occurs at most chromosome ends and is uncoupled from fill-in in human cancer cells. Cell 2009;138:463–475. [DOI] [PMC free article] [PubMed] [Google Scholar]
- 31.Rufer N, Dragowska W, Thornbury G, Roosnek E, Lansdorp PM. Telomere length dynamics in human lymphocyte subpopulations measured by flow cytometry. Nat Biotechnol 1998;16:743–747. [DOI] [PubMed] [Google Scholar]
- 32.Palm W, de Lange T. How shelterin protects mammalian telomeres. Annu Rev Genet 2008;42:301–334. [DOI] [PubMed] [Google Scholar]
- 33.Aubert G, Hills M, Lansdorp PM. Telomere length measurement-caveats and a critical assessment of the available technologies and tools. Mutat Res 2012;730:59–67. [DOI] [PMC free article] [PubMed] [Google Scholar]
- 34.Carbonari M, Tedesco T, Fiorilli M. Correlation between terminal restriction fragments and flow-FISH measures in samples over wide range telomere lengths. Cell Prolif 2014;47:20–27. [DOI] [PMC free article] [PubMed] [Google Scholar]
- 35.Canela A, Vera E, Klatt P, Blasco MA. High-throughput telomere length quantification by FISH and its application to human population studies. Proc Natl Acad Sci U S A 2007;104:5300–5305. [DOI] [PMC free article] [PubMed] [Google Scholar]
- 36.McDonagh A, Fedorova ND, Crabtree J, Yu Y, Kim S, Chen D, Loss O, Cairns T, Goldman G, Armstrong-James D, et al. Sub-telomere directed gene expression during initiation of invasive aspergillosis. PLoS Pathog 2008;4:e1000154. [DOI] [PMC free article] [PubMed] [Google Scholar]
- 37.Brummendorf TH, Holyoake TL, Rufer N, Barnett MJ, Schulzer M, Eaves CJ, Eaves AC, Lansdorp PM. Prognostic implications of differences in telomere length between normal and malignant cells from patients with chronic myeloid leukemia measured by flow cytometry. Blood 2000;95:1883–1890. [PubMed] [Google Scholar]
- 38.Calado RT, Brudno J, Mehta P, Kovacs JJ, Wu C, Zago MA, Chanock SJ, Boyer TD, Young NS. Constitutional telomerase mutations are genetic risk factors for cirrhosis. Hepatology 2011;53:1600–1607. [DOI] [PMC free article] [PubMed] [Google Scholar]
- 39.Calado RT, Regal JA, Hills M, Yewdell WT, Dalmazzo LF, Zago MA, Lansdorp PM, Hogge D, Chanock SJ, Estey EH, et al. Constitutional hypomorphic telomerase mutations in patients with acute myeloid leukemia. Proc Natl Acad Sci U S A 2009; 106:1187–1192. [DOI] [PMC free article] [PubMed] [Google Scholar]
Associated Data
This section collects any data citations, data availability statements, or supplementary materials included in this article.


