Abstract
In the infectious P22 bacteriophage, the pack- aging of DNA into the initially formed procapsid triggers a remarkable morphological transformation where the capsid expands from 58 to 62 nm. Along with the increase in size, this maturation also provides greater stability to the capsid and initiates the release of the scaffolding protein (SP).2,4 In the P22 virus-like particle (VLP), this transformation can be mimicked in vitro by heating the procapsid particles to 65 °C or by treatment with sodium dodecyl sulfate (SDS).5,6 Heating the P22 particles at 65 °C for 20 min is well established to trigger the transformation of P22 to the expanded (EX) P22 VLP but does not always result in a fully expanded population. Incubation with SDS resulted in a >80% expanded population for all P22 variants used in this work. This study elucidates the importance of the stoichiometric ratio between P22 subunits and SDS, the charge of the headgroup, and length of the carbon chain for the transformation. We propose a mechanism by which the expansion takes place, where both the negatively charged sulfate group and hydrophobic tail interact with the coat protein (CP) monomers within the capsid shell in a process that is facilitated by an internal osmotic pressure generated by an encapsulated macromolecular cargo.
INTRODUCTION
To design and synthesize new biomaterials, with control over structure and function, scientists often look to biology for inspiration. A recurring theme in biological systems is the concept of compartmentalization, where a well-defined barrier controls the partitioning and transport of (macro) molecules, as well as providing protection for the encapsulated materials within the barrier.7 The idea of compartments with a protective barrier has been used in the bioinspired design and construction of cargo/drug delivery systems.8,9 Viruses are compelling examples of nanocompartments found in nature where they encapsulate and protect their genomic material inside a highly organized protein shell. In the absence of genetic material, virus-like particles (VLPs) can be thought of as nanoscale containers with hollow interior cavities capable of housing non-native guests.10
VLPs derived from the Salmonella typhimurium bacteriophage P22 self-assemble into T = 7 icosahedral capsids from 420 subunits of the coat protein (CP) and 100−300 subunits of the scaffolding protein (SP).11,12 The 33.6 kDa scaffolding protein templates the assembly of the capsid via noncovalent interactions4,13,14 with the 46.6 kDa CP to form the highly regular capsid. The 303 amino acid long SP can be truncated at the N-terminus to an essential helix−loop−helix motif necessary for interaction with CP.15 By genetic fusion to either the N- or C-termini of the truncated SP, non-native cargo proteins have been encapsulated through directed self-assembly of the VLP, which has led to the development of catalytically active nanoreactors and immune stimulatory nanoparticles.16–21 Recently, it has been shown that individual P22 VLPs can also be used as building blocks to form 2-D and assemblies of catalytically active nanoreactors.22–24
A very remarkable attribute of P22 VLPs is their ability to undergo morphogenesis in response to external stimuli with four different and unique morphologies that can be accessed. During the assembly process of the P22 VLP, the capsid initially forms into a nearly spherical procapsid (PC), with up to 300 copies of the scaffolding protein (SP) encapsulated within the capsid. The scaffolding proteins can be removed yielding the empty shell (ES) morphology. In the infectious P22, packaging of DNA results in maturation of the virus, leading to an expanded (EX) morphology of the capsid; this morphogenesis can be recapitulated in vitro by heating either PC or ES to 65 °C.1,5 The PC structure is approximately 56 nm in diameter, containing roughly 3 nm pores, and upon expansion, forms the EX morphology with a diameter of 62 nm and decreased pore size.25 The morphogenesis of the capsid to the EX results in a more angular and faceted structure, where the icosahedral symmetry of the capsid is evident. Additionally, the CP undergoes a conformational rearrangement, with loss of the SP binding site and as a result the SP is not present in the EX morphology.14,25–27 Further heating the capsid to 75 °C results in the loss of the 12 icosahedral pentamers to yield the last morphology, a structure affectionately known as a wiffe- ball (WB), having large 10 nm pores at the 5-fold vertices and an overall diameter of 62 nm. The PC and EX morphologies are thus biologically relevant intermediates in the maturation of the P22 bacteriophage, but the WB, while not observed in the phage biology, provides an unique and porous morphology and is the most thermodynamically stable of the structures.1,2
The directed assembly of P22 has been a productive avenue of investigation and led to the controlled encapsulation of a number of protein and polymeric materials.16–20,28–30 The need to heat the sample to achieve expansion precludes the use of thermally sensitive proteins in this morphogenesis approach. In addition, the effciency of thermal expansion of the PC to the EX morphology has been found to be highly construct specific and often results in a mixed population of PC and EX.20 As a result, different variants sometimes require slightly different temperatures to achieve full conversion to the EX, which can lead to a further potential complication, such as the loss of some pentamers en route to the WB structure.31
Room temperature surfactant-induced expansion of P22 has previously been reported in the literature; however, there are significant inconsistencies in the reported methods.4,6,14,32 Here, we look to clarify the current methodology and mechanisms for this chemically triggered morphogenesis and importantly provide an approach that allows us to access the EX morphology for a wide range of P22 variants under chemically mild, room temperature conditions. Previous work has shown that thermal expansion is inhibited at high ionic strength, suggesting electrostatic repulsion as the origin of the thermal expansion.26,27 Probing the mechanism for expansion using the surfactant sodium dodecyl sulfate (SDS), we provide a rationale for the critical role of electrostatics, hydrophobic interactions, and osmotic pressure in the mechanism of expansion.
METHODS
Protein Expression and Purification: P22 wtSP, P22 AdhD- SP, P22 GFP-SP, and P22 CelB-SP.
E. coli (strain BL21) were transformed with expression vectors containing the specified genes (Table 1). Constructs were grown on LB medium at 37 °C in the presence of specified antibiotic to maintain selection for the plasmid. Expression of the genes was induced by the addition of isopropyl β-D- thiogalactopyranoside (IPTG) or L-arabinose to a final concentration of 0.5 mM once the cells reached early log phase (OD600 = 0.5−0.7). Cultures were grown for 4 h after the addition of IPTG (or arabinose), then the cells were harvested by centrifugation, and cell pellets were stored at −80 °C overnight. In the case of P22 AdhD-SP, induction with L-arabinose (induction of AdhD-SP) once the cells reached the early log phase was followed by induction with IPTG (induction of CP) 4 h later. Cell pellets were resuspended in Lysis buffer (50 mM sodium phosphate, 100 mM sodium chloride, pH 7.0) and stored at −80 °C. Cells were thawed and incubated with lysozyme, DNase, and RNase for 30 min at room temperature. The cell suspension was lysed by sonication on ice for a total of 2 min at 50% amplitude. Cell debris was removed by centrifugation at 12 000g for 45 min at 4 °C using a Sorvall Legend XTR centrifuge with the F15−8 × 50cy FIBERLite rotor. The supernatant was decanted and spun an additional 45 min at 12 000g to remove any excess cellular debris. P22 was purified from the supernatant by ultracentrifugation at 45 000 rpm for 50 min using the F50L-8 × 39 rotor over a 35% (w/v) sucrose cushion. The resulting viral pellet was resuspended in PBS (50 mM sodium phosphate, 25 mM sodium chloride, pH 7.0) and then purified by size exclusion chromatography on a S-500 Sephadex (particle size 25−75 μM; GE Healthcare Life Sciences) size exclusion column using BioRad Biologic Duoflow FPLC at a flow rate of 1 mL/ min. Fractions taken from SEC containing P22 were concentrated by ultracentrifugation at 45 000 rpm for 50 min, and the resulting viral pellet was resuspended in an adequate volume of PBS (1 mL). The concentration of the P22 construct was determined by UV absorption at 280 nm using a molar extinction coeffcient of 210 000 M−1 cm−1 calculated using previously developed methodology.21 The presence of each gene product was verified by denaturing SDS-PAGE.
Table 1.
Growth Conditions for P22 Variants
| construct | vector | antibiotic | induction reagent | |
|---|---|---|---|---|
| 1 | P22 wtSP | pET 11a | Amp | IPTG |
| 2 | P22 AdhD-SP | pRSF-Duet (CP) | Kan | IPTG |
| pBad (AdhD-SP) | Amp | L-arabinose | ||
| 3 | P22 GFP-SP | PRSF Duet | Kan | IPTG |
| 4 | P22 CelB-SP | pETDuet | Amp | IPTG |
Protein Expression, Purification and in Vitro Assembly of: P22-SP141.
E. coli (strain BL21) were transformed with expression vectors containing the gene for SP-141. Constructs were grown on LB medium at 37 °C in the presence of kanamycin antibiotic to maintain selection for the plasmid. Expression of the genes was induced by the addition of IPTG to a final concentration of 0.5 mM once the cells reached the early log phase (OD600 = 0.5−0.7). Cultures were grown for 4 h after the addition of IPTG, then the cells were harvested by centrifugation, and cell pellets were stored at −80 °C overnight. Cell pellets were resuspended in Lysis buffer (50 mM sodium phosphate, 100 mM sodium chloride, pH 7.0) and stored at −80 °C. Cells were thawed and incubated with protease inhibitor, lysozyme, DNase, and RNase for 30 min at room temperature. The cell suspension was lysed by sonication on ice for a total of 2 min at 50% amplitude. Cell debris was removed by centrifugation at 12 000g for 45 min at 4 °C using a Sorvall Legend XTR centrifuge with the F15−8 × 50cy FIBERLite rotor. The supernatant was decanted and spun an additional 45 min at 12 000g to remove any excess cellular debris and purified over a 5 mL Roche Ni-NTA column with a flow rate of 2 mL/min. The protein was eluted using an imidazole gradient (10−500 mM), and appropriate fractions were collected. The presence of the SP141 gene product was verified by denaturing SDS-PAGE. P22 ES and SP141 were dialyzed separately into buffer containing 3 M GuHCl, 50 mM Tris-HCl, 25 mM NaCl, 2 mM EDTA, 3 mM β- mercaptoethanol, and 1% glycerol. In 3 M GuHCl, the empty shell was disassembled into individual CP subunits. CP and SP-141 were combined in a 1:1 molar ratio, and the GuHCl concentration was adjusted to 1.5 mM using the assembly buffer (50 mM Tris-HCl, 25 mM NaCl, 2 mM EDTA, 3 mM β-mercaptoethanol, and 1% glycerol). The mixture was dialyzed into the assembly buffer over 20 h, after which it was centrifuged at 20 000g for 10 min to remove any protein aggregates. P22 VLPs were recovered by ultracentrifugation at 45 000 rpm for 50 min, and the resulting viral pellet was resuspended in an adequate volume of PBS (1 mL).
Size Exclusion Chromatography with Multiangle Light Scattering and Refractive Index Detection.
Samples were separated over a WTC-200S 5 μM, 2000 Å, 7.8 mm × 300 mm (Wyatt Technologies) size exclusion column utilizing an Agilent 1200 HPLC at a flow rate of 0.7 mL/min in 50 mM phosphate, pH 7.2 buffer containing 100 mM sodium chloride and 200 ppm sodium azide. Samples of 25 μL were injected onto the column, and the total run time was 30 min. Samples were detected using an UV−vis detector (Agilent), a Wyatt HELEOS multiangle laser light scattering (MALS) detector, and an Optilab rEX differential refractometer (Wyatt Technology Corporation). The number-average molecular weight, Mn, was calculated with Astra 5.3.14 software (Wyatt Technology Corporation) based on the molecular weight distribution. The following equation was used to calculate the molecular weight
where R(θ) is the excess Rayleigh ratio from the solute, n0 is the solvent refractive index, NA is Avogadro’s number, λ0 is the vacuum wavelength of incident light, is the specific refractive index increment in mL/g (for proteins: 0.1850), M is the molar mass in g/ mol, c is the solute concentration (w/v), and P(θ) is the form factor relating to the angular variation and mean square radius.
Transmission Electron Microscopy.
Samples (10 μL, 0.1 mg/ mL protein) were applied to Formvar-coated grids (Electron Microscopy Sciences) and incubated for 5 min, and excess liquid was wicked away with filter paper. Grids were then washed with 10 μL of distilled water, wicking away liquid shortly after the addition with filter paper. Grids were then stained with 5 μL of 1% uranyl acetate, and excess stain was wicked away with filter paper. Images were taken on a JEOL 1010 transmission electron microscope at an accelerating voltage of 100 kV.
Agarose Gel Shift Assay.
Samples were mixed with loading buffer (40% glycerol, bromophenol blue) and subsequently loaded into their respective well. Gel shift assays were run on a 0.8% agarose gel (w/v) at a constant voltage of 75 V for 2 h. The running buffer was a 40 mM Tris, 5 mM acetate, 1 mM EDTA, pH 8.2 solution. Gels were stained with Coomassie blue for 30 min and subsequently rinsed with deionized water and destained. Images were collected using a UVP MultDoc-IT Digital Imaging System.
P22 Expansion to WB and Heat EX Morphologies.
P22 capsids were expanded to the WB and EX morphologies by heating in a 75 or a 65 °C water bath for 25 min, respectively, and then cooled to room temperature. Samples were centrifuged at 17 000g for 5 min using the Sorvall Legend Micro 17 centrifuge to remove aggregated protein and then ultracentrifuged at 45 000 rpm using the Sorvall WX Ultra Series centrifuge and the F50L-8 × 39 rotor to concentrate capsids and to remove unassembled protein subunits.
Stoichiometric dependence curve fitting data was fit using a user- defined piecewise linear regression model in Igor pro 6.37. The model that fits two lines to different sections of data is given below
where m1 and m2 are the slope values of two linear functions, and xb and yb are the intersection coordinates, where the linear function changes over different ranges of x. Data were fit systematically to ensure reasonable initial guesses as input parameters.
Multipeak Gaussian Fitting for Densitometry Analysis.
The densitometry plot provided by the relative intensity of each lane was fit using a Igor pro 6.37 built-in Gaussian fit function using the equation below
where A is the height of a specific peak, x0 is the relative position of the peak center, and width is the RMS Gaussian width.
Expansion Using SDS.
All SDS and protein stock solutions were prepared with 50 mM sodium phosphate, pH 7.0 buffer containing 100 mM sodium chloride, and all expansion reactions were carried out at room temperature. To ensure that P22 solutions of all of the constructs contained mostly well-formed particles, an extra purification step was done, in which all variants were ultracentrifuged through a 12−14% (w/w) CsCl gradient. For large-scale reactions done to obtain characterization of the EX species (SEC-MALS and TEM), typically 4 mg of concentrated protein solution (>10 mg/mL) was added to a buffer solution containing SDS for an overall volume of 8 mL. The quantity of protein and volume can be altered, as long as the overall concentration in the reaction vessel is 0.5 mg/mL and 0.1% (w/v) (3.5 mM) for the P22 protein and SDS, respectively. Incubation times varied for all constructs; wtP22 required 90 min incubation at room temperature; P22 AdhD-SP, 15 min at room temperature; P22 GFP-SP and P22 SP-141, 10 min at room temperature; and P22 CelB-SP, 5 min at room temperature. In order to quench the reaction, the reaction volume was doubled and a 10% sucrose cushion was deposited at the bottom of a centrifugation vial. The sample was ultracentrifuged through a sucrose cushion (10%) at 45 000 rpm for 50 min using the F50L-8 × 39 rotor, resuspended, and pelleted by ultracentrifugation (45 000 rpm for 50 min) once more to remove residual SDS. In order to determine the effciency of centrifugation for the removal of SDS, a potassium salt precipitation assay was used.33 A solution of 4 M KCl was prepared, and an adequate amount was added to the P22 solution previously expanded with SDS (final concentration of KCl 0.4M), resulting in no visible precipitate formation after mixing and subsequent centrifugation. In controls with 3.5 mM SDS, a potassium salt precipitate formed immediately upon addition of KCl (Figure S13). In order to determine an optimal incubation period, small-scale reactions were performed. The total volume was held constant at 20 μL. Typically, 5 μL of protein was added to buffer containing SDS, for a final protein concentration to be 0.5 mg/mL (unless otherwise stated), and the final SDS concentration was 3.5 mM (unless otherwise stated). The incubation time started as soon as the protein was added to the SDS containing buffer; the time stopped when the samples were loaded onto a native agarose gel, and a voltage was applied. For samples containing different concentrations from the ones mentioned above, the protocol remained the same, but the final concentration of either protein or SDS was higher or lower.
Samples Incubated with 1-Dodecanol, DTAB, SHS, and SOS.
All conditions and methodology were the same as the ones used for the SDS protocol. Unless otherwise stated, the protein concentration in all samples was 0.5 mg/mL. The concentration of surfactant was varied in accordance with the values displayed in the figures. For SHS, only the large-scale reaction was shown due to the surfactant interacting with the gel. However, both incubation time and concentration were tested, yielding the same results. The cmc values for all surfactants were as follows: SDS, 0.17% (w/v) or 6 mM in buffer (provided by Fisher Scientific and Sigma-Aldrich); SOS, 3.2% (w/v) or 136 mM in water; SHS, 0.02%−0.15% (w/v) or 0.58 mM- 4.25 mM; DTAB, 0.34% (w/v) or 11 mM in buffer; and 1-dodecanol does not have reported cmc values, but we were within the solubility limit.34,35 Additionally, 1-dodecanol was found as an impurity in 0.1− 1% of all aqueous SDS solutions.36 To keep consistent with concentrations used for the SDS expansion, the same concentration ranges were displayed in this work. It should be mentioned, that the presence of the P22 particles in the solutions will also affect the cmc, therefore these are just approximations.
CsCl Gradient Purification.
VLPs were separated from contaminants according to their buoyant density by sedimentation in CsCl gradients. CsCl solutions were prepared in 50 mM sodium phosphate, pH 7 buffer containing 100 mM sodium chloride at concentrations of 1.2 and 1.4 g/mL. The 1.4 g/mL solution was deposited below the 1.2 g/mL solution in centrifugation tubes compatible with Thermo Fisher swinging bucket rotor TH-641. Using the Biocomp Gradient Master 108 preset setting, a 12−14% (w/w) CsCl gradient was prepared. A concentrated solution of protein (>8 mg/mL 750 μL) was deposited in each centrifugation tube containing the gradient and balanced. The tubes were centrifuged at 38 000 rpm for 2 h. Afterward, a band was formed in the region where the particles were deposited. Fractions were collected from that band and used for further experimentation.
Samples Incubated with Lipids: DLPC, DLPA, DPPE, DOPA, DPPC, and DOPC.
Unless otherwise stated, all reactions carried out using lipids were subjected to the same conditions as the SDS methodology. However, since these lipids are not readily solubilized in water, the stock solutions were prepared as follows: 40 mM or 2.5% (w/v) DLPA in 9:1 chloroform: acetic acid mixture; 32 mM or 2% (w/v) DLPC in 100:30:10:2.5 chloroform: methanol: acetic acid: water mixture; and DPPE, DOPA, DPPC, and DOPC with concentrations of 14, 13, 14, and 13 mM, respectively (all corresponding to 1.0% (w/ v)) in chloroform. For DLPA, the concentrations varied between 1.3 and 4.0 mM (0.08−0.25% (w/v)), where the total volume of the mixture added to buffer was 2 μL. For the samples where less than 0.25% was used, the volume was brought up to 2 μL using the solvent mixture. In order to further dilute the lipid prior to introducing it to the P22 particles, the lipid mixture was added to 8 μL of buffer and then added to the protein solution containing 1.0 mg/mL concentration, to obtain a final protein concentration of 0.5 mg/ mL. Other than the lipid concentrations, the rest of the protocol was the same for all other lipids. For DLPC, the concentrations varied between 0.8 and 3.2 mM or 0.05−0.2% (w/v), where the total volume of the mixture added to buffer was 2 μL. For DPPE, DOPA, DPPC, and DOPC, the concentrations were 1.4, 1.3, 1.4, and 1.3 mM, respectively (all corresponding to 0.1% (w/v)).
ES Prep for CP.
P22 PCs were incubated on a rocker in 0.5 M GuHCl for 1 h at 4 °C. Capsids were pelleted in an ultracentrifuge at 45 000 rpm (F50L-8 × 39 rotor) for 50 min, followed by resuspension in PBS and then incubation in 0.5 M GuHCl for 1 h. This extraction process was repeated a total of four or five times to remove SP, which was verified by SDS-PAGE. ES were dissociated into free CP by mixing ES and 6 M GuHCl in a 1:1 ratio for a final concentration of 2 mg/mL CP in 3 M GuHCl.
Calculating Theoretical Volume of SP-wt and SP-141.
The average globular protein has an approximated volume of 0.73 cm3/g. Multiplying this value by the MW of the respective protein and dividing by Avogadro’s number provides the theoretical volume per molecule. The calculated values for SP-wt and SP-141 are 40.6 and 21.6 nm3, respectively.
The osmotic pressure of wtSP, SP-141, and AdhD-SP was calculated using the equation
where pHS is the osmotic pressure, with respect to the hard sphere contribution; kB is the Boltzmann constant; T is equal to 300 K; ρ is the number density of cargo particles inside; and η is the ratio between the volume of cargo to the total volume available in the capsid. Here, the volume of the cargo is determined by N × 4/3 π RHS3, where RHS3 refers to the hard sphere radius. Since there is currently no data on the AdhD cargo, we compared the relative dimensions of the EGFP (PDB: 2YOG) and alcohol dehydrogenase D (homology model Figure S10). EGFP has a volume of 55.4 nm3, and AdhD is 61.2 nm3.
Monitoring Activity of P22 SP-AdhD and SP-CelB.
Activity assays were carried out on an Agilent 8454 UV−vis spectrophotometer and VWR water bath for temperature control. Cuvettes were preheated to 60 °C using a cuvette holder, and a water bath was used to preheat all buffers and solutions used for monitoring enzymatic activity. The buffer used for the AdhD study was 50 mM sodium phosphate, 100 mM NaCl, pH 7.0; and for CelB, it was 60 mM sodium citrate, pH 7.0 buffer, with a total reaction volume of 100 μL for both. For the AdhD activity assay, P22 PC and P22 EX, both encapsulating SP-AdhD cargo, were adjusted to a concentration of 650 nM of encapsulated SP-AdhD, and the substrate (acetoin) concentration was 100 mM.20 The starting concentration of NADH was 257 μM (ε340 = 6.22 mM−1cm−1). For the CelB activity assay, P22 PC and P22 EX, both encapsulating SP-CelB Cargo, were adjusted to a concentration of 2 μM of encapsulated SP-CelB, and the substrate (PNPG) concentration was 1.5 mM.37
RESULTS
Expansion of P22 VLPs Using Heat.
In the infectious P22 bacteriophage, the packaging of DNA into the initially formed PC form triggers a remarkable morphological trans- formation, where the capsid expands from 56 to 62 nm and becomes more angular.12,14 Along with the increase in size, this maturation also provides greater stability to the capsid and initiates the release of SP.38 In the P22 virus-like particle, this transformation can be mimicked in vitro by heating the procapsid particles to 65 °C or, as previously mentioned, by treatment with sodium dodecyl sulfate (SDS).1,4–6,13,32
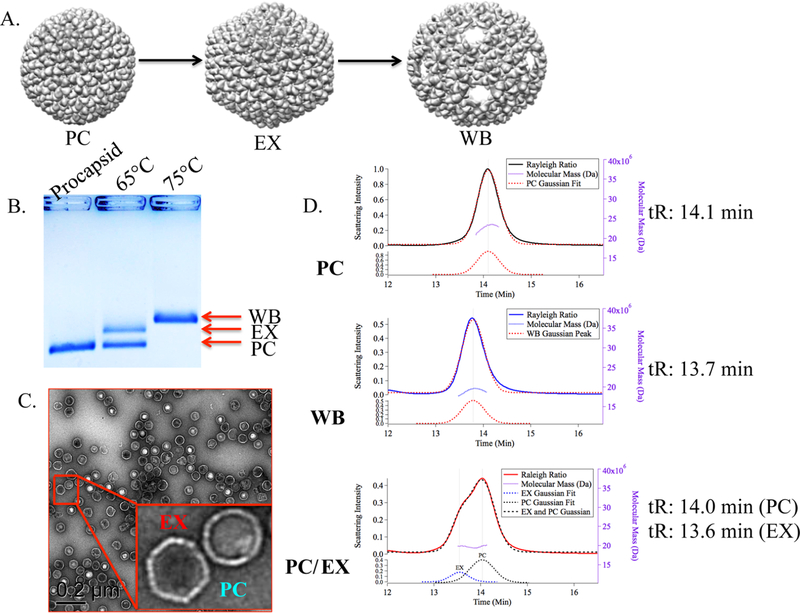
Heating the P22 PC at 65 °C for 20 min is well established in the literature as a means to trigger the transformation of PC to the EX P22 VLP. However, we have found that this method does not always result in a fully expanded population of particles and, in some instances, results in a mixture of PC and EX forms, as demonstrated in the sample shown in Figure 1. Increasing the temperature to 75 °C leads to expansion as well as a loss of pentamer units, forming the WB structure, which contains 10 nm pores at each of the 12 5-fold vertices.1,2 As shown in Figure 1B, a purified sample of wtP22 VLP was heated to either 65 or 75 °C and analyzed by native agarose gel electrophoresis, which is an effective and straightforward way to screen these morphological changes where differences in size and electrophoretic mobility allow analysis and comparison of the morphological species present. The sample heated to 75 °C displayed complete conversion to the WB morphology, whereas the sample heated to 65 °C showed only about 50% conversion to EX P22, with half the population remaining in the PC form. Transmission electron microscopy (TEM) of this sample (Figure 1C) confirmed the mixed population, with both PC and EX particles visible. Multiangle light scattering, coupled with size exclusion chromatography analysis (SEC-MALS), also supported this observation. The PC sample eluted as a single peak with an Mw of 23.5 ± 0.02 MDa and an Rg of 25.9 ± 0.02 nm. The PC sample heated to 65 °C exhibited two peaks on SEC. One peak exhibited the same elution time (14.1 min), Mw (19.9 ± 0.08 MDa), and Rg (26.3 ± 0.3 nm) as the PC morphology, while the other peak was consistent with the EX morphology (Mw of 19.8 ± 0.08 MDa, Rg of 28.5 ± 0.1 nm). Analysis of the sample heated to 75 °C was consistent with the WB morphology (Mw of 19.1 ± 0.07 MDa, Rg of 27 ± 0.3 nm). Thus, this sample is an example of the incomplete transition of PC to EX that can be observed during the thermal transformation process, an impediment to the effective implementation of the P22 EX morphology.
Figure 1.
Characterization of P22 after heat treatment. (A) Representation of the three possible morphologies of the P22 VLP, Procapsid (PDB, 2XYY), EX (PDB, 5UU5), and WB (PDB, 3IYH).1,2 (B) Native agarose gel depicting the relative electrophoretic mobility of the PC, EX, and WB P22 species. The lane labeled as 65 °C shows two populations corresponding to the PC and EX morphologies. (C) TEM of the heat expanded sample showing particles consistent with the PC and EX structures. (D) SEC-MALS chromatograms of the 3 different samples (PC, WB, and heat- treated PC) supporting the observation that the heat-expanded sample has two populations, with retention times (tR) consistent with the PC and WB morphologies.
Expansion of P22 VLPs Using SDS.
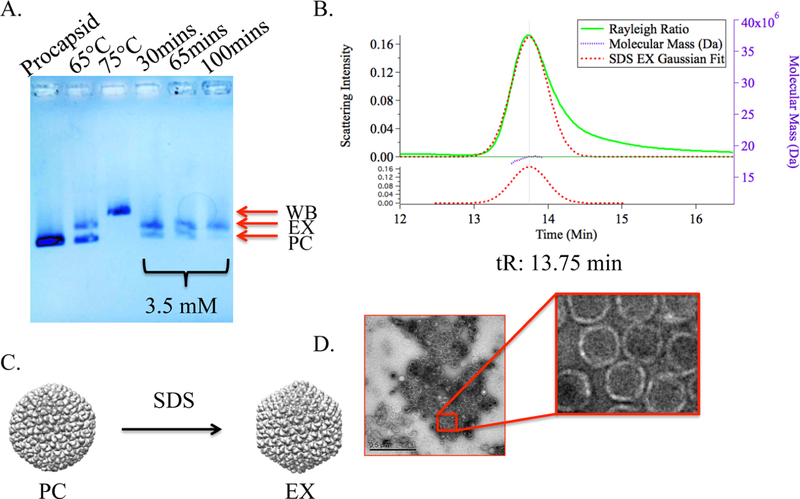
Protocols using SDS: for the transformation of PC to EX have been reported in the literature, although conditions for this range from 0.1% (w/v) SDS to 0.8% (w/v) SDS (3.5−28 mM).4,6,32 We investigated this approach as a means to obtain a more complete transformation of PC to EX. Incubating P22 wtSP VLPs with 3.5 mM SDS for 90 min resulted in the formation of >80% EX particles, calculated using densitometry measure- ments of native agarose gel electrophoresis, with only a trace of the PC form remaining (Figures 2A and S1). When interrogated by SEC-MALS, the elution profile of this EXSDS P22 sample correlated well with that expected for the expanded morphology (Figure 2B). Root mean squared (rms) and hydrodynamic radii (Rh) of the EXSDS indicated a 10% increase in diameter from the 51.8 ± 0.2 nm P22 wtSP PC to the 57.2 ± 0.8 nm EX P22 wtSP for the rms measurements, and from 51.3 ± 0.09 to 55.5 ± 0.4 nm for the Rh data. These data support the observation and analysis of the native agarose gel electrophoresis. TEM analysis of the EXSDS P22 confirmed that the particles remained assembled and are morphologically consistent with empty icosahedral EX VLPs (Figure 2D).
Figure 2.
Characterization of the SDS-treated P22 particles. (A) Native agarose gel showing the relative electrophoretic mobility of the PC, partial EX (heat), WB, and EX (SDS) P22 species with varying incubation times. At 100 min, there is only a band corresponding to the EX particles, suggesting almost complete expansion to EX. (B) SEC-MALS chromatogram of the SDS expanded sample (EXSDS) with a retention time (tR) consistent with the EX and WB morphologies. (C) Graphic representation of the P22 PC (PDB, 2XYY) morphological transformation to the EX (PDB, 5UU5). (D) TEM image of the SDS expanded sample with particles exhibiting morphology of the EX.
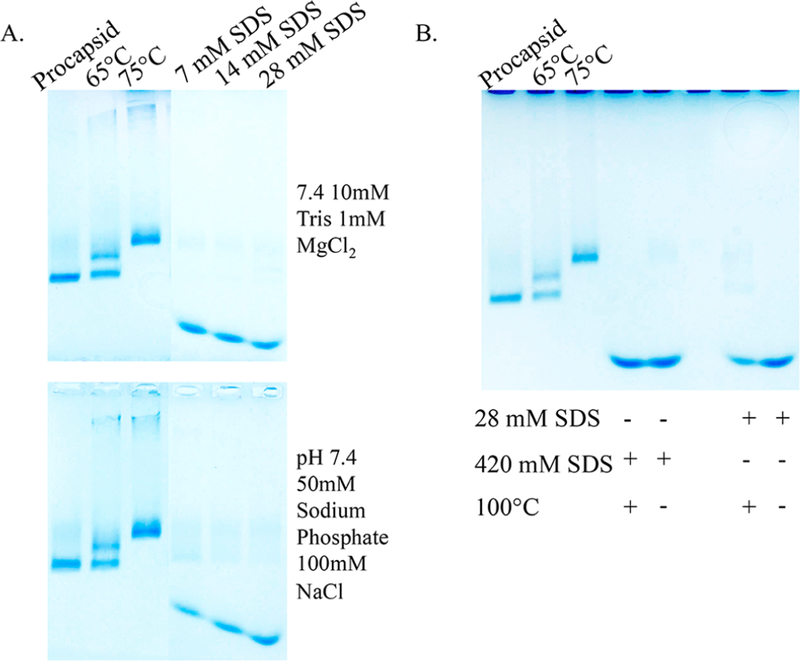
Increasing the concentration of SDS in the range of 7−28 mM, while maintaining the concentration of protein constant, resulted in a loss of the band corresponding to the PC structure, as monitored by native agarose gel (Figure 3). These results were consistent when using either Tris buffer (10 mM, 1 mM MgCl2, pH 7.4) or phosphate buffer (pH 7.4 50 mM sodium phosphate, 100 mM NaCl) (Figure 3A), and the loss of the PC band coincided with the formation of a new band migrating significantly lower in the gel. This band likely corresponds to disassembled subunit and comigrates with a subunit band formed after standard treatment with very high SDS concentration, as used in a denaturing SDS electrophoresis (12% SDS or 420 mM, with and without heating) (Figure 3B). Thus, at SDS concentrations of 7 mM or higher, the capsids undergo substantial disassembly. Therefore, it is likely that the 28 mM SDS reported in the literature is an error, and the experimental results are more consistent with an SDS concentration of 0.08% (w/v) or 2.8 mM.4,32
Figure 3.
Native agarose gels of P22 wtSP particles incubated with varying concentrations of SDS. (A) Increasing the SDS concentrations from 7 to 28 mM causes the capsid to disassemble as indicated by the bands containing species with higher electrophoretic mobility compared to the control bands (PC, 65 °C, and 75 °C) (Top) In Tris buffer. (Bottom) In phosphate buffer. (B) Comparison of samples exposed to standard protein denaturing conditions (420 mM SDS, 100 °C) to the 28 mM SDS expansion conditions. The migration of the bands is the same in all cases, suggesting capsid disassembly upon exposure to 28 mM SDS.
Probing the Mechanism for SDS Expansion.
In order to gain insight into the mechanism of P22 VLP expansion with the use of the SDS surfactant, we tested several different conditions, including the stoichiometry of capsid and surfactants, variations in the charge of the surfactant head- group, while maintaining a constant hydrocarbon tail length, and last, varying the length of the hydrocarbon tail itself.
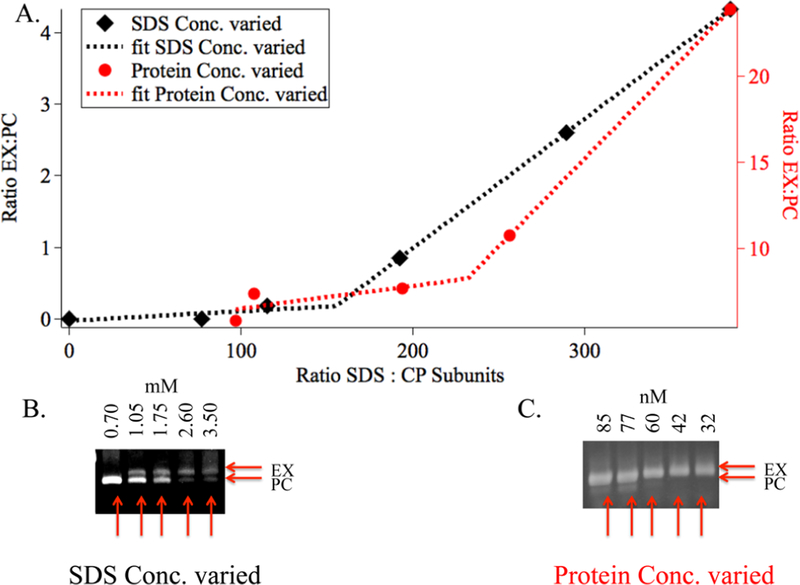
To determine the stoichiometric relationship between the number of subunits in the P22 capsid and the number of SDS molecules, we varied the SDS concentration while maintaining a constant protein concentration (Figures 4A, S1, and S9). Using densitometry analysis of the corresponding native agarose gels, we calculated the relative ratio of EX and PC particles (Figure S1). The number of CP monomers was determined using the MW determined by SEC-MALS measurements (Figure S1C). At a SDS concentration of 0.7 mM, corresponding to an SDS:CP ratio of 77:1, no expansion was observed (Figures 4B and S1B). As SDS concentration increased, the population of EX particles increased as well. However, this behavior was nonlinear, and as the ratio approached ∼350:1 SDS:CP, there was significant increase in the expanded population. In a similar experiment where the SDS concentration was kept constant, but the protein concentration was increased (Figure 4C), a similar trend was observed. Although the EX:PC populations were slightly different, the ratio of 350:1 SDS:CP resulted in the highest population of EX P22 VLPs. These results support the idea that there is stoichiometric dependence to the SDS-mediated expansion of P22 rather than just a critical bulk SDS concentration.
Figure 4.
Stoichiometric dependence of P22 expansion using SDS. (A) Plot showing the minimum SDS:CP stoichiometry necessary in order to initiate expansion. The black trace is densitometry analysis (from native agarose gel) of the sample in (B) where the protein concentration was kept constant, while the SDS concentration was varied. The red trace is the densitometry analysis of the sample in (C) where the SDS concentration was kept constant, while the protein concentration was varied. In both cases, the onset of expansion takes place when the ratio of SDS molecules: CP subunits is ∼1:200 (in the range of 150−250). Data were fit to a piecewise linear regression model to establish the curve that fits two different slopes, which are shown as dotted lines.
The significance of the relationship between stoichiometric ratios of the CP subunits to SDS is more clear when the area of SDS molecules is compared to the average area of the buried interfaces between the CPs (Figure S12). The theoretical values for the buried surface areas for the P22 capsid have previously been established and tabulated on the VIPERdb Web site.39–41 Extracting these values and calculating the total buried surface area of the capsid provided an estimate of 11 500 Å2 as the average interfacial area per CP subunit. Using Spartan Modeling Software, the area per SDS molecule was calculated to be 44.6 Å2. The onset of expansion takes place when the ratio of SDS/CP is ∼200−250, corresponding to a total area for the SDS of 8920−11 200 Å2, which approaches the buried interfacial surface area of the P22 CP subunit. This demonstrates that there is a relationship between the buried surface area of the P22 particle and the number of SDS molecules, suggesting that the SDS molecules might be interacting with the particle at those interfaces and disrupting the intersubunit interactions. When the number of SDS molecules approached 350/CP, the total area is calculated at 15 600 Å2, exceeding the average buried surface area per CP and is thus consistent with the observed capsid disassembly at higher SDS concentrations.
Expanding P22 Variants Using SDS.
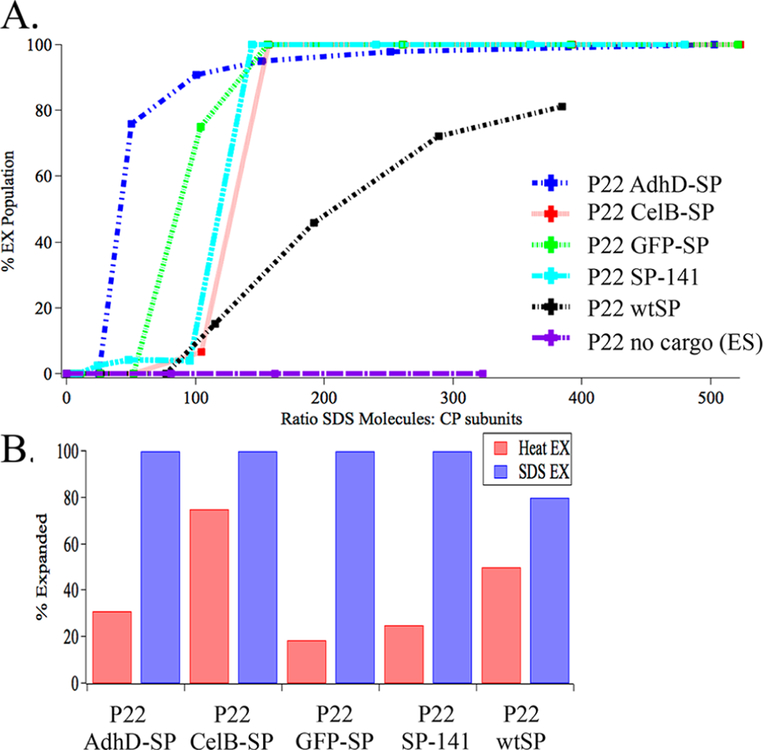
The data presented so far was collected from experiments performed with P22 wtSP particles. However, we have multiple constructs for which heat expansion does not always result in a fully expanded population of particles. We therefore tested a library of P22 constructs with different cargo proteins encapsulated, including green fluorescent protein (GFP),18 alcohol dehydrogenase-D (AdhD),20 β-glucosidase (CelB),19 and a truncated form of the SP (SP-142–303), which is missing the first 161 amino acids from the N-terminus.42 All of these constructs were prepared and characterized using the same methodology as the wtP22 protein, where the MW of each protein was obtained using SEC-MALS, and have been described previously (Figures S2−S5).18–20,37,42 After incubation with SDS, samples were run on native agarose gels and densitometry analysis was used to calculate the percentage of PC and EX particles (Figures S2−S5). These data (Figure 5A) suggest that, in addition to the critical stoichiometric dependence of CP to SDS, there is also a pressure component that contributes to the onset of expansion. As previously shown25 by mechanical measurements on P22 using AFM, differences in mechanical behavior and stability could be correlated to the internal pressure resulting from encapsulated cargo. Calculation of the relative internal pressure of P22 particles for P22 with encapsulated CelB or GFP was 3 ± 1 MPa.25 Using the same calculation, we estimate the osmotic pressure due to AdhD, wtSP, and SP-141 to be 3.1, 0.023, and 0.74 MPa, respectively (see the Methods section). Similar to the effect of the internal pressure on the mechanics of the P22,25 we hypothesize that this internal pressure provides some mechanical driving force for expansion. The osmotic pressure is directly proportional to the number of freely moving cargo molecules inside the confined P22 capsid. Even though the CP/SP binding site is still intact in the PC morphology, which may limit the number of freely moving SP molecules, it has recently been shown that there is an equilibrium between bound and unbound SP species in the PC morphology, indicating that an increased osmotic pressure is generated well before the binding site is lost.31 We hypothesize that, as the SDS intercalates between the CP subunit, more SP molecules are released, thus increasing the osmotic pressure, until a critical pressure is reached that is necessary to induce the PC→EX transformation. The wtSP sample is somewhat of an anomaly and appears to behave differently than the other samples. During the expansion, the wtSP binding site on the capsid is lost, and the wtSP leaves the capsid during the expansion, whereas all other protein cargos studied here do not escape the capsid.31 In the case of wtSP, since the cargo is able to diffuse out, it does not contribute significantly to the increase in osmotic pressure. In the case of cargo-SP, AdhD has the highest calculated maximum osmotic pressure as well as the lowest onset of expansion threshold; GFP has the second highest osmotic pressure and second lowest expansion threshold; SP-141 continues to follow this trend. Considering the tetrameric state of CelB and adjusting the values to reflect the number of cargo molecules that were encapsulated in this batch of P22, the calculated osmotic pressure is 0.84 MPa, which brings the osmotic pressure to a value comparable to SP- 141, a trend that is also observed in Figure 5A. Therefore, higher osmotic pressure resulting from a high copy number of unbound non-native cargo molecules requires a lower SDS threshold, while lower osmotic pressure resulting from wtSP requires a higher threshold.
Figure 5.
SDS expansion of multiple P22 variants, P22 GFP-SP, P22 AdhD-SP, P22 CelB-SP, and P22 SP141. Results from densitometry analysis of native agarose gel in which percent expansion was plotted against the (A) ratio between SDS molecules and CP subunits. (B) Comparison of heat expansion and SDS expansion effciency. SDS- treated samples result in fully expanded populations in all P22-Cargo variants, while heat treatment does not.
In addition, P22 particles completely devoid of cargo, native or otherwise (P22 ES), underwent expansion readily upon the increase of temperature to 65 °C (Figure S6). However, when P22 ES (empty shell) was incubated under SDS expansion conditions, no transformation was seen (Figures 5A and S6). Thus, the data correlates well with a significant role for the cargo in facilitating the morphogenesis, where an increased internal osmotic pressure triggers the particle transformation, and the role of the surfactant is likely to lubricate the subunit− subunit interfaces assisting the particle morphogenesis.
In order to further illustrate the validity and overall utility of this chemical method for this transformation, SDS expansion for this range of P22 variants was compared to expansion using heat, where densitometry was used to analyze the percentage of EX particles (Figures 5B and S1−S5). This revealed that not only does the SDS treatment result in the expansion of previously nonexpandable P22 variants, it also results in a higher population of EX particles, when comparing the relative population of EX particles using the well-established heating protocol. Comparing the P22 variants capable of expanding using SDS versus those that can be expanded with heat suggested that the mechanism for this transformation is different for the two conditions.
Role of Headgroup Electrostatics and Alkyl Chain Length.
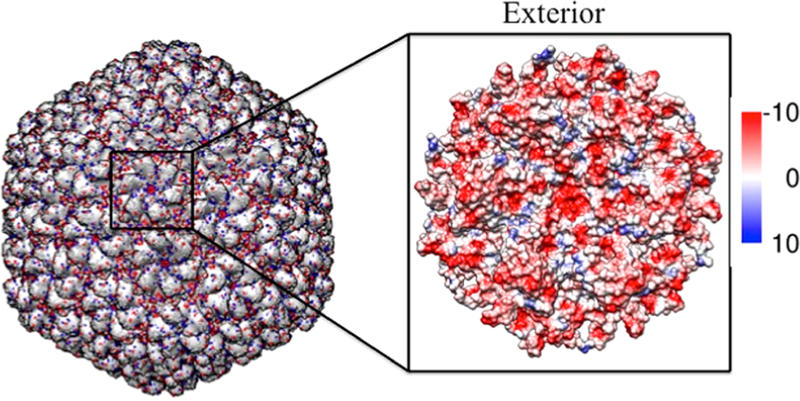
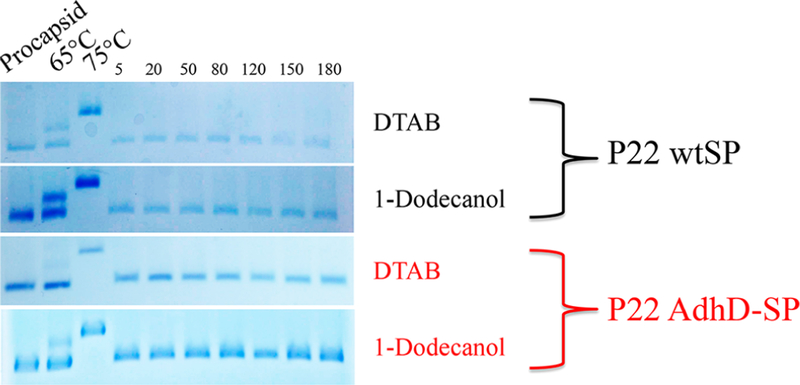
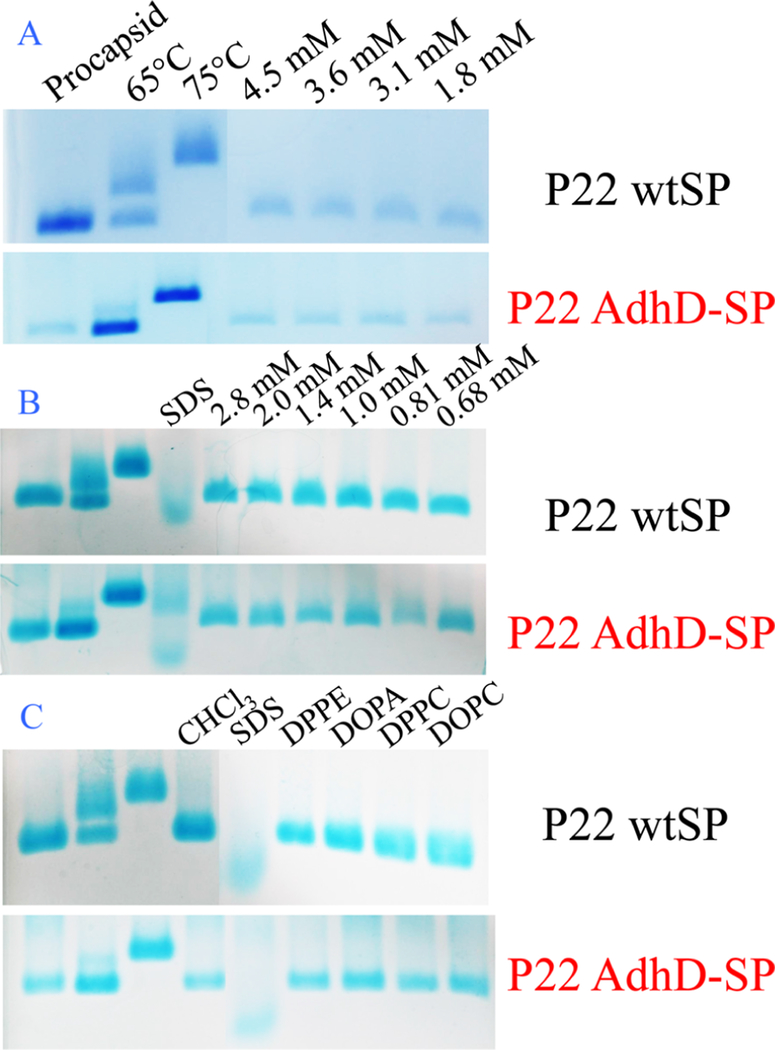
The role of electrostatics in the expansion of P22 has been identified, and an earlier study demonstrated that under conditions of high ionic strength, P22 PC particles did not expand upon heating.26 The interior and exterior surfaces of P22 are overall negatively charged, with a zeta potential of ∼30 mV (Figure 6).43 Repulsive electrostatic interactions between negatively charged subunit interfaces appear to contribute to destabilization of the PC structure, facilitating the particle morphogenesis to the more stable EX morphology. We therefore investigated the role of the negatively charged sulfate groups on SDS as a contributor to the particle expansion. We compared the effects of surfactant headgroup, while keeping the alkyl chain length (12-carbon) constant, by investigating the effects of a neutral surfactant (1-dodecanol) and a positively charged surfactant (dodecyltrimethylammonium bromide-DTAB) (Figure 7). The ability of each surfactant to facilitate the expansion was investigated with samples of P22 wtSP and P22 AdhD-SP. P22 AdhD-SP was used in this study as a representative non-native cargo sample to determine if the presence of the protein cargo affects the behavior of the particles when exposed to the new surfactants. Under conditions with the same surfactant concentration used for the SDS studies (3.5 mM) and a constant protein concentration, incubation times were varied from 5 to 180 min. For both 1-dodecanol and DTAB, the native agarose gel data revealed particles with the same electrophoretic mobility as the P22 procapsid starting material. These data suggest that the negatively charged sulfate group is critically important, possibly leading to increased electrostatic repulsion at the subunit interface and contributing to the destabilization of the PC particles, facilitating the transformation to the EX form.
Figure 6.
Model of the mature bacteriophage P22 (PDB, 5UU5). (Left) Mature bacteriophage P22 multiscale model computed using Chimera UCSF. The negatively and positively charged residues are colored in red and blue, respectively, illustrating the negatively charged exterior of the capsid. (Right) Surface analysis of a hexameric unit mapping the Coulombic surface of the exterior (red = negative, blue = positive).
Figure 7.
Native agarose gels of P22 wtSP and P22 AdhD-SP particles incubated with 0.1% (w/v) DTAB (positively charged) and 1dodecanol (neutral) surfactants (5.4 and 3.2 mM, respectively) with varying incubation times. Incubation times ranged from 5 to 180 min. All lanes show bands consistent with the migration of PC morphology, suggesting the particles remained unchanged under all of these conditions.
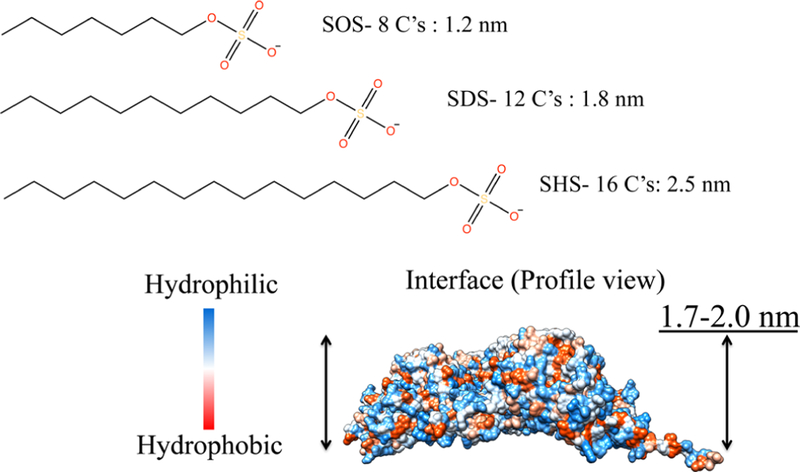
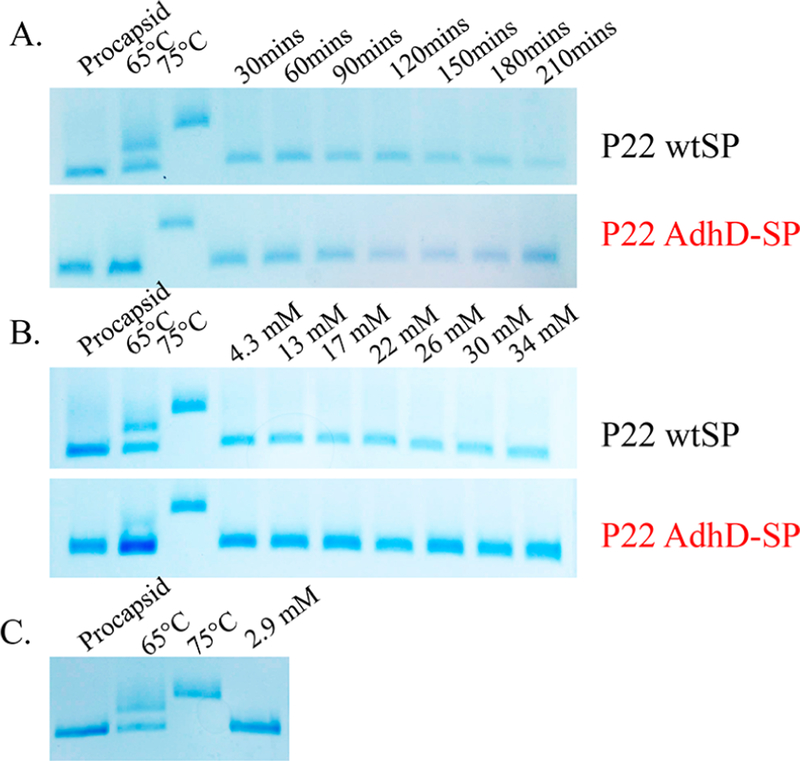
Since the interior and exterior surfaces of the P22 VLP are highly negatively charged, it is unlikely that the SDS molecules will directly interact with the capsid via the sulfate headgroup. It is likely that the 12-carbon hydrophobic surfactant tail of SDS will interact with hydrophobic regions characteristic of the buried intersubunit interfaces in the P22 capsid (Figure 8). We therefore investigated the role of the hydrophobic tail length by treating P22 wtSP and P22 AdhD-SP with sodium octyl sulfate (SOS) and sodium n-hexadecyl sulfate (SHS) (Figure 8). These surfactants contain the same headgroup but differ in the number of carbons in the chain, 8 and 16, respectively. When both P22 variants were incubated with 4.3 mM or 0.1% (w/v) SOS, no change to the electrophoretic mobility of the P22 particles was observed, indicating there was no change to the PC structure (Figure 9A). We also explored increasing the concentration of SOS (up to 34 mM), but this also had no effect on its ability to trigger the transformation to EX (Figure 9B). In addition, when P22 particles were treated with SHS, the particles that were recovered were consistent with PC morphology, indicating that there was no change to the original structure (Figure 9C). This suggests that changing the carbon tail length from ∼1.5 nm in SDS to ∼1.0 nm in SOS and to ∼1.7 nm in SHS changes the interaction between the surfactant and the capsid enough so as to not facilitate the expansion. Interestingly the computed measurements using Chimera to model the interfaces in P22 (Figure 8, PDB, 5UU5, 0.33 nm resolution) indicated an interfacial depth of 1.4−1.6 nm, which is very consistent with the extended SDS tail length and less so with either the SOS or SHS molecules. Lastly, in order to further validate the necessity for the hydrophobic region, the P22 wtSP and AdhD-SP particles were treated with sodium sulfate (Figure S15). Varying concentrations of sulfate up to 70 mM had no effect on the P22 expansion, and the mobility of the PC band remained the same, further illustrating the importance of the alkyl chain interaction with the capsid for this morphogenesis.
Figure 8.
Model of the mature bacteriophage P22 asymmetric unit (PDB, 5UU5). Surface map showing hydrophobic patches (red), which can be found buried in the interface between subunits along with theoretical lengths of carbon tails of each surfactant. The asymmetric subunit surface map and value for the interface were computed using UCSF Chimera.2,3
Figure 9.
Native agarose gels of P22 wtSP and P22 AdhD-SP particles incubated with SOS and SHS. (A) P22 wtSP and P22 AdhD-SP were incubated with 4.3 mM SOS, and incubation times ranged from 30 to 210 min. (B) P22 wtSP and P22 AdhD-SP were incubated with SOS for 1.5 h with SOS concentrations ranging from 4.3 to 34 mM. The SHS disrupted the gel so excess SHS was removed before PAGE analysis. The incubation time was 1.5 h with an SHS concentration of 2.9 mM. No change was observed in the P22 migration after treatment with all of the surfactants of higher/lower carbon chain length consistent with no expansion of the PC.
In order to maximize the concentration of free surfactant molecules in solution (as opposed to surfactant assembled micelles), we tried to stay below or at the critical micelle concentration (cmc) in these experiments. The reported cmc value of SOS is 138 mM, higher than that of SDS (6−8 mM).35 The reported cmc values for DTAB and SHS are 11 mM and 0.6−4.4 mM, respectively, while the cmc value for 1dodecanol has not been reported.34,35 To keep consistent with the concentration used for expansion with SDS, we probed a 2.9 mM or 0.1% (w/v) concentration of SHS, bringing us within the cmc, it is therefore possible that micelles are formed in solution. However, in a study addressing protein/surfactant interactions, it was determined that the cmc drastically increases (from 7.94 to 11.2 mM) in the presence of protein when compared to the cmc values without, making it likely that we were below the cmc for SHS as well.44
We additionally investigated whether a range of lipid molecules, which bear structural similarities to the surfactants we have studied, were able to affect the P22 morphogenesis. As shown in Figure 11, P22 wtSP and P22 AdhD-SP particles were incubated with various lipids, including 1,2-dilauroyl-sn- glycero-3-phosphate (DLPA), 1,2-dilauroyl-sn-glycero-3-phosphocholine (DLPC), 1,2-dipalmitoyl-sn-glycero-3-phosphoethanolamine (DPPE), 1,2-dipalmitoyl-sn-glycero-3-phospho- choline (DPPC), 1,2-dioleoyl-sn-glycero-3-phosphocholine (DOPC), and 1,2-dioleoyl-sn-glycero-3-phosphoric acid mono- sodium salt (DOPA), and analyzed by native gel electrophoresis. No change in the P22 morphology was observed, suggesting that the lipids were not able to drive the expansion of the P22 VLPs. Since the lipids are not water-soluble, stock solutions were made using chloroform, and in the experiment, the P22 VLP was exposed to a maximum of 10% chloroform. Control reactions where PC was incubated with only 10% chloroform showed no measurable effect on the particle morphology (Figure 11C). However, when we incubated P22 particles with both SDS (3.5 mM) and 10% chloroform, two populations of particles were observed, one corresponding to the EX morphology and the other to disassembled P22 subunits (Figure 11B,C), similar to what was seen at very high SDS concentrations (Figure 3). This suggests that the addition of the organic solvent together with SDS caused the capsid to fall apart. These studies show that none of these diverse samplings of lipids are able to induce expansion of P22. Overall, these data suggest that the P22 PC particles will likely remain intact when introduced to a lipid containing environment, supporting the potential use of these stable VLPs for in vivo delivery
Figure 11.
Native agarose gels of P22 wtSP and P22 AdhD-SP particles incubated with a wide range of lipids. (A) P22 wtSP and P22 AdhD-SP were incubated with a wide range of concentrations of DLPA. (B) P22 wtSP and P22 AdhD-SP were incubated with a wide range of concentrations of DLPC. The lipids used in (A), (B), and were dissolved in solvents containing chloroform; therefore, the sample in the SDS lanes were incubated with 10% CHCl3 and 3.5 mM SDS to accurately compare how particles behave in such solvent conditions. (C) P22 wtSP and P22 AdhD-SP were incubated with 4 various lipids, DPPE, DOPA, DPPC, and DOPC, at concentrations of 14, 13, 14, and 13 mM, respectively. The CHCl3 lane contains PC particles and no SDS to establish that PC particles remain intact when SDS is not present in a solution containing CHCl3.
CONCLUSION
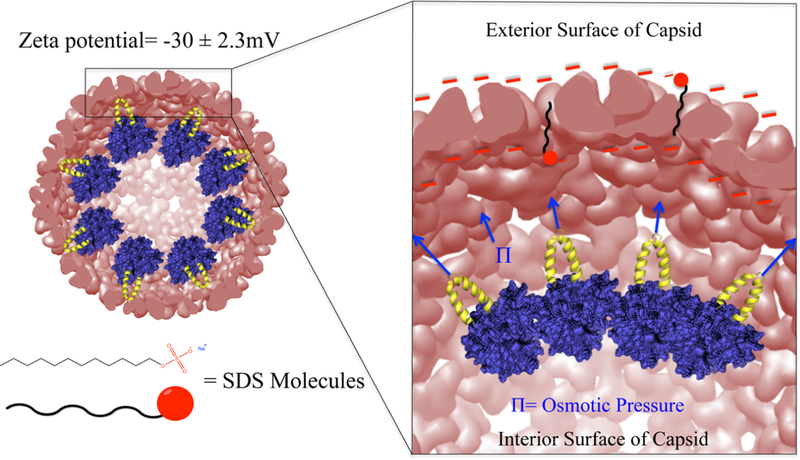
In this study we explored a chemically induced morphological transformation of P22 VLPs (PC→EX) using the surfactant SDS. For this chemical transformation to take place, SDS molecules were introduced to P22 VLPs and the reaction proceeded at ambient conditions. This is different from current methodologies used for expansion, where capsids are heated to 65 °C to generate the expanded P22 particle morphology. Heating limits the cargo that can be encapsulated to species that are insensitive to higher temperatures. Additionally, heating was often insuffcient to fully expand the entire population of P22 particles, where at least half of the particle population remained in the PC form. On the other hand, incubation of P22 with SDS reliably resulted in the formation of ≥80% population of expanded particles with constructs having an internal cargo. We also demonstrated that the transformation is dependent on a critical threshold stoichiometric ratio of SDS: subunit that needs to be reached prior to the onset of expansion. This threshold is much lower for P22 variants that encapsulated non-native cargo, when compared to particles that encapsulated the wtSP. Comparing the relative osmotic pressures exerted on the capsid by the encapsulated cargo inside revealed that the pressure resulting from wtSP was the lowest compared to SP-141, AdhD-SP, GFP-SP, and CelB-SP, suggesting that pressure, together with the intercalation of the surfactant lubricating the subunit interfaces, both contribute to the expansion mechanism (Figure 10). Empty VLPs, with no encapsulated cargo, did not expand using SDS, further supporting this assertion. In probing the mechanism for this transformation, we tested the effect of the negatively charged SDS headgroup by comparing surfactants with either neutral or positively charged head groups, neither of which resulted in a change to the initial PC VLP structure, suggesting that electrostatics are critical for this transition, and that the SDS molecules possibly induce repulsive interactions at the CP/SDS interface. To further illustrate the specificity of SDS, we also compared surfactants containing a sulfate headgroup but where the length of the carbon tail was varied (8 C’s and 16 C’s). Neither of these surfactants initiated changes to the PC, suggesting that the length of the hydrophobic region is also important, and perhaps the 12 C length of SDS is optimally suffcient enough to disrupt the intersubunit interactions of CP, while the other two lengths are not. The role of the SDS surfactant in effecting the morphogenesis of the P22 VLP thus appears to entail anchoring of the surfactant and perhaps disrupting the buried intersubunit interfaces of the capsid and electrostatic repulsion between the SDS headgroup and the charged capsid surface. At a critical SDS concentration, these interactions behave as a morphogenetic trigger for the transformation from PC to the EX morphology. Additionally, like the expansion observed in the maturation of the infectious P22 virion due to internal osmotic pressure from packaged DNA, the presence of macromolecular cargo inside the VLP results in an additional force that facilitates the structural transition from the PC to EX at lower critical SDS concentrations.
Figure 10.
A representation of the proposed mechanism for P22 VLP expansion using SDS. The exterior of P22 interior and exterior capsid surfaces are highly negatively charged. It is likely that interactions between the SDS molecules and capsid surfaces are repulsive. On the other hand, the hydrophobic alkyl chain of the SDS can interact with the hydrophobic regions found between CP subunits. The osmotic pressure caused by the cargo found on the inside of the capsid, together with the repulsive electrostatic interactions between the SDS molecules and CP, initiates the expansion of the P22 VLP.
Lastly, a range of lipids were tested for their ability to effect the morphogenesis, and none of those tested were found to be active, which raises a possible advantage in contemplating the use of P22 VLPs as an in vivo delivery system.
ASSOCIATED CONTENT
Supporting Information
The Supporting Information is available free of charge on the ACS Publications website at DOI: 10.1021/acs.biomac.8b01357.
The supporting information includes the characterization of each P22 variant, the measured molecular weight, the densitometry line profile, the calculated values for all ratios, TEM images of each P22 variant, gel electrophoresis characterization of the particles that are absent of any cargo, a homology model, and catalytic activity of the enzymes (PDF)
Supplementary Material
ACKNOWLEDGMENTS
This work was funded by a grant from the National Science Foundation (NSF-BMAT DMR-1507282). E.S. was supported by the Graduate Training Program in Quantitative and Chemical Biology under Award T32 GM109825 and Indiana University. The content is solely the responsibility of the authors and does not necessarily represent the offcial views of the National Institutes of Health. We thank Pro. Yan Yu for generously providing lipid samples. We thank the IU Electron Microscopy Center and the Physical Biochemistry Instrumentation Facility for access to their instrumentation.
Footnotes
The authors declare no competing financial interest.
REFERENCES
- (1).Teschke CM; McGough A; Thuman-Commike PA Penton release from P22 heat-expanded capsids suggests importance of stabilizing penton-hexon interactions during capsid maturation. Biophys. J 2003, 84 (4), 2585–2592. [DOI] [PMC free article] [PubMed] [Google Scholar]
- (2).Parent KN; Khayat R; Tu LH; Suhanovsky MM; Cortines JR; Teschke CM; Johnson JE; Baker TS P22 coat protein structures reveal a novel mechanism for capsid maturation: stability without auxiliary proteins or chemical crosslinks. Structure 2010, 18 (3), 390–401. [DOI] [PMC free article] [PubMed] [Google Scholar]
- (3).Pettersen EF; Goddard TD; Huang CC; Couch GS; Greenblatt DM; Meng EC; Ferrin TE UCSF Chimera a visualization system for exploratory research and analysis. J. Comput. Chem 2004, 25 (13), 1605–1612. [DOI] [PubMed] [Google Scholar]
- (4).King J; Botstein D; Casjens S; Earnshaw W; Harrison S; Lenk E Structure and assembly of the capsid of bacteriophage P22. Philos. Trans. R. Soc., B 1976, 276 (943), 37–49. [DOI] [PubMed] [Google Scholar]
- (5).Casjens S; Adams M; Hall C; King J Assembly-controlled autogenous modulation of bacteriophage P22 scaffolding protein gene expression. Journal of virology 1985, 53 (1), 174–179. [DOI] [PMC free article] [PubMed] [Google Scholar]
- (6).Gilcrease EB; Winn-Stapley DA; Hewitt FC; Joss L; Casjens SR Nucleotide sequence of the head assembly gene cluster of bacteriophage L and decoration protein characterization. Journal of bacteriology 2005, 187 (6), 2050–2057. [DOI] [PMC free article] [PubMed] [Google Scholar]
- (7).Chen AH; Silver PA Designing biological compartmentalization. Trends Cell Biol 2012, 22 (12), 662–670. [DOI] [PubMed] [Google Scholar]
- (8).Trantidou T; Friddin M; Elani Y; Brooks NJ; Law RV; Seddon JM; Ces O Engineering Compartmentalized Biomimetic Micro-and Nanocontainers. ACS Nano 2017, 11 (7), 6549–6565. [DOI] [PubMed] [Google Scholar]
- (9).Schwarz B; Douglas T Development of virus-like particles for diagnostic and prophylactic biomedical applications. Wiley Interdisciplinary Reviews: Nanomedicine and Nanobiotechnology 2015, 7 (5), 722–735. [DOI] [PMC free article] [PubMed] [Google Scholar]
- (10).Douglas T; Young M Host−guest encapsulation of materials by assembled virus protein cages. Nature 1998, 393 (6681), 152. [Google Scholar]
- (11).Hryc CF; Chen D-H; Afonine PV; Jakana J; Wang Z; Haase-Pettingell C; Jiang W; Adams PD; King JA; Schmid MF; Chiu W Accurate model annotation of a near-atomic resolution cryo-EM map. Proc. Natl. Acad. Sci. U. S. A 2017, 114 (12), 3103–3108. [DOI] [PMC free article] [PubMed] [Google Scholar]
- (12).King J; Lenk EV; Botstein D Mechanism of head assembly and DNA encapsulation in Salmonella phage P22: II. J. Mol. Biol 1973, 80 (4), 697–731. [DOI] [PubMed] [Google Scholar]
- (13).Teschke CM; King J Folding of the phage P22 coat protein in vitro. Biochemistry 1993, 32 (40), 10839–10847. [DOI] [PubMed] [Google Scholar]
- (14).Casjens S; King J P22 morphogenesis I: catalytic scaffolding protein in capsid assembly. J. Supramol. Struct 1974, 2 (2−4), 202–224. [DOI] [PubMed] [Google Scholar]
- (15).Cortines JR; Motwani T; Vyas AA; Teschke CM Highly specific salt bridges govern bacteriophage P22 icosahedral capsid assembly: identification of the site in coat protein responsible for interaction with scaffolding protein. J. Virol 2014, 88, 5287. [DOI] [PMC free article] [PubMed] [Google Scholar]
- (16).Jordan PC; Patterson DP; Saboda KN; Edwards EJ; Miettinen HM; Basu G; Thielges MC; Douglas T Self- assembling biomolecular catalysts for hydrogen production. Nat. Chem 2016, 8 (2), 179. [DOI] [PubMed] [Google Scholar]
- (17).O’Neil A; Prevelige PE; Basu G; Douglas T Coconfine- ment of fluorescent proteins: spatially enforced communication of GFP and mCherry encapsulated within the P22 capsid. Biomacromo- lecules 2012, 13 (12), 3902–3907. [DOI] [PubMed] [Google Scholar]
- (18).O’Neil A; Reichhardt C; Johnson B; Prevelige PE; Douglas T Genetically programmed in vivo packaging of protein cargo and its controlled release from bacteriophage P22. Angew. Chem., Int. Ed 2011, 50 (32), 7425–7428. [DOI] [PubMed] [Google Scholar]
- (19).Patterson DP; Schwarz B; Waters RS; Gedeon T; Douglas T Encapsulation of an enzyme cascade within the bacteriophage P22 virus-like particle. ACS Chem. Biol 2014, 9 (2), 359–365. [DOI] [PubMed] [Google Scholar]
- (20).Patterson DP; Prevelige PE; Douglas T Nanoreactors by programmed enzyme encapsulation inside the capsid of the bacteriophage P22. ACS Nano 2012, 6 (6), 5000–5009. [DOI] [PubMed] [Google Scholar]
- (21).Sharma J; Uchida M; Miettinen HM; Douglas T Modular interior loading and exterior decoration of a virus-like particle. Nanoscale 2017, 9 (29), 10420–10430. [DOI] [PMC free article] [PubMed] [Google Scholar]
- (22).Yoshimura H; Edwards E; Uchida M; McCoy K; Roychoudhury R; Schwarz B; Patterson D; Douglas T Two- dimensional crystallization of P22 virus-like particles. J. Phys. Chem. B 2016, 120 (26), 5938–5944. [DOI] [PubMed] [Google Scholar]
- (23).Uchida M; McCoy K; Fukuto M; Yang L; Yoshimura H; Miettinen HM; LaFrance B; Patterson DP; Schwarz B; Karty JA; et al. Modular Self-Assembly of Protein Cage Lattices for Multistep Catalysis. ACS Nano 2018, 12 (2), 942–953. [DOI] [PMC free article] [PubMed] [Google Scholar]
- (24).McCoy K; Uchida M; Lee B; Douglas T Templated Assembly of a Functional Ordered Protein Macromolecular Frame- work from P22 Virus-like Particles. ACS Nano 2018, 12 (4), 3541–3550. [DOI] [PubMed] [Google Scholar]
- (25).Llauro A; Luque D; Edwards E; Trus BL; Avera J; Reguera D; Douglas T; de Pablo PJ; Castoń JR Cargo−shell and cargo−cargo couplings govern the mechanics of artificially loaded virus-derived cages. Nanoscale 2016, 8 (17), 9328–9336. [DOI] [PMC free article] [PubMed] [Google Scholar]
- (26).Parker MH; Prevelige PE Jr Electrostatic interactions drive scaffolding/coat protein binding and procapsid maturation in bacteriophage P22. Virology 1998, 250 (2), 337–349. [DOI] [PubMed] [Google Scholar]
- (27).Parent KN; Doyle SM; Anderson E; Teschke CM Electrostatic interactions govern both nucleation and elongation during phage P22 procapsid assembly. Virology 2005, 340 (1), 33–45. [DOI] [PubMed] [Google Scholar]
- (28).Abedin MJ; Liepold L; Suci P; Young M; Douglas T Synthesis of a cross-linked branched polymer network in the interior of a protein cage. J. Am. Chem. Soc 2009, 131 (12), 4346–4354. [DOI] [PMC free article] [PubMed] [Google Scholar]
- (29).Lucon J; Edwards E; Qazi S; Uchida M; Douglas T Atom transfer radical polymerization on the interior of the P22 capsid and incorporation of photocatalytic monomer crosslinks. Eur. Polym. J 2013, 49 (10), 2976−2985. [Google Scholar]
- (30).Lucon J; Qazi S; Uchida M; Bedwell GJ; LaFrance B; Prevelige PE Jr; Douglas T Use of the interior cavity of the P22 capsid for site-specific initiation of atom-transfer radical polymerization with high-density cargo loading. Nat. Chem 2012, 4 (10), 781. [DOI] [PMC free article] [PubMed] [Google Scholar]
- (31).McCoy K; Selivanovitch E; Luque D; Lee B; Edwards E; Castoń JR; Douglas T Cargo Retention inside P22 Virus-Like Particles. Biomacromolecules 2018, 19 (9), 3738. [DOI] [PubMed] [Google Scholar]
- (32).Earnshaw W; Casjens S; Harrison SC Assembly of the head of bacteriophage P22: x-ray diffraction from heads, proheads and related structures. J. Mol. Biol 1976, 104 (2), 387–410. [DOI] [PubMed] [Google Scholar]
- (33).Popot J-L; Trewhella J; Engelman DM Reformation of crystalline purple membrane from purified bacteriorhodopsin frag- ments. EMBO J 1986, 5 (11), 3039–3044. [DOI] [PMC free article] [PubMed] [Google Scholar]
- (34).Bahri MA; Hoebeke M; Grammenos A; Delanaye L; Vandewalle N; Seret A Investigation of SDS, DTAB and CTAB micelle microviscosities by electron spin resonance. Colloids Surf., A 2006, 290 (1−3), 206–212. [Google Scholar]
- (35).Evans H 117. Alkyl sulphates. Part I. Critical micelle concentrations of the sodium salts. J. Chem. Soc 1956, 579–586.
- (36).Song S-H; Koelsch P; Weidner T; Wagner MS; Castner DG Sodium dodecyl sulfate adsorption onto positively charged surfaces: Monolayer formation with opposing headgroup orientations. Langmuir 2013, 29 (41), 12710–12719. [DOI] [PMC free article] [PubMed] [Google Scholar]
- (37).Patterson DP; Schwarz B; El-Boubbou K; van der Oost J; Prevelige PE; Douglas T Virus-like particle nanoreactors: programmed encapsulation of the thermostable CelB glycosidase inside the P22 capsid. Soft Matter 2012, 8 (39), 10158–10166. [Google Scholar]
- (38).Galisteo ML; King J Conformational transformations in the protein lattice of phage P22 procapsids. Biophys. J 1993, 65 (1), 227. [DOI] [PMC free article] [PubMed] [Google Scholar]
- (39).Reddy VS; Giesing HA; Morton RT; Kumar A; Post CB; Brooks CL III; Johnson JE Energetics of quasiequivalence: computational analysis of protein-protein interactions in icosahedral viruses. Biophys. J 1998, 74 (1), 546–558. [DOI] [PMC free article] [PubMed] [Google Scholar]
- (40).Horton N; Lewis M Calculation of the free energy of association for protein complexes. Protein Sci 1992, 1 (1), 169–181. [DOI] [PMC free article] [PubMed] [Google Scholar]
- (41).Eisenberg D; McLachlan AD Solvation energy in protein folding and binding. Nature 1986, 319 (6050), 199–203. [DOI] [PubMed] [Google Scholar]
- (42).Weigele PR; Sampson L; Winn-Stapley D; Casjens SR Molecular genetics of bacteriophage P22 scaffolding protein’s functional domains. J. Mol. Biol 2005, 348 (4), 831–844. [DOI] [PubMed] [Google Scholar]
- (43).Bozǐc AL; Šiber A; Podgornik R How simple can a model of an empty viral capsid be? Charge distributions in viral capsids. J. Biol. Phys 2012, 38 (4), 657–671. [DOI] [PMC free article] [PubMed] [Google Scholar]
- (44).Ghosh S; Banerjee A A multitechnique approach in protein/ surfactant interaction study: physicochemical aspects of sodium dodecyl sulfate in the presence of trypsin in aqueous medium. Biomacromolecules 2002, 3 (1), 9–16. [DOI] [PubMed] [Google Scholar]
Associated Data
This section collects any data citations, data availability statements, or supplementary materials included in this article.


