

Sunlight provides information about both place and time. In sunlit aquatic environments, primary producers release organic carbon and nitrogen along with other growth factors during the day. The ability of Actinobacteria to coordinate organic carbon uptake and utilization with production of photosynthate enables them to grow more efficiently in the daytime, and it potentially gives them a competitive advantage over heterotrophs that constitutively produce carbohydrate transporters, which is energetically costly, or produce transporters only after detection of the substrate(s), which delays their response. Understanding how light cues the transport of organic carbon and its conversion to biomass is key to understanding biochemical mechanisms within the carbon cycle, the fluxes through it, and the variety of mechanisms by which light enhances growth.
KEYWORDS: Actinobacteria, cryptochrome, freshwater, heterotrophy, light
ABSTRACT
Light is a source of energy and an environmental cue that is available in excess in most surface environments. In prokaryotic systems, conversion of light to energy by photoautotrophs and photoheterotrophs is well understood, but the conversion of light to information and the cellular response to that information have been characterized in only a few species. Our goal was to explore the response of freshwater Actinobacteria, which are ubiquitous in illuminated aquatic environments, to light. We found that Actinobacteria without functional photosystems grow faster in the light, likely because sugar transport and metabolism are upregulated in the light. Based on the action spectrum of the growth effect and comparisons of the genomes of three Actinobacteria with this growth rate phenotype, we propose that the photosensor in these strains is a putative CryB-type cryptochrome. The ability to sense light and upregulate carbohydrate transport during the day could allow these cells to coordinate their time of maximum organic carbon uptake with the time of maximum organic carbon release by primary producers.
IMPORTANCE Sunlight provides information about both place and time. In sunlit aquatic environments, primary producers release organic carbon and nitrogen along with other growth factors during the day. The ability of Actinobacteria to coordinate organic carbon uptake and utilization with production of photosynthate enables them to grow more efficiently in the daytime, and it potentially gives them a competitive advantage over heterotrophs that constitutively produce carbohydrate transporters, which is energetically costly, or produce transporters only after detection of the substrate(s), which delays their response. Understanding how light cues the transport of organic carbon and its conversion to biomass is key to understanding biochemical mechanisms within the carbon cycle, the fluxes through it, and the variety of mechanisms by which light enhances growth.
INTRODUCTION
Sunlit environments host both primary producers and the heterotrophs that rely on them, and light powers the photosynthetic conversion of ∼212 petagrams CO2 to organic carbon per year (1). However, heterotrophic organisms in all domains of life share these environments and are thus also exposed to light. To these organisms, sunlight can provide information about location, orientation, and time, and it regulates a variety of physiological processes.
In plants, animals, and fungi, light controls circadian rhythms, orienting the organisms with respect to time of day and allowing them to coordinate metabolic activity with the 24-h diel cycle (2). In nonphototrophic bacteria, light can regulate stress responses (3, 4), motility (5), or attachment (6, 7) or the synthesis of secondary metabolites such as pigments (8–11) or antibiotics (12). However, the effects of light on the growth of nonphototrophic prokaryotes and the mechanisms they use to capture light have only been explored in a few species. Because light is an environmental cue present in all surface environments, even those organisms that cannot convert light energy to chemical energy likely sense it, enabling them to either stay in one place with regard to light intensity or to coordinate their activities with the time of day. Known photosensory proteins include rhodopsins, phytochromes, xanthopsins, cryptochromes, phototropins, vitamin B12-dependent regulators (13), and blue-light sensing using flavin (BLUF) domain proteins (14). Circadian rhythms in photosynthetic bacteria are also regulated by proteins that sense cellular redox status and the concentration of photosynthetically produced organic carbon (reviewed in reference 15).
Here, we investigate how nonphototrophic freshwater Actinobacteria in sunlit environments sense light. These organisms represent a ubiquitous and frequently highly abundant group of bacteria in aquatic surface environments (16–27) and are thus exposed to sunlight during the day. The genomes of these freshwater Actinobacteria derived from pure cultures or metagenomes indicate that rhodopsin-type photosystems are common in these species (18, 28–30). Two actinobacterial strains whose genomes encode actinorhodopsins, Rhodoluna lacicola strain MWH-Ta8 and Aurantimicrobium sp. strain MWH-Uga1, grow faster in the light than in the dark, even though their actinorhodopsins are nonfunctional (31). Aurantimicrobium sp. strain MWH-Mo1 also grows faster in the light than in the dark but lacks an actinorhodopsin. We hypothesize that whether or not they have functional photosystems, freshwater Actinobacteria have photosensors that contribute to the regulation of metabolic processes. This study characterizes the effects of light on growth and transcription and compares the genomes of the light-responsive strains to identify putative photoreceptors.
RESULTS
Several Actinobacteria grow faster in the light than in the dark.
Actinobacterial R. lacicola strain MWH-Ta8, Aurantimicrobium sp. strain MWH-Uga1, and Aurantimicrobium sp. strain MWH-Mo1 (Table 1) were grown in 0.3% nutrient broth, soytone, and yeast extract (NSY) medium in constant white light (∼40 μmol photons m−2 s−1) or constant darkness at 28°C. All three grow faster and reach higher cell densities in the light (Fig. 1). R. lacicola and strain MWH-Uga1 have actinorhodopsins, which could potentially enhance growth rates in the light, but Aurantimicrobium strain MWH-Mo1 does not (29). Further, the actinorhodopsins in R. lacicola and Aurantimicrobium sp. strain MWH-Uga1 are nonfunctional in the absence of exogenous retinal (31), the cofactor required for rhodopsin function. Since NSY medium does not include retinal, the actinorhodopsins cannot be responsible for the enhanced growth. Although rhodopsins might contribute to enhanced growth in the light in some actinobacterial species and under some conditions (32), they are not responsible for the observed growth rate phenotype here. We also grew Microbacterium sp. strain 10M-3C3, isolated from an oligotrophic freshwater lake in Indonesia (84), in the light and dark. This strain grows at the same rate under both conditions, indicating that light-enhanced growth is not a phenotype common to all Actinobacteria. Additionally, if light were warming the light-exposed media and causing the cells to grow faster, all tested strains would grow faster in the light. Thus, the fact that Microbacterium sp. strain 10M-3C3 grows at identical rates in light and darkness (Fig. 1) demonstrates that a temperature change does not cause the faster growth in the light.
TABLE 1.
Actinobacterial strains used in this worka
| Strain | Isolation source (reference) | Genome sequence obtained (reference) | Faster growth in light | Cell morphology |
|---|---|---|---|---|
| Rhodoluna lacicola MWH-Ta8 | Lake Taihu, China (29) | Yes (33) | Yes | Red crescent-shaped cells |
| Aurantimicrobium sp. strain MWH-Uga1 | Freshwater pond, Uganda (29) | Yes (this work) | Yes | Orange crescent-shaped cells |
| Aurantimicrobium sp. strain MWH-Mo1 | Lake Mondsee, Austria (22) | Yes (this work) | Yes | Yellow crescent-shaped cells |
| Rhodoluna lacicola TaW | Spontaneous mutant of R. lacicola MWH-Ta8 | Yes | Yes | White crescent-shaped cells; frameshift mutation in crtB |
| Microbacterium sp. strain 10M-3C3 | Lake Matano, Indonesia | Yes (84) | No | Yellow coryneform cells |
The phylogenetic positions of all of these strains are indicated by asterisks in Fig. 4.
FIG 1.

Growth of Actinobacteria in white light. Four strains of freshwater Actinobacteria were grown in constant light (13-W cool fluorescent bulb) or constant darkness (tubes wrapped in paper and foil). Growth was monitored by measuring the OD660. Points shown are the averages of the results from four independent replicates with error bars; in all cases, error bars are plotted but are smaller than the symbols. These growth curves were independently repeated at least 4 times; the data here are from individual, but representative, experiments. Aurantimicrobium sp. strain MWH-Mo1, Aurantimicrobium sp. strain MWH-Uga1, and R. lacicola strain MWH-Ta8 all grow slightly faster in the light than in the dark. Microbacterium sp. strain 10M-3C3, which branches separately from the others within the Microbacteriaceae, grows at identical rates in light and darkness.
To identify the specific wavelengths of light that stimulate growth in these Actinobacteria, we grew R. lacicola and Aurantimicrobium sp. strain MWH-Mo1 in constant dark or illuminated by light-emitting diodes (LEDs) emitting light at 375 nm, 425 nm, 525 nm, or 650 nm. All light intensities were ∼3 μmol photons m−2 s−1. Neither red (650 nm) nor green (525 nm) light enhanced growth in either strain (Fig. 2). However, both strains grew significantly faster when illuminated with near-UV light (375 nm). Blue light (425 nm) may also have enhanced growth, though to a smaller degree (Fig. 2). In both Aurantimicrobium sp. strain MWH-Mo1 and R. lacicola, growth in near-UV light was ∼15% faster than growth in the dark. If a rhodopsin-based photosystem were responsible, green light should have stimulated growth; the absorption maximum for the actinorhodopsin from R. lacicola is 527 nm (31). However, our previous work demonstrated that R. lacicola does not synthesize retinal, and its actinorhodopsin is therefore inactive (31). We thus concluded that the light-enhanced growth phenotype is not mediated by rhodopsin-based photosystems but rather by a pigment or protein that absorbs blue or near-UV light.
FIG 2.

Near-UV light enhances growth of some Actinobacteria. R. lacicola (A) and Aurantimicrobium sp. strain MWH-Mo1 (B) were grown in constant darkness or with LEDs of the wavelength specified. Growth was monitored by measuring the OD660, and growth rates were calculated from two time points within the exponential-growth phase (in both cases, within the first 24 h of growth). Boxes indicate the range of growth rates between the 25th and 75th quartiles, and the heavy line indicates the median growth rate. Asterisks indicate that the mean of the growth rate in light of this wavelength is significantly different from the mean growth rate in the dark, with a P value of <0.05, as calculated by a one-sided t test. All light intensities were ∼3 μmol photons m−2 s−1.
To confirm that light was not degrading the organic carbon in the medium and making it more bioavailable, NSY was aged for 4 days in white light. The aged medium and freshly prepared medium were then inoculated with R. lacicola or Aurantimicrobium sp. strain MWH-Mo1 and grown in either white light or darkness. If abiotic photochemical reactions were providing the light-grown cells with more accessible organic carbon, growth rates should have been enhanced for both light- and dark-incubated cells grown in light-aged medium. Instead, the growth rates were similar in fresh and aged media, and the light-enhanced growth phenotype was consistently observed regardless of medium age (see Fig. S1 in the supplemental material).
Growth was monitored by measuring the optical density at 660 nm (OD660). Both Aurantimicrobium strains have the crescent shape characteristic of freshwater Actinobacteria (20) (Fig. 3). To confirm that cell size and shape were similar under dark and light conditions, Aurantimicrobium sp. strain MWH-Mo1 was grown in the dark or the light and then imaged using scanning electron microscopy (SEM). Because the cells are ∼0.2 μm in diameter, they are too close to the limit of diffraction to image accurately using light microscopy. Instead, ImageJ was used to measure the cell diameter of ∼50 individual cells in 10 to 15 SEM images under each condition. The average cell diameter in the dark was 197 nm ± 16 nm, and the average cell diameter in the light was 193 nm ± 13 nm (Fig. S2). A Welch 2-sample t test was used to assess the difference and showed that the difference was not statistically significant (P = 0.15). Cellular morphologies were also consistent in the light and dark. Some extracellular material was observed in some of the SEM images under both light and dark conditions (Fig. 3). To confirm that this material did not contribute to the observed growth rate effect, all strains were grown in the light and dark. Cells were removed from both light- and dark-grown cultures by filtration, and the OD660 of the filtrate was measured. In all cases, the OD660 was 0 ± 0.001. We conclude that the growth rate differences observed are not due to changes in cell size or shape or to the production of extracellular material.
FIG 3.

Aurantimicrobium sp. strains MWH-Mo1 and MWH-Uga1 cell morphologies. Cells of both strains have the curved vibrio shape typical of the Luna subgroups of Actinobacteria. (A) SEM image of Aurantimicrobium sp. strain MWH-Mo1. (B) SEM image of Aurantimicrobium sp. strain MWH-Uga1. The scale is the same in the two images.
Genome sequences of Aurantimicrobium sp. strain MWH-Mo1 and Aurantimicrobium sp. strain MWH-Uga1.
Since the two Aurantimicrobium strains and R. lacicola share a light-enhanced growth phenotype, but PCR analysis previously demonstrated that only R. lacicola and Aurantimicrobium sp. strain MWH-Uga1 encode actinorhodopsins (29), we sequenced the two Aurantimicrobium genomes to identify potential light-capturing systems shared by all three species.
The complete Aurantimicrobium sp. strain MWH-Mo1 genome is a circular chromosome 1.75 Mb in length, which contains 1,792 open reading frames (ORFs) and 1 rRNA operon. The GC content is 54.6%, in line with the GC contents of other freshwater actinobacterial genomes (Table 2). The genome of Aurantimicrobium sp. strain MWH-Uga1 is smaller, at 1.6 Mb, but with 1,618 ORFs has a higher coding density. Its GC content is similar to that of strain MWH-Mo1 (52.4%).
TABLE 2.
Genome characteristics of Aurantimicrobium sp. strains MWH-Mo1 and MWH-Uga1 and related Actinobacteriaa
| Characteristic | Data forb: |
||||
|---|---|---|---|---|---|
| Aurantimicrobium sp. strain MWH-Mo1 | Aurantimicrobium sp. strain MWH-Uga1 | Aurantimicrobium minutum (30) | R. lacicola MWH-Ta8 (33) | Aquiluna rubrum (28) | |
| Genome size (Mbp) | 1.75 | 1.60 | 1.62 | 1.43 | 1.66 |
| GC content (%) | 54.6 | 52.4 | 52.1 | 51.5 | 51.9 |
| Coding density (%) | 93.76 | 94.95 | 93.18 | 92.68 | 93.37 |
| No. of open reading frames | 1,745 | 1,618 | 1,574 | 1,338 | 1,613 |
| No. of tRNAs | 42 | 41 | 42 | 39 | 42 |
| No. of rRNA operons | 1 | 1 | 1 | 1 | 1 |
All genomes are less than 1.8 Mbp and have moderate GC content and high coding density.
References for genomes sequenced elsewhere are in parentheses.
Based on 16S rRNA sequences, strains MWH-Mo1 and MWH-Uga1 belong to the Luna2 subgroup of Actinobacteria and fall within the Aurantimicrobium genus (Fig. 4). Because of their high similarity to Aurantimicrobium minutum (30), we have classified these two strains as Aurantimicrobium species. The 16S rRNA genes of the two Aurantimicrobium species described here are >99% identical to the 16S rRNA sequence of A. minutum. At the whole-genome level, the average nucleotide identity (ANI) between Aurantimicrobium sp. strain MWH-Uga1 and A. minutum is 90.6%, while the ANI between Aurantimicrobium sp. strain MWH-Mo1 and A. minutum is 84.6% (33). Since the ANI value between MWH-Uga1 and MWH-Mo1 is 79.3%, the three strains are expected to represent three distinct species (34), of which only A. minutum has been taxonomically described so far.
FIG 4.

16S rRNA gene sequences of the organisms described here (denoted with bold lines and asterisks) were compared with those of other sequenced actinobacterial genomes in a phylogenetic tree. All organisms in this tree except the outgroup, Streptomyces albus, belong to the family Microbacteriaceae. R. lacicola is a member of the Luna1 subgroup of Actinobacteria. The two Aurantimicrobium strains, closely related to Aurantimicrobium minutum, belong to the acIII subgroup; the phylogeny of freshwater actinobacteria is described in reference 16.
Genome comparisons.
The small genome sizes of the two Aurantimicrobium species are characteristic of freshwater Actinobacteria (24, 28, 32, 35). The genome sequences suggest that both are heterotrophic aerobes with the ability to utilize amino acids and other small organic molecules. There are no identifiable genes involved in dissimilatory sulfate reduction pathways, suggesting that, like other freshwater Actinobacteria, these organisms require exogenous reduced sulfur (36, 37). The genome of strain MWH-Mo1 also lacks a pathway for asparagine biosynthesis, suggesting that this strain, like other freshwater Actinobacteria, is auxotrophic for at least one amino acid (18, 36).
The Aurantimicrobium sp. strain MWH-Mo1 and Aurantimicrobium sp. strain MWH-Uga1 genomes share ∼1,312 genes with each other and 854 genes with R. lacicola (Fig. S3), as assessed by Enzyme Function Initiative-Enzyme Similarity Tool (EFI-EST) analysis (38). The majority of these genes encode housekeeping or central metabolic functions (Table S1). No complete pathway for any type of motility was identified in the R. lacicola genome (35), nor in either Aurantimicrobium genome, and none of the cells appear to be capable of phototaxis on soft agar (data not shown).
All three genomes encode at least one rhodopsin, predicted biosynthetic pathways for C50 carotenoids, and two proteins in the cryptochrome/photolyase family (CPF) of proteins. No proteins homologous to known (bacterio)chlorophyll [(B)Chl]-dependent photosystems were found in any of these genomes.
Rhodopsins are present in all three genomes.
As previously demonstrated by PCR (29), R. lacicola and Aurantimicrobium sp. strain MWH-Uga1 encode actinorhodopsins, while Aurantimicrobium sp. strain MWH-Mo1 does not. The genome sequences revealed that both Aurantimicrobium genomes encode homologs to heliorhodopsin (39). However, like R. lacicola, neither of these genomes has an identifiable beta-carotene cleavage dioxygenase, which would produce the retinal cofactor for the rhodopsin. To confirm that no retinal is synthesized under the conditions examined here, we grew all three strains to late exponential phase (∼24 h) in the light and dark, extracted the pigments, and analyzed the pigments by reverse-phase high-performance liquid chromatography (HPLC). No retinal was observed in any pigment extract (Fig. S4). In the absence of the retinal cofactor, there is no known way for the rhodopsin to absorb light and function either as a light sensor or as a proton pump. Additionally, the absorption maximum of heliorhodopsin is 551 nm (39). If heliorhodopsin were contributing to the observed increase in growth rate in the light, the green light (525 nm) should have enhanced growth more than the blue (425 nm) or UV (375 nm) light. Instead, growth in green light in both R. lacicola and Aurantimicrobium sp. strain MWH-Mo1 was indistinguishable from growth in the dark (Fig. 2).
Carotenoids play no role in the light-enhanced growth phenotype.
All of the strains with the light-enhanced growth phenotype described here are brightly colored (Fig. S5) and produce abundant carotenoids, isoprenoid pigments that are generally found in the cytoplasmic membrane. In R. lacicola, we predict that these are C50 carotenoids similar to bacterioruberin (40) and c.p.450 (41), based on the genes encoding carotenoid biosynthetic enzymes identified in the genome; in the two Aurantimicrobium spp., the carotenoids are likely less-oxidized C50 compounds. Because of their extended polyene chains, carotenoids absorb light and can serve as accessory antenna pigments for both rhodopsin- and (B)Chl-based photosystems (see reference 42 and references therein). However, they do not themselves convert light energy to chemical energy.
We fortuitously isolated a white mutant of R. lacicola, denoted R. lacicola TaW (Fig. 5A). This strain has a frameshift mutation in crtB (Fig. 5C), which encodes the phytoene synthase that is involved the first committed step in carotenoid biosynthesis (43). To determine whether the carotenoids in R. lacicola might contribute to the faster growth in the light, we grew the carotenoid-free white mutant in white light as well as under the same LEDs as described above. This strain grows faster in white and near-UV light than in the dark, red, green, or blue light, similar to wild-type R. lacicola (Fig. 5B). In fact, the effect on growth rate is even larger in this mutant, as 375-nm light results in a 30% increase in growth rate. Based on the growth phenotype of the mutant, we conclude that the carotenoids do not mediate the faster growth in near-UV or blue light. However, wild-type R. lacicola grows faster than R. lacicola TaW under all light conditions, so carotenoids likely contribute to fitness under both dark and light conditions.
FIG 5.

Characteristics of the colorless white mutant of R. lacicola. (A) Concentrated suspensions of wild-type (WT) R. lacicola cells are pink (left), but the mutant cells lack any visible pigment (right). The 16S rRNA gene of the mutant was sequenced and is identical to that of R. lacicola, confirming that it is not a contaminant. (B) The white mutant grows faster in near-UV light (375 nm) than in the dark or at any other wavelength. The asterisk indicates that this growth rate is different from the growth rate in the dark with a P value of <0.05 (one-sided t test). (C) The crtB gene was amplified from WT (Rhl-WT) and white (Rhl-crtB) strains of R. lacicola and sequenced. This gene encodes the first committed step in carotenoid biosynthesis, and when it is inactivated, no colored carotenoids can be synthesized. The mutant has a one-nucleotide deletion in crtB that leads to a premature stop codon, making the gene product nonfunctional.
Genomes contain multiple predicted proteins in the cryptochrome/photolyase superfamily.
The three genomes were examined for any potential light-sensitive pigments, proteins, or protein domains. None of the genomes encoded homologs to known bacterial blue-light sensors with cobalamin, bilin, coumaric acid, or protoporphyrin IX cofactors (see Table S2 for a list of proteins used as queries in these searches). Although they do not sense light, proteins known to regulate circadian rhythms in cyanobacteria, KaiABC, CikA, and LdpA (15) were also used as queries, but only short (<45-amino-acid) regions of homology were observed to predicted proteins in R. lacicola, Aurantimicrobium sp. strain MWH-Mo1, and Aurantimicrobium sp. strain MWH-Uga1. Several proteins with flavin (flavin adenine dinucleotide [FAD] and flavin mononucleotide [FMN]) cofactors were used as queries, and the only open reading frames in the actinobacterial genomes with full-length alignments to any of the queries were homologous to known photolyases and cryptochromes. Further, predicted proteins in all three genomes were compared to the PFAM database, and the results were then searched for PFAM domains relevant to light sensing, including PAS, GAF, and BLUF domains (44) and B12-binding domains (13) (see Table S3 for the list of domains used as queries). Although there were several predicted proteins with homology to the signal transduction domains (e.g., GGDEF and GAF), the only predicted proteins with homology to light-sensing domains were the predicted photolyases and cryptochromes identified by the full-length protein search.
Proteins in the cryptochrome/photolyase (CPF) superfamily are known to absorb blue light and use that energy either for DNA repair or to control gene expression (2, 45, 46). Three putative members of this superfamily were identified in the R. lacicola genome, and two of these were also found in the two Aurantimicrobium genomes (Fig. 6; see Fig. S6 for a version with species names). These open reading frames, though related, fall into three separate clades within the CPF, with one photolyase clade, a group with homologs to the CryB-type cryptochrome from Rhodobacter sphaeroides, and a putative cryptochrome-like family (denoted CPF2 in Fig. 6) that appears to be as yet uncharacterized. Species that, like R. lacicola, encode homologs to all three proteins include other Actinobacteria, phototrophic Chloroflexi and Chloracidobacteria, and photoautotrophic cyanobacteria.
FIG 6.

Phylogeny of cryptochrome/photolyase family (CPF) proteins found in Actinobacteria. Homologs of the three CPF proteins found in the R. lacicola genome were aligned with ClustalW, and a neighbor-joining tree was calculated with 1,000 bootstraps and then visualized with Iroki (78). The three proteins clearly group separately, with the CryB-type cryptochromes separate from both DNA photolyases (PhrB) and the other putative cryptochrome (here labeled CPF2). Homologs of CryB are broadly distributed among Actinobacteria, phototrophic Acidobacteria, Archaea (primarily the halophilic Archaea), Cyanobacteria, and Proteobacteria (both phototrophic and not). CPF2 is separated into two clear groups, one of which includes Actinobacteria and a few Proteobacteria and another that is found predominantly in Cyanobacteria and other phototrophs.
One ORF found in all three of the actinobacterial genomes studied here (RHOLA_RS03920, AURMO_01673, and AURUGA1_01549) encodes a protein with high levels of similarity to the biochemically characterized DNA photolyase PhrB from Streptomyces griseus, which repairs pyrimidine dimers in UV-damaged DNA when exposed to visible or near-UV light (47). The ortholog of this protein in R. lacicola, which is 48% similar and 34% identical to PhrB over the entire length of the protein (460 amino acids), has DNA photolyase activity in Escherichia coli (J. Heydt, S. Olson, J. L. Keffer, and J. A. Maresca, unpublished data). The Aurantimicrobium sp. strain MWH-Uga1 ortholog is 33% identical and 49% similar to the one found in S. griseus and 85% identical to the ortholog in Aurantimicrobium sp. strain MWH-Mo1.
One other predicted protein belonging to the CPF, a putative CryB-type cryptochrome, is shared by the R. lacicola and Aurantimicrobium sp. strain MWH-Mo1 and MWH-Uga1 genomes (locus tags RHOLA_RS06470, AURMO_00962, and AURUGA1_00706). Homologs of this CryB-type cryptochrome are also found in a variety of actinobacteria, cyanobacteria, proteobacteria, and haloarchaea (48). The proteobacterial, cyanobacterial, and actinobacterial homologs group separately with high bootstrap support, and the homologs found in the phototrophic Chloroflexi and chloracidobacteria also form their own clade, though less strongly supported (Fig. 6). This protein is related to the characterized Rhodobacter sphaeroides cryptochrome CryB (48–51); the R. lacicola homolog, RHOLA_RS06470, is 36% identical and 50% similar to the Rhodobacter sphaeroides version over the entire length of the protein (492 amino acids, PDB ID 3ZXS_A). The flavin-binding domains in CryB and PhrB are conserved in the actinobacterial homologs (Fig. 7). Both CryB from Rhodobacter sphaeroides and PhrB from Agrobacterium tumefaciens have a C-terminal Fe-S cluster, and the conserved FeS-binding Cys residues are also conserved in the R. lacicola homolog and both Aurantimicrobium sp. CryB homologs (Fig. 7).
FIG 7.

Protein domains of CryB and other CPF proteins. (A) The CryB protein from Rhodobacter sphaeroides includes a photolyase domain (pfam04244) at the N terminus, a PhrB domain (COG0415, which binds the antenna cofactor), and four cysteines involved in binding a 4Fe-4S cluster at the C terminus. This domain architecture is conserved in the CryB orthologs from all three of the light-responsive actinobacterial genomes. All four proteins also have homology along their entire lengths to COG3046, a DNA-photolyase-related protein domain (DPRP). (B) The biochemically characterized DNA photolyase from Streptomyces griseus (47) has homology to COG3046 along the whole protein, an N-terminal photolyase cofactor-binding domain (pfam00875), and a C-terminal FAD-binding domain (pfam03441). This domain architecture is conserved in the PhrB orthologs from all three of the light-responsive actinobacterial genomes. The ortholog from Aurantimicrobium sp. strain MWH-Uga1 is not depicted here because it is 85% identical to that of Aurantimicrobium sp. strain MWH-Mo1. (C) The cryptochrome/photolyase-related protein from R. lacicola has a PhrB domain (COG0415) near the N terminus but no homology to other members of this superfamily at the C terminus. Although several phylogenetically related actinobacteria do also encode this protein (see Fig. 6 and S6), it is not required for the light-enhanced growth phenotype, since neither Aurantimicrobium species has it.
The R. lacicola genome encodes an additional predicted member of the CPF clade, here denoted CPF2. Homologs of CPF2 are common in actinobacterial and cyanobacterial genomes and are also found in some phototrophic Chloroflexi and the radiation-tolerant deinococci. This group is divided into two main clades; the first includes Cyanobacteria, Chloroflexi, and Chlorobaculum species, and the second is composed almost entirely of Actinobacteria (Fig. 6). Nearly all of the genomes that encode one of the cryptochromes also have at least one homolog of the photolyase. Those that do not have a PhrB-type photolyase likely encode other types of DNA photolyases (reviewed in reference 45).
Absorption spectrum of putative CryB from R. lacicola.
Both CryB and the homologous PhrB in Agrobacterium tumefaciens bind two flavins, a flavin adenine dinucleotide (FAD) chromophore and 6,7-dimethyl-8-ribityl-lumazine, which absorb light at 375 and 415 nm (48, 52). Since both flavin-binding domains are conserved in the actinobacterial homologs (Fig. 7), and all three genomes have a homolog of ribH, which encodes the 6,7-dimethyl-8-ribityllumazine synthase (locus tags AURMO_00338, AURUGA1_01322, and RHOLA_RS05775), we tested whether the CryB ortholog in R. lacicola might be capable of absorbing light of the wavelengths that enhance growth. The gene encoding the CryB homolog, RHOLA_RS06470, was cloned into the expression vector, pET14B, with a hexahistidine tag and overexpressed in E. coli strain T7 Express, a derivative of E. coli strain BL21. This E. coli strain encodes a homolog of the 6,7-dimethyl-8-ribityllumazine synthase (GenBank accession number AMH21340.1 [53]), so we expect that it is capable of synthesizing the cofactor. The protein was purified using a nickel column (Fig. S7). The protein has a predicted molecular mass of 56 kDa, and the induced protein has an apparent molecular mass close to 55 kDa, as expected (Fig. S7). The absorption spectrum of the purified protein has absorption peaks at 377 and 410 nm (Fig. 8), similar to the absorption spectrum of the Rhodobacter sphaeroides CryB and close to the wavelengths of light that stimulated growth in R. lacicola and both Aurantimicrobium spp.
FIG 8.
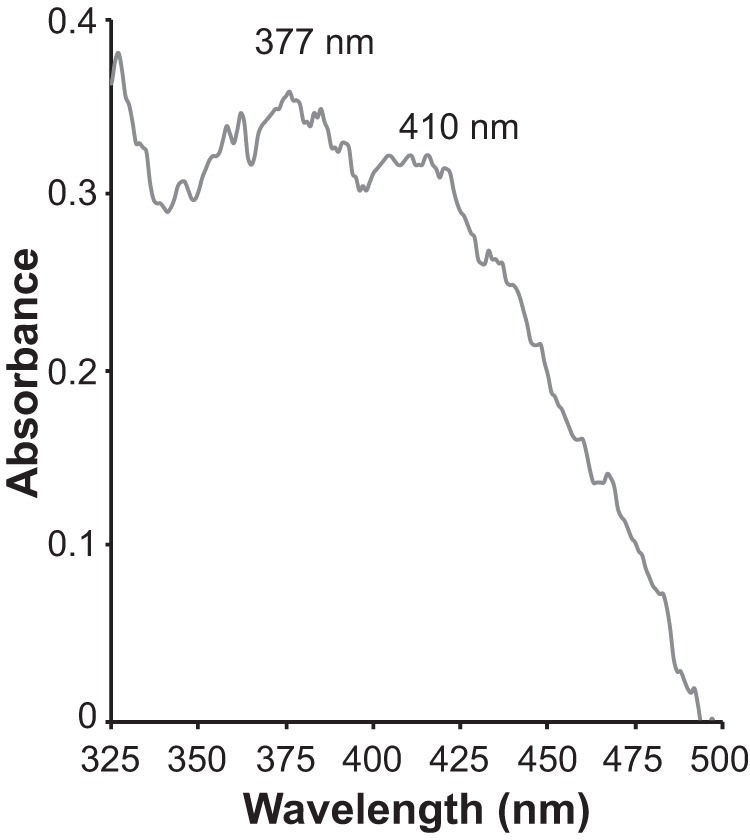
Absorption spectrum of RS06470. The CryB ortholog in the R. lacicola genome, RS06470, was cloned into an expression vector with an N-terminal hexahistidine tag, overexpressed, and purified over a nickel column. The semipurified protein has absorption maxima at 377 nm and 410 nm, close to the wavelengths of light that stimulate growth in this strain (375 and 425 nm) and the absorption maxima of CryB from Rhodobacter sphaeroides (375 and 415 nm [48]).
Gene expression in light and dark.
Although there is a potential light sensor, the CryB ortholog, that is shared by all three light-responsive strains, the lack of any identifiable photosystem encoded in the Aurantimicrobium sp. strain MWH-Mo1 genome, combined with the lack of any functional photosystem in R. lacicola or Aurantimicrobium sp. strain MWH-Uga1 (31), suggests that direct conversion of light energy to chemical energy is not responsible for the enhanced growth rates in blue light. However, light could potentially serve as a signal to upregulate functions related to heterotrophic growth. To test this hypothesis, we grew R. lacicola and Aurantimicrobium sp. strain MWH-Mo1 in constant white light or dark until late exponential phase and then analyzed the transcripts by RNA sequencing (RNA-seq). Because it is so similar to Aurantimicrobium sp. strain MWH-Mo1, the transcription patterns in Aurantimicrobium sp. strain MWH-Uga1 were not analyzed.
In R. lacicola, genes in carbohydrate metabolism pathways, including sugar transport and breakdown, are more highly transcribed in the light than in the dark (Fig. 9A). Glycan biosynthesis is also upregulated in the light, suggesting that some of the sugar imported is stored. Transcripts related to nucleotide metabolism and DNA synthesis are also more abundant in the light than in the dark. However, transcripts related to protein synthesis and translation are much more abundant in the dark (Fig. 9A). Similarly, in Aurantimicrobium sp. strain MWH-Mo1, genes in carbohydrate and amino acid metabolism as well as degradation of xenobiotics are overrepresented in the light (Fig. 9B). As in R. lacicola, genes with functions related to translation are much more highly transcribed in the dark (Fig. 9B). These results suggest that light triggers a change in transcription that upregulates carbohydrate transport and metabolism, resulting in enhanced production of biomass and thus faster growth in the light. Interestingly, in both strains, the genes encoding the predicted CryB-type cryptochrome (RHOLA_RS06470 and AURMO_00962) is significantly more transcribed in the light than in the dark, and the DNA photolyase gene (RHOLA_RS03920 and AURMO_01673) is significantly more transcribed in the dark (Table S5). Additionally, the CPF2 in R. lacicola is significantly more highly expressed in the dark than in the light, as it has the largest fold difference in transcript levels of all the genes in R. lacicola (Table S5). We note here that in both species, the rhodopsin-encoding genes are upregulated in the light (heliorhodopsin transcripts are 0.5-fold more abundant in Aurantimicrobium sp. strain MWH-Mo1, and actinorhodopsin transcripts are 1.36-fold more abundant in R. lacicola in the light, with P < 0.001 for both).
FIG 9.

RNA-seq analysis of light- and dark-grown cells. R. lacicola (A) and Aurantimicrobium sp. strain MWH-Mo1 (B) were grown in constant light or dark until late exponential phase. Differentially expressed genes were identified by Cuffdiff (q < 0.05) and annotated with KEGG Orthology B-level reference hierarchy terms; children of the A-level hierarchy terms “organismal systems” and “human diseases” were excluded. The number of differentially expressed genes in each category is plotted here. Asterisks indicate statistically significant enrichment in the number of genes in a given category between conditions (P < 0.05 using Fisher’s exact test). In both species, significantly more genes related to carbohydrate transport and metabolism are expressed in the light, while significantly more genes related to translation are expressed in the dark.
Potential signaling pathways.
If light is a cue for a change in activity rather than a source of energy, the signal must be transferred from the light sensor to a transcription factor in the cell. One predicted protein found in all three genomes, homologous to the cytosolic PdtaS histidine kinase of Mycobacterium spp. (54, 55), has histidine kinase domains on either side of a PAS domain (RHOLA_RS05490, AURMO_00401, and AURUGA1_01264). Homologs of known two-component systems shared by all three genomes include genes similar to mtrAB, pknAB, and tcrXY. In both strains, the tcrXY genes are expressed more highly in the dark than in the light (Table S5). Other potential regulatory proteins include homologs of regX3, spk1, and purC and the homologs of whiA and whiB, which are widespread in both spore-forming and non-spore-forming Gram-positive bacteria (56, 57). It is important to note here that 57 of the predicted proteins shared by R. lacicola and the two Aurantimicrobium spp. are hypothetical and have no predicted function; the signal transduction and gene regulatory pathways in this system may belong to as-yet-unidentified protein families.
DISCUSSION
Here, we show that three strains of freshwater Actinobacteria grow faster in the light than in the dark. Since none of these species produce functional photosystems, we hypothesize that the light-responsive Actinobacteria do not convert light energy to chemical energy. Instead, we propose that light is used as a signal that alters gene expression and thus, cellular activity, resulting in faster growth when cells are exposed to near-UV and blue wavelengths of light. Genome comparisons suggest that the only potential blue-light-absorbing photoreceptors shared by all three light-responsive strains are a putative DNA photolyase and a CryB-type cryptochrome. Since cryptochromes are flavoproteins that absorb blue light and regulate circadian rhythms in animals, plants, and fungi, we propose that the CryB-type cryptochrome in Actinobacteria absorbs blue light and signals the cells to upregulate central carbon uptake and processing pathways, resulting in faster growth. The light wavelengths that best stimulate growth coincide with the absorption maxima of the flavin cofactors of cryptochromes, which typically have absorption peaks between 350 and 450 nm (2, 48, 52, 58). Although not all flavoproteins have light-dependent activity, the observed change in growth rate strongly implies that a receptor in the cells with the absorption characteristics of a flavoprotein absorbs light and causes a change that results in higher growth rates.
Light is potentially an important signal to freshwater Actinobacteria related to R. lacicola and Aurantimicrobium spp., which are widespread in illuminated surface environments and are often found in association with cyanobacteria (16–27, 37, 59, 60). Since light serves as a signal for upregulation of primary production in surface environments, it could reasonably also serve as a signal for upregulation of heterotrophy, allowing heterotrophs to efficiently take advantage of organic carbon as it is produced (61). In fact, other studies have suggested that acI-related freshwater Actinobacteria are specialized for uptake of phytoplankton exudate (62), especially amino acids (63, 64). Further evidence for actinobacterial dependence on primary producers comes from the genomes, which indicate that freshwater Actinobacteria tend to be auxotrophic for specific amino acids and other cofactors, such as retinal and B vitamins (18, 31).
We investigated the effect of light on growth rate and transcription in cultures of Actinobacteria grown in complex medium. Under these conditions, organic carbon is not limiting. In contrast, in the euphotic zone of aquatic systems, the availability of exudates released by primary producers is expected to undergo diurnal cycles with release rates coupled to photosynthesis rates. In addition, even maximum concentrations of exudates in natural systems would be several orders of magnitude lower than concentrations of substrates in the medium used for the experiments. Under such scarce and diurnally fluctuating conditions, metabolic synchronization with substrate availability should have a strong implication for fitness of the bacteria in the environment. In fact, under in situ conditions, the growth advantage of light-responsive strains might be much more pronounced than the rather small effect observed in the experiments. Furthermore, synchronization that uses light as a trigger is a more cost-efficient mechanism than sensing the availability of a small number of substrates by specific sensory proteins. Especially in bacteria with streamlined genomes, such as these, selection is expected to favor such a cost-efficient system of metabolic synchronization with substrate availability (65). Bacteria with larger genomes, as well as motile bacteria actively optimizing growth conditions, would be expected to use different ways to adjust their metabolic activity to the current substrate availability.
Homologs of the protein that we predict mediates this response to light, CryB, are widespread in freshwater Actinobacteria, suggesting that this light response may also be common in surface waters. CryB has been well characterized in Rhodobacter sphaeroides, absorbs blue (∼420 nm) light under anoxic conditions, and interacts with AppA to modulate expression of the photosystem (50, 51). In contrast, the orthologous protein in Agrobacterium tumefaciens, named PhrB, absorbs light at 375 and 415 nm and has DNA photolyase activity (52). These contrasting roles indicate that the CryB family of proteins, while structurally similar, is functionally diverse. Further, if CryB initiates a signaling cascade in Actinobacteria, it does not do so via a pathway similar to that of Rhodobacter sphaeroides, as no homologs to proteins in that pathway are found in the R. lacicola or Aurantimicrobium sp. genomes. Other members of the CryB family of proteins are found in many Actinobacteria and a variety of phototrophs, including cyanobacteria, acidobacteria, Chloroflexi, and Haloarchaea.
Bacterial genomes that, like R. lacicola, encode homologs to all three CPF proteins include “Candidatus Rhodoluna planktonica,” other Actinobacteria (Aeromicrobium marinum, Aeromicrobium erythreum, Geodermatophilus sp. strain Leaf369, Marmoricola sp. strain Leaf446, Nocardioides alpinus, and Rhodococcus fascians), phototrophic Chloroflexi and chloracidobacteria typically found in hot springs, and three freshwater cyanobacteria (Synechococcus sp. strain LL, Synechococcus sp. strain Tous, and Nostoc punctiforme PCC 73102). It is possible that the two cryptochromes regulate responses to different wavelengths of light; Chlamydomonas reinhardtii has a cryptochrome that responds to both blue and red light (58). Another possibility is that CryB in R. lacicola regulates the regulon that is most active in the light, while CPF2 controls the “dark” regulon. This possibility is potentially supported by the observation that CPF2 has the largest fold difference in transcript levels of all the genes in R. lacicola, as it is significantly more highly expressed (9.8×) in the dark than in the light (see Table S5 in the supplemental material). Alternatively, the CPF2 protein could regulate processes that have, at most, minimal effects on growth rate. Since it is not shared by all three genomes, however, it is unlikely to play a major role in the phenotype described here.
We note here that although the current evidence suggests that a flavoprotein serves as a photoreceptor, our data do not definitively identify the CryB-like protein shared by R. lacicola and the two Aurantimicrobium strains as the photoreceptor responsible for the observed phenotype. In fact, the recently identified cobalamin-dependent blue light receptors (13) and heliorhodopsins (39) demonstrate that novel photoreceptors are found regularly. The heliorhodopsins present in two of the three genomes described here may, like the heliorhodopsins previously described, serve as light sensors rather than as light-activated ion pumps (39). However, since the characterized heliorhodopsins absorb green to yellow light (551 nm), they are unlikely to be involved in the blue-light reception and response described here. Additionally, the two Aurantimicrobium genomes do not encode any pathway for retinal biosynthesis, nor was any retinal detected in the pigment extracts. The heliorhodopsins are unlikely to be photoactive without this light-absorbing cofactor.
Regardless of the identity of the light-sensing protein, the photoreceptor likely initiates a signal transduction cascade that ultimately controls the activity of a transcription factor and thus the transcription of a specific regulon. Although several predicted proteins with homologs in the genomes of R. lacicola and both Aurantimicrobium species encode sensor kinases, response regulators, and transcription factors, there is no clear similarity to the signaling pathway downstream of CryB in Rhodobacter sphaeroides. The only identifiable two-component regulatory system that is differentially expressed in the dark and light is tcrXY, which is more highly expressed in the dark than in the light in both R. lacicola and Aurantimicrobium sp. strain MWH-Mo1 (Table S5); however, a signal transduction pathway responsible for altered gene expression in light or darkness would not necessarily be differentially expressed under these conditions. Several of the other sensor kinases and response regulators shared by all three genomes are also found in other Actinobacteria, where they regulate morphology and cell wall structure; in R. lacicola and Aurantimicrobium spp., these proteins may play a role in the unusual shape of the cells (Fig. 3). In Corynebacterium glutamicum, MtrA and MtrB regulate the response to osmotic stress as well as cell wall biosynthesis (66–68). Similarly, the serine/threonine protein kinases PknA and PknB regulate cell morphology in Mycobacterium tuberculosis (69), and TcrX and TcrY are a response regulator and sensor histidine kinase involved in regulation of Mycobacterium virulence and are highly expressed during iron stress (70, 71). In streptomycetes, WhiA and WhiB are required for spore formation, and their apparent regulatory targets include genes whose products are involved in morphology, growth at the ends of cells, cell division, and chromosome segregation (56). R. lacicola and both Aurantimicrobium species have homologs of both whiA and whiB (Table S1).
In sum, the data here suggest that possibly many of the abundant freshwater Actinobacteria use light as a signal for substrate availability and a trigger for metabolic synchronization. In the strains analyzed here, light upregulates sugar import and metabolism and results in higher growth rates. Since these species do not have functional photosystems under our culture conditions, the data suggest that bacteria do not have to convert light energy to chemical energy to obtain a selective advantage in the light. Responding to light by upregulating organic carbon import suggests that these species can coordinate their activity with the time of maximum release of photosynthate by primary producers. The ability to increase the metabolic machinery in the cell before the source of organic carbon is actually present would give them a selective advantage over microbes that might upregulate carbon transport and processing pathways only after detection of the substrate(s). The broad distribution of the CryB- and CPF2-type cryptochromes in phototrophic organisms suggests that they are common in light-sensing organisms; their broad distribution in heterotrophs implies that we are deeply unaware of how many organisms sense light and how they integrate light (either as energy or as information) into physiological activity and genetic circuitry.
MATERIALS AND METHODS
Strains and growth conditions.
Aurantimicrobium sp. strains MWH-Mo1 and MWH-Uga1, originally isolated as Actinobacterium sp. strains MWH-Mo1 and MWH-Uga1, respectively (20), were grown as described previously in 0.3% NSY medium at 28 to 31°C (72). For standard passaging on solid medium, 0.3% NSY was solidified with 1.5% agar.
For experiments comparing growth rates at specific wavelengths of light, cells were diluted to an optical density at 660 nm (OD660) of 0.001 in 4 ml of 0.3% NSY and incubated with shaking at a distance of 24 cm from LED light sources. The light flux at this distance was ∼3 μmol photons m−2 s−1, and the light sources had emission wavelengths of 375 nm, 425 nm, 525 nm, and 650 nm, with ∼10-nm bandwidths. Dark conditions were maintained by wrapping culture tubes in paper and aluminum foil. The temperature of cell-free NSY in the 28°C incubator was always 27.8 to 28.2°C whether exposed to light or wrapped in paper and foil to prevent light exposure. Growth was monitored by measuring OD660. Growth rates were calculated from optical densities during exponential-growth phase, and the significance of differences in growth rates was calculated using a two-sample t test in R.
Identification of the colorless mutant.
White colonies appeared occasionally when R. lacicola (normally red) was grown on solid NSY medium. To check that these were not laboratory contaminants, white colonies were first restreaked on NSY and then grown in liquid medium. DNA was extracted, and the 16S rRNA gene was amplified using primers 8F and 1492R (73). The amplicon was sequenced directly at the University of Delaware Sequencing and Genotyping Center using the same primers and compared to the R. lacicola 16S rRNA gene. After confirming that the sequences were identical, the crtB gene from both the white mutant (denoted TaW) and wild-type R. lacicola was amplified using primers FP-CrtB (5′-GAA TTC GTG AGC TCC CCT AAC TC-3′) and RP-CrtB (5′-CGG GAT CCT CAC TTA GGG GAC AC-3′). Amplicons were sequenced at the University of Delaware Sequencing and Genotyping Center.
Scanning electron microscopy.
Cells were grown in NSY overnight under light or dark conditions, harvested by centrifugation for 20 min at 4,500 × g, and washed once with 10% glycerol. Cells were again centrifuged and fixed in 2% glutaraldehyde. Fixed samples were incubated on poly-l-lysine-treated silicon support wafers (catalog no. 16007; Ted Pella) for 1 h. After sample incubation, any unbound material was washed off with 1× filtered phosphate-buffered saline (PBS), followed by a 1-h incubation in 1% osmium tetroxide. Samples were rinsed with Nanopure water and dehydrated in an ethanol dilution series at increasing concentrations of ethanol. Following dehydration, the samples were placed into a critical point dryer (Tousimis Autosamdri-815B). Samples were then mounted on aluminum stubs and coated with 4.0 nm of platinum with a Leica ACE600 sputter coater. Imaging was performed on a Hitachi S-4700 field-emission SEM (FE-SEM) at 3.0 kV.
DNA extraction and library preparation.
Cultures (500 ml) of Aurantimicrobium sp. strains MWH-Mo1 and MWH-Uga1 were grown in 0.3% NSY medium (72) with shaking at room temperature (∼25°C) for 14 days. Cells were harvested by centrifugation, and DNA was extracted using the PowerSoil DNA isolation kit (catalog no. 12888-50; Mo Bio, Carlsbad, CA) following the manufacturer’s instructions. DNA was stored at −20°C until processing.
DNA sequencing.
The single-molecule real-time (SMRT) libraries for PacBio sequencing were prepared using the standard PacBio protocol for 20-kb libraries (74). DNA fragments larger than 10 kb were selected by BluePippin (Sage Science). The average fragment size of the library was 25 kb, as measured by a fragment analyzer (Advanced Analytical Technologies, Inc.). Sequencing was performed in a single SMRT cell in a Pacific Biosciences RSII single-molecule sequencer using P6-C4 chemistry with a 6-h movie.
Genome assembly.
For both Aurantimicrobium genomes, the reads were initially assembled using Hierarchical Genome Assembly Process 3 (HGAP3) software from PacBio, with a seed read fragment length of 10 kb. The initial assembly of the Aurantimicrobium sp. strain MWH-Mo1 genome resulted in two contigs, one linear (32,252 bp, 37× coverage) and one circular (1,787,627 bp, ∼500× coverage). To confirm that the small linear contig was in fact a segment of the genome, the two contigs were aligned using Gepard version 1.40 (58). Plotting the larger contig against itself showed that the end of the sequence aligns with the beginning, indicating a complete circular chromosome with ∼40-kb overlap. The smaller contig was plotted against the larger one, and it clearly aligns with a small region of the larger contig. A short highly repetitive region of the smaller contig aligns to a different region of the larger contig. The closed genome sequence has a length of 1.748 Mb. The initial assembly of the Aurantimicrobium sp. strain MWH-Uga1 genome resulted in a single circular contig (1,639,476 bp, ∼850× coverage). Again, the Gepard dot-plot showed that the chromosome was complete and circular.
Genome annotation.
RAST (version 2.0) and PROKKA (version 1.11) were used to identify the ORFs and annotate the genome (59, 60). These annotations were compared using BEACON, which compares start and stop sites and annotations generated by different annotation systems (61). Fifty comparisons between the PROKKA and RAST annotations were made by iterating the offset value from 1 to 50. Using these comparisons as a guide, entries that were not matched by BEACON were manually matched. This comparison led to a consensus annotation which contained elements from the RAST and PROKKA annotations. Because PROKKA does not annotate rRNAs, the three rRNA genes identified by RAST were manually added to the PROKKA annotations in both genomes. A custom biopython script was then used to number the predicted start sites, stop sites, and locus tag numbers of the annotation features for both genomes such that dnaA is the first feature (AURMO_00001 and AURUGA1_00001).
Genome comparisons.
A fasta file containing the amino acid sequences of all predicted proteins in the genomes of R. lacicola and Aurantimicrobium sp. strains MWH-Mo1 and MWH-Uga1 was uploaded to the EFI-Enzyme Similarity Tool website (https://efi.igb.illinois.edu/efi-est/index.php). This tool calculates the similarities between all sequences and generates a sequence similarity network, which can be used to identify clusters of homologous proteins. In the sequence similarity network, nodes represent proteins and edges represent a sequence alignment score that falls above the lower limit (here set to 35). The sequence similarity network was visualized in Cytoscape using the yFiles organic layout. Custom scripts were used to count and sort the nodes and edges in the network to identify the number of ORFs shared by all three genomes, shared by two genomes, or unique to one genome.
Amino acid sequences of proteins known to be involved in light sensing in bacterial systems were used as queries in BLASTp searches of the three genomes (see Table S2 in the supplemental material). Amino acid sequences of all predicted proteins were also compared to the Pfam (version 31) and TIGRfam (version 14) databases using HMMER (version 3.1b2) (75), and the results were then searched for specific Pfam domains known to be involved in bacterial light sensing (Table S3).
Pigment analysis.
Cultures (30 to 40 ml) were grown in NSY medium in light or darkness as described above. Cells were harvested by centrifugation at 5,000 × g for 15 min and resuspended in 0.4 ml HPLC-grade methanol. Cells were sonicated on ice (50% duty cycle, 1-s on/off pulses) using a Fisher Scientific probe sonicator (sonic dismembrator model 120, probe model CL-18). The lysate was centrifuged at 12,000 × g for 2 min to remove cell debris, and the colored supernatant was filtered through a 0.2-μm polytetrafluoroethylene syringe filter (Thermo Scientific) into glass vials. The pellets were colorless, indicating complete extraction of pigments from the membranes. For release of retinal oxime from rhodopsins, 20 μl of a 50% hydroxylamine solution (Alfa Aesar) was added to the lysate and incubated on ice for 1.5 h, followed by methanol extraction, centrifugation and filtration as described above. Reverse-phase HPLC was performed on a Shimadzu Prominence system with solvent degasser (DGU-20A5), quaternary pump (LC-20AT), and 996-element diode array detector (SPD-M20A) fitted with a Supelco Ascentis reverse-phase C18 column (100 by 3 mm, 3-μm beads, catalog number 581308-U; Sigma-Aldrich) using the solvents described by Frigaard et al. (76). The gradient parameters were 0 min, 10% B; 20 min, 100% B; and 35 min, 100% B at a flow rate of 0.6 ml min−1. The retinal standard (catalog no. R3041; Spectrum Chemical) was dissolved in methanol; to produce a retinal oxime standard, 20 μl of a 50% hydroxylamine solution (catalog no. B22202AE; Alfa Aesar) was added to 200 μl retinal and incubated on ice for 1.5 h.
Phylogenetic analyses.
Thirty 16S rRNA gene sequences were aligned to the SILVA (release 132) small subunit (SSU) rRNA profile using SINA (version 1.2.11) (77). Common gaps were removed, and nonoverlapping ends were trimmed to a final alignment of 1,416 positions corresponding to 1,373 bp beginning at E. coli position 47. Pairwise distances were determined from the alignment (Jukes and Cantor), and a neighbor-joining tree rooted to Streptomyces albus DSM 41298 was produced in Geneious version 7.1.9, with 1,000 bootstrap replicates.
Comparison of proteins in the cryptochrome/photolyase family.
Amino acid sequences for R. lacicola ORFs RHOLA_RS05465, RHOLA_RS03920, and RHOLA_RS06470, which encode the CPF2, photolyase, and putative CryB, respectively, were used as queries in BLAST searches against the Aurantimicrobium sp. genomes and against the nonredundant database at NCBI. Genomes that encoded one of the two cryptochromes were subsequently searched for the other and for the photolyase. Sequences were aligned with ClustalX, trimmed manually, and realigned. The neighbor-joining tree was calculated in ClustalX with 1,000 bootstrap replicates and visualized with Iroki (78). The same amino acid sequences were used as queries against the NCBI Conserved Domain Database (CDD) to identify Pfam and Clusters of Orthologous Groups (COG) domains within the protein sequences.
Protein overexpression and purification.
The gene RHOLA_RS06470 was amplified from R. lacicola genomic DNA using primers RS06470_F (5′-ctg gtg ccg cgc ggc agc cat ATG GCT TTT GAG CGA ATT CTT TA-3′) and RS06470_R (5′-gc cgg atc ctc gag cat act AGA TTT CAC CTT TAT CAA GAC-3′) via PCR with Phusion DNA polymerase and an annealing temperature of 51°C (uppercase letters in the primer sequences indicate regions of homology to the R. lacicola genome; lowercase letters indicate regions of homology to pET14B). The pET14B plasmid (catalog no. 69660; Novagen) was linearized with NdeI, and the linearized plasmid and PCR product were assembled using the Gibson Assembly cloning kit (catalog no. E5510S; NEB). The gene was cloned in-frame with an N-terminal 6×His affinity tag and thrombin cleavage site. The ligation product was transformed into NEB 5-alpha competent E. coli (catalog no. C2987; NEB) by heat shock, following the vendor’s instructions, and purified from the cells after growth via alkaline lysis (79). The plasmid insert was sequenced by Sanger sequencing at the UD DNA Sequencing and Genotyping Center. A plasmid with correct insert free of mutations was transformed into T7 Express competent E. coli (catalog no. C2566I; NEB) by heat shock, as per the manufacturer’s instructions.
A single colony of E. coli T7/pET14B_RS06470 from a freshly streaked agar plate was grown in LB with 1% glucose and 100 μg/ml ampicillin overnight at 37°C with shaking. Cells were then transferred to 250 ml growth medium (per liter, 1.5 g Na2HPO4, 0.75 g KH2PO4, 5 g tryptone, 1.25 g yeast extract, 0.6% glycerol, amended with 100 μg ml−1 ampicillin). Cells were grown for 2 h at 23°C with shaking, and then protein expression was induced by the addition of 0.2 mM isopropyl-β-d-1-thiogalactopyranoside. After 4 h of additional growth, cells were harvested and lysed. The cell pellet was resuspended in 1.25 ml BugBuster (catalog no. 71456-3; Novagen) with 1 mM benzamidine hydrochloride hydrate. Cells were incubated for 15 min at room temperature with shaking. Unbroken cells and insoluble debris were removed by centrifugation at 16,000 × g for 20 min at 4°C.
The supernatant containing soluble protein was mixed 1:1 with equilibration buffer (PBS plus 10 mM imidazole). PBS was prepared as 20 mM sodium phosphate (1:4 40 mM NaH2PO4-40 mM Na2HPO4) and 300 mM NaCl (pH 7.4). A 1-ml HisPur nickel-nitrilotriacetic acid (Ni-NTA) spin column (catalog no. 88225; Thermo) was centrifuged at 700 × g for 2 min to remove storage buffer. The column was equilibrated with 2 column volumes (cv) of equilibration buffer and centrifuged again. The bottom of the column was closed off, and supernatant-equilibration buffer was added to the column and incubated with gentle mixing for 30 min at room temperature. The bottom plug was removed and the column centrifuged. The flowthrough was retained for analysis. The column was then washed with 2 cv of wash buffer (PBS plus 25 mM imidazole) and centrifuged. This step was repeated twice. The His-tagged proteins were eluted in 1 cv of elution buffer (PBS plus 250 mM imidazole), repeated twice. Elution fractions were analyzed by SDS-PAGE. The column was washed with 5 cv MES buffer [20 mM 2-(N-morpholine)-ethanesulfonic acid, 0.1 M NaCl (pH 5.0)] and 5 cv water and then stored in 20% ethanol.
Fractions to be analyzed by SDS-PAGE were boiled at 100°C for 10 min 1:1 in 2× loading buffer (250 mM Tris, 2% SDS, 30% glycerol, 10% 2-mercaptoethanol, 0.002% bromophenol blue). Samples were loaded on a 10% Tris-buffered polyacrylamide resolving gel, topped with a 5% polyacrylamide stacking gel, and electrophoresed according to the method of Laemmli (80). The gel was washed with deionized (DI) water, fixed with 10:25:65 glacial acetic acid-methanol-water for 15 min, and stained with LabSafe Gel Blue (catalog no. 786-35; G-Biosciences). The molecular weight standard was PageRuler 10- to 180-kDa prestained protein ladder (catalog no. 26616; Thermo Scientific). An absorption spectrum from 200 to 500 nm of a fraction containing RS06470 was recorded using a Thermo Scientific BioMate 3S UV-visible spectrophotometer. The same spectrum of elution buffer was recorded and subtracted from the protein-containing spectrum.
RNA extraction and cDNA library preparation.
Cultures (4 replicates, 50 ml each) of R. lacicola and Aurantimicrobium sp. strain MWH-Mo1 were grown in 6 g liter−1 NSY medium until late exponential phase in constant light (∼30 to 40 μmol photons m−2 s−1 with a 13-W compact fluorescent lamp) or darkness with gentle shaking. Cells were harvested by centrifugation, resuspended in RNAlater (Invitrogen), and stored at −80°C until processing. Total RNA was extracted using protocols modified from the Qiagen RNAprotect bacteria reagent handbook. Briefly, cells were centrifuged to remove RNAlater and resuspended in TE (30 mM Tris-HCl, 1 mM EDTA [pH 8.0]) containing 15 mg ml−1 lysozyme (catalog no. BP5355; Fisher) and 2 mg ml−1 proteinase K (catalog no. P8107S; NEB). Cells were briefly vortexed and then incubated for 10 min at room temperature with intermittent vortexing. The appropriate volume of Qiagen buffer RLT containing β-mercaptoethanol (VWR) was added. Cells were additionally disrupted by bead-beating with autoclaved diethyl pyrocarbonate (DEPC)-water-washed beads (0.2 mm zirconium, catalog no. 12621-158; VWR) for 10 min. Cellular debris and beads were removed by centrifugation and the supernatant transferred to a new tube, where 100% ethanol was added. Purification of total RNA was continued using the RNeasy minikit (Qiagen catalog no. 74104) according to protocol 7 and included the on-column DNase digestion (appendix B, Qiagen catalog no. 79254). Residual DNA contamination was removed by treatment with Turbo DNase (Ambion catalog no. AM1907).
RNA quality was assessed using an AATI fragment analyzer. When needed, RNA was concentrated using the RNeasy spin columns and Qiagen’s RNA cleanup protocol with a 10-min room temperature incubation before the final centrifuge step. The rRNA was removed using the Ribo-Zero magnetic kit for bacteria (Epicentre catalog no. MRZB12424), and 10 to 400 ng of rRNA-depleted RNA was concentrated by ethanol precipitation following the protocol recommended by the Ribo-Zero manufacturer. The ethanol-precipitated rRNA-depleted RNA pellet was resuspended in 18 μl of the Fragment, Prime, Finish mix from Illumina’s TruSeq Stranded mRNA LT product (RS-122-2101). RNA was fragmented for 1 min at 94°C. Subsequently, cDNA copies of the RNA were synthesized using SuperScript II reverse transcriptase (Invitrogen catalog no. 18064022), and double-stranded cDNA was purified with Agencourt AMPure XP beads (Beckman Coulter catalog no. A63880) following Illumina’s TruSeq protocol (RS-122-9004DOC). The 3′ ends of the cDNA were adenylated, indexing adapters were ligated onto the ends, and the cDNA was amplified by PCR using primers that anneal to the ends of the adapters. The BluePippin DNA size selection system was used to select for fragments of <500 bp. The library was normalized, pooled, and sequenced in two lanes of a flow cell on the Illumina HiSeq 2500 by the University of Delaware Sequencing and Genotyping Center. A total of 287,362,071 single-end 51-bp reads were obtained from eight samples (12,972,160 to 23,534,512 per sample).
RNA-seq analysis.
The transcriptome data were quality-filtered using Trim Galore version 0.4.1, Cutadapt version 1.12, and FastQC with the following parameters: trimming mode, single end; quality Phred score cutoff, 25; maximum trimming error rate, 0.1; minimum required adapter overlap, 1 bp; and minimum required sequence length before sequence gets removed, 35 bp to remove low-quality reads. Reads were then aligned to the genomes using TopHat. The number of reads assigned to each gene was calculated with Cufflinks. The number of reads assigned to genes in light and dark conditions were compared using Cuffmerge, and the significance of this difference (H0 = there is no difference in the mean number of reads mapping to a particular gene) was tested using Cuffdiff. Genes with a difference in the mean with P values of <0.05 were considered significantly different and included in the downstream analyses.
KEGG term enrichment analysis.
Differentially expressed genes (q < 0.05) were used as query sequences for a BLASTN search against the UniRef100 database (version 9/19/2017) (81). The database had previously been annotated with mapping to KEGG terms (82). The top informative BLAST hit (i.e., hit with KEGG mapping information; E value <0.001) was used to annotate genes with KEGG level-B annotation terms (excluding children of the level A terms “human disease” and “organismal systems”). Terms were tested for relative enrichment under light or dark conditions by Fisher’s exact test. The false-discovery rate (FDR) correction method of Benjamini and Hochberg (83) was used to correct for multiple comparisons, and terms with q value of <0.05 were considered significantly enriched.
Data availability.
The Aurantimicrobium sp. strain MWH-Mo1 and MWH-Uga1 genomes have been deposited at NCBI with BioProject numbers PRJNA386293 and PRJNA431805, respectively. The raw and processed RNA-seq data have been submitted to the NCBI-GEO database with project accession numbers GSE116706 and GSE116705 for R. lacicola strain MWH-Ta8 and Aurantimicrobium sp. strain MWH-Mo1, respectively.
Supplementary Material
ACKNOWLEDGMENTS
The research reported in this publication was supported by an Institutional Development Award (IDeA) from the National Institute of General Medical Sciences of the National Institutes of Health under grant 5 P30 GM103519. This study benefited from a Core Center Access Award and infrastructural support to the Bioinformatics Core Facility, Sequencing and Genotyping Center, and DBI BioImaging Center provided by the Delaware INBRE program with a grant from the NIH-NIGMS (P20 GM103446) and the State of Delaware. Additional support for this research came from the Department of Civil and Environmental Engineering.
We gratefully acknowledge Brewster Kingham and Summer Thompson in the University of Delaware Sequencing and Genotyping Center for assistance with genome sequencing, Karol Maskiewicz at the Delaware Biotechnology Institute for his assistance with the core computing facility, and Thomas Hanson in the University of Delaware School of Marine Science and Policy for the use of the LEDs.
For a commentary on this article, see https://doi.org/10.1128/JB.00082-19.
Supplemental material for this article may be found at https://doi.org/10.1128/JB.00740-18.
REFERENCES
- 1.Battin TJ, Luyssaert S, Kaplan LA, Aufdenkampe AK, Richter A, Tranvik LJ. 2009. The boundless carbon cycle. Nat Geosci 2:598–600. doi: 10.1038/ngeo618. [DOI] [Google Scholar]
- 2.Chaves I, Pokorny R, Byrdin M, Hoang N, Ritz T, Brettel K, Essen L-O, van der Horst GTJ, Batschauer A, Ahmad M. 2011. The cryptochromes: blue light photoreceptors in plants and animals. Annu Rev Plant Biol 62:335–364. doi: 10.1146/annurev-arplant-042110-103759. [DOI] [PubMed] [Google Scholar]
- 3.Ziegelhoffer EC, Donohue TJ. 2009. Bacterial responses to photo-oxidative stress. Nat Rev Microbiol 7:856–863. doi: 10.1038/nrmicro2237. [DOI] [PMC free article] [PubMed] [Google Scholar]
- 4.Avila-Pérez M, Hellingwerf KJ, Kort R. 2006. Blue light activates the sigmaB-dependent stress response of Bacillus subtilis via YtvA. J Bacteriol 188:6411–6414. doi: 10.1128/JB.00716-06. [DOI] [PMC free article] [PubMed] [Google Scholar]
- 5.Armitage JP, Hellingwerf KJ. 2003. Light-induced behavioral responses (‘phototaxis’) in prokaryotes. Photosynth Res 76:145–155. doi: 10.1023/A:1024974111818. [DOI] [PubMed] [Google Scholar]
- 6.Purcell EB, Siegal-Gaskins D, Rawling DC, Fiebig A, Crosson S. 2007. A photosensory two-component system regulates bacterial cell attachment. Proc Natl Acad Sci U S A 104:18241–18246. doi: 10.1073/pnas.0705887104. [DOI] [PMC free article] [PubMed] [Google Scholar]
- 7.van der Horst MA, Stalcup TP, Kaledhonkar S, Kumauchi M, Hara M, Xie A, Hellingwerf KJ, Hoff WD. 2009. Locked chromophore analogs reveal that photoactive yellow protein regulates biofilm formation in the deep sea bacterium Idiomarina loihiensis. J Am Chem Soc 131:17443–17451. doi: 10.1021/ja9057103. [DOI] [PubMed] [Google Scholar]
- 8.Ortiz-Guerrero JM, Polanco MC, Murillo FJ, Padmanabhan S, Elías-Arnanz M. 2011. Light-dependent gene regulation by a coenzyme B12-based photoreceptor. Proc Natl Acad Sci U S A 108:7565–7570. doi: 10.1073/pnas.1018972108. [DOI] [PMC free article] [PubMed] [Google Scholar]
- 9.Fontes M, Galbis-Martínez L, Murillo FJ. 2003. A novel regulatory gene for light-induced carotenoid synthesis in the bacterium Myxococcus xanthus. Mol Microbiol 47:561–571. doi: 10.1046/j.1365-2958.2003.03319.x. [DOI] [PubMed] [Google Scholar]
- 10.Takano H, Obitsu S, Beppu T, Ueda K. 2005. Light-induced carotenogenesis in Streptomyces coelicolor A3(2): identification of an extracytoplasmic function sigma factor that directs photodependent transcription of the carotenoid biosynthesis gene cluster. J Bacteriol 187:1825–1832. doi: 10.1128/JB.187.5.1825-1832.2005. [DOI] [PMC free article] [PubMed] [Google Scholar]
- 11.Bhoo SH, Davis SJ, Walker J, Karniol B, Vierstra RD. 2001. Bacteriophytochromes are photochromic histidine kinases using a biliverdin chromophore. Nature 414:776–779. doi: 10.1038/414776a. [DOI] [PubMed] [Google Scholar]
- 12.Mussi MA, Gaddy JA, Cabruja M, Arivett BA, Viale AM, Rasia R, Actis LA. 2010. The opportunistic human pathogen Acinetobacter baumannii senses and responds to light. J Bacteriol 192:6336–6345. doi: 10.1128/JB.00917-10. [DOI] [PMC free article] [PubMed] [Google Scholar]
- 13.Padmanabhan S, Jost M, Drennan CL, Elías-Arnanz M. 2017. A new facet of vitamin B12: gene regulation by cobalamin-based photoreceptors. Annu Rev Biochem 86:485–514. doi: 10.1146/annurev-biochem-061516-044500. [DOI] [PMC free article] [PubMed] [Google Scholar]
- 14.van der Horst MA, Key J, Hellingwerf KJ. 2007. Photosensing in chemotrophic, non-phototrophic bacteria: let there be light sensing too. Trends Microbiol 15:554–562. doi: 10.1016/j.tim.2007.09.009. [DOI] [PubMed] [Google Scholar]
- 15.Cohen SE, Golden SS. 2015. Circadian rhythms in cyanobacteria. Microbiol Mol Biol Rev 79:373–385. doi: 10.1128/MMBR.00036-15. [DOI] [PMC free article] [PubMed] [Google Scholar]
- 16.Newton RJ, Jones SE, Eiler A, McMahon KD, Bertilsson S. 2011. A guide to the natural history of freshwater lake bacteria. Microbiol Mol Biol Rev 75:14–49. doi: 10.1128/MMBR.00028-10. [DOI] [PMC free article] [PubMed] [Google Scholar]
- 17.Ghai R, Mizuno CM, Picazo A, Camacho A, Rodriguez-Valera F. 2014. Key roles for freshwater Actinobacteria revealed by deep metagenomic sequencing. Mol Ecol 23:6073–6090. doi: 10.1111/mec.12985. [DOI] [PubMed] [Google Scholar]
- 18.Neuenschwander SM, Ghai R, Pernthaler J, Salcher MM. 2017. Microdiversification in genome-streamlined ubiquitous freshwater Actinobacteria. ISME J 12:185–198. [DOI] [PMC free article] [PubMed] [Google Scholar]
- 19.Warnecke F, Amann R, Pernthaler J. 2004. Actinobacterial 16S rRNA genes from freshwater habitats cluster in four distinct lineages. Environ Microbiol 6:242–253. doi: 10.1111/j.1462-2920.2004.00561.x. [DOI] [PubMed] [Google Scholar]
- 20.Hahn MW, Lunsdorf H, Wu Q, Schauer M, Hofle MG, Boenigk J, Stadler P. 2003. Isolation of novel ultramicrobacteria classified as Actinobacteria from five freshwater habitats in Europe and Asia. Appl Environ Microbiol 69:1442–1451. doi: 10.1128/AEM.69.3.1442-1451.2003. [DOI] [PMC free article] [PubMed] [Google Scholar]
- 21.Glöckner FO, Zaichikov E, Belkova N, Denissova L, Pernthaler J, Pernthaler A, Amann R. 2000. Comparative 16S rRNA analysis of lake bacterioplankton reveals globally distributed phylogenetic clusters including an abundant group of actinobacteria. Appl Environ Microbiol 66:5053–5065. doi: 10.1128/AEM.66.11.5053-5065.2000. [DOI] [PMC free article] [PubMed] [Google Scholar]
- 22.Boucher D, Jardillier L, Debroas D. 2006. Succession of bacterial community composition over two consecutive years in two aquatic systems: a natural lake and a lake-reservoir. FEMS Microbiol Ecol 55:79–97. doi: 10.1111/j.1574-6941.2005.00011.x. [DOI] [PubMed] [Google Scholar]
- 23.Wu X, Xi W, Ye W, Yang H. 2007. Bacterial community composition of a shallow hypertrophic freshwater lake in China, revealed by 16S rRNA gene sequences. FEMS Microbiol Ecol 61:85–96. doi: 10.1111/j.1574-6941.2007.00326.x. [DOI] [PubMed] [Google Scholar]
- 24.Kang I, Kim S, Islam MR, Cho J-C. 2017. The first complete genome sequences of the acI lineage, the most abundant freshwater Actinobacteria, obtained by whole-genome-amplification of dilution-to-extinction cultures. Sci Rep 7:42252. doi: 10.1038/srep42252. [DOI] [PMC free article] [PubMed] [Google Scholar]
- 25.Humbert J-F, Dorigo U, Cecchi P, Le Berre B, Debroas D, Bouvy M. 2009. Comparison of the structure and composition of bacterial communities from temperate and tropical freshwater ecosystems. Environ Microbiol 11:2339–2350. doi: 10.1111/j.1462-2920.2009.01960.x. [DOI] [PubMed] [Google Scholar]
- 26.Louati I, Pascault N, Debroas D, Bernard C, Humbert J-F, Leloup J. 2015. Structural diversity of bacterial communities associated with bloom-forming freshwater cyanobacteria differs according to the cyanobacterial genus. PLoS One 10:e0140614. doi: 10.1371/journal.pone.0140614. [DOI] [PMC free article] [PubMed] [Google Scholar]
- 27.Berg KA, Lyra C, Sivonen K, Paulin L, Suomalainen S, Tuomi P, Rapala J. 2009. High diversity of cultivable heterotrophic bacteria in association with cyanobacterial water blooms. ISME J 3:314–325. doi: 10.1038/ismej.2008.110. [DOI] [PubMed] [Google Scholar]
- 28.Kang I, Lee K, Yang S-J, Choi A, Kang D, Lee YK, Cho J-C. 2012. Genome sequence of “Candidatus Aquiluna” sp. strain IMCC13023, a marine member of the Actinobacteria isolated from an Arctic fjord. J Bacteriol 194:3550–3551. doi: 10.1128/JB.00586-12. [DOI] [PMC free article] [PubMed] [Google Scholar]
- 29.Sharma AK, Sommerfeld K, Bullerjahn GS, Matteson AR, Wilhelm SW, Jezbera J, Brandt U, Doolittle WF, Hahn MW. 2009. Actinorhodopsin genes discovered in diverse freshwater habitats and among cultivated freshwater Actinobacteria. ISME J 3:726–737. doi: 10.1038/ismej.2009.13. [DOI] [PubMed] [Google Scholar]
- 30.Nakai R, Fujisawa T, Nakamura Y, Nishide H, Uchiyama I, Baba T, Toyoda A, Fujiyama A, Naganuma T, Niki H. 2016. Complete genome sequence of Aurantimicrobium minutum type strain KNCT, a planktonic ultramicrobacterium isolated from river water. Genome Announc 4:e00616-16. doi: 10.1128/genomeA.00616-16. [DOI] [PMC free article] [PubMed] [Google Scholar]
- 31.Keffer JL, Hahn MW, Maresca JA. 2015. Characterization of an unconventional rhodopsin from the freshwater Actinobacterium Rhodoluna lacicola. J Bacteriol 197:2704–2712. doi: 10.1128/JB.00386-15. [DOI] [PMC free article] [PubMed] [Google Scholar]
- 32.Nakamura S, Kikukawa T, Tamogami J, Kamiya M, Aizawa T, Hahn MW, Ihara K, Kamo N, Demura M. 2016. Photochemical characterization of actinorhodopsin and its functional existence in the natural host. Biochim Biophys Acta 1857:1900–1908. doi: 10.1016/j.bbabio.2016.09.006. [DOI] [PubMed] [Google Scholar]
- 33.Richter M, Rosselló-Móra R, Oliver Glöckner F, Peplies J. 2016. JSpeciesWS: a web server for prokaryotic species circumscription based on pairwise genome comparison. Bioinformatics 32:929–931. doi: 10.1093/bioinformatics/btv681. [DOI] [PMC free article] [PubMed] [Google Scholar]
- 34.Kim M, Oh H-S, Park S-C, Chun J. 2014. Towards a taxonomic coherence between average nucleotide identity and 16S rRNA gene sequence similarity for species demarcation of prokaryotes. Int J Syst Evol Microbiol 64:346–351. doi: 10.1099/ijs.0.059774-0. [DOI] [PubMed] [Google Scholar]
- 35.Hahn M, Schmidt J, Taipale SJ, Doolittle WF, Koll U. 2014. Rhodoluna lacicola gen. nov., sp. nov., a planktonic freshwater bacterium with stream-lined genome. Int J Syst Evol Microbiol 64:3254–3263. doi: 10.1099/ijs.0.065292-0. [DOI] [PMC free article] [PubMed] [Google Scholar]
- 36.Garcia SL, Buck M, McMahon KD, Grossart H-P, Eiler A, Warnecke F. 2015. Auxotrophy and intrapopulation complementary in the “interactome” of a cultivated freshwater model community. Mol Ecol 24:4449–4459. doi: 10.1111/mec.13319. [DOI] [PubMed] [Google Scholar]
- 37.Ghylin TW, Garcia SL, Moya F, Oyserman BO, Schwientek P, Forest KT, Mutschler J, Dwulit-Smith J, Chan L-K, Martinez-Garcia M, Sczyrba A, Stepanauskas R, Grossart H-P, Woyke T, Warnecke F, Malmstrom R, Bertilsson S, McMahon KD. 2014. Comparative single-cell genomics reveals potential ecological niches for the freshwater acI Actinobacteria lineage. ISME J 8:2503–2516. doi: 10.1038/ismej.2014.135. [DOI] [PMC free article] [PubMed] [Google Scholar]
- 38.Gerlt JA, Bouvier JT, Davidson DB, Imker HJ, Sadkhin B, Slater DR, Whalen KL. 2015. Enzyme Function Initiative-Enzyme Similarity Tool (EFI-EST): a web tool for generating protein sequence similarity networks. Biochim Biophys Acta 1854:1019–1037. doi: 10.1016/j.bbapap.2015.04.015. [DOI] [PMC free article] [PubMed] [Google Scholar]
- 39.Pushkarev A, Inoue K, Larom S, Flores-Uribe J, Singh M, Konno M, Tomida S, Ito S, Nakamura R, Tsunoda SP, Philosof A, Sharon I, Yutin N, Koonin EV, Kandori H, Béjà O. 2018. A distinct abundant group of microbial rhodopsins discovered using functional metagenomics. Nature 558:595–599. doi: 10.1038/s41586-018-0225-9. [DOI] [PMC free article] [PubMed] [Google Scholar]
- 40.Yang Y, Yatsunami R, Ando A, Miyoko N, Fukui T, Takaichi S, Nakamura S. 2015. Complete biosynthetic pathway of the C50 carotenoid bacterioruberin from lycopene in the extremely halophilic archaeon Haloarcula japonica. J Bacteriol 197:02523-14. doi: 10.1128/JB.02523-14. [DOI] [PMC free article] [PubMed] [Google Scholar]
- 41.Heider SAE, Peters-Wendisch P, Netzer R, Stafnes M, Brautaset T, Wendisch VF. 2014. Production and glucosylation of C50 and C40 carotenoids by metabolically engineered Corynebacterium glutamicum. Appl Microbiol Biotechnol 98:1223–1235. doi: 10.1007/s00253-013-5359-y. [DOI] [PubMed] [Google Scholar]
- 42.Maresca JA, Graham JE, Bryant DA. 2008. The biochemical basis for structural diversity in the carotenoids of chlorophototrophic bacteria. Photosynth Res 97:121–140. doi: 10.1007/s11120-008-9312-3. [DOI] [PubMed] [Google Scholar]
- 43.Chamovitz D, Misawa N, Sandmann G, Hirschberg J. 1992. Molecular cloning and expression in Escherichia coli of a cyanobacterial gene coding for phytoene synthase, a carotenoid biosynthesis enzyme. FEBS Lett 296:305–310. doi: 10.1016/0014-5793(92)80310-D. [DOI] [PubMed] [Google Scholar]
- 44.Braatsch S, Klug G. 2004. Blue light perception in bacteria. Photosynth Res 79:45–57. doi: 10.1023/B:PRES.0000011924.89742.f9. [DOI] [PubMed] [Google Scholar]
- 45.Müller M, Carell T. 2009. Structural biology of DNA photolyases and cryptochromes. Curr Opin Struct Biol 19:277–285. doi: 10.1016/j.sbi.2009.05.003. [DOI] [PubMed] [Google Scholar]
- 46.Fortunato AEE, Annunziata R, Jaubert M, Bouly J-P, Falciatore A. 2015. Dealing with light: the widespread and multitasking cryptochrome/photolyase family in photosynthetic organisms. J Plant Physiol 172:42–54. doi: 10.1016/j.jplph.2014.06.011. [DOI] [PubMed] [Google Scholar]
- 47.Kobayashi T, Takao M, Oikawa A, Yasui A. 1989. Molecular characterization of a gene encoding a photolyase from Streptomyces griseus. Nucleic Acids Res 17:4731–4744. doi: 10.1093/nar/17.12.4731. [DOI] [PMC free article] [PubMed] [Google Scholar]
- 48.Geisselbrecht Y, Frühwirth S, Schroeder C, Pierik AJ, Klug G, Essen L-O. 2012. CryB from Rhodobacter sphaeroides: a unique class of cryptochromes with new cofactors. EMBO Rep 13:223–229. doi: 10.1038/embor.2012.2. [DOI] [PMC free article] [PubMed] [Google Scholar]
- 49.Hendrischk A-K, Frühwirth SW, Moldt J, Pokorny R, Metz S, Kaiser G, Jäger A, Batschauer A, Klug G. 2009. A cryptochrome-like protein is involved in the regulation of photosynthesis genes in Rhodobacter sphaeroides. Mol Microbiol 74:990–1003. doi: 10.1111/j.1365-2958.2009.06912.x. [DOI] [PubMed] [Google Scholar]
- 50.Frühwirth S, Teich K, Klug G. 2012. Effects of the cryptochrome CryB from Rhodobacter sphaeroides on global gene expression in the dark or blue light or in the presence of singlet oxygen. PLoS One 7:e33791. doi: 10.1371/journal.pone.0033791. [DOI] [PMC free article] [PubMed] [Google Scholar]
- 51.Metz S, Haberzettl K, Frühwirth S, Teich K, Hasewinkel C, Klug G. 2012. Interaction of two photoreceptors in the regulation of bacterial photosynthesis genes. Nucleic Acids Res 40:5901–5909. doi: 10.1093/nar/gks243. [DOI] [PMC free article] [PubMed] [Google Scholar]
- 52.Oberpichler I, Pierik AJ, Wesslowski J, Pokorny R, Rosen R, Vugman M, Zhang F, Neubauer O, Ron EZ, Batschauer A, Lamparter T. 2011. A photolyase-like protein from Agrobacterium tumefaciens with an iron-sulfur cluster. PLoS One 6:e26775. doi: 10.1371/journal.pone.0026775. [DOI] [PMC free article] [PubMed] [Google Scholar]
- 53.Anton BP, Fomenkov A, Raleigh EA, Berkmen M. 2016. Complete genome sequence of the engineered Escherichia coli shuffle strains and their wild-type parents. Genome Announc 4:e00230-16. doi: 10.1128/genomeA.00230-16. [DOI] [PMC free article] [PubMed] [Google Scholar]
- 54.Preu J, Panjikar S, Morth P, Jaiswal R, Karunakar P, Tucker PA. 2012. The sensor region of the ubiquitous cytosolic sensor kinase, PdtaS, contains PAS and GAF domain sensing modules. J Struct Biol 177:498–505. doi: 10.1016/j.jsb.2011.11.012. [DOI] [PubMed] [Google Scholar]
- 55.Dadura K, Płocińska R, Rumijowska-Galewicz A, Płociński P, Żaczek A, Dziadek B, Zaborowski A, Dziadek J. 2017. PdtaS deficiency affects resistance of mycobacteria to ribosome targeting antibiotics. Front Microbiol 8:2145. doi: 10.3389/fmicb.2017.02145. [DOI] [PMC free article] [PubMed] [Google Scholar]
- 56.Bush MJ, Bibb MJ, Chandra G, Findlay KC, Buttner MJ. 2013. Genes required for aerial growth, cell division, and chromosome segregation are targets of WhiA before sporulation in Streptomyces venezuelae. mBio 4:e00684-13. doi: 10.1128/mBio.00684-13. [DOI] [PMC free article] [PubMed] [Google Scholar]
- 57.den Hengst CD, Buttner MJ. 2008. Redox control in actinobacteria. Biochim Biophys Acta 1780:1201–1216. doi: 10.1016/j.bbagen.2008.01.008. [DOI] [PubMed] [Google Scholar]
- 58.Beel B, Prager K, Spexard M, Sasso S, Weiss D, Müller N, Heinnickel M, Dewez D, Ikoma D, Grossman AR, Kottke T, Mittag M. 2012. A flavin binding cryptochrome photoreceptor responds to both blue and red light in Chlamydomonas reinhardtii. Plant Cell 24:2992–3008. doi: 10.1105/tpc.112.098947. [DOI] [PMC free article] [PubMed] [Google Scholar]
- 59.Ghai R, Mizuno CM, Picazo A, Camacho A, Rodriguez-Valera F. 2013. Metagenomics uncovers a new group of low GC and ultra-small marine Actinobacteria. Sci Rep 3:1294–1302. [DOI] [PMC free article] [PubMed] [Google Scholar]
- 60.Allgaier M, Grossart H-P. 2006. Diversity and seasonal dynamics of actinobacteria populations in four lakes in northeastern Germany. Appl Environ Microbiol 72:3489–3497. doi: 10.1128/AEM.72.5.3489-3497.2006. [DOI] [PMC free article] [PubMed] [Google Scholar]
- 61.Salcher MM. 2013. Same same but different: ecological niche partitioning of planktonic freshwater prokaryotes. J Limnol 73:74–87. [Google Scholar]
- 62.Salcher MM, Posch T, Pernthaler J. 2013. In situ substrate preferences of abundant bacterioplankton populations in a prealpine freshwater lake. ISME J 7:896–907. doi: 10.1038/ismej.2012.162. [DOI] [PMC free article] [PubMed] [Google Scholar]
- 63.Pérez MT, Rofner C, Sommaruga R. 2015. Dissolved organic monomer partitioning among bacterial groups in two oligotrophic lakes. Environ Microbiol Rep 7:265–272. doi: 10.1111/1758-2229.12240. [DOI] [PMC free article] [PubMed] [Google Scholar]
- 64.Buck U, Grossart H-P, Amann R, Pernthaler J. 2009. Substrate incorporation patterns of bacterioplankton populations in stratified and mixed waters of a humic lake. Environ Microbiol 11:1854–1865. doi: 10.1111/j.1462-2920.2009.01910.x. [DOI] [PubMed] [Google Scholar]
- 65.Garcia SL, Buck M, Hamilton JJ, Wurzbacher C, Grossart H-P, McMahon KD, Eiler A. 2018. Model communities hint at promiscuous metabolic linkages between ubiquitous free-living freshwater bacteria. mSphere 3:e00202-18. doi: 10.1128/mSphere.00202-18. [DOI] [PMC free article] [PubMed] [Google Scholar]
- 66.Brocker M, Mack C, Bott M. 2011. Target genes, consensus binding site, and role of phosphorylation for the response regulator MtrA of Corynebacterium glutamicum. J Bacteriol 193:1237–1249. doi: 10.1128/JB.01032-10. [DOI] [PMC free article] [PubMed] [Google Scholar]
- 67.Möker N, Krämer J, Unden G, Krämer R, Morbach S. 2007. In vitro analysis of the two-component system MtrB-MtrA from Corynebacterium glutamicum. J Bacteriol 189:3645–3649. doi: 10.1128/JB.01920-06. [DOI] [PMC free article] [PubMed] [Google Scholar]
- 68.Möker N, Reihlen P, Krämer R, Morbach S. 2007. Osmosensing properties of the histidine protein kinase MtrB from Corynebacterium glutamicum. J Biol Chem 282:27666–27677. doi: 10.1074/jbc.M701749200. [DOI] [PubMed] [Google Scholar]
- 69.Kang C-M, Abbott DW, Park ST, Dascher CC, Cantley LC, Husson RN. 2005. The Mycobacterium tuberculosis serine/threonine kinases PknA and PknB: substrate identification and regulation of cell shape. Genes Dev 19:1692–1704. doi: 10.1101/gad.1311105. [DOI] [PMC free article] [PubMed] [Google Scholar]
- 70.Bhattacharya M, Biswas A, Das AK. 2010. Interaction analysis of TcrX/Y two component system from Mycobacterium tuberculosis. Biochimie 92:263–272. doi: 10.1016/j.biochi.2009.11.009. [DOI] [PubMed] [Google Scholar]
- 71.Parish T, Smith DA, Roberts G, Betts J, Stoker NG. 2003. The senX3-regX3 two-component regulatory system of Mycobacterium tuberculosis is required for virulence. Microbiology 149:1423–1435. doi: 10.1099/mic.0.26245-0. [DOI] [PubMed] [Google Scholar]
- 72.Hahn MW, Stadler P, Wu QL, Pöckl M. 2004. The filtration-acclimatization method for isolation of an important fraction of the not readily cultivable bacteria. J Microbiol Methods 57:379–390. doi: 10.1016/j.mimet.2004.02.004. [DOI] [PubMed] [Google Scholar]
- 73.Reysenbach AL, Wickham GS, Pace NR. 1994. Phylogenetic analysis of the hyperthermophilic pink filament community in Octopus Spring, Yellowstone National Park. Appl Environ Microbiol 60:2113–2119. [DOI] [PMC free article] [PubMed] [Google Scholar]
- 74.Pacific Biosciences. 2016. Procedure and checklist–20 kb template preparation using BluePippin size-selection system. Pacific Biosciences, Menlo Park, CA. [Google Scholar]
- 75.Eddy SR. 2011. Accelerated Profile HMM searches. PLoS Comput Biol 7:e1002195. doi: 10.1371/journal.pcbi.1002195. [DOI] [PMC free article] [PubMed] [Google Scholar]
- 76.Frigaard N-U, Takaichi S, Hirota M, Shimada K, Matsuura K. 1997. Quinones in chlorosomes of green sulfur bacteria and their role in the redox-dependent fluorescence studied in chlorosome-like bacteriochlorophyll c aggregates. Arch Microbiol 167:343–349. doi: 10.1007/s002030050453. [DOI] [Google Scholar]
- 77.Pruesse E, Peplies J, Glöckner FO. 2012. SINA: Accurate high-throughput multiple sequence alignment of ribosomal RNA genes. Bioinformatics 28:1823–1829. doi: 10.1093/bioinformatics/bts252. [DOI] [PMC free article] [PubMed] [Google Scholar]
- 78.Moore RM, Harrison AO, McAllister SM, Marine RL, Chan CS, Wommack KE. 2017. Iroki: automatic customization for phylogenetic trees. bioRxiv 106138. [DOI] [PMC free article] [PubMed] [Google Scholar]
- 79.Sambrook JF, Russell DW (ed). 2001. Molecular cloning: a laboratory manual, 3rd ed Cold Spring Harbor Laboratory Press, Cold Spring Harbor, NY. [Google Scholar]
- 80.Laemmli UK. 1970. Cleavage of structural proteins during the assembly of the head of bacteriophage T4. Nature 227:680–685. doi: 10.1038/227680a0. [DOI] [PubMed] [Google Scholar]
- 81.Bateman A, Martin MJ, O’Donovan C, Magrane M, Alpi E, Antunes R, Bely B, Bingley M, Bonilla C, Britto R, Bursteinas B, Bye-A-Jee H, Cowley A, Silva AD, Giorgi MD, Dogan T, Fazzini F, Castro LG, Figueira L, Garmiri P, Georghiou G, Gonzalez D, Hatton-Ellis E, Li W, Liu W, Lopez R, Luo J, Lussi Y, MacDougall A, Nightingale A, Palka B, Pichler K, Poggioli D, Pundir S, Pureza L, Qi G, Renaux A, Rosanoff S, Saidi R, Sawford T, Shypitsyna A, Speretta E, Turner E, Tyagi N, Volynkin V, Wardell T, Warner K, Watkins X, Zaru R, Zellner H, et al. 2017. UniProt: the universal protein knowledgebase. Nucleic Acids Res 45:D158–D169. [DOI] [PMC free article] [PubMed] [Google Scholar]
- 82.Wommack KE, Bhavsar J, Polson SW, Chen J, Dumas M, Srinivasiah S, Furman M, Jamindar S, Nasko DJ. 2012. VIROME: a standard operating procedure for analysis of viral metagenome sequences. Stand Genomic Sci 6:427–439. doi: 10.4056/sigs.2945050. [DOI] [PMC free article] [PubMed] [Google Scholar]
- 83.Benjamini Y, Hochberg Y. 1995. Controlling the false discovery rate: a practical and powerful approach to multiple testing. J R Stat Soc Series B Stat Methodol 57:289–300. [Google Scholar]
- 84.Hempel P, Keffer JL, Shevchenko O, Henny C, Polson SW, Maresca JA. 2019. Complete genome sequence of Microbacterium sp. strain 10M-3C3, isolated from an extremely phosphorus-poor lake. Microbiol Resour Announc 8(4):e01649-18. doi: 10.1128/MRA.01649-18. [DOI] [PMC free article] [PubMed] [Google Scholar]
Associated Data
This section collects any data citations, data availability statements, or supplementary materials included in this article.
Supplementary Materials
Data Availability Statement
The Aurantimicrobium sp. strain MWH-Mo1 and MWH-Uga1 genomes have been deposited at NCBI with BioProject numbers PRJNA386293 and PRJNA431805, respectively. The raw and processed RNA-seq data have been submitted to the NCBI-GEO database with project accession numbers GSE116706 and GSE116705 for R. lacicola strain MWH-Ta8 and Aurantimicrobium sp. strain MWH-Mo1, respectively.