

Abstract
Several studies have investigated how lifetime cognitive engagement affects levels of amyloid-beta (Aβ) deposition in the brain. However, there has been some disagreement, leaving the relationship of cognitive activity (CA) to Aβ a largely open question. The present study investigated the relationship between CA,Aβ deposition, and glucose metabolism. One hundred nine cognitively normal participants underwent Pittsburgh Compound-B (PiB) and [18F]fluorodeoxyglucose-positron emission tomography and completed a questionnaire designed to measure current CA. Statistical analyses revealed significant differences in PiB retention between those in the high and low CA groups. Linear regression models revealed a significant negative relationship between PiB retention and CA and a significant positive relationship between glucose metabolism and CA. These data suggest that CA may have a direct beneficial effect on the pathophysiology of AD or reflect another underlying process that results in both higher CA and lower AD pathophysiology.
Keywords: FDG-PET, Pittsburgh compound-B, lifestyle activities, aging
INTRODUCTION
The development of the positron emission tomography (PET) tracer, Pittsburgh Compound-B (PiB), has made it possible to image amyloid in vivo,1 and many studies have demonstrated increased PiB retention as a surrogate for amyloid-beta (Aβ) deposition in 10%– 50% of cognitively normal controls, depending on age and APOE.1–11 Furthermore, it appears that the location and amount of Aβ does not explain the presence of clinical Alzheimer disease (AD), and it remains unclear as to why some individuals remain asymptomatic with a significant brain Aβ load while others do not. Reductions of cerebral metabolism using [18F]fluorodeoxyglucose-positron emission tomography (FDG-PET) are well established in AD.12–15 Similar changes have been reported in cognitively normal individuals at high risk for AD due to expression of the APOE*4 allele.16,17 However, cortical hypermetabolism measured by FDG has been observed in cognitively normal controls with significant Aβ deposition.18,19 The phenomenon of hypermetabolism early in the course of Aβ deposition may prove to be of great interest when considering why some with significant brain Aβ load remain asymptomatic. Studies have investigated how lifetime engagement in cognitive activity (CA) affects levels of Aβ in the brain. Participation in cognitively and physically stimulating activities throughout life is associated with a decreased risk for dementia and is positively correlated with cognitive status in old age.20–24 Higher educational attainment has also been associated with better cognitive function in the presence of Aβ deposits in the brain.25–27 Further, higher educational attainment has been associated with decreased risk of developing AD.28 It has also been suggested that higher lifetime engagement in CA is associated with lower Aβ deposition.29,30 The associations suggest that participation in stimulating activities and high educational attainment confer a resistance to the development of dementia. However, another set of studies has suggested that CA and education, factors that are commonly believed to decrease the risk of cognitive decline, had no effect on amyloid levels in the brain,31,32 leaving the relationship of CA to Aβ a largely open question.
The present study explored the relationship between CA, Aβ, and glucose metabolism. This study examined the relationship of both amyloid and glucose metabolism in participants with a quantitative measure of current CA level.
METHODS
One hundred nine participants were recruited for the present study from two ongoing PiB-PET imaging studies at the University of Pittsburgh. Inclusion criteria were normal cognition and age 65 years or older. Normal cognition was classified according to consensus cognitive diagnosis, which closely followed the approach and structure of the Alzheimer Disease Research Center (ADRC) consensus conference.33 Exclusion criteria for both parent studies included contraindications for neuroimaging and history of neurologic, psychiatric, or other medical conditions or treatment associated with potentially significant cognitive symptoms. All participants provided written informed consent and all study procedures were approved by the institutional review board of the University of Pittsburgh. Demographics for these participants are presented in Table 1. The participants completed the Florida Cognitive Activities Scale (FCAS) questionnaire, investigating CA level, and then received a CA score according to the responses they provided. The FCAS is a 25-item scale across a spectrum of activities varying in cognitive demand. Participants report the frequency of engagement in each activity during the past year, with response choices being: 1) “never or used to do, but not in the past year”; 2) “ < 1 time per month”; 3) “1 to 4 times per month”; 4) “ ≥ 5 times per month, but not every day”; and 5) “every day.” Additionally, the FCAS contains a subscale identified to specifically explore high demand CA. The items assessed include doing crossword puzzles; playing chess, bridge, or knowledge games; attending lectures; reading books; doing arts and crafts; walking in unfamiliar places; cooking; and attending lectures. This cognitive function score was then used to partition the participants into three distinct groups by tertile of cognitive function: high, middle, and low CA. The FCAS has been demonstrated to have a high level of reliability in elderly individuals and has been well correlated with education and other measures of the variety of activities assessed.34,35 Further, the FCAS has been cross-validated in an AD research center sample, where FCAS was shown to be significantly correlated with neuropsychological measures and shown to be a sensitive measure of individual differences in CA in an AD-related research population.34
TABLE 1.
Participant Demographics by Cognitive Activity Tertile Group
| High CA (n = 30) |
Middle CA (n = 34) |
Low CA (n = 45) |
|
|---|---|---|---|
| Age | 81.3 ± 8.0 years | 80.9 ± 8.0 years | 85 3 ± 6.5 years F*(2,108) = 5.453,p = 0.006 |
| Education | 15.1 ± 2.7 years | 15.3 ± 3.0 years | 15.2 ± 2.4 years F*(2,108) = 0.023, p = 0.977 |
| Sex | 53% male | 59% male | 69% male (X = 12.82[2],p = 0.001) |
| APOEe4 status | 17% e4 positive | 24% e4 positive | 18% e4 positive (X = 1.876[2],p = 0.391) |
Notes: Age and Education are presented as means and SD and Sex and APOEe4 status are presented as % M and % e4 positives
F statistic from the ANOVA; X, Pearson χ2.
Brain Aβ and brain glucose metabolism were measured using PET and the radioactive tracers [C-11]PiB and FDG. It should be noted that all participants underwent a PiB PET scan (n = 109), although14 did not undergo FDG-PET scan (n = 95).
High specific activity [C-11]PiB was produced as previously described36 and [18F]FDG was synthesized by a standard method.37 The PiB-PET data were acquired as described by Lopresti et al.13 Briefly, before the PET imaging sessions, a spoiled gradient recalled magnetic resonance (MR) scan was obtained for each subject for MR-PET image coregistration and anatomical region of interest (ROI) definition as previously described.13,38 ROIs were separately hand drawn on the coregistered MR image and included the following: global 6 (GBL6, weighted average of the regions listed below, excluding cerebellum), frontal cortex (FRC), anterior cingulate cortex (ACG), striatum (AVS), precuneus/posterior cingulate cortex (PRC), parietal cortex (PAR), lateral temporal cortex (LTC), and cerebellum (CER).39 PET imaging was conducted using a Siemens/CTI ECAT HR+ (three-dimensional mode, 15.2 cm field of view, 63 planes, reconstructed image resolution ~6 mm).
Analysis of the PiB-PET and FDG-PET data was performed via summed images in a manner consistent with established methods.40–42 The PiB data were summed over 50–70 minutes, FDG data were summed over 40–60 minutes postinjection, and a standardized uptake value was obtained. Standardized uptake value ratio (SUVR) was generated for each ROI by normalization to the CER. ROIs were chosen a priori based on our previous work.43
Statistical analyses were performed with the Statistical Package for the Social Sciences (SPSS, SPSS Statistics for Macintosh, Version 22.0, Armonk, NY: IBM Corp). For each ROI, a one-way analysis of variance (ANOVA) was performed to test the hypothesis of no difference in average PiB retention (SUVR) among the cognitive groups. Post-hoc analyses were performed for each ROI that revealed a significant relationship with PIB retention, and a Bonferroni correction for group44 was applied for multiple comparisons. Multiple linear regression analyses for investigating the relationship between either PiB or FDG SUVR (in specific ROIs) and CA score were also performed and were adjusted for age, APOE allele status (which was missing for 8 participants), and education for each model.
RESULTS
Demographics by CA Group
Table 1 shows demographics of the participants included in the analysis by CA tertile. A group-wise ANOVA revealed that participants did not differ by APOE*4 status or education, but ANOVA demonstrated that the lowest CA tertile was significantly older and had significantly more males than the high or middle tertiles.
Relationship between Aβ and CA
Group-wise ANOVA analyses revealed significant differences in PiB retention across low, middle, and high CA groups in several brain regions, including AVS (p = 0.006, F[2,108] = 5.298), FRC (p = 0.018, F[2,108] = 4.166), LTC (p = 0.042, F[2,108] = 3.258), PRC (p = 0.014, F[2,108] = 4.414), and GBL6 (a measure of global PiB retention) (p = 0.020, F[2,108] = 4.079) (Figure 1).
FIGURE 1.
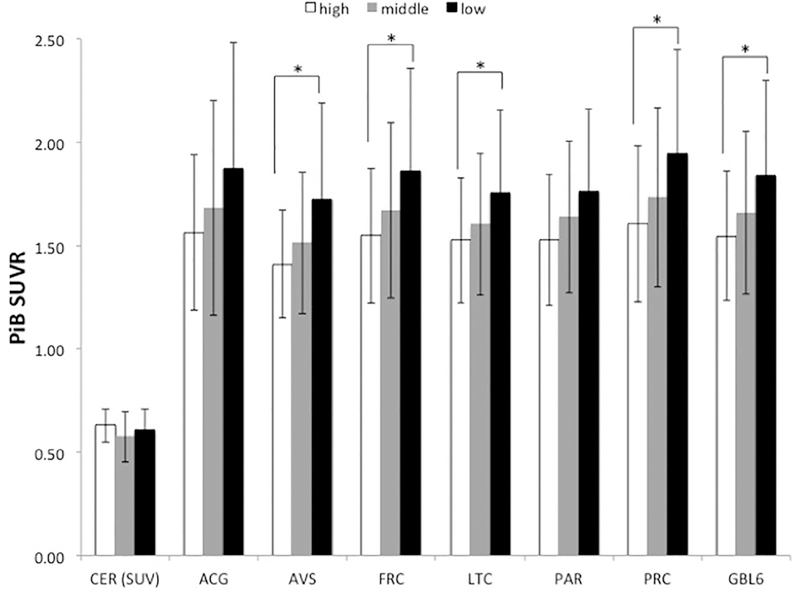
Group means of PiB SUVR by CA group. *Denotes group-wise differences, p < 0.05 after Bonferroni correction for multiple comparisons.
A linear regression model to examine the relationship between CA level and PiB retention, including age, APOE*4 status, and education as covariates, demonstrated significant inverse relationships between PiB retention and continuous CA level in several brain regions related to AD pathophysiology (Table 2). This analysis revealed statistically significant relationships in FRC, PRC, and GBL6 but not in ACG, LTC, or PAR.
TABLE 2.
Results of Linear Regression, Investigating the Relationship Between PiB SUVR and CA Score, Adjusted for e4 Status, Age, and Education Level
| ROI | Overall R2 | Partial Correlation Coefficient |
p Value | T Value | df | Standardized β | 95% CI |
|---|---|---|---|---|---|---|---|
| ACG | 0.197 | −0.197 | 0.051 | −1.972 | 100 | −0.186 | (−0.042, 0.000) |
| FRC | 0.207 | −0.226 | 0.025 | −2.273 | 100 | −0.213 | (−0.037, −0.003) |
| LTC | 0.217 | −0.174 | 0.086 | −1.735 | 100 | −0.162 | (−0.026, 0.002) |
| PAR | 0.214 | −0.161 | 0.112 | −1.602 | 100 | −0.150 | (−0.026, 0.003) |
| PRC | 0.244 | −0.204 | 0.044 | −2.042 | 100 | −0.187 | (−0.036, −0.001) |
| GBL 6 | 0.230 | −0.215 | 0.033 | −2.160 | 100 | −0.194 | (−0.033, −0.001) |
Relationship between Aβ and Age, Aβ and APOE*4 and Aβ and Education
PiB retention in all brain regions examined was significantly related to age after adjusting for APOE*4 carrier status, education, and CA level in the linear regression models explored, including ACG, FRC, LTC, PAR. PRC, and GBL6 (Supplemental Table S1). Further, linear regressions demonstrated no significant relationships between PiB retention and education after adjusting for APOE*4 status, age, and CA level in any of the brain regions explored (Supplemental Table S2).
Relationship between Glucose Metabolism and CA
After correction for multiple comparisons, group-wise ANOVA analyses revealed no significant differences in glucose metabolism across low, middle, and high CA groups in any brain region (data not shown).
Linear regression models, including age, education, and APOE*4 status as covariates, revealed significant relationships between glucose metabolism and continuous CA in several brain regions (Table 3). This analysis revealed significant relationships in ACG, FRC, and a composite region, the posterior cortical index (a weighted average of PRC, LTC, and PAR), but not in the PRC, LTC, or PAR individually.
TABLE 3.
Results of Linear Regression, Investigating the Relationship Between FDG SUVR and CA Score, Corrected for e4 Status, Age, and Education Level
| ROI | Overall R2 | Partial Correlation Coefficient |
p Value | T Value | df | Standardized β | 95% CI |
|---|---|---|---|---|---|---|---|
| ACG | 0.065 | 0.215 | 0.042 | 2.060 | 92 | 0.225 | (0.000, 0.008) |
| FRC | 0.064 | 0.230 | 0.029 | 2.218 | 92 | 0.242 | (0.000, 0.008) |
| LTC | 0.046 | 0.201 | 0.058 | 1.922 | 92 | 0.212 | (0.000, 0.007) |
| PAR | 0.044 | 0.194 | 0.067 | 1.852 | 92 | 0.204 | (0.000, 0.008) |
| PRC | 0.059 | 0.203 | 0.055 | 1.946 | 92 | 0.213 | (0.000, 0.009) |
| PCI | 0.050 | 0.210 | 0.047 | 2.012 | 92 | 0.221 | (0.000, 0.008) |
DISCUSSION
Our study explored the relationships between CA, Aβ deposition, and glucose metabolism. We identified two major findings. First, there is a significant inverse relationship between CA and Aβ deposition, such that higher cognitive activity is associated with lower Aβ deposition, particularly in FRC and PRC—two areas that show especially early and extensive Aβ deposition. Second, glucose metabolism in the brain is associated with CA, with higher CA associated with higher metabolism in ACG and FRC. These findings suggest that those who are more cognitively active may have a lower risk of developing AD later in life, as they have lower levels of Aβ and better preservation of cerebral glucose metabolism. It should be noted that there was no significant difference in PiB retention in the cerebellum between the 3 groups (Figure 1). This indicates that the relationships are driven by cortical Aβ deposition and not Aβ deposition in the reference region.
Our findings are consistent with another report from Landau et al. that also examined the relationship between CA and brain Aβ levels.29 However, in contrast to our findings, Vemuri et al.31,32 observed no relationship between Aβ and CA. A possible explanation for this difference involves the methodical approaches of the present study, the Landau study, and the Vemuri studies. The Vemuri studies utilized the American National Adult Reading Test, which focuses heavily on both educational and occupational attainment. American National Adult Reading Test scores have been known to correlate well with IQ.31,32 The present study and the Landau et al.29 study both utilized scales specific to CA. Interestingly, all of the linear regression models explored in the present study agreed with the Vemuri31,32 finding that there was no effect of education on PiB retention in the brain, with p values between 0.7 and 0.8 in all of the models explored (Supplemental Table S2). Because FCAS is correlated with years of education and measures of overall cognitive function,45 it was important to examine the relative contribution of education to PiB retention separately. As education level alone was shown to have no effect on PiB retention, an argument can be made that measures specific to CA are more directly associated with Aβ deposition than proxy measures such as education, occupational attainment, or IQ. These data are also in line with previous findings, with the FCAS showing that after controlling for the effects of age, education, and gender, the FCAS score contributed significantly to the prediction of global cognitive functioning.45
A second possible explanation of the current findings is that Aβ deposition in the brain, years before it is detectable with PiB-PET, leads to changes in CA. That is, decreased CA is a result of Aβ deposition and an early symptom of AD, as opposed to the possibility that sustained high CA level can prevent deposition of Aβ, thus providing a level of protection against AD. An analysis of longitudinal change in both CA and PiB-PET will be required to assess the temporal relationship of CA and Aβ deposition. A limitation of the present analysis was that we did not explore subtle cognitive changes as they relate to CA and Aβ, making it possible that decreased CA might also be associated with subtle cognitive change. However, we believe this is unlikely. Based on previous studies of our cognitively normal population and Aβ deposition, we have found little to no difference in these groups related to cognition.4,46,47
A third possibility is that brain processes other than CA or Aβ deposition simultaneously result in a propensity for both higher engagement in CA and lower Aβ deposition. Such processes could be either genetically determined or environmentally induced.
The age differences between groups in this study serve as the major limitation, as those with the lowest CA level in our study were also significantly older than those with the highest CA (85.3 ± 6.5 years versus 81.8 ± 7.9 years), as age is significantly correlated with both Aβ deposition and glucose metabolism. However, this was a major reason for including results from both the group-wise comparisons (Figure 1 and Table 1) and continuous comparisons (Tables 2 and 3). In the linear regression models, age was significantly correlated with PiB-PET (Supplemental Table S1). CA, when included in this model, still had a significant relationship with both Aβ and glucose metabolism (Tables 2 and 3). While the effects of CA are not as strong as those of age in the statistical models explored, these effects remained significant after accounting for age within the models, suggesting that CA is an important contributor to the differences in both Aβ and glucose metabolism observed among cognitively normal elderly.
It is important to note that the effects of CA are quite modest, particularly when considered in comparison to major risk factors for AD pathology, such as age. However, these findings are largely relevant given the fact that AD is a complex disorder with multiple risk factors. An important area of study concerns why some with significant AD pathology develop symptoms while others do not. As it has been shown that CA is associated with lower dementia risk,48 understanding the underlying biological process of this phenomenon is critical. These data provide critical information, along with other groups,29 that associations of CA with dementia risk may be, at least in part, associated with the Aβ pathway.
CONCLUSION
These data contribute to several recent studies that suggest that cognitive engagement may have a beneficial effect on the pathophysiology of AD. These data suggest that CA could be related to the process of Aβ deposition and, further, that manipulating lifestyle factors, like CA, could modify the risk for developing AD pathology and ultimately the development of AD. However, additional longitudinal investigations of the relationships of CA to AD pathology will be critical to understanding this relationship.
Supplementary Material
Highlights.
There are significant differences in PiB retention between those in the high and low cognitive activity groups.
There is a significant negative relationship between PiB retention and cognitive activity.
There is a significant positive relationship between glucose metabolism and cognitive activity.
The relationship of current cognitive activity to brain amyloid-beta burden and glucose metabolism.
Footnotes
APPENDIX: SUPPLEMENTARY MATERIAL
Supplementary data to this article can be found online at doi:10.1016/j.jagp.2018.03.018.
The authors report no conflicts of interest relevant to this study.
References
- 1.Klunk WE, Engler H, Nordberg A, et al. : Imaging brain amyloid in Alzheimer’s disease with Pittsburgh Compound-B.Ann Neurol 2004; 55:306–319 [DOI] [PubMed] [Google Scholar]
- 2.Mintun MA,Larossa GN,Sheline YI,et al. : 11C]PIB in a nondemented population: potential antecedent marker of Alzheimer disease.Neurology 2006; 67:446–452 [DOI] [PubMed] [Google Scholar]
- 3.Pike KE, Savage G, Villemagne VL, et al. : β-Amyloid imaging and memory in non-demented individuals: evidence for preclinical Alzheimer’s disease.Brain 2007; 130(Pt 11):2837–2844 [DOI] [PubMed] [Google Scholar]
- 4.Aizenstein HJ, Nebes RD, Saxton JA, et al. : Amyloid deposition is frequent and often is not associated with significant cognitive impairment in the elderly.Arch Neurol 2008; 65:1509–1517 [DOI] [PMC free article] [PubMed] [Google Scholar]
- 5.Jack CR, Bernstein MA, Fox NC, et al. : The alzheimer’s disease neuroimaging initiative (ADNI):MRI methods.J Magn Reson Imaging 2008; 27:685–691 [DOI] [PMC free article] [PubMed] [Google Scholar]
- 6.Villemagne VL, Pike KE, Darby D, et al. : Abeta deposits in older non-demented individuals with cognitive decline are indicative of preclinical Alzheimer’s disease. Neuropsychologia 2008; 46:1688–1697 [DOI] [PubMed] [Google Scholar]
- 7.Mormino EC, Kluth JT, Madison CM, et al. : Episodic memory loss is related to hippocampal-mediated beta-amyloid deposition in elderly subjects. Brain 2009; 132(Pt 5):1310–1323 [DOI] [PMC free article] [PubMed] [Google Scholar]
- 8.Reiman EM, Chen K, Liu X, et al. : Fibrillar amyloid-Î2 burden in cognitively normal people at 3 levels of genetic risk for Alzheimer’s disease. Proc Natl Acad Sci USA 2009; 106:6820–6825 [DOI] [PMC free article] [PubMed] [Google Scholar]
- 9.Rowe CC, Ellis KA, Rimajova M, et al. : Amyloid imaging results from the Australian Imaging, Biomarkers and Lifestyle (AIBL) study of aging. Neurobiol Aging 2010; 31:1275–1283 [DOI] [PubMed] [Google Scholar]
- 10.Kantarci K, Lowe V, Przybelski SA, et al. : APOE modifies the association between Abeta load and cognition in cognitively normal older adults. Neurology 2012; 78:232–240 [DOI] [PMC free article] [PubMed] [Google Scholar]
- 11.Mathis CA, Kuller LH, Klunk WE, et al. : In vivo assessment of amyloidbeta deposition in nondemented very elderly subjects. Ann Neurol 2013; 73:751–761 [DOI] [PMC free article] [PubMed] [Google Scholar]
- 12.Minoshima S: Imaging Alzheimer’s disease: clinical applications. Neuroimaging Clin N Am 2003; 13:769–780 [DOI] [PubMed] [Google Scholar]
- 13.Lopresti BJ, Klunk WE, Mathis CA, et al. : Simplified quantification of Pittsburgh Compound B amyloid imaging PET studies: a comparative analysis. J Nucl Med 2005; 46:1959–1972 [PubMed] [Google Scholar]
- 14.Silverman DH, Alavi A: PET imaging in the assessment of normal and impaired cognitive function. Radiol Clin North Am 2005; 43:67–77 [DOI] [PubMed] [Google Scholar]
- 15.Mosconi L, Tsui WH, Pupi A, et al. : 18F-FDG PET database of longitudinally confirmed healthy elderly individuals improves detection of mild cognitive impairment and Alzheimer’s disease. J Nucl Med 2007; 48:1129–1134 [DOI] [PubMed] [Google Scholar]
- 16.Reiman EM, Caselli RJ, Yun LS, et al. : Preclinical evidence of Alzheimer’s disease in persons homozygous for the epsilon 4 allele for apolipoprotein E. N Engl J Med 1996; 96:752–758 [DOI] [PubMed] [Google Scholar]
- 17.Small GW, Ercoli LM, Silverman DH, et al. : Cerebral metabolic and cognitive decline in persons at genetic risk for Alzheimer’s disease. Proc Natl Acad Sci USA 2000; 97:6037–6042 [DOI] [PMC free article] [PubMed] [Google Scholar]
- 18.Johnson SC, Christian BT, Okonkwo OC, et al. : Amyloid burden and neural function in people at risk for Alzheimer’s disease. Neurobiol Aging 2014; 35:576–584 [DOI] [PMC free article] [PubMed] [Google Scholar]
- 19.Yi D, Lee DY, Sohn BK, et al. : Beta-amyloid associated differential effects of APOE 84 on brain metabolism in cognitively normal elderly. Am J Geriatr Psychiatry 2014; 22:961–970 [DOI] [PubMed] [Google Scholar]
- 20.Buchman AS, Boyle PA, Wilson RS, et al. : Association between late-life social activity and motor decline in older adults.Arch Intern Med 2009; 169:1139–1146 [DOI] [PMC free article] [PubMed] [Google Scholar]
- 21.Wilson RS, Bennett DA, Bienias JL, et al. : Cognitive activity and incident AD in a population-based sample of older persons. Neurology 2002; 59:1910–1914 [DOI] [PubMed] [Google Scholar]
- 22.Scarmeas N, Luchsinger JA, Schupf N, et al. : Physical activity, diet, and risk of Alzheimer disease. JAMA 2009; 302:627–637 [DOI] [PMC free article] [PubMed] [Google Scholar]
- 23.Lautenschlager NT, Cox KL, Flicker L, et al. : Effect of physical activity on cognitive function in older adults at risk for Alzheimer disease: a randomized trial. JAMA 2008; 300:1027–1037 [DOI] [PubMed] [Google Scholar]
- 24.Ngandu T, Lehtisalo J, Solomon A, et al. : A 2 year multidomain intervention of diet, exercise, cognitive training, and vascular risk monitoring versus control to prevent cognitive decline in at-risk elderly people (FINGER): a randomised controlled trial. Lancet 2015; 385:2255–2263 [DOI] [PubMed] [Google Scholar]
- 25.Roe CM, Xiong C, Miller JP, et al. : Education and Alzheimer disease without dementia: support for the cognitive reserve hypothesis. Neurology 2007; 68:223–228 [DOI] [PubMed] [Google Scholar]
- 26.Kemppainen NM, Aalto S, Karrasch M, et al. : Cognitive reserve hypothesis: Pittsburgh Compound B and fluorodeoxyglucose positron emission tomography in relation to education in mild Alzheimer’s disease.Ann Neurol 2008; 63:112–118 [DOI] [PubMed] [Google Scholar]
- 27.Roe CM, Mintun MA, D’Angelo G, et al. : Alzheimer disease and cognitive reserve: variation of education effect with carbon 11- labeled Pittsburgh Compound B uptake.Arch Neurol 2008; 65:1467–1471 [DOI] [PMC free article] [PubMed] [Google Scholar]
- 28.Stern Y, Gurland B, Tatemichi TK, et al. : Influence of education and occupation on the incidence of Alzheimer’s disease.JAMA 1994; 271:1004–1010 [PubMed] [Google Scholar]
- 29.Landau SM, Marks SM, Mormino EC, et al. : Association of lifetime cognitive engagement and low beta-amyloid deposition. Arch Neurol 2012;69:623–629 [DOI] [PMC free article] [PubMed] [Google Scholar]
- 30.Wirth M,Villeneuve S, La Joie R, et al. : Gene-environment interactions: lifetime cognitive activity, APOE genotype, and betaamyloid burden. J Neurosci 2014; 34:8612–8617 [DOI] [PMC free article] [PubMed] [Google Scholar]
- 31.Vemuri P, Lesnick TG, Przybelski SA, et al. : Effect of intellectual enrichment on AD biomarker trajectories: longitudinal imaging study. Neurology 2016; 86:1128–1135 [DOI] [PMC free article] [PubMed] [Google Scholar]
- 32.Vemuri P, Lesnick TG, Przybelski SA, et al. : Effect of lifestyle activities on Alzheimer disease biomarkers and cognition. Ann Neurol 2012;72:730–738 [DOI] [PMC free article] [PubMed] [Google Scholar]
- 33.Lopez OL, Becker JT, Klunk WE, et al. : Research evaluation and diagnosis of probable Alzheimer’s disease over the last two decades. Neurology 2000; 55:1854–1862 [DOI] [PubMed] [Google Scholar]
- 34.Schinka JA, Raj A, Loewenstein DA, et al. : Cross-validation of the Florida Cognitive Activities Scale (FCAS) in an Alzheimer’s disease research center sample.J Geriatr Psychiatry Neurol 2010; 23:9–14 [DOI] [PubMed] [Google Scholar]
- 35.Schinka JA, McBride A, Vanderploeg RD, et al. : Florida cognitive activities scale: initial development and validation. J Int Neuropsychol Soc 2005; 11:108–116 [DOI] [PubMed] [Google Scholar]
- 36.Price JC, Klunk WE, Lopresti BJ, et al. : Kinetic modeling of amyloid binding in humans using PET imaging and Pittsburgh Compound-B. J Cereb Blood Flow Metab 2005; 25:1528–1547 [DOI] [PubMed] [Google Scholar]
- 37.Hamacher K, Coenen HH, Stocklin G: Efficient stereospecific synthesis of no-carrier-added 2-[18F]-fluoro-2-deoxy-D-glucose using aminopolyether supported nucleophilic substitution. J Nucl Med 1986; 27:235–238 [PubMed] [Google Scholar]
- 38.Rosario BL, Weissfeld LA, Laymon CM, et al. : Inter-rater reliability of manual and automated region-of-interest delineation for PiB PET. Neuroimage 2011; 55:933–941 [DOI] [PMC free article] [PubMed] [Google Scholar]
- 39.Minoshima S, Frey KA, Koeppe RA, et al. : A diagnostic approach in Alzheimer’s disease using three-dimensional stereotactic surface projections of fluorine-18-FDG PET.J Nucl Med 1995; 36:1238–1248 [PubMed] [Google Scholar]
- 40.Herholz K, Schopphoff H, Schmidt M, et al. : Direct comparison of spatially normalized PET and SPECT scans in Alzheimer’s disease. J Nucl Med 2002; 43:21–26 [PubMed] [Google Scholar]
- 41.Ziolko SK, Weissfeld LA, Klunk WE, et al. : Evaluation of voxelbased methods for the statistical analysis of PIB PET amyloid imaging studies in Alzheimer’s disease. Neuroimage 2006; 33:94–102 [DOI] [PubMed] [Google Scholar]
- 42.Cohen AD, Mowrey W, Weissfeld LA, et al. : Classification of amyloid-positivity in controls: comparison of visual read and quantitative approaches. Neuroimage 2013; 71:207–215 [DOI] [PMC free article] [PubMed] [Google Scholar]
- 43.Dunn OJ: Multiple comparisons among means. J Am Stat Assoc 1961;56:52–64 [Google Scholar]
- 44.Dotson VM, Schinka JA, Brown LM, et al. : Characteristics of the Florida cognitive activities scale in older African Americans. Assessment 2008; 15:72–77 [DOI] [PubMed] [Google Scholar]
- 45.Nebes RD, Snitz BE, Cohen AD, et al. : Cognitive aging in persons with minimal amyloid-beta and white matter hyperintensities. Neuropsychologia 2013; 51:2202–2209 [DOI] [PMC free article] [PubMed] [Google Scholar]
- 46.Snitz BE, Weissfeld LA, Cohen AD, et al. : Subjective cognitive complaints, personality and brain amyloid-beta in cognitively normal older adults. Am J Geriatr Psychiatry 2015; 23:985–993 [DOI] [PMC free article] [PubMed] [Google Scholar]
- 47.Wilson RS, Mendes De Leon CF, Barnes LL, et al. : Participation in cognitively stimulating activities and risk of incident Alzheimer disease. JAMA 2002; 287:742–748 [DOI] [PubMed] [Google Scholar]
- 48.Scarmeas N, Levy G, Tang MX, et al. : Influence of leisure activity on the incidence of Alzheimer’s disease. Neurology 2001; 57:2236–2242 [DOI] [PMC free article] [PubMed] [Google Scholar]
Associated Data
This section collects any data citations, data availability statements, or supplementary materials included in this article.