Abstract
Chronic inflammation and prostate fibrosis have been identified as contributors to lower urinary tract symptoms (LUTS) pathophysiology in humans. It has been shown that transurethral infection of an Escherichia coli strain named CP1, which was isolated from a patient with chronic prostatitis, can lead to the develop of differential chronic inflammation and pain in certain mouse strains. Therefore, we hypothesized that differential inflammation would influence fibrotic response in the prostate. This study showed that while prostatic infection by CP1 causes the development of chronic tactile allodynia in NOD/ShiltJ (NOD) but not C57BL/6 (B6) mice, both mice developed evidence of prostate inflammation, prostate fibrosis, and urinary dysfunction. Fibrosis was confirmed by the upregulation of fibrosis-associated messenger RNAs (mRNAs), α-smooth muscle actin immunohistochemistry, and collagen staining with picrosirius red. These findings were mainly focused on the dorsolateral lobes of the prostate. Both mouse strains also developed smaller, more frequent voiding patterns postinfection, examined via cystometry. B6 mice responded to CP1 infection with type 2 cytokines (IL-4 and IL-13), while NOD mice did not, which may explain the differing tactile allodynia responses and level of collagen deposition. When mice lacking signal transducer and activator of transcription 6 (STAT6), a transcription factor known to be important for the production and signaling of IL-4 and IL-13, were infected with CP1, fibrosis was attenuated. This study provides a potential model for studying the development of infection-induced prostatic fibrosis and LUTS. This study also demonstrates that CP1-induced prostate fibrosis has a STAT6-dependent mechanism in B6 mice.
Keywords: fibrosis, LUTS, type 2 cytokine, UPEC, urinary dysfunction
INTRODUCTION
Lower urinary tract symptoms (LUTS) is an umbrella term for a number of symptoms associated with bladder and/or voiding dysfunction, such as frequent daytime voiding, nocturia, and sensations of incomplete emptying (15, 26). It is estimated that, in 2008, 44.1% of all men who were 20 yr of age or older, in Africa, Asia, Europe, North America, and South America, suffered from LUTS, and this percentage is predicted to increase slightly to 44.7%, by 2018 (15). LUTS affects the quality of life of a significant portion of the world population; however, the specific mechanisms that govern its development are still being identified.
LUTS has been linked to prostate tissue remodeling and higher collagen content (2). Fibrosis is an aberrant wound-healing process, which leads to the deposition of excess extracellular matrix components (ECM), such as collagen. Fibrosis is thought to contribute to LUTS by causing increased rigidity, resulting in increasing pressure on the urethra and voiding dysfunction (2, 3, 10, 12, 21, 26).
Inflammation has been well documented as profibrotic in several tissues (7, 20, 34, 35). Specifically, prostate inflammation has been shown to be positively correlated with collagen content and prostate symptom scores in LUTS patients (3). Studies have also shown that prostate inflammation, induced using bacteria, contributed to prostate fibrosis development in animal models (5, 31, 32). Given that prostate fibrosis is linked to LUTS, these data suggest bacterial prostatic inflammation could promote the development of LUTS, through the generation of chronic pathologies like fibrosis.
A clinical uropathogenic Escherichia coli strain, designated CP1, has been shown to induce inflammation in the prostates of B6 and NOD mice (25, 29). While previous studies have used uropathogenic E. coli to induce prostate inflammation (21, 22), CP1 was shown to have the unique ability to be cleared from the host and still mediate an effect (18, 20), thereby, creating a different type of mouse model, which can contribute to the work that has already been done. NOD mice were found to develop a Th1/Th17 T cell response upon CP1 infection, while B6 mice had a slightly elevated Th2 response (25). Different aspects of inflammation have been identified as key components of the pathogenesis of fibrosis. In particular, type 2-associated cytokines IL-4, IL-5, and IL-13 have all been implicated in fibrosis development (7, 17, 19, 22, 34, 35). We therefore hypothesized that differential adaptive immune responses would alter the extent and nature of the fibrotic response in the prostate. We therefore expect that the pathogenesis of urinary dysfunction can be better understood utilizing CP1 infection mouse models.
MATERIALS AND METHODS
Animal infection.
C57BL/6 (B6) and NOD/ShiltJ (NOD) male mice were purchased at 5–7 wk old (Jackson Laboratory, Bar Harbor, ME) and later transurethrally infected with 1 × 10⁸ of CP1 E. coli as described previously (29). A B6.129S2(C)-Stat6tm1Gru/J [signal transducer and activator of transcription 6 (STAT6) KO] breeder pair was purchased at 5–7 wk old (Jackson Laboratory) and bred at Northwestern University’s animal facility. The bred male STAT6 KO mice, were transurethrally infected with 1 × 10⁸ of CP1 E. coli as described previously (29). CP1 is a clinical strain of E. coli isolated from the expressed prostatic secretion of a male patient with CP/CPPS. Age-matched control animals, which were either bred or purchased from Jackson Laboratory, received a transurethral instillation of PBS and were kept in separate cages. Animal experiments and procedures were submitted to and approved by the Northwestern University Animal Care and Use Committee.
Tactile allodynia testing.
Animals were tested for the presence of pain by quantifying referred visceral pain as cutaneous hyperalgesia. Mice were individually tested for cutaneous hyperalgesia with von Frey filaments (with forces of 0.04, 0.16, 0.4, 1, and 4 g) as previously described (29). The same blinded investigator (D. J. Mazur) performed all testing. Data are reported as the percentage of positive response ± SE for each fiber and for all fibers in total.
Cystometry.
Cystometry was performed through a cystotomy of urethane-anesthetized mice in a quiet room. Urethane, dissolved in distilled water, was administered subcutaneously at a dose of 1.5 g/kg. After induction of anesthesia, a small midline abdominal incision was made and the dome of the bladder was exposed. A purse-string suture of 7–0 nylon was placed in the dome of the bladder with microscopic assistance. A small stab incision was then made in the middle of the purse string, and the tip of a PE-50 catheter was placed in the bladder. The purse-string suture was tied to secure the catheter in place. The catheter was then connected to a three-way valve connected to a syringe pump filled with 0.9% saline and a pressure transducer; cystometry was then performed as previously described. During the last 20 min of the 1.5-h infusion period, we collected information on the average intercontractile interval (defined as the time from the peak of one contraction to next) and the average voiding peak-to-baseline pressure change. Given the constant rate of saline infusion, both the voided volume (infusion rate × the intercontractile interval = volume infused during a contraction, which is used as surrogate for voided volume) and the bladder compliance (volume infused/change in pressure) could then be calculated. Wyndaele et al. (33) describes the basis for the bladder compliance formula. Mice were then euthanized by cervical dislocation at the end of the procedure.
Mouse tissue preparation.
The prostates and bladders were harvested from mice after cystometric analysis, and each sample was divided in half. One half of each prostate sample and whole bladders were fixed in 10% formalin and then further processed by the Northwestern University Mouse Histology and Phenotyping Core. The specimens were embedded in paraffin, and 5-μm sections were taken and mounted on glass slides. These slides were used for subsequent picrosirius red and hematoxylin and eosin (H&E) staining. The Northwestern University Mouse Histology and Phenotyping Core performed H&E staining. Picrosirius red staining was performed by the authors (A. Bell-Cohen and D. J. Mazur).
Inflammation scoring.
After H&E staining, prostate inflammation was assessed in the same region using the classification system described in Nickel et al. (24), with 0 being no inflammation, 1 being mild inflammation, 2 being moderate inflammation, and 3 being severe inflammation.
Picrosirius red staining.
After the paraffin-embedded, 5-μm prostate and bladder sections were mounted on glass slides, the paraffin was removed and the sections were rehydrated. Next, the slides were stained in picrosirius red solution (Direct Red 80 from Sigma-Aldrich and saturated picric acid) for at least 1 h. Then, the sections were washed in two changes of acidified water. Last, the slides were dehydrated in ethanol, cleared in xylene, and mounted with Krystalon (EMD Millipore). Images were taken on a Leica DMLA compound microscope with circular polarized lens using a QImaging MicroPublisher 3.3 RTV camera. Analysis of the images was performed using ImageJ software. Tissue fluorescence following circular polarized light microscopy was quantified from two sections per tissue without lumen subtraction and averaged over the total number of animals in a group.
Immunohistochemistry.
After the paraffin embedded, 5-μm prostate sections were mounted on glass slides, the paraffin was removed and the sections were rehydrated. Using boiling 10 mM citrate buffer, the epitopes on the tissue were unmasked. Next, the prostate tissue was stained with anti-mouse α-smooth muscle actin (A-SMA; Cell Signaling Technology) or p-STAT6 (Abcam) antibodies using the Cell and Tissue Staining Kit-Rabbit HRP-DAB (R&D Systems) per the manufacturer’s instructions. Last, the slides were dehydrated in ethanol, cleared in xylene, and mounted with Krystalon (EMD Millipore). Images were taken on a Leica DMLA compound microscope using a QImaging MicroPublisher 3.3 RTV camera.
Real-time quantitative reverse-transcriptase PCR.
A sample of the single-cell suspension created above was then used with TRIzol (Invitrogen) RNA extraction per the manufacturer’s instructions. cDNA was then created from the RNA using qScript Super mix (Quanta) per the manufacturer’s instructions. Primers were created for the RNAs of interest using the NIH online primer blast tool. Quantitative (Q)-PCR was performed using perfecta qPCR Supermix (Quanta) according to the manufacturer’s instructions on a CFX Connect machine (Bio-Rad). ddCT calculations were then performed using mouse ribosomal L19 as the housekeeping gene. After normalization to the housekeeping gene, the gene of interest in infected mouse tissue was normalized to the average expression of the gene of interest in the respective control mouse of each strain. The Q-PCR targets used in this study were collagen 1a1, collagen 1a2, collagen 3a1, A-SMA, TGF-β1, CCL2, CXCL5, and CXCL12.
Statistical analyses.
Results are expressed as mean ± SE or mean ± SD and were analyzed for statistical significance by unpaired t-test (Prism software, version 6, GraphPad Software). P < 0.05 was considered statistically significant.
RESULTS
CP1 infection’s effect on tactile allodynia, inflammation, and urinary dysfunction in B6 and NOD mice.
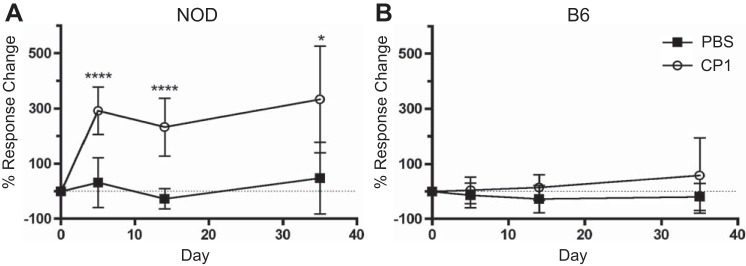
We previously showed that transurethral infection of CP1 induces chronic pelvic tactile allodynia in NOD but not B6 mice that is maintained after bacterial clearance (29). NOD mice infected with CP1 demonstrated a significant increase in response to stimulation with Von Frey filaments at days 5, 14, and 35 after infection compared with controls, (Fig. 1A). There was no difference in response to stimulation between B6-infected and control mice at days 5, 14, and 35 (Fig. 1B).
Fig. 1.
CP1-infected NOD mice, but not infected B6 mice, have increased tactile allodynia. A: percent response change in control and CP1-infected NOD tactile allodynia responses, normalized to baseline, at days 5, 14, and 35. The dashed line indicates where there is 0 response change. B: percent response change in control and CP1-infected B6 tactile allodynia responses, normalized to baseline, at days 5, 14, and 35. The dashed line indicates where there is 0 response change. The experiment was performed with 4–5 mice per time point per group. Data represent the average total response change of all 5 filaments. Results were analyzed for statistical significance by unpaired t-test. A P < 0.05 was considered statistically significant: ****P < 0.0001.
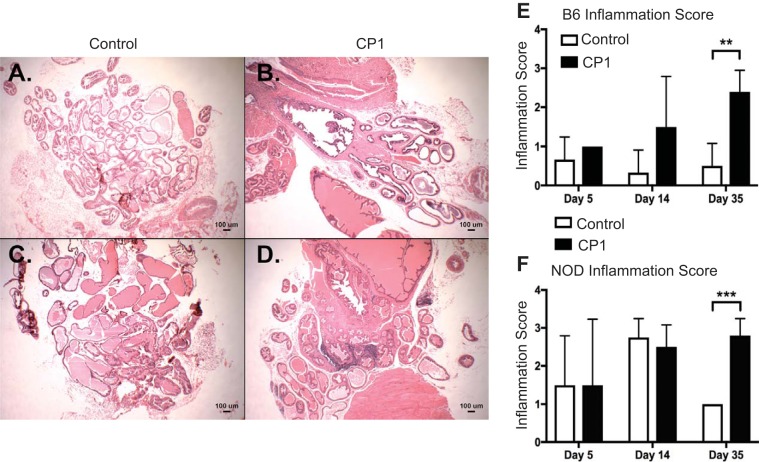
To assess whether CP1 infection induces prostatic inflammation, B6 and NOD prostate sections were stained with H&E and the severity of inflammation was evaluated. Figure 2, A–D, displays representative images of day 35 control and infected B6 and NOD prostate tissue, respectively. There was no difference in inflammation in both NOD and B6 mice at days 5 and 14. Both B6 and NOD mice had significant increases in prostatic inflammation at day 35 compared with control mice (Fig. 2, E and F).
Fig. 2.
NOD and B6 mice develop chronic inflammation after CP1 infection. Day 35 control (A) and CP1 (B) B6 mouse prostates stained with hematoxylin and eosin (H&E). Day 35 control (C) and CP1 (D) NOD mouse prostates stained with H&E. E: quantification of H&E-based inflammation scoring in B6 mice. F: quantification of H&E-based inflammation scoring in NOD mice. The experiment was performed with at least 3 mice per time point per group. Results were analyzed for statistical significance by unpaired t-test. A P < 0.05 was considered statistically significant: **P < 0.01, ***P < 0.001.
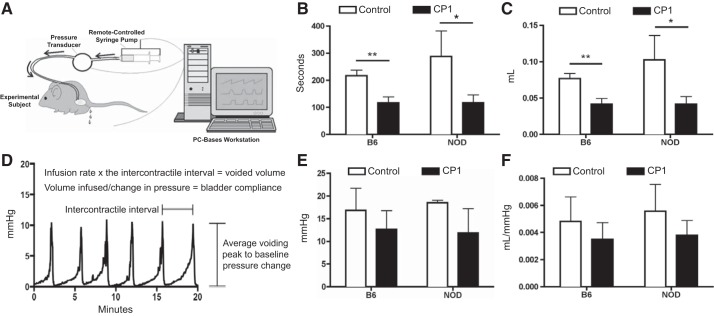
To determine whether mice infected with CP1 developed voiding dysfunction, cystometry under anesthesia was performed at day 35. Figure 3A depicts the set up for how the cystometry was run, using a modified figure from Med Associates (2004). Figure 3D shows a sample cystometric trace and how it is used to calculate the metrics used to analyze bladder function in the mice. Both B6 and NOD CP1-infected mice demonstrated an increase in voiding frequency [as measured by the intercontractile interval (Fig. 3B)] and a decrease in voided volume [as measured by the volume infused during intercontractile interval (Fig. 3C)]. There was no difference measured in voiding peak-to-baseline pressure or in calculated bladder compliance (Fig. 3, E and F, respectively). These data show that both B6 and NOD mice develop urinary dysfunction in response to CP1 infection.
Fig. 3.
CP1 infection induces urinary dysfunction in mice. A: schematic depiction of the cystometry apparatus. [Reproduced with permission of Med Associates Inc.] B: average amount of time, in seconds, between micturition events in control and CP1-infected B6 and NOD mice at day 35. C: average volume of fluid expelled from control and CP1-infected B6 and NOD mice during micturition at day 35. D: sample cystometric trace that displays how each urinary parameter was calculated. E: average change in pressure during micturition in control and CP1-infected B6 and NOD mice at day 35. F: average voided volume from control and CP1-infected B6 and NOD divided by the average change in pressure, which conveys bladder compliance at day 35. The experiment was performed with 4 mice per group. Results were analyzed for statistical significance by unpaired t-test. A P < 0.05 was considered statistically significant: *P < 0.05, **P < 0.01.
CP1 infection causes fibrosis in B6 and NOD mice.
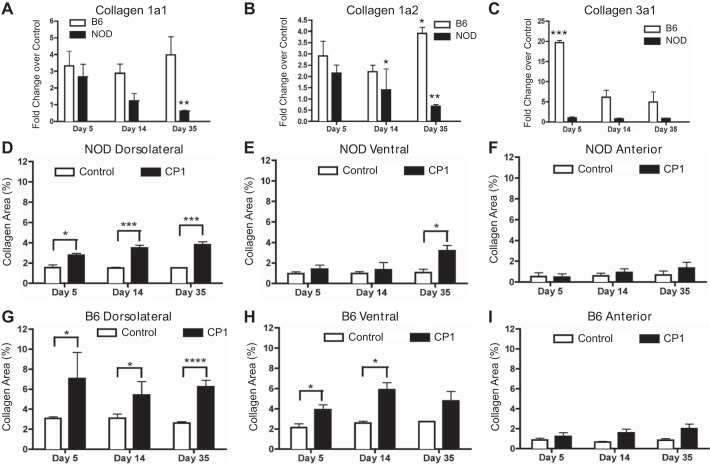
Owing to the proposed link between urinary dysfunction and prostate fibrosis, Q-PCR was performed on mouse prostates to assess for changes in expression of fibrosis-associated mRNAs. Collagen 1a1, collagen 1a2, and collagen 3a1 are extracellular matrix components with increased expression during fibrosis. In both B6 and NOD mice, collagen 1a1 and 1a2 mRNA expression were upregulated at day 5 (Fig. 4, A and B). In the B6 mice, this upregulation persisted at all time points until day 35, except for collagen1a2, which significantly increased at day 35. However, by day 35 in NOD mice, collagen 1a1 and collagen 1a2 were significantly decreased. Collagen 3a1 mRNA expression was significantly upregulated in B6 mice at day 5 and elevated at days 14 and 35. The NOD mice showed no elevation in collagen 3a1. (Fig. 4C).
Fig. 4.
NOD and B6 mice develop fibrosis after CP1 infection. CP1-infected B6 and NOD prostate mRNA levels of collagen 1a1 (A), collagen 1a2 (B), and collagen 3a1 (C). Control and CP1-infected NOD collagen content in the dorsolateral (D), ventral (E), and anterior (F) prostate lobes at days 5, 14, and 35 based on picrosirius analysis. Control and CP1-infected B6 collagen content in the dorsolateral (G), ventral (H), and anterior (I) prostate lobes at days 5, 14, and 35 based on picrosirius analysis. The experiment was performed with 4 mice per time point per group. Results were analyzed for statistical significance by unpaired t-test. A P < 0.05 was considered statistically significant: *P < 0.05, **P < 0.01, ***P < 0.001, ****P < 0.0001.
To further explore fibrosis development, the level of collagen protein content, marked by staining with picrosirius dye, was examined in different lobes of the infected mouse prostates. There was a significant increase in the collagen content of the dorsolateral lobes of the CP1-infected NOD prostates at all time points assayed (Fig. 4D). Figure 4E shows there was a significant increase in the collagen content of the ventral lobe of CP1-infected NOD mice only at day 35. There was no change in the collagen content of the anterior lobe (Fig. 4F). Similar to the NOD mice, Fig. 4G shows that there was a significantly higher level of collagen in the dorsolateral lobe at all time points assayed in infected B6 mice compared with controls. A significant increase in collagen content was noted in the ventral lobes at days 5 and 14 (Fig. 4H). Again, no difference was noted in the anterior lobes at any time point (Fig. 4I).
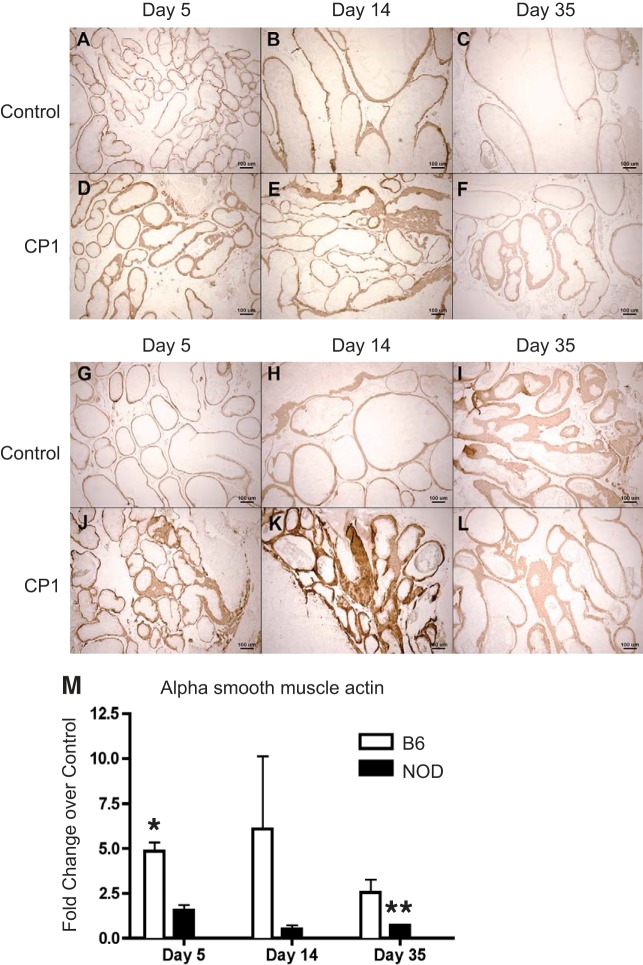
To understand what effect CP1 infection had on A-SMA, an extracellular matrix protein associated with fibrosis, immunohistochemistry and Q-PCR were performed on mouse prostates to assess for changes in expression of A-SMA. Figure 5, A–F, displays representative images of A-SMA staining in control and CP1 B6 prostates. Figure 5, G–L, displays representative images of A-SMA staining in control and CP1 NOD prostates. A-SMA mRNA expression was significantly upregulated at day 5 in B6 mice. The NOD mice had a significant decrease in A-SMA at day 35 (Fig. 5M).
Fig. 5.
Infected B6 and NOD mice express elevated α-smooth muscle actin (A-SMA) mRNA and protein in the prostate. Immunohistochemical staining of control and CP1-infected B6 (A–F) and NOD (G–L) prostate protein levels of A-SMA, respectively. CP1-infected B6 and NOD prostate mRNA levels of A-SMA (M) displayed a fold-change over control at days 5, 14, and 35. The experiment was performed with at least 3 mice per time point per group. Results are expressed as means ± SD. Results were analyzed for statistical significance by unpaired t-test. A P < 0.05 was considered statistically significant: *P < 0.05, **P < 0.01.
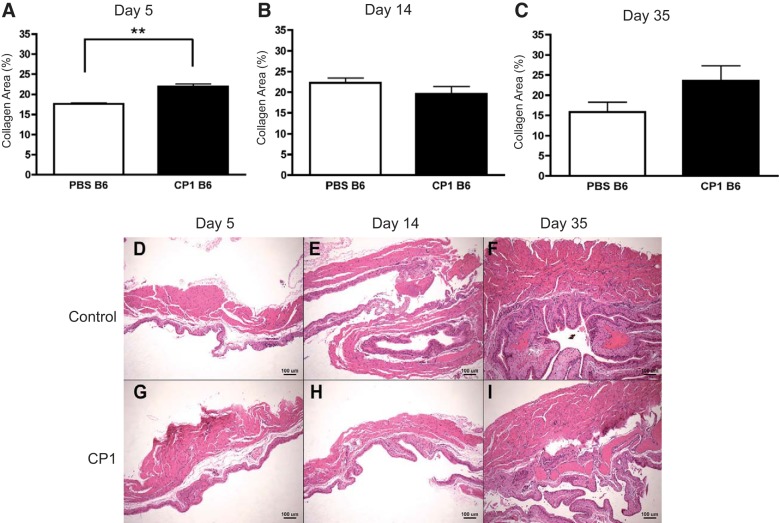
The voiding frequency and voided volume of infected B6 mice had a higher level of statistical significance compared with infected NOD mice compared with their respective controls. Also, infected B6 mice developed higher total levels of collagen compared with NOD mice. These results suggest that B6 mice develop worse fibrosis and worse urinary symptoms relative to NOD mice. Therefore, picrosirius staining was used to assess potential changes in collagen content in the bladders of specifically B6 mice. Infected B6 bladders possessed elevated collagen levels only at day 5 (Fig. 6A). There was no significant difference in collagen levels at days 14 and 35 in B6 bladders (Fig. 6, B and C). Figure 6, D–I, shows H&E images of days 5, 14, and 35 control and infected B6 bladder sections, respectively, from close to the bladder neck. Taken together, these data show that both NOD and B6 mice express elevated prostate collagen levels, especially in the dorsolateral lobe, after CP1 infection. B6 and NOD mice express elevated A-SMA protein levels at days 5 and 14 in the prostate. Last, B6 mice also develop more collagen in their bladders soon after infection, which returns to normal levels over time.
Fig. 6.
CP1-infected B6 mice have elevated bladder collagen levels only at day 5 and similar levels of bladder inflammation. Collagen deposition levels in the bladders of control and CP1-infected B6 mice after 5 days (A), 14 days (B), and 35 days (C) analyzed by picrosirius staining. Days 5, 14, and 35 (D–F) control and CP1 (G–I) B6 mouse bladders stained with H&E. The experiment was performed with at least 4 mice per group. Results were analyzed for statistical significance by unpaired t-test. A P < 0.05 was considered statistically significant: **P < 0.01.
Prostates infected with CP1 demonstrate increased mRNA expression of fibrosis markers and fibrosis-associated genes.
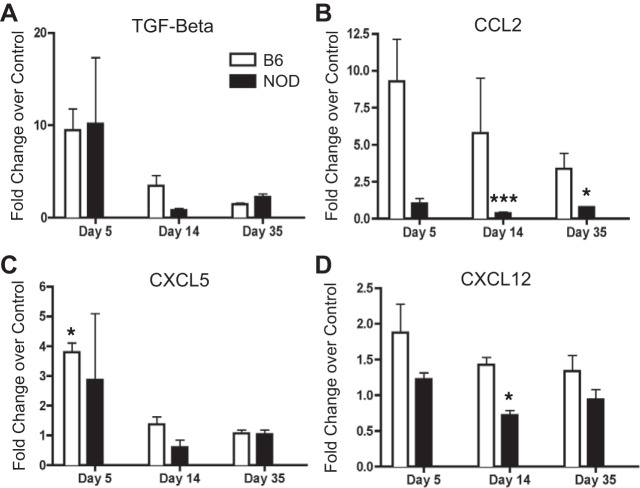
We also examined cytokines associated with profibrotic signaling. Both TGF-β1 and CXCL5 showed an initial increase in mRNA expression at day 5 in B6 and NOD mice, with that increase being significant in B6 mice, but this normalized to control levels at later time points (Fig. 7, A and C). CCL2 was upregulated in B6 mice throughout all time points; however, fold-change decreased as time went on (Fig. 7B). There was a significant decrease in the expression of CCL2 in NOD mice at days 14 and 35. While there was a slight increase in the expression of CXCL12 in B6 mice at the day 5 time point, there was otherwise no change in the expression of CXCL12 throughout the rest of the experiment for the B6 mice (Fig. 7D). NOD mice had significantly less CXCL12 at day 14. These data suggest there are differential increases and decreases in profibrotic-immune signaling molecules in both NOD and B6 mice.
Fig. 7.
Infected B6 and NOD mice express elevated fibrosis-associated mRNA in the prostate. CP1-infected B6 and NOD prostate mRNA levels of TGF-β (A), CCL2 (B), CXCL5 (C), and CXCL12 (D) displayed as fold-change over control at days 5, 14, and 35. The experiment was performed with 3 mice per time point per group. Results are expressed as means ± SD. Results were analyzed for statistical significance by unpaired t-test. A P < 0.05 was considered statistically significant: *P < 0.05, ***P < 0.001.
CP1-infected STAT6 KO prostates produce significantly less collagen compared with CP1-infected B6 mouse prostates.
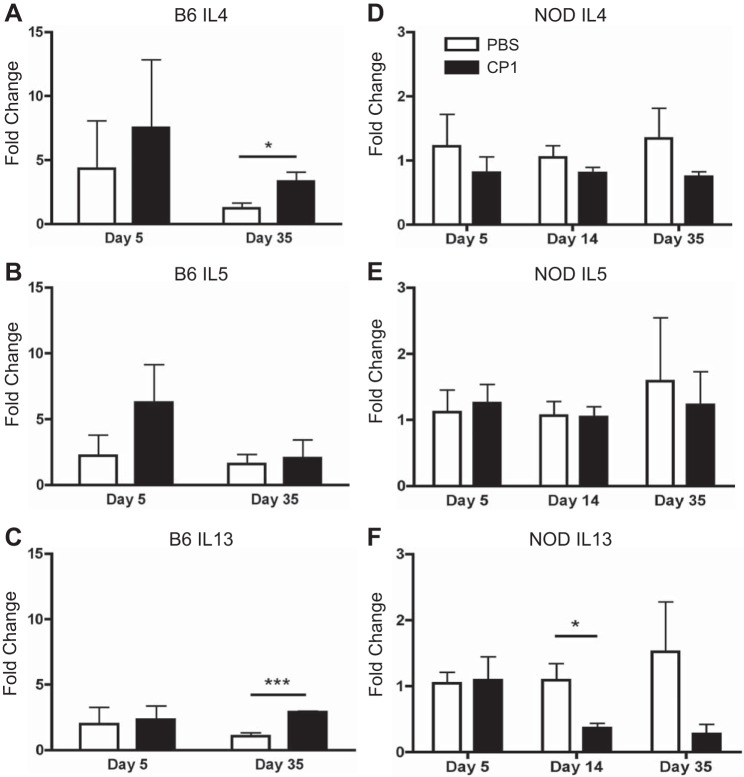
Fibrosis has been shown to be associated with type 2 cytokines in a number of other tissues (7, 17, 19, 22, 34, 35). Therefore, to assess the presence of type 2 cytokines post-CP1 infection, Q-PCR was run on the prostates of infected B6 and NOD mice. As shown in Fig. 8, A-C, the prostates of CP1-infected B6 mice 5 days postinfection showed no significant elevation in IL-4, IL-5, or IL-13 compared with naive controls. However, at 35 days postinfection, infected B6 prostates possessed significantly elevated levels of IL-4 and highly significant elevated levels of IL-13. Infected NOD prostates showed no elevation in IL-4, IL-5, or IL-13 at any of the time points assayed compared with naive controls (Fig. 8, D–F). In fact, NOD prostates 14 days postinfection had significantly less IL-13 (Fig. 8F).
Fig. 8.
CP1-infected B6 mice, but not NOD mice, express elevated type 2 cytokine mRNA in the prostate. Control and CP1-infected B6 prostate IL-4 (A), IL-5 (B), and IL-13 (C) mRNA levels at days 5 and 35. Control and CP1-infected NOD prostate IL-4 (D), IL-5 (E), and IL-13 (F) mRNA levels at days 5, 14, and 35. The experiment was performed with 3–4 mice per time point per group. Results were analyzed for statistical significance by unpaired t-test. A P < 0.05 was considered statistically significant: *P < 0.05, ***P < 0.001.
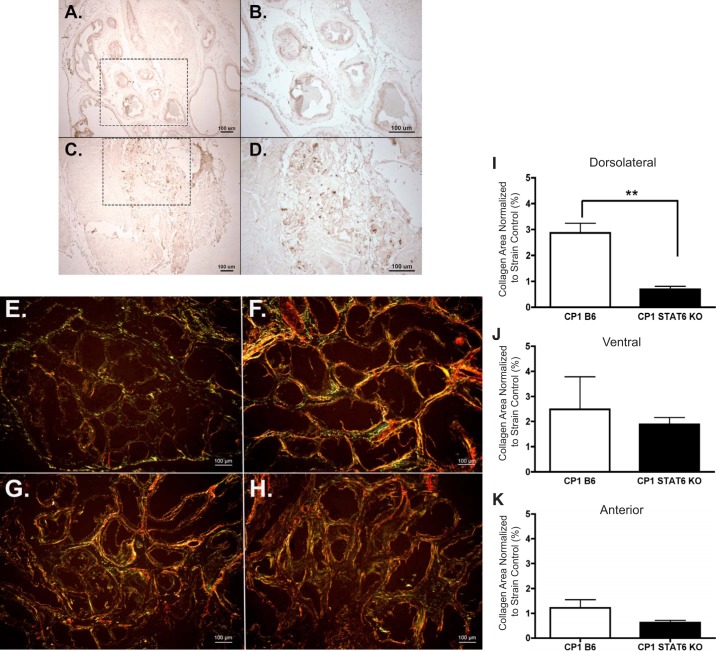
Type 2 cytokine signaling, specifically IL-4 and IL-13, are known to be dependent on signal transducer and activator of transcription 6 (STAT6) (16). Therefore, to evaluate the activation of the type 2 cytokine signaling pathway, p-STAT6 levels were assessed via immunohistochemistry in B6 prostate tissue. Figure 9, A–D, depicts the p-STAT6 staining in control and infected B6 prostate sections.
Fig. 9.
Activated STAT6 is elevated and required for fibrosis development in CP1-infected B6 mice. Immunohistochemical staining of phosphorylated STAT6 in day 35 control B6 tissue at ×10 (A) and ×20 (B) magnification and CP1-infected B6 tissue at ×10 (C) and ×20 (D) magnification. The dotted-lined box in the ×10 images indicates the region being viewed in the ×20 images. Picrosirius images of the dorsolateral prostate lobe from PBS B6 (E), CP1 B6 (F), PBS STAT6 KO (G), and CP1 STAT6 KO (H) mice at ×10 magnification (imaged under circular polarized light). The quantification of collagen content in the dorsolateral (I), ventral (J), and anterior (K) lobes of infected B6 and STAT6 KO mice normalized to their respective controls after 28–35 days. The experiment was performed with 3–5 mice per group. Results were analyzed for statistical significance by unpaired t-test. A P < 0.05 was considered statistically significant: **P < 0.01.
Next, to determine the necessity of type 2 cytokine signaling for development of fibrosis, STAT6 KO mice were infected with CP1. Wild-type B6 mice, which are the background strain of the transgenic STAT6 KO mice, were also infected as a control. The level of prostate fibrosis induction was examined at days 28–35 after infection, using picrosirius staining analysis. Figure 9, E–H, shows sample picrosirius images from infected and control B6 and STAT6 KO dorsolateral prostates. CP1-infected STAT6 KO mice showed significantly reduced levels of collagen in the dorsolateral lobe compared with their wild-type B6 counterparts (Fig. 9I). The ventral and anterior prostate lobes contained slightly reduced levels of collagen (Fig. 9, J and K, respectively). These data suggest that IL-4 and IL-13 are associated with prostate fibrosis, STAT6 signaling is elevated after CP1 infection, and type 2 cytokine signaling through STAT6 is necessary for CP-1 induced fibrosis of the prostate in B6 mice.
DISCUSSION
Uropathogenic E. coli infection has been shown to lead to the development of a number of diseases and/or symptoms in animal models and patients; CP1 is no different (1, 11, 18, 31, 32). As previously shown, CP1 infection produces a strain-specific tactile allodynia response in NOD mice, but not B6 mice (29). However, both mouse strains developed prostate inflammation, urinary dysfunction, and fibrosis after CP1 infection, although to different extents. In addition to having these LUTS patient-like comorbidities, both mouse models were shown to have increased frequency. In fact, storage symptoms are the most common subtype of LUTS (15). Therefore, CP1-infected mice recapitulate traits seen in patients making it a useful tool to examine the pathophysiology of LUTS in humans, both in the context of pain and without pain.
Besides LUTS, CP1-infected mice also developed fibrosis and elevated levels of profibrosis-signaling molecules. B6 mice seemed to deposit higher levels of collagen compared with NOD mice. Excess collagen deposition appeared to be somewhat temporal and lobe specific, as fibrosis was never seen in the anterior prostate and only on occasion in the ventral prostate. However, fibrosis developed consistently in the dorsolateral prostate of both strains of infected mice. The dorsolateral lobe of the mouse prostate is located around the neck of the bladder and urethra. This specific area experiencing the greatest incidence of fibrosis aligns well with the notion of fibrosis contributing to urinary dysfunction, through increased urethral pressure. The collagen data for day 5 must be carefully interpreted. Although an increase in collagen was seen, which meets the criteria for fibrosis, any excess collagen seen at day 5 could be interpreted as a wound-healing response in the prostate and not actual fibrosis. Owing to the use of a bacterium that has tropism for the prostate in this model, the excess collagen could just be an appropriate response to the damage caused by infection.
Previous studies have shown that pressure on the urethra leads to secondary fibrosis in the bladder (14). Therefore, one would expect to see changes occurring in the bladder that contribute to urinary dysfunction. Yet, an increase in collagen levels was only seen at day 5 in the bladders of B6 mice. This could just be a normal wound-healing response to a potential bladder bacterial infection, which has been previously shown to happen (20). While no bladder fibrosis was seen at day 35 when prostate fibrosis had occurred and urinary function was assayed, this result was not completely unexpected. Cystometry analysis revealed that there was no difference in bladder pressure in infected mice; therefore, bladder fibrosis may not have occurred yet. Perhaps, if the B6 model were allowed to progress longer than 35 days, the mice would develop the expected secondary bladder fibrosis and consequential increase in bladder pressure, as has been seen in previous mouse prostate fibrosis studies (27).
While several cytokines and chemokines are known to be associated with fibrosis, in particular CCL2, CXCL5, CXCL12, and TGF-β were examined in this study (30). Of the four profibrotic chemokines assayed, B6 and NOD mice expressed TGF-β in a similar fashion at each time point. Conversely, B6 mice expressed elevated CCL2 and slightly elevated CXCL12 at each time point, while NOD mice had either no difference in or significantly decreased mRNA expression of the chemokines at any time point. The A-SMA mRNA data suggested that A-SMA protein levels would be greatly elevated in B6 mice and not at all in NOD mice. However, B6 mice seemed to only express moderately increased levels of A-SMA protein at days 5 and 14. NOD mice also expressed an increased amount of A-SMA at days 5 and 14. Both mice lacked any increase in A-SMA levels at day 35. This result is unexpected due to A-SMA being shown to be elevated both after human prostate cells are made fibrotic (8, 9) and in prostate fibrosis in mouse tissue (27). However, A-SMA is known as a marker of myofibroblasts, a cell type recognized to be important in fibrosis development (4, 9, 27, 28). Therefore, this result suggests that myofibroblasts are potentially contributing to the excess collagen levels seen in NOD and B6 mice early on in fibrosis development, but not the prolonged fibrosis seen at later time points. Also, at this point in time, no patient studies have been conducted which show an increase in A-SMA levels in male LUTS patients. This suggests that A-SMA may not play a role in urinary dysfunction in humans.
In addition to recapitulating human symptoms in mice, this study and the mouse models postulate a potential bacterial etiology for the development of LUTS and fibrosis by using a clinically relevant E. coli infection in two different mouse models. In these models, a bacterial infection initiates immunological changes that potentially lead to downstream symptoms, even after the bacterial infection has been cleared from the host. Patient and animal studies have proposed a link between bacterial infection, LUTS development, and prostate fibrosis (6, 23, 26, 31, 32). Therefore, these models would be useful in exploring potential mechanisms of microbial-induced fibrosis and LUTS, as well as how fibrosis may be contributing to LUTS.
In thinking about potential mechanisms that could be playing a role in LUTS and fibrosis development, we note that previous work has shown that CP1 infection in NOD mice leads to a significant increase in CD4+ T cells that express IFN-γ and CD4+ T cells that express IL-17A. B6 mice were shown to have a slight increase in CD4+ T cells that express IL-4 (25). Hypothesizing that the differing immune responses might be responsible for the differences seen in fibrosis development between the two mouse strains, the immune response was examined in this study. As expected, B6 mice possessed elevated IL-4 and IL-13 expression levels and NOD mice did not. It was previously noted that B6 and NOD mice develop urinary dysfunction and fibrosis to different extents. Perhaps the differential immune responses are responsible for the variances seen in LUTS and fibrosis development.
IL-4 and IL-13 signaling through their receptors is dependent on STAT6 (16). This study also showed an elevated level of activated STAT6, suggesting increased STAT6 signaling. Therefore, if STAT6 signaling is important in fibrosis development, removing it from a B6 mouse should result in a lack of fibrosis. After CP1 infection, PBS control and CP1-infected STAT6 KO mice displayed no difference in collagen levels in any prostatic lobe. Yet, CP1-infected B6 mice had significantly more collagen than PBS control B6 mice. This results shows that STAT6 is necessary for fibrosis induction in B6 mice. However, STAT6 is not only important for IL-4 and IL-13 receptor signaling, it also plays a key role in the production of IL-4 and IL-13 (13, 16). Consequently, based on the work done in this study, it cannot be determined whether STAT6 is necessary for IL-4 and IL-13 receptor signaling or IL-4 and IL-13 cytokine production in B6 mice to cultivate fibrosis. Also, the urinary dysfunction status was not determined in this study for the STAT6 KO mice.
In addition to examining the exact nature of STAT6’s necessity in fibrosis development, further analyses are required to discover the mechanism by which fibrosis is being induced in these mouse models. The work described here shows an elevation in IL-4 and IL-13 expression; identification of the cell type or types producing the type 2 cytokines would be a key component of this mechanism, as well as identifying the molecule activating cells to produce IL-4 and IL-13. This study also shows that CP1-induced fibrosis and LUTS in NOD mice are not mediated by type 2 cytokines. This suggests that, perhaps, a Th1- or Th17-mediated mechanism may be responsible for the symptoms developed by NOD mice.
GRANTS
This project was supported by National Institute of Diabetes and Digestive and Kidney Diseases Grants R01DK094898, R01DK083609, and R01DK117906.
DISCLOSURES
No conflicts of interest, financial or otherwise, are declared by the authors.
AUTHOR CONTRIBUTIONS
A.B.-C., D.J.M., and P.T. conceived and designed research; A.B.-C., D.J.M., and C.C.H. performed experiments; A.B.-C., D.J.M., C.C.H., and P.T. analyzed data; A.B.-C., D.J.M., A.J.S., and P.T. interpreted results of experiments; A.B.-C. and D.J.M. prepared figures; A.B.-C., D.J.M., and P.T. drafted manuscript; A.B.-C., D.J.M., C.C.H., A.J.S., and P.T. edited and revised manuscript; A.B.-C., D.J.M., C.C.H., A.J.S., and P.T. approved final version of manuscript.
REFERENCES
- 1.Barber AE, Norton JP, Wiles TJ, Mulvey MA. Strengths and limitations of model systems for the study of urinary tract infections and related pathologies. Microbiol Mol Biol Rev 80: 351–367, 2016. doi: 10.1128/MMBR.00067-15. [DOI] [PMC free article] [PubMed] [Google Scholar]
- 2.Bauman TM, Nicholson TM, Abler LL, Eliceiri KW, Huang W, Vezina CM, Ricke WA. Characterization of fibrillar collagens and extracellular matrix of glandular benign prostatic hyperplasia nodules. PLoS One 9: e109102, 2014. doi: 10.1371/journal.pone.0109102. [DOI] [PMC free article] [PubMed] [Google Scholar]
- 3.Cantiello F, Cicione A, Salonia A, Autorino R, Tucci L, Madeo I, Damiano R. Periurethral fibrosis secondary to prostatic inflammation causing lower urinary tract symptoms: a prospective cohort study. Urology 81: 1018–1024, 2013. doi: 10.1016/j.urology.2013.01.053. [DOI] [PubMed] [Google Scholar]
- 4.Darby I, Skalli O, Gabbiani G. Alpha-smooth muscle actin is transiently expressed by myofibroblasts during experimental wound healing. Lab Invest 63: 21–29, 1990. [PubMed] [Google Scholar]
- 5.Darnell SE, Hall TL, Tomlins SA, Cheng X, Ives KA, Roberts WW. Histotripsy of the prostate in a canine model: characterization of post-therapy inflammation and fibrosis. J Endourol 29: 810–815, 2015. doi: 10.1089/end.2014.0585. [DOI] [PMC free article] [PubMed] [Google Scholar]
- 6.Drake MJ, Morris N, Apostolidis A, Rahnama’i MS, Marchesi JR. The urinary microbiome and its contribution to lower urinary tract symptoms; ICI-RS 2015. Neurourol Urodyn 36: 850–853, 2017. doi: 10.1002/nau.23006. [DOI] [PubMed] [Google Scholar]
- 7.Gao Q, Li Y, Li M. The potential role of IL-33/ST2 signaling in fibrotic diseases. J Leukoc Biol 98: 15–22, 2015. doi: 10.1189/jlb.3RU0115-012R. [DOI] [PubMed] [Google Scholar]
- 8.Gharaee-Kermani M, Kasina S, Moore BB, Thomas D, Mehra R, Macoska JA. CXC-type chemokines promote myofibroblast phenoconversion and prostatic fibrosis. PLoS One 7: e49278, 2012. doi: 10.1371/journal.pone.0049278. [DOI] [PMC free article] [PubMed] [Google Scholar]
- 9.Gharaee-Kermani M, Moore BB, Macoska JA. Resveratrol-mediated repression and reversion of prostatic myofibroblast phenoconversion. PLoS One 11: e0158357, 2016. doi: 10.1371/journal.pone.0158357. [DOI] [PMC free article] [PubMed] [Google Scholar]
- 10.Greer T, Hao L, Nechyporenko A, Lee S, Vezina CM, Ricke WA, Marker PC, Bjorling DE, Bushman W, Li L. Custom 4-Plex DiLeu isobaric labels enable relative quantification of urinary proteins in men with lower urinary tract symptoms (LUTS). PLoS One 10: e0135415, 2015. doi: 10.1371/journal.pone.0135415. [DOI] [PMC free article] [PubMed] [Google Scholar]
- 11.Hansson S, Hjälmås K, Jodal U, Sixt R. Lower urinary tract dysfunction in girls with untreated asymptomatic or covert bacteriuria. J Urol 143: 333–335, 1990. doi: 10.1016/S0022-5347(17)39951-2. [DOI] [PubMed] [Google Scholar]
- 12.Hao L, Greer T, Page D, Shi Y, Vezina CM, Macoska JA, Marker PC, Bjorling DE, Bushman W, Ricke WA, Li L. In-depth characterization and validation of human urine metabolomes reveal novel metabolic signatures of lower urinary tract symptoms. Sci Rep 6: 30869, 2016. doi: 10.1038/srep30869. [DOI] [PMC free article] [PubMed] [Google Scholar]
- 13.Hashimoto K, Sheller JR, Morrow JD, Collins RD, Goleniewska K, O’Neal J, Zhou W, Ji S, Mitchell DB, Graham BS, Peebles RS Jr. Cyclooxygenase inhibition augments allergic inflammation through CD4-dependent, STAT6-independent mechanisms. J Immunol 174: 525–532, 2005. doi: 10.4049/jimmunol.174.1.525. [DOI] [PubMed] [Google Scholar]
- 14.Heesakkers J, Farag F, Bauer RM, Sandhu J, De Ridder D, Stenzl A. Pathophysiology and contributing factors in postprostatectomy incontinence: a review. Eur Urol 71: 936–944, 2017. doi: 10.1016/j.eururo.2016.09.031. [DOI] [PubMed] [Google Scholar]
- 15.Irwin DE, Kopp ZS, Agatep B, Milsom I, Abrams P. Worldwide prevalence estimates of lower urinary tract symptoms, overactive bladder, urinary incontinence and bladder outlet obstruction. BJU Int 108: 1132–1138, 2011. doi: 10.1111/j.1464-410X.2010.09993.x. [DOI] [PubMed] [Google Scholar]
- 16.Kaplan MH, Schindler U, Smiley ST, Grusby MJ. Stat6 is required for mediating responses to IL-4 and for development of Th2 cells. Immunity 4: 313–319, 1996. doi: 10.1016/S1074-7613(00)80439-2. [DOI] [PubMed] [Google Scholar]
- 17.Kaviratne M, Hesse M, Leusink M, Cheever AW, Davies SJ, McKerrow JH, Wakefield LM, Letterio JJ, Wynn TA. IL-13 activates a mechanism of tissue fibrosis that is completely TGF-beta independent. J Immunol 173: 4020–4029, 2004. doi: 10.4049/jimmunol.173.6.4020. [DOI] [PubMed] [Google Scholar]
- 18.Lala V, Minter DA. Acute Cystitis. Treasure Island, FL: StatPearls, 2017. [Google Scholar]
- 19.Liu Y, Meyer C, Müller A, Herweck F, Li Q, Müllenbach R, Mertens PR, Dooley S, Weng HL. IL-13 induces connective tissue growth factor in rat hepatic stellate cells via TGF-β-independent Smad signaling. J Immunol 187: 2814–2823, 2011. doi: 10.4049/jimmunol.1003260. [DOI] [PubMed] [Google Scholar]
- 20.Lott JM, Sumpter TL, Turnquist HR. New dog and new tricks: evolving roles for IL-33 in type 2 immunity. J Leukoc Biol 97: 1037–1048, 2015. doi: 10.1189/jlb.3RI1214-595R. [DOI] [PubMed] [Google Scholar]
- 21.Ma J, Gharaee-Kermani M, Kunju L, Hollingsworth JM, Adler J, Arruda EM, Macoska JA. Prostatic fibrosis is associated with lower urinary tract symptoms. J Urol 188: 1375–1381, 2012. doi: 10.1016/j.juro.2012.06.007. [DOI] [PMC free article] [PubMed] [Google Scholar]
- 22.May RD, Fung M. Strategies targeting the IL-4/IL-13 axes in disease. Cytokine 75: 89–116, 2015. doi: 10.1016/j.cyto.2015.05.018. [DOI] [PubMed] [Google Scholar]
- 23.Mishra PP, Prakash V, Singh K, Mog H, Agarwal S. Bacteriological profile of isolates from urine samples in patients of benign prostatic hyperplasia and or prostatitis showing lower urinary tract symptoms. J Clin Diagn Res 10: DC16–DC18, 2016. doi: 10.7860/JCDR/2016/21973.8734. [DOI] [PMC free article] [PubMed] [Google Scholar]
- 24.Nickel JC, True LD, Krieger JN, Berger RE, Boag AH, Young ID. Consensus development of a histopathological classification system for chronic prostatic inflammation. BJU Int 87: 797–805, 2001. doi: 10.1046/j.1464-410x.2001.02193.x. [DOI] [PubMed] [Google Scholar]
- 25.Quick ML, Wong L, Mukherjee S, Done JD, Schaeffer AJ, Thumbikat P. Th1-Th17 cells contribute to the development of uropathogenic Escherichia coli-induced chronic pelvic pain. PLoS One 8: e60987, 2013. doi: 10.1371/journal.pone.0060987. [DOI] [PMC free article] [PubMed] [Google Scholar]
- 26.Rodriguez-Nieves JA, Macoska JA. Prostatic fibrosis, lower urinary tract symptoms, and BPH. Nat Rev Urol 10: 546–550, 2013. doi: 10.1038/nrurol.2013.149. [DOI] [PMC free article] [PubMed] [Google Scholar]
- 27.Roman K, Murphy SF, Done JD, McKenna KE, Schaeffer AJ, Thumbikat P. Role of PAR2 in the development of lower urinary tract dysfunction. J Urol 196: 588–598, 2016. doi: 10.1016/j.juro.2016.01.106. [DOI] [PMC free article] [PubMed] [Google Scholar]
- 28.Roy SG, Nozaki Y, Phan SH. Regulation of alpha-smooth muscle actin gene expression in myofibroblast differentiation from rat lung fibroblasts. Int J Biochem Cell Biol 33: 723–734, 2001. doi: 10.1016/S1357-2725(01)00041-3. [DOI] [PubMed] [Google Scholar]
- 29.Rudick CN, Berry RE, Johnson JR, Johnston B, Klumpp DJ, Schaeffer AJ, Thumbikat P. Uropathogenic Escherichia coli induces chronic pelvic pain. Infect Immun 79: 628–635, 2011. doi: 10.1128/IAI.00910-10. [DOI] [PMC free article] [PubMed] [Google Scholar]
- 30.Sahin H, Wasmuth HE. Chemokines in tissue fibrosis. Biochim Biophys Acta 1832: 1041–1048, 2013. doi: 10.1016/j.bbadis.2012.11.004. [DOI] [PubMed] [Google Scholar]
- 31.Wong L, Hutson PR, Bushman W. Prostatic inflammation induces fibrosis in a mouse model of chronic bacterial infection. PLoS One 9: e100770, 2014. doi: 10.1371/journal.pone.0100770. [DOI] [PMC free article] [PubMed] [Google Scholar]
- 32.Wong L, Hutson PR, Bushman W. Resolution of chronic bacterial-induced prostatic inflammation reverses established fibrosis. Prostate 75: 23–32, 2015. doi: 10.1002/pros.22886. [DOI] [PMC free article] [PubMed] [Google Scholar]
- 33.Wyndaele JJ, Gammie A, Bruschini H, De Wachter S, Fry CH, Jabr RI, Kirschner-Hermanns R, Madersbacher H. Bladder compliance what does it represent: can we measure it, and is it clinically relevant? Neurourol Urodyn 30: 714–722, 2011. doi: 10.1002/nau.21129. [DOI] [PubMed] [Google Scholar]
- 34.Wynn TA. Type 2 cytokines: mechanisms and therapeutic strategies. Nat Rev Immunol 15: 271–282, 2015. doi: 10.1038/nri3831. [DOI] [PubMed] [Google Scholar]
- 35.Wynn TA, Ramalingam TR. Mechanisms of fibrosis: therapeutic translation for fibrotic disease. Nat Med 18: 1028–1040, 2012. doi: 10.1038/nm.2807. [DOI] [PMC free article] [PubMed] [Google Scholar]


