Abstract
Objectives:
The purpose of this study was to 1) evaluate proton density fat fraction (PDFF) distribution across liver segments at baseline and 2) compare longitudinal segmental PDFF changes across time points in adult patients undergoing a very low-calorie diet (VLCD) and subsequent bariatric weight loss surgery (WLS).
Methods:
We performed a secondary analysis of data from 118 morbidly obese adult patients enrolled in a VLCD-WLS program. PDFF was estimated using magnitude-based confounder-corrected chemical-shift-encoded (CSE) MRI in each hepatic segment and lobe at baseline (visit 1), after completion of VLCD (visit 2), and at 1, 3, and 6 months (visits 3–5) following WLS. Linear regressions were used to estimate the rate of PDFF change across visits. Lobar and segmental rates of change were compared pairwise.
Results:
Baseline PDFF was significantly higher in the right lobe compared to the left lobe (p <0.0001). Lobar and segmental PDFF declined by 3.9–4.5% per month between visits 1 and 2 (preoperative period) and by 4.3–4.8% per month between visits 1 and 3 (perioperative), but no significant pairwise differences were found in slope between segments and lobes. For visits 3–5 (postoperative period), lobar and segmental PDFF reduction was much less overall (0.4–0.8% PDFF per month) and several pairwise differences were significant; in each case a right-lobe segment had greater decline than a left-lobe segment.
Conclusions:
Baseline and longitudinal changes in fractional fat content in the 5-month postoperative period following WLS vary across segments, with right-lobe segments having higher PDFF at baseline and more rapid reduction in liver fat content.
Keywords: Fatty liver, bariatric surgery, magnetic resonance imaging
Introduction
Nonalcoholic fatty liver disease (NAFLD) is the hepatic manifestation of metabolic syndrome and is quickly becoming a global epidemic [1]. Increasing prevalence of NAFLD reflects the increasing prevalence of obesity and type 2 diabetes [2]. NAFLD is the leading cause of chronic liver disease (CLD) in developed countries [3, 4], accounting for nearly three quarters of CLD cases in the United States [5]. A subset of patients with NAFLD will progress to steatohepatitis and cirrhosis, with concomitant risk of hepatocellular carcinoma and liver-related mortality. Interventions aimed at weight loss, such as restrictive diets and bariatric surgery, are recommended treatments for NAFLD [6, 7]. NAFLD alone is not an indication for bariatric surgery, in part because the natural history of steatosis reduction and resolution of NAFLD following intervention is not well known.
An accurate biomarker of hepatic steatosis is essential for detecting and monitoring response of NAFLD in the course of weight loss intervention. MRI-derived proton density fat fraction (PDFF) is an established non-invasive quantitative biomarker of liver fat that depicts both the degree and distribution of steatosis throughout the liver segments [8]. PDFF has been validated as a biomarker against spectroscopy and pathology, and across vendors/sites in both single and multi-center controlled environments [9]. PDFF is particularly advantageous for assessing treatment response in clinical and research studies as its non-invasive nature allows frequent assessment. Likewise, PDFF accurately depicts fat distribution in the whole liver rather than a small tissue or voxel sample provided by other methods, allowing robust comparison between liver segments and across time points [10]. This is of particular interest as the distribution of liver fat in NAFLD may not be uniform [11, 12]. In a cohort of 50 adults with biopsy proven NAFLD, Bonekamp et al. [11] reported small but significant differences in PDFF between liver lobes as well as between certain segments. Heterogeneous steatosis may result in quantification sampling error by methods that do not provide whole liver assessment of fat, potentially leading to inaccurate assessment of disease progression or regression over time. However, the implications and potential impact on monitoring treatment outcomes and natural history have not previously been studied.
The purpose of this study was to 1) evaluate PDFF fat distribution across segments at baseline and 2) compare longitudinal segmental PDFF changes across time points in adult patients undergoing a very low-calorie diet and subsequent bariatric surgery intervention, to better understand the natural history of NAFLD response to intervention.
Materials and Methods
Study Design and Subjects
This was a secondary cross-sectional and longitudinal analysis of MRI-PDFF data collected as part of a prospective study of dietary and surgical intervention for severe obesity performed at two academic weight loss surgery (WLS) centers. Both centers had similar weight loss programs comprising 2–4 weeks of very low-calorie diet (VLCD, 600–900 calories/day) followed by WLS. Both this secondary analysis and the parent study were approved by an Investigational Review Board and compliant with the Health Insurance Portability and Accountability Act.
For the parent study, severely obese bariatric patients were recruited consecutively from the two centers from October 2010 - December 2015. Inclusion criteria were body mass index (BMI) ≥ 35 kg/m2, being considered for laparoscopic WLS (gastric band, bypass, or sleeve), and willingness to participate in all study procedures. Exclusion criteria were contraindications for MR imaging, history of liver disease other than NAFLD, or inability to fit in the scanner. PDFF was measured at 5 separate MRI visits: baseline (visit 1), immediately after completion of VLCD (visit 2), and 1, 3, and 6 months (visits 3–5) after WLS. If a patient was already started on the VLCD prior to study recruitment, visit 1 was skipped. At the time of WLS, liver biopsy was performed and only patients with intraoperative biopsy-proven NAFLD were offered follow-up MRI (visits 3–5). Patient demographic, clinical, and body metric information was collected throughout the study.
For the secondary analysis, patients were further excluded if magnitude-based chemical-shift-encoded MRI was not performed on at least one visit.
MRI Examinations
Patients were imaged using clinical 1.5T and 3T MRI systems (SIGNA HDxt, MR750, and MR450W, GE Healthcare). MR examinations were performed with patients in supine position with a multi-channel torso phased-array coil centered over the liver. PDFF was estimated using a magnitude-based confounder-corrected chemical-shift-encoded MRI (CSE-MRI) [13, 14] in each liver segment. Two-dimensional (2D) multi-echo (ME) spoiled gradient-recalled echo (SPGR) magnitude-based images were acquired through the entire liver in one or two ~20s breath-holds. A low flip angle of 10° with a repetition time of 150ms or longer was used to minimize T1 bias [13, 15]. Six echoes were obtained per repetition time (TR) at nominally outof-phase and in-phase echo times (TEs) in order to measure the fat fraction while simultaneously correcting for R2* signal decay [15]. The rectangular field of view was adjusted to the patient’s body habitus and breath-hold capacity. MR parameters are summarized in Table 1.
Table 1.
MRI parameters
| Parameter | Values |
|---|---|
| Repetition time (ms) | ≥150 |
| Echo times (ms) | 1.15, 2.3, 3.45, 4.6, 5.75, 6.9 |
| Flip angle (degrees) | 10 |
| Receiver bandwidth (kHz) | 142 |
| Number of echoes | 6 |
| Matrix | 224 × 128 |
| Field of view (cm) | 44 × 44 |
| Slice thickness (mm) | 8 |
| Parallel imaging acceleration factor | 1.25 in phase encoding direction |
| Number of slices per breath-hold | ~20 |
Image Processing and Analysis
Using MATLAB (MathWorks), a fitting algorithm described by Bydder et al. [15], which incorporates a MRS-derived liver fat spectral model [16] to account for the multi-peak nature of fat, was applied pixel by pixel to the magnitude source images to generate parametric PDFF maps. Using OsiriX software version 7.0.3 (OsiriX Foundation), source images and PDFF maps were reviewed by trained image analysts (with at least 1 year of experience) blinded to all clinical and demographic data. For each subject, a 1-cm radius circular ROI was placed manually in the center of each Couinaud liver segment on the fifth-echo sequence (Supplemental Figure 1), which provided appropriate anatomic detail to avoid liver boundaries, artifacts, major vessels, and bile ducts. The ROIs were then propagated to the PDFF maps and the mean PDFF value and the standard deviation were obtained for each segment. Lobar PDFF values were then calculated by averaging the PDFFs in the segments of that lobe (segments 1, 2, 3, 4a, and 4b for the left and segments 5, 6, 7, and 8 for the right lobes). The same process was performed for each patient and each time point.
Statistical Analysis
All statistical analyses were performed by a staff statistician under the supervision of a faculty statistician (both with over twenty years of experience), using R version 3.3.1 (2016, GNU Public License, R Foundation for Statistical Computing). Descriptive statistics were used to summarize demographic and clinical information as well as segmental and lobar PDFF values for each visit. A linear regression model with a random (subject-specific) intercept was used to estimate the slope of time-dependent PDFF decline separately for the preoperative period (by analyzing patients with MRI data at visits 1 and 2), the perioperative period (by analyzing patients with MRI data at visits 1 and 3, 2 and 3, or 1, 2, and 3), and the postoperative period by analyzing patients with MRI data at visits 3 and 4, 3 and 5, or 3, 4, and 5). Separate modeling of the different time periods was performed because of the non-linear overall change in PDFF: there was a sharp decline during the pre- and perioperative periods and a more gradual decline in the postoperative period. For each time period, the PDFF-decline slopes for all segments and both lobes were compared pairwise using bootstrap-based tests; Bonferroni adjustment was applied for the 36 pairwise segmental comparisons: p-values less than 0.00139 (=0.05/36) were considered significant at family-wise 0.05 error rate.
Results
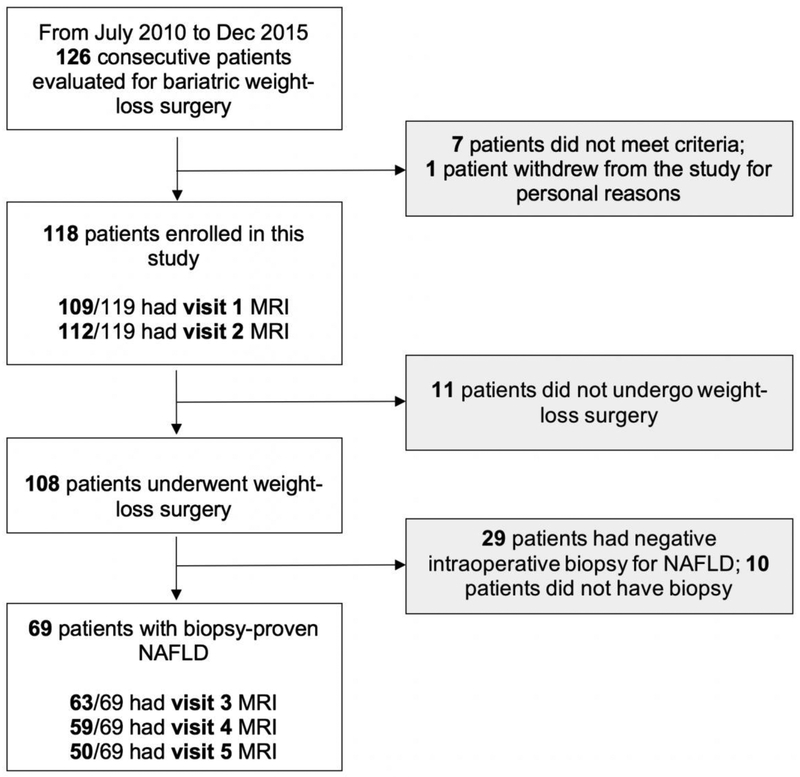
Of the 126 patients evaluated for bariatric WLS at the two centers during the study period, 118 patients met criteria and were enrolled (55 from center 1; 102 females; mean age, 48.0 ± 13.0 years; mean BMI, 43.4 ± 6.2 kg/m2). WLS was performed in 108 patients, of whom 69 had intraoperative biopsy-proven NAFLD and were offered follow-up post-operative MRI. Flow diagram of the study cohort is shown in Figure 1. One hundred and nine patients had MRI at visit 1 and 112 at visit 2. Three patients were included in the study after initiation of the very low-calorie diet and therefore did not have visit 1 MRI. Based on intraoperative biopsy, 69 of the 112 patients had biopsy-proven NAFLD. Of the 69, 63 had MRI at visit 3, 59 at visit 4, and 50 at visit 5. All 50 patients with a visit 5 MRI also had MRI at visits 1–4.
Figure 1: Flow Diagram of Study Cohort.
Missing patients for each visit were due to missed or declined MRI, or inadequate MRI due to technical failure or imaging artifact.
NAFLD, nonalcoholic fatty liver disease.
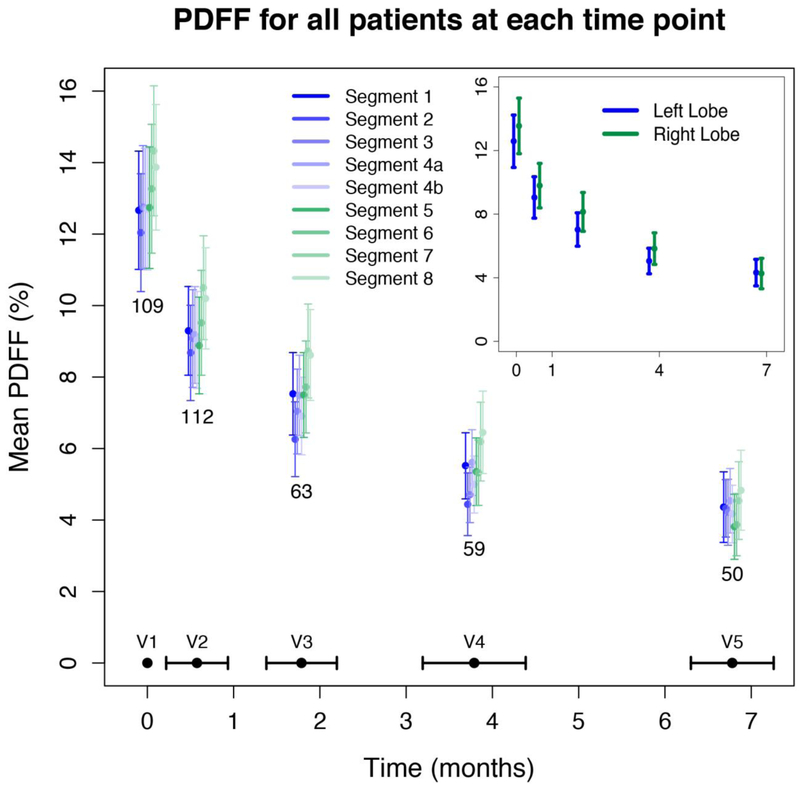
Figure 2 illustrates the mean PDFF by liver segment and visit number for all patients that underwent MRI at each visit (corresponding values are summarized in Supplemental Table 1). At baseline, liver segments had mean PDFF values ranging from 12.0–14.3%. The baseline mean PDFF was significantly higher in the right lobe than the left (13.6% ± 9.3 vs. 12.6% ± 8.7, p <0.0001). Segment 7 nominally had the highest fat content, and segment 2 the lowest. Mean PDFF values declined in all segments and both liver lobes with normalization of mean PDFF values (range 3.8–4.8%) following VLCD and WLS. Although not statistically significant, the PDFF within the right lobe (mean 4.2%) was lower than the left lobe (mean 4.3%) by visit 5.
Figure 2. Mean PDFF by liver segment and by time for all available data.
The average time in months for each visit was as follows: visit 2 (V2) at 0.6 ± 0.4, visit 3 (V3) at 1.8 ± 0.4, visit 4 (V4) at 3.8 ± 0.6, and visit 5 (V5) at 6.8 ± 0.5.
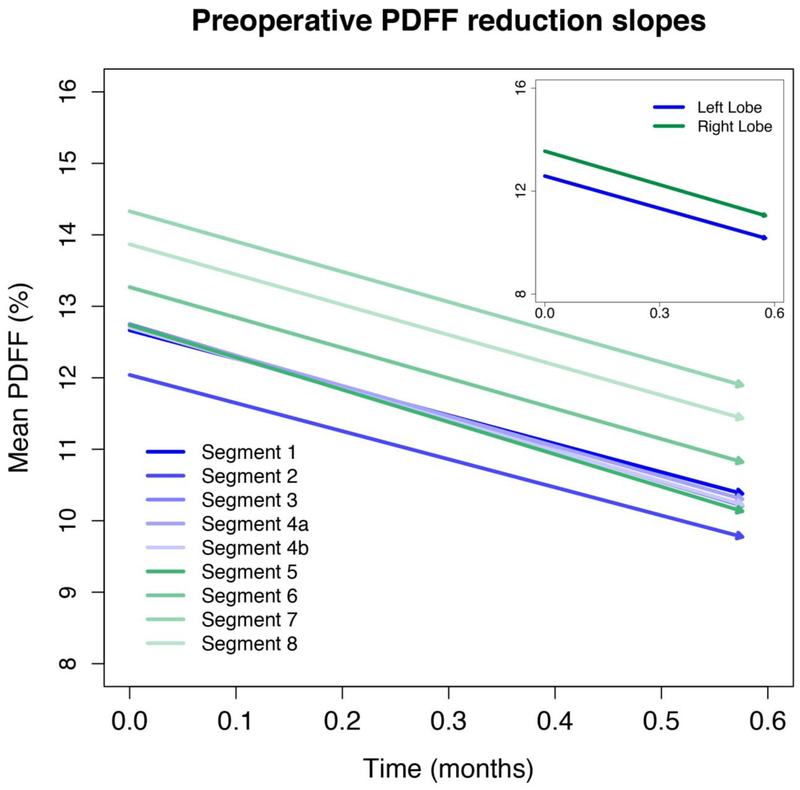
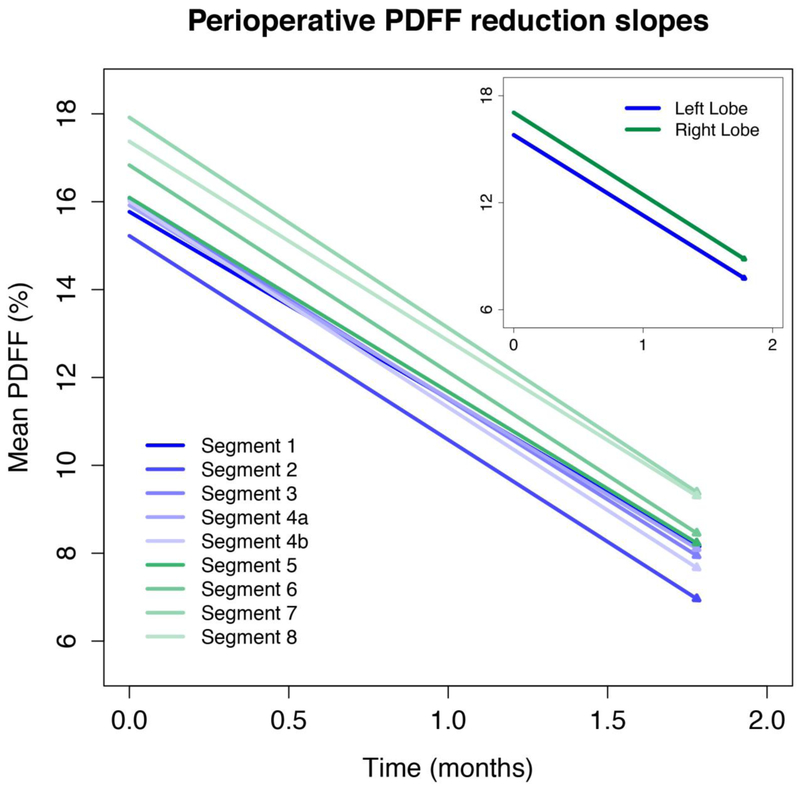
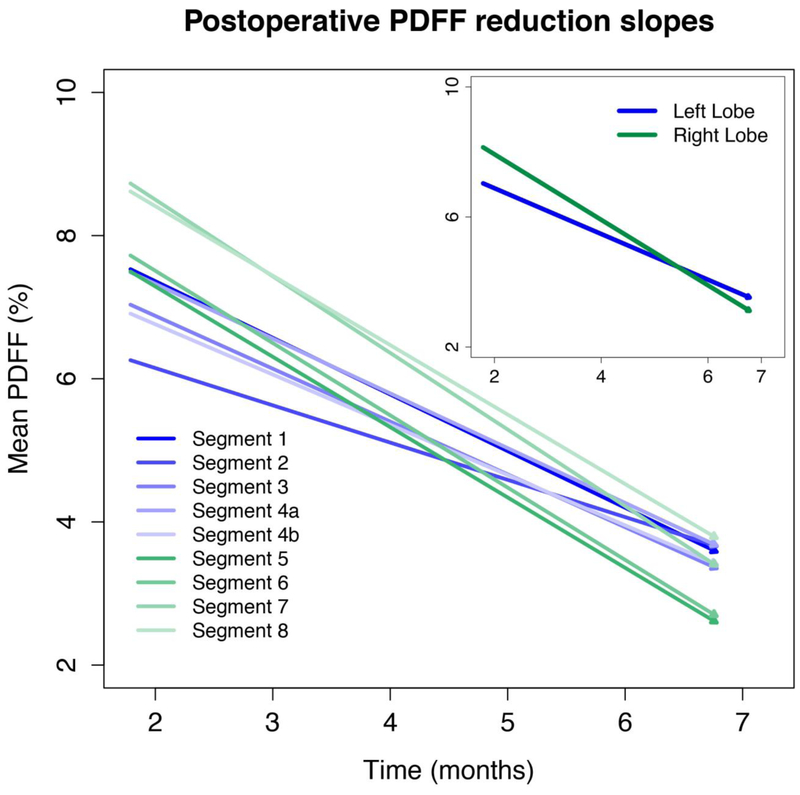
Figure 3, 4, and 5 illustrate the longitudinal PDFF reduction rates in the preoperative, perioperative, and postoperative periods, respectively (corresponding values are summarized in Supplemental Table 2). Lobar and segmental PDFF rapidly declined in the preoperative (by 4.2–4.4% and 3.9–4.5% per month) and perioperative (by 4.5–4.6% and 4.3–4.8% per month) periods. The slopes were parallel (Figure 3 and 4) and there were no significant pairwise differences in slope between the segments or lobes.
Figure 3. Preoperative PDFF reduction slopes.
The slopes are parallel. No significant pairwise differences were found in slope between the segments or lobes.
Figure 4. Perioperative PDFF reduction slopes.
The slopes are parallel. No significant pairwise differences were found in slope between the segments or lobes.
Figure 5. Postoperative PDFF reduction slopes.
Slopes are not parallel with right-lobe segments tending to have more rapid decline.
In the postoperative period, lobar and segmental PDFF reduction slowed (0.5–0.7% PDFF per month and 0.4–0.8% PDFF per month) for all segments. Unlike the preoperative and perioperative period, slopes were not parallel with right-lobe segments tending to have more rapid decline (Figure 5). Eight of the 36 pairwise comparisons between segments were statistically significant; in each case, a right-lobe segment had more rapid PDFF decline than a left-lobe segment (all with p< 0.00138) (Table 2). Similarly, the right lobe overall had a more rapid decline than the left lobe. (p <0.0001)
Table 2.
Statistically significant pairwise segment comparisons
| Pairwise comparisons | Difference in the rate of PDFF decline (95% CI) |
|---|---|
| Segment 5 – Segment 2 | 0.34 (0.11–0.58) |
| Segment 5 – Segment 4b | 0.21 (0.03–0.44) |
| Segment 6 – Segment 2 | 0.36 (0.12–0.57) |
| Segment 6 – Segment 4b | 0.23 (0.04–0.48) |
| Segment 7 – Segment 2 | 0.41 (0.06–0.68) |
| Segment 7 – Segment 3 | 0.25 (0.04–0.48) |
| Segment 7 – Segment 4b | 0.27 (0.02–0.51) |
| Segment 8 – Segment 4b | 0.20 (0.04–0.39) |
| Right lobe – Left lobe | 0.22 (0.11–0.34) |
PDFF, proton density fat fraction; CI, confidence interval; p-values less than 0.00138 were considered significant at family-wise 0.05 error rate.
Longitudinal changes in right and left lobes are illustrated on PDFF parametric maps in a representative patient in Figure 6.
Figure 6. Sample PDFF maps in a 61-year-old female patient.
Estimated mean PDFF values for the left and right lobes are shown for each visit. A PDFF scale bar is provided.
Discussion
We performed a prospective cross-sectional and longitudinal study in severely obese bariatric adult patients using PDFF as a non-invasive, objective, and quantitative biomarker of liver fat content. At baseline, the right lobe had significantly higher fat content than the left lobe and individual right-lobe segments tended to have higher fat content than individual left-lobe segments. Longitudinally, the right lobe had more rapid fat reduction than the left lobe in the postoperative period. Additionally, individual right-lobe segments tended to have more rapid reductions in the postoperative period than individual left-lobe segments. By comparison, rates of fat reduction were not significantly different between lobes or segments in the pre- or perioperative periods.
The baseline nonuniformity in fat distribution observed in our study is similar to that in prior cross-sectional studies [11, 12]. In a study of adults with biopsy-proven NAFLD, Bonekamp et al [11] found that the right lobe (mean PDFF = 16.5%) had 0.8% higher fat content than the left lobe (mean PDFF = 15.7%) and that segments 6, 7, and 8 (mean PDFFs ranging from 16.6 to 16.7%) had 1.8 to 1.9% higher fat contents than segment 2. The differences between lobes and segments in our study help to validate these previously reported observations. Although small, the differences between lobes and segments are likely to be real, since differences in PDFF values more than 1.7% have been shown to reflect biological differences rather than measurement variability [12]. While the MRI systems and magnetic field strengths used in our study were variable among different exams and patients, it has been shown that liver MR-PDFF can be measured with excellent linearity, negligible bias, and high precision by using different imager manufacturers and field strengths [17].
In addition to baseline distribution, we assessed longitudinal changes in PDFF for each liver segment and lobe over time to further understand the relationship between distribution and PDFF reduction following intervention. A rapid rate of reduction in lobar and segmental PDFF was observed during the pre- and perioperative period (ranging 3.9–4.5 % and 4.3–4.8 % PDFF reduction per month, respectively). When considering the regional distribution of PDFF change, despite higher baseline PDFF in the right lobe, there was no significant difference in rate of reduction between the right and left lobes or segments during the pre- or perioperative periods. Slower rates of reduction in segmental and lobar PDFF (ranging 0.4–0.8 %PDFF reduction per month) were observed during the postoperative period. Interestingly, during the postoperative period, the right lobe demonstrated significantly greater rate of PDFF decline than left-lobe, even dropping to lower mean values at the final time point.
The regional differences in PDFF and reduction rates are of unclear significance. Previous studies have suggested that differences in regional portal venous perfusion may be responsible for the heterogeneous distribution of liver fat [11, 18]. Bonekamp et al. [11] speculated that different contributions of mesenteric vs. splenic blood to different liver segments may explain this observation. Similarly, differences in regional perfusion may explain observed differences in the rate of PDFF reduction over time between liver segments. However, further studies are needed to explore and verify the underlying physiology. Likewise, the explanation for the parallel reduction rates during the pre- and perioperative periods compared with the significantly different rates of fat reduction in the postoperative setting are not fully explained in the current study.
Regardless of the underlying pathophysiology, our findings suggest that baseline values and longitudinal changes in liver fat can be non-uniform, and thus methods that do not provide whole liver fat assessment, such as liver biopsy, may be unreliable in monitoring these changes. By estimating a composite PDFF across the whole liver, MRI may be more accurate than liver biopsy, which only samples fat content in a small part of the liver.
There are a number of limitations to our study. First, most patients in our study were women, which reflects the nationwide gender distribution among patients undergoing bariatric surgery [19]. Additionally, only about 40% of patients completed all 5 MRI exams. Also, our results reflect patients participating in a VLCD-WLS program and may not be generalizable to other weight loss interventions. While we detected interesting differences in distribution of and change in liver fat, further work is needed to better elucidate the underlying pathophysiology behind these observations.
Conclusion
We found small but statistically significant differences in longitudinal changes of fat content following WLS among liver segments. Overall, segments in the right lobe had more liver fat at baseline and in the postoperative period more rapid decline than segments in the left lobe. This heterogeneity highlights the importance of global liver assessment when monitoring longitudinal changes in hepatic fat content following interventions. Further research is needed to elucidate the biological mechanisms behind the heterogeneity of baseline and longitudinal fat loss in the liver.
Supplementary Material
Key points:
Baseline and longitudinal changes in liver fat following bariatric weight loss surgery vary across liver segments.
Methods that do not provide whole liver fat assessment, such as liver biopsy, may be unreliable in monitoring longitudinal changes in liver fat following weight loss interventions.
Acknowledgements
We acknowledge NIH T32 EB005970–09, R01 DK083380, R01 DK088925, R01 DK100651, and K24 DK102595 grants, and GE Healthcare for providing research support.
Funding
This study has received funding from NIH T32 EB005970–09, R01 DK083380, R01 DK088925, R01 DK100651, and K24 DK102595 grants, and GE Healthcare.
Abbreviations:
- 2D
two-dimensional
- CLD
chronic liver disease
- CSE
chemical-shift-encoded
- ME
multi-echo
- NAFLD
nonalcoholic fatty liver disease
- PDFF
proton density fat fraction
- SPGR
spoiled gradient-recalled echo
- TE
echo time
- TR
repetition time
- VLCD
very low-calorie diet (VLCD)
- WLS
weight loss surgery
Footnotes
Compliance with Ethical Standards
Guarantor:
The scientific guarantor of this publication is Claude B Sirlin.
Conflict of Interest:
Claude Sirlin has received grants from Gilead, GE Healthcare, Siemens, GE MRI, Bayer, GE Digital, GE Ultrasound, ACR Innovation, and Philips. He also is a consultant for GE Healthcare, Bayer, Boehringer Ingelheim, AMRA, and Fulcrum, and is on advisory board for AMRA, Guerbet, and VirtualScopics.
The remaining authors of this manuscript has no conflict of interest to declare.
Statistics and Biometry:
All statistical analyses were performed by a staff statistician (Tanya Wolfson) under the supervision of a faculty statistician (Anthony Gamst) from University of California San Diego who are both co-authors of this paper and have over twenty years of experience.
Informed Consent:
Written informed consent was obtained from all subjects (patients) in this study.
Ethical Approval:
Institutional Review Board approval was obtained.
Study subjects or cohorts overlap:
The cohort of a recent study by Luo et al. published in Surgical Endoscopy, although not entirely identical, quite overlaps with our cohort. This paper was published in a surgical journal by the surgical team involved in this research. In contrast to our study, Luo et al. assess changes in liver volume and total liver fat rather than assessing and comparing segmental liver fat. They have also included data from complex-based MR exams, whereas in our study, only magnitude-based MR examination were included.
- prospective
- diagnostic or prognostic study
- multicenter study
References
- 1.Loomba R, Sanyal AJ (2013) The global NAFLD epidemic. Nat Rev Gastroenterol Hepatol 10:686–690 [DOI] [PubMed] [Google Scholar]
- 2.Eguchi Y, Hyogo H, Ono M, et al. (2012) Prevalence and associated metabolic factors of nonalcoholic fatty liver disease in the general population from 2009 to 2010 in Japan: a multicenter large retrospective study. J Gastroenterol 47:586–595 [DOI] [PubMed] [Google Scholar]
- 3.Lazo M, Clark J (2008) The Epidemiology of Nonalcoholic Fatty Liver Disease: A Global Perspective. Semin Liver Dis 28:339–350 [DOI] [PubMed] [Google Scholar]
- 4.Hannah WN, Torres DM, Harrison SA, Harrison SA (2016) Nonalcoholic Steatohepatitis and Endpoints in Clinical Trials. Gastroenterol Hepatol (N Y) 12:756–763 [PMC free article] [PubMed] [Google Scholar]
- 5.Younossi ZM, Stepanova M, Afendy M, et al. (2011) Changes in the Prevalence of the Most Common Causes of Chronic Liver Diseases in the United States From 1988 to 2008. Clin Gastroenterol Hepatol 9:524–530.e1 [DOI] [PubMed] [Google Scholar]
- 6.Torres DM, Harrison SA (2008) Diagnosis and therapy of nonalcoholic steatohepatitis. Gastroenterology 134:1682–98 [DOI] [PubMed] [Google Scholar]
- 7.Dixon JB, Bhathal PS, Hughes NR, O’Brien PE (2004) Nonalcoholic fatty liver disease: Improvement in liver histological analysis with weight loss. Hepatology 39:1647–1654 [DOI] [PubMed] [Google Scholar]
- 8.Tang A, Tan J, Sun M, et al. (2013) Nonalcoholic Fatty Liver Disease: MR Imaging of Liver Proton Density Fat Fraction to Assess Hepatic Steatosis. Radiology 267:422. [DOI] [PMC free article] [PubMed] [Google Scholar]
- 9.Middleton MS, Heba ER, Hooker CA, et al. (2017) Agreement Between Magnetic Resonance Imaging Proton Density Fat Fraction Measurements and Pathologist-Assigned Steatosis Grades of Liver Biopsies From Adults With Nonalcoholic Steatohepatitis. Gastroenterology 153:753–761 [DOI] [PMC free article] [PubMed] [Google Scholar]
- 10.Le TA, Chen J, Changchien C, et al. (2012) Effect of colesevelam on liver fat quantified by magnetic resonance in nonalcoholic steatohepatitis: A randomized controlled trial. Hepatology 56:922–932 [DOI] [PMC free article] [PubMed] [Google Scholar]
- 11.Bonekamp S, Tang A, Mashhood A, et al. (2014) Spatial distribution of MRI-Determined hepatic proton density fat fraction in adults with nonalcoholic fatty liver disease. J Magn Reson Imaging 39:1525–32 [DOI] [PMC free article] [PubMed] [Google Scholar]
- 12.Sofue K, Mileto A, Dale BM, et al. (2015) Interexamination repeatability and spatial heterogeneity of liver iron and fat quantification using MRI-based multistep adaptive fitting algorithm. J Magn Reson Imaging 42:1281–1290 [DOI] [PubMed] [Google Scholar]
- 13.Reeder SB, Cruite I, Hamilton G, Sirlin CB (2011) Quantitative Assessment of Liver Fat with Magnetic Resonance Imaging and Spectroscopy. J Magn Reson Imaging 34:spcone [DOI] [PMC free article] [PubMed] [Google Scholar]
- 14.Reeder SB, Hu HH, Sirlin CB (2012) Proton density fat-fraction: A standardized mr-based biomarker of tissue fat concentration. J Magn Reson Imaging 36:1011–1014 [DOI] [PMC free article] [PubMed] [Google Scholar]
- 15.Bydder M, Yokoo T, Hamilton G, et al. (2008) Relaxation effects in the quantification of fat using gradient echo imaging. Magn Reson Imaging 26:347–359 [DOI] [PMC free article] [PubMed] [Google Scholar]
- 16.Hamilton G, Yokoo T, Bydder M, et al. (2011) In vivo characterization of the liver fat 1H MR spectrum. NMR Biomed 24:784–90 [DOI] [PMC free article] [PubMed] [Google Scholar]
- 17.Yokoo T, Serai SD, Pirasteh A, et al. (2018) Linearity, Bias, and Precision of Hepatic Proton Density Fat Fraction Measurements by Using MR Imaging: A Meta-Analysis. Radiology 286:486–498 [DOI] [PMC free article] [PubMed] [Google Scholar]
- 18.Copher GH, Dick BM (1928) “Stream line” phenomena in the portal vein and the selective distribution of portal blood in the liver. Arch Surg 17:408. [PMC free article] [PubMed] [Google Scholar]
- 19.Fuchs HF, Broderick RC, Harnsberger CR, et al. (2015) Benefits of Bariatric Surgery Do Not Reach Obese Men. J Laparoendosc Adv Surg Tech 25:196–201 [DOI] [PubMed] [Google Scholar]
Associated Data
This section collects any data citations, data availability statements, or supplementary materials included in this article.


