

Abstract
The mesolimbic dopamine (DA) circuitry determines which behaviors are positively reinforcing and therefore should be encoded in the memory to become a part of the behavioral repertoire. Natural reinforcers, like food and sex, activate this pathway, thereby increasing the likelihood of further consummatory, social, and sexual behaviors. Oxytocin (OT) has been implicated in mediating natural reward and OT-synthesizing neurons project to the ventral tegmental area (VTA) and nucleus accumbens (NAc); however, direct neuroanatomical evidence of OT regulation of DA neurons within the VTA is sparse. To phenotype OT-receptor (OTR) expressing neurons originating within the VTA, we delivered Creinducible adeno-associated virus that drives the expression of fluorescent marker into the VTA of male mice that had Cre-recombinase driven by OTR gene expression. OTR-expressing VTA neurons project to NAc, prefrontal cortex, the extended amygdala, and other forebrain regions but less than 10% of these OTR-expressing neurons were identified as DA neurons (defined by tyrosine hydroxylase colocalization). Instead, almost 50% of OTR-expressing cells in the VTA were glutamate (GLU) neurons, as indicated by expression of mRNA for the vesicular GLU transporter (vGluT). About one-third of OTR-expressing VTA neurons did not colocalize with either DA or GLU phenotypic markers. Thus, OTR expression by VTA neurons implicates that OT regulation of reward circuitry is more complex than a direct action on DA neurotransmission.
Keywords: ventral tegmental area, oxytocin receptors, nucleus accumbens, glutamate, dopamine, RRID: AB_11180326, RRID: AB_11180858, RRID:AB_1524535
The reward value of reinforcing actions, such as sexual behavior and pair bonding, is regulated by dopamine (DA) cell firing in the ventral tegmental area (VTA) and increased DA release in the nucleus accumbens (NAc) (see Gordon et al., 2011). Oxytocin (OT) neurons in the hypothalamic paraventricular and supraoptic nuclei send projections to the VTA and NAc (Sonfroniew, 1983; Otero-Garcia et al., 2015) and OT has been implicated as a mediator of socially rewarding behaviors and activity within mesolimbic circuitry (see Kovacs et al., 1998; Love, 2013; Sarnyai and Kovacs, 2014, for review). Receptor autoradiography in rats (Dumais et al., 2013) and other species (see Gimpl and Fahrenholz, 2001) has localized OT receptors (OTR) to both the VTA and NAc, and injection of OT into the VTA of rats increases DA release in NAc (Melis et al., 2007; Shahrokh et al., 2010). Although these findings imply that OTR functionally stimulate DA firing in mesolimbic pathways, the exact circuitry involved in OTR regulation of neuronal activity in these regions is not yet known.
The VTA is comprised of seven subregions containing DA neurons that were originally known as the A10 cell group (Fu et al., 2012, 2016). At the lateral extent are the parabrachial pigmented nucleus and the rostral VTA subregions (Fu et al., 2012). The parabrachial pigmented nucleus extends the full rostral-caudal length of the VTA, while the rostral VTA gives way to the medial parainterfascicular and paranigral nuclei in the posterior VTA (Fu et al., 2012; Sanchez-Catalan et al., 2014). Other subregions of the VTA cell group are the midline interfascicular, rostral linear, and caudal linear nuclei (Fu et al., 2012; Sanchez-Catalan et al., 2014). DA neurons in these midline areas project to different parts of the forebrain. DA neurons in the medial parabrachial pigmented and paranigral nuclei project to the medial prefrontal cortex (PFC), the medial shell of the NAc, and the basolateral amygdala (see Ikemoto, 2007; Lammel et al., 2014), whereas more lateral neurons in the parabrachial pigmented nucleus project to the lateral shell of the NAc (see Ikemoto, 2007; Lammel et al., 2014). This heterogeneity between anterior and posterior, lateral and medial DA neurons is thought to mediate different effects on reward and reinforcement-dependent learning (Schultz, 2010; Lammel et al., 2011, 2014; Sanchez-Catalan et al., 2014). Characterization of OTR activation of subpopulations of VTA neurons may lead to a better understanding of OT regulation of both natural and drug-related reward and reinforcement-dependent behaviors.
A significant proportion of VTA neurons use GABA or glutamate (GLU) as neurotransmitters instead of DA (see Yetnikoff et al., 2014). The GABA and GLU neurons within the VTA can be interneurons that make local connections with DA neurons (Omelchenko and Sesack, 2009; Dobi et al., 2010; Taylor et al., 2014), as well as projection neurons with efferent fibers terminating in distal brain nuclei, including the medial PFC, NAc, amygdala, lateral habenula, and ventral pallidum (Yamaguchi et al., 2011; Morales and Root, 2014; Taylor et al., 2014). GABA neurons tend to be concentrated in the lateral VTA subregions, while GLU neurons are concentrated in the medial nuclei (Yamaguchi et al., 2011; Taylor et al., 2014). Additionally, evidence from both immunolabeling and optogenetic experiments suggest that VTA neurons can express genetic markers for multiple neurotransmitters and regulate striatal pathways through the possible corelease of DA, GLU, and/or GABA (Yamaguchi et al., 2007, 2011, 2015; Stuber et al., 2010; Tecuapetla et al., 2010; Tritsch et al., 2012; Stuber et al., 2015).
OT regulation of VTA neurons and associated behavioral processes could occur via a direct effect at either the cell body or the terminal portions of these varied projection pathways. Additionally, OTRs are also present in the amygdala and medial PFC (Maroun and Wagner, 2016; Brill-Maoz and Maroun, 2016), areas that communicate directly with the VTA and NAc. Thus, regulation of VTA neurons by OT can involve a variety of circuits, some with direct excitatory influences on accumbal DA levels, but almost certainly a significant proportion that alter non-DA transmission and project to other brain regions with indirect influences on regulation of reward.
Characterization of OTR expression in neurons of the mesolimbic reward pathway has been impeded by an inability to localize these receptors to specific neuronal phenotypes. Autoradiography techniques accurately depict brain nuclei that express OTR but do not differentiate between binding occurring on soma or axons nor can it provide the neurochemical phenotype of the neurons expressing OTR (see Manning et al., 2012). Issues with the specificity of antibodies recognizing G-protein-coupled receptors, like OTR, have hindered the use of immunohistochemistry to identify the neurochemical and projection phenotype of OT-sensitive cells within the CNS (see Mouillac et al., 2009). Taking a functional approach, patch-clamp electrophysiological recordings obtained from cell bodies in the VTA found that about one-third of the neurons sampled were depolarized by application of 1 μM OT (Tang et al., 2014). On the other hand, over 75% of neurons in the more medial interfascicular nucleus elicited action potentials in response to the same concentration of OT (Tang et al., 2014). Based on smaller cell body size, slower spontaneous firing rates, and other distinctive electrophysiological properties, the authors concluded that the neurons excited by application of OT were DA neurons (Tang et al., 2014). However, further neuroanatomical studies are required to determine the specific transmitter phenotype and connectivity of OTR expressing neurons within the VTA, especially considering the evidence of coexpressing GLU and DA neurons in the medial VTA region (Yamaguchi et al., 2011) and the continuing refinement of specific projection sites of neurons from different subregions of the VTA (see Ikemoto, 2007).
To unveil the transmitter and projection phenotype of OTR-expressing neurons within the VTA, we utilized transgenic mice producing Cre-recombinase directed by the OTR gene promoter. To qualitatively map OTR distribution within mesolimbic reward circuits, these mice (OTR-Cre) were bred to mice with a loxP-flanked stop cassette upstream of ROSA-driven expression of the red fluorescent protein variant, tdTomato, to generate OTR-reporter mice. Initial studies determined that tdTomato-expression occurred within the VTA and these tdTomato-expressing cells were also immunoreactive for tyrosine hydroxylase (TH), suggesting that DA neurons within the VTA express OTR (MacFadyen et al., 2014). However, due to the possibility that the tdTomato-reporter protein may persist differently after expression compared to the OTR protein, the present studies used Cre-inducible adeno-associated virus (AAV) driving fluorescent marker expression delivered into the VTA of OTR-Cre mice coupled with in situ hybridization and immunohistochemical techniques to evaluate the transmitter phenotype and connectivity of OTR expressing neurons.
MATERIALS AND METHODS
Animals
These studies utilized a novel mouse model, OTR-Cre mice [Tg(Oxtr-cre)ON66Gsat/Mmucd (Mutant Mouse Regional Resource Center)], which express Crerecombinase under the control of the promoter for the OTR gene. These mice were originally obtained on an FVB/N and Crl:CD1(ICR) mixed background; however, the mice used in the present studies were back-crossed onto a C57BL/6J background for 6 + generations. The animals were kept on a normal 12:12-hour light/dark cycle in ventilated cages with ad libitum access to food and water. Animals were grouped housed until they underwent surgery at 60–90 days of age. All animal procedures were approved by the University of Florida Institutional Animal Care and Use Committee and adhered to the animal welfare guidelines issued by the National Institutes of Health.
Stereotaxic surgery
Male OTR-Cre mice were anesthetized with isoflurane and placed in a stereotaxic apparatus for AAV injections. A Cre-inducible AAV coding for enhanced yellow fluorescent protein (eYFP) and channel 2 rhodopsin (ChR2) was delivered into the VTA (AAV-EF1a-DIO-hChR2(H134R)-EYFP; obtained from the UNC Vector Core and hereafter abbreviated as AAV-ChR2-YFP). Bilateral injections were targeted using the following flat skull coordinates from bregma: −3.08 mm posterior, ± 0.5 mm lateral, –4.3 mm ventral (Franklin and Paxinos, 2007). Injection volumes were between 500–700 nl and were delivered using a picospritzer III (Parker, Hollis, NH); pipettes were left in the VTA for 10 minutes to allow for diffusion of AAV-ChR2-YFP into the brain. After surgery, mice were given a single injection of Buprenex (0.1 mg/kg) and moved to single housing and allowed to recover for a minimum of 2 weeks before perfusion took place.
Tissue processing and immunohistochemistry
Mice were overdosed with sodium pentobarbital and transcardially perfused with 0.9% saline followed by 4% paraformaldehyde. Brains were then subsequently extracted and postfixed for 3 hours in 4% paraformaldehyde in deionized water before being transferred to a 30% sucrose in deionized water solution. Brains were allowed to sink in the sucrose solution and were then cut on a Leica CM3050 S cryostat (Leica, Buffalo Grove, IL) into four series of 30-µm coronal sections. The series were stored in cryoprotective solution at 2208C until immunohistochemistry (IHC) was performed.
For IHC, free-floating sections from a single series of tissue were rinsed 5 3 5 minutes in 50 mM potassium phosphate-buffered saline on an orbital shaker at room temperature. Afterwards, the tissue was blocked in either 2% normal goat serum (Jackson ImmunoResearch, West Grove, PA) or normal donkey serum (Jackson ImmunoResearch) with 0.2% Triton-X (Sigma, St. Louis, MO) for 2 hours. Following blocking, sections were incubated in their primary antibody (diluted in blocking solution) overnight at 4°C. Table 1 lists the sources and dilutions of primary antibodies. In the case of double labeling, sections were incubated in multiple primary antibodies raised in different host species.
TABLE 1.
Antibodies Used for Immunohistochemistry
| Antibody | Antigen | Species | RRID | Dilution | Manufacturer |
|---|---|---|---|---|---|
| Primary | |||||
| A10263 | Anti-GFP | Chicken polyclonal | AB_11180326 | 1:1,000 | Thermo Fisher Scientific |
| A10259 | Anti-GFP | Rabbit polyclonal | AB_11180858 | 1:1,000 | Thermo Fisher Scientific |
| AB76442 | Tyrosine hydroxylase | Chicken polyclonal | AB_1524535 | 1:1,000 | Abcam |
| Secondary | |||||
| Alexa 488 | Chicken IgY (IgG) (H1L) | Donkey | AB_2340375 | 1:500 | Jackson Immunoresearch |
| Alexa 488 | Rabbit IgG (H1L) | Donkey | AB_2313584 | 1:500 | Jackson Immunoresearch |
| Alexa 647 | Chicken IgY (IgG) (H1L) | Donkey | AB_2340379 | 1:500 | Jackson Immunoresearch |
| Cy3 | Chicken IgY (IgG) (H1L) | Donkey | AB_2340363 | 1:500 | Jackson Immunoresearch |
The next day, sections were rinsed 5 × 5 minutes in buffered saline as before and blocked for 1 hour before incubating in secondary antibody (diluted in blocking solution) for 2 hours. Table 1 lists the sources and dilutions of secondary antibodies. All sections were rinsed 5 × 5 minutes in buffered saline before being mounted on Superfrost Plus slides (Fischer, Pittsburgh, PA) and coverslipped using polyvinyl alcohol with DABCO (Sigma). All IHC was performed in light-protected conditions to preserve endogenous fluorescence of the virally infected cells.
Antibody characterization
All primary antibodies were characterized by the manufacturers as delineated below. Both chicken anti-GFP (Thermo Fisher Scientific, Cat. no. A10263, RRID: AB_11180326) and rabbit anti-GFP (Thermo Fisher Scientific, Cat. no. A10259, RRID: AB_11180858) were initially isolated from the jellyfish Aequorea victoria according to the manufacturer. Although the eYFP signal produced by virally infected cells was visible without immunohistochemical identification, these antibodies were used to amplify the eYFP signal since both eYFP and GFP share a similar epitope. Labeling in eYFP– sections or untransfected mice was nonexistent.
Chicken anti-TH (Abcam, Cambridge, UK; Cat. no. AB76442 RRID:AB_1524535) was raised against two synthetic peptide/keyhole limpet hemocyanin conjugates corresponding to different regions of the TH gene product that were shared between mouse (P24529) and human (P07101) sequences such that the N-terminal peptide lies within the first 50 amino acids of the mouse TH gene and the C-terminal peptide lies within the last 100 amino acids of the mouse TH gene. According to the manufacturer, the antibody detects an expected single band at 59 kDa in western blot in the mouse and immunolabeling was completely abolished by preabsorption with 10 µg/ml of the cognate peptide. The staining observed in the present study was identical to the example labeling provided by the manufacturer and matches published reports of TH staining in the VTA and substantia nigra (Swanson, 1982).
In situ hybridization
RNAscope in situ hybridization (ISH) was performed on brain tissue collected from OTR-Cre mice to determine the extent to which Oxtr mRNA colocalized with eYFP expression, and to identify GLU neurons in the VTA. Mice were perfused as described above and their brains were cut coronally into six series at 20 µm thickness and immediately mounted onto SuperfrostPlus Gold slides. Tissue collection, sectioning, and mounting of sections were performed in RNase-free conditions. Slides were air-dried and stored at –20°C until processing for ISH. Sections were brought back to room temperature for 30 minutes prior to performing the manufacturer’s protocol (Advanced Cell Diagnostics, Hayward, CA). RNAscope ISH utilized a positive control probe that targets Ubc and a negative control probe that targets DapB as well as probes for Oxtr (Mm Oxtr probe, 1:50 dilution, Advanced Cell Diagnostics) and vesicular GLU transporter (vGluT, Slc17a6 probe, 1:50 dilution, Advanced Cell Diagnostics). The probe pair sequences for Oxtr and VGluT are listed in Table 2. IHC was performed after ISH to label AAV-infected cells or when double labeling for TH immunoreactivity. Slides were then coverslipped and imaged.
TABLE 2.
Probe Sequences for In Situ Hybridization
| ACD target probe: Mm-Slc17a6-C2, Cat#319171-C2 | ACD target probe: Mm-Oxtr-C3, Cat#402651-C3 | |
| 20ZZ probe targeting 1986–2998 of NM_080853.3 | 20ZZ probe targeting 776–1676 of NM_001081147.1 | |
| ZZ pair# | Probe sequence that binds to target | Probe sequence that binds to target |
| pair1 | TATGAGAGTAGCCAACAACCAGAAGCAGCGTGGCTTCCATGC | GGTCATCTTCACTGTGCGGATTTTGGCCTTGGAGATAAGCTTG |
| pair2 | ATCCTACTGCAAGCACCAAGAAGGAGATGGCCACCCCTCTAG | AAGGCGTCCAGCACACGATGAAGGCCAGAACAATGATGAA |
| pair3 | GCAATATCCAAGTGATTAACATTGAAACCAGAGATAGCAAATCCACTGA | CGCATTGACGTCCCAGACGCTCCACATCTGCACGAAGAAGA |
| pair4 | CCAACGCCATTTGAAATGCCCATTAAGATACTGGCATATCTTGGA | CCAAGAGCATGGCAATGATGAAGGCAGAAGCTTCTTTGGG |
| pair5 | GCACCAACAATGATAGGGCAAACCATCCCCGACAGCGTG | GAGCATGTAGATCCATGGGTTGCAGCAGCTGTTGAGGCTGG |
| pair6 | ATGAGGAAGACATACTGCCATTCTTCACGGGACTTATTCTTTGTCATT | AGCGCTGCACGAGTTCGTGGAAGAGATGGCCCGTGAA |
| pair7 | CAAATAGTGCATAAAATATGACTCCACCATAGTGGACGAGTGCAGCA | CCGGCTGCCCTTCAGGTACCGAGCAGAGCAGCAGAGGA |
| pair8 | GCTTGTTTCCTCAGGGTCTGCCCAAGGTTGTTTCTCTCCTGAGG | AGGTGGAGGAGTTGCTTTTCTTGCTAATGCTCGTCTCTCCAGG |
| pair9 | TTTCTTCATCCAGTTCATCTTCGTGAATGAAGCCACATTTTTCTTC | GAGAACAGCTCCTCTGACTCGAGCTGCGACGACTCAGGACGA |
| pair10 | CTCCTGTGAGGTAGCACCGTAAGATTTGGTGGTACCGTAATTTATGT | TGGTGGGCCAGGCCTATGGCTCATGCCGAGGATGGTT |
| pair11 | AATTCTTCCTTTTTCTCCCAGCCGTTAGGCCAGCCTCCATT | CATGCACAGCCACCAGAGGGGAAGATCGGCGGCTACAC |
| pair12 | GGTCCTTATAGGTGTACGCGTCTTGCGCACCTTCTTGCACA | GGACAGGAGGGATGCAAACCAATCAATAGGCACCATATACAGCTC |
| pair13 | CAAACACTACAAATGAATCCAGCAACTAGCATCGTTATGAATAATCATCTC | TCCCTACCCCAAGTCAGAATATGACACAGAATCTAACCAGCCCAA |
| pair14 | TGTTTTTGTTTTTGAACAGCAAGACTTGCTTGGTTGATATGTTTACATG | TCCTCTGATGGCTGAGTGACCCTGTCATCTCCCATGGAGACATT |
| pair15 | CATAACGTGACAACTGCCACAGATTGCACTTGATGGGAATCTCAT | CAGGAACACTTGAGTCAGGGTAGTAGAATAGGTGGGAGTCCAGGTGA |
| pair16 | CTTTAAATCACAAACGAAAGGACAAATGGCCTGAATGAAGACGG | TGGAGGGGACAGAAGTGAGGTGCAGGAGAATCTACCCACTGCC |
| pair17 | TCTAAAATGGTGATGGGTCCAACGAATACCTACTTATTTCTACAGGAAAC | CCTAGGTGTGCCGTCTTTCACAAGATACCAGGATAAACAAGGGG |
| pair18 | CTTCCTAACTTCTGTAGGATGACATGTGCCAACTGTTGTAGTTGTGCTC | CCTTGTCTCATCCCACTGGACTTCCTCAGGTAACTGGTCACCAAT |
| pair19 | CAGTCCAGTGTAATAAATAAGTGCAGTTTGCATGATCCAGTAGCTTTGG | GGAAATTAGCACCACTCTGCGTCTGCAGCCTCATTTCCCACT |
| pair20 | TTCCTGTTCCACTATGTCTCTAGACAGGCTTTCCCTGGGATAGTTTG | GGATGTCCTAAGGATGCTAAGATCTGTCCACACAACTCAGGTCAGAA |
Image capture and analysis
All images were obtained using an Axiolmager M.2 fluorescent microscope (Carl Zeiss, Thornwood, NY) equipped with an Apotome.2 and connected to a PC running Axiovision 4.8. All images were obtained using the same automated parameters. Brain regions were identified for imaging using landmarks found in the Mouse Brain in Stereotaxic Coordinates 3rd Ed. (Franklin and Paxinos, 2007). Moving rostral to caudal, sections were imaged as follows: PFC from bregma 2.34 mm through 1.54 mm, NAc from bregma 1.70 mm through 0.74 mm, amygdala from bregma –0.94 mm through 21.58 mm, lateral habenula from bregma –1.70 mm through –2.18 mm, and VTA from bregma –2.80 mm through –3.80 mm. Each brain slice was imaged with 2.5× or 5× objective magnification to confirm the presence of the brain region of interest. If the brain region of interest was present in the section, the section was then imaged with 20× or 40× objective magnification to study colocalization. Z-stack images were obtained at 1 µm thickness per each z-step with an average of 12 optical steps per image with 203 objective magnification and 10 optical steps per image with 40× objective magnification using Plan-Apochromat objectives. Exposure time for images was determined based on an overexposure reporting function automatically set by the software, with exposure time varying from 10–50 ms for the channel capturing GFP-labeled images, 100–300 ms for TH-labeled images, and 200– 300 ms for ISH-labeled images. ISH images labeling Oxtr or vGluT mRNA were compared against positive and negative control probe images with the same parameters to quantify signal versus ambient noise. That is, the exposure time at which there was no signal in the negative control slices was used as the exposure time for all ISH-labeled sections. Any ISH labeling seen in brain slices used for quantification at this exposure time was considered signal and not ambient noise, and therefore used for colocalization studies. All images were adjusted using the brightness and contrast settings available in Axiovision to increase clarity.
The counting of colocalized cells took place using a method similar to the “direct three-dimensional counting process” outlined by Williams and Rakic (1988). Briefly, each z-stack image was opened in Axiovision 4.8 and then each image was studied while alternately turning the respective-labeled channels on and off to identify potential colocalizations. Candidate cells were further analyzed by removing the area of the image containing the cell into a separate region of interest image to generate a 3D reconstruction. Colocalization was counted if each individual channel throughout the z-plane of the 3D reconstruction contained dual fluorescent labeling.
The same procedure was used for quantifying the number of cells and colocalization of markers for cell bodies in all subregions of the VTA as well as for colocalization of staining in fibers in the PFC, NAc, and amygdala. In this way, we hoped to eliminate bias for any particular brain region or colocalization event.
RESULTS
Confirmation and distribution of AAV-ChR2-YFP virus-infected cells in the VTA
OTR-Cre mice were injected with cre-dependent AAV-ChR2-YFP virus bilaterally into the VTA and brains were collected after at least 2 weeks to allow for adequate virus transfection. Virus induction into cre-recombinase-expressing neurons was taken to be indicative of active OTR expression by identifying colocalization of Oxtr mRNA with GFP signal (Fig. 1, white arrows). Although there were limited instances of Oxtr mRNA not colocalized with virus-positive cells (GFP+) (Fig. 1B,C red arrow), 89% of GFP1 cells were colocalized with Oxtr mRNA (Fig. 1D). Therefore, it is possible that the total number of OTR-expressing cells is somewhat overrepresented by GFP1 cells. Even so, for all subsequent figures, GFP+ cells are considered indicative of active Oxtr mRNA expression.
Figure 1.

Confirmation of cre-dependent viral transfection of ventral tegmental area (VTA) neurons that express oxytocin receptors (OTR). Male mice that express Cre recombinase under the control of the OTR promoter were injected with cre-dependent AAV-ChR2-YFP into the VTA. RNAscope in situ hybridization for Oxtr mRNA was performed on 20-µm sections from the mouse midbrain. A–C: A representative projection image comprised of 1 µm thick sections of the VTA with 20× objective magnification. A: GFP-enhanced YFP expression. B: RNAscope in situ hybridization for Oxtr mRNA. C: Merged image of GFP immunoreactivity and Oxtr mRNA. Colocalization of virus infected cells with Oxtr mRNA is indicated by white arrows. Yellow arrows represent noncolocalized Oxtr mRNA. D: Representative chart showing the percent of virus infected cells colocalizing with Oxtr mRNA compared to virus infected cells that did not colocalize with Oxtr mRNA.
Representative photomicrographs depicting GFP+ labeling throughout the VTA can be seen in Figure 2. GFP+ cells were observed in all subregions of the VTA extending from bregma –2.80 mm to bregma –3.80 mm (Franklin and Paxinos, 2007), which includes all subregions except the caudal linear nucleus. The densest regions of viral infection occurred in the posterior VTA in the medial parainterfascicular, paranigral, and inter-fascicular nuclei (Fig. 2C). Out of 15 mice that received injections, 12 had GFP+ expression localized primarily to these areas of the VTA. A small number of GFP+ fibers but not GFP+ cells were seen in the substantia nigra compacta. The three mice with missed injection sites had no GFP+ expression in the VTA and were excluded from the study.
Figure 2.

OTR-expressing cells throughout the VTA. Male OTR-cre mice were injected with cre-dependent AAV-ChR2-YFP to label OTR-expressing cells. After 2 weeks the mice were perfused and the brains were collected and coronally sectioned at 30 µm. GFP immunohisto-chemistry was used to amplify the eYFP signal. A,C,E: Representative photomicrographs showing GFP expression throughout the rostral-caudal extent of the VTA. All neuroanatomical landmarks were identified as in Franklin and Paxinos (2007) (B,D,F: red circles). (A) Anterior VTA and parabrachial pigmented nucleus (PBP) of the VTA, corresponding to bregma –2.92 mm. (B) PBP, paranigral (PN), and interfascicular (IF) nuclei of the VTA, corresponding to bregma –3.16 mm. (C) Posterior VTA including the PBP, PN, parainterfascicular (PIF), and IF nuclei, corresponding to bregma –3.52 mm. All images were taken with 2.5× objective magnification.
GFP+ fibers projected to different parts of the limbic system including the prelimbic cortex of the PFC, the NAc, the ventral pallidum, the amygdala, and the lateral habenula (Fig. 3). In the PFC, GFP+ fibers were seen in the prelimbic cortex (Fig. 3A). In the NAc, GFP+ fibers projected mainly along the core-shell border but also through other regions of the NAc core and shell (Fig. 3B). In the amygdala, GFP+ fibers were seen in clusters in both the basolateral and basomedial nuclei (Fig. 3C).
Figure 3.
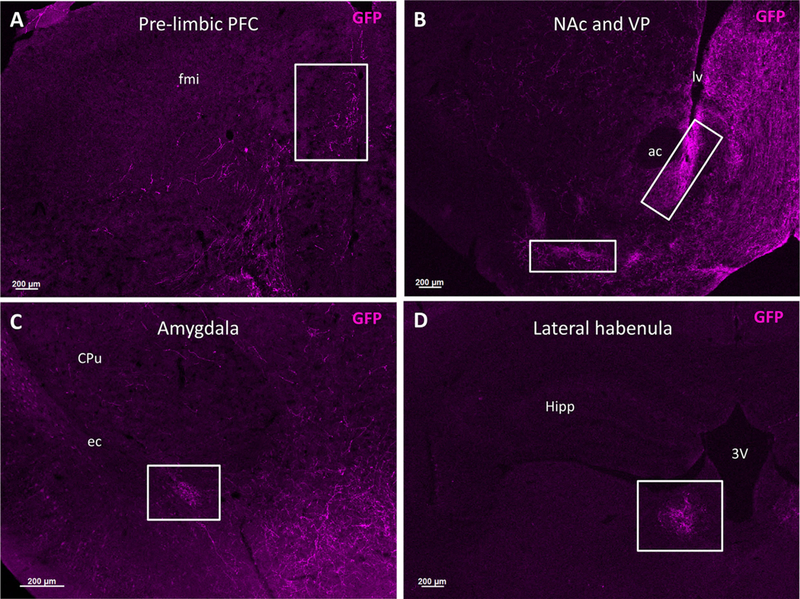
Fibers from OTR-expressing VTA neurons project throughout the forebrain. Male OTR-cre mice were injected with cre-dependent AAV-ChR2-YFP into the VTA to label OTR-expressing neuronal fibers. After 2 weeks, mice were perfused and brains were collected and coronally sectioned at 30 µm. GFP immunohistochemistry was used to amplify the eYFP signal and the distribution of efferent projections were visualized throughout the forebrain. Representative photomicrographs show fibers from OTR-expressing VTA neurons in numerous mesolimbic projection sites. Franklin and Paxinos (2007) was used to verify all neuroanatomical landmarks. A: Prelimbic area of the PFC (white box) with 2.5× objective magnification. B: NAc and ventral pallidum (white boxes) with 2.5× objective magnification. C: Basolateral amygdala (white box) with 5× objective magnification. D: Lateral habenula (white box) with 10× objective magnification. ac = anterior commissure, CPu = caudate putamen, ec = external capsule, fmi = forceps minor of the corpus callosum, Hipp = hippocampus, lv = lateral ventricle, 3V = third ventricle.
OTR-expressing cells colocalize with a small number of DA neurons in the VTA
GFP+ cells colocalized with TH immunoreactivity (TH+) in all subregions of the VTA (Fig. 4D) but not to a large extent in any of these regions. Briefly, colocalization was seen in 8% of the cells counted in the parabrachial pigmented and rostral nuclei, in 5% of the cells in the parainterfascicular nucleus, in 3% of the cells in the paranigral nucleus, and 4% of the cells in the interfascicular and rostral linear nuclei (Fig. 4D). These percentages were calculated based on quantification of ~60 brain slices of the VTA taken from eight mice. Together, 807 GFP+ cells were observed across all subregions of the VTA, and colocalization with TH was seen only 44 times (Fig. 4E). Figure 4 shows a representative photomicrograph through the paranigral nucleus of the VTA at bregma –3.64 (Franklin and Paxinos, 2007). There was variance in the number of colocalizations between GFP+ cells and TH+ among animals. Some mice had higher expression of GFP+ cells and therefore showed more colocalization with TH+ neurons (data not shown).
Figure 4.

A small number of OTR-expressing VTA neurons also express tyrosine hydroxylase (TH). Male OTR-cre mice were injected with cre-dependent AAV-ChR2-YFP in the VTA. Immunohistochemistry for TH was used to determine the extent to which OTR are expressed by dopamine (DA) neurons. The eYFP signal was enhanced with GFP immunohistochemistry. A–C: Representative photomicrographs taken from a coronal section through the VTA at 20× objective magnification. The corresponding atlas region for these photomicrographs is the paranigral nucleus of the VTA at bregma –3.64 (Franklin and Paxinos, 2007). A: GFP immunoreactivity indicative of OTR-expressing cells. B: TH-labeled neurons. C: Merged image of GFP and TH-labeled cells. White arrows represent colocalization of GFP and TH. D: Number of colocalizations of GFP and TH compared to GFP-only in each subregion of the VTA. Error bars represent SEM (n = 8). E: Total percent of colocalization of GFP and TH observed throughout the VTA.
OTR-expressing cells mostly colocalize with GLU neurons in the VTA
Since very few GFP+ cells were colocalized with markers for DA neurons in the VTA, ISH was performed for vGluT to identify whether OTR-expressing VTA cells were GLU neurons (Fig. 5). Colocalization of vGluT mRNA with GFP+ neurons indicated that ~44% of GFP+ cells observed in the VTA are GLU neurons (Fig. 5E). Colocalization between GFP+ cells and vGluT mRNA was characterized in all subregions of the VTA. Briefly, colocalization was seen in 6% of the cells counted in the parabrachial pigmented and rostral nuclei, in 38% of the cells in the parainterfascicular nucleus, in 43% of the cells in the paranigral nucleus, and in 61% of the cells in the interfascicular and rostral linear nuclei (Fig. 5D). These percentages were calculated based on images obtained from ~60 brain slices of the VTA obtained from six mice. Figure 5A–C shows a representative photomicrograph through the parainter-fascicular nucleus of the VTA at bregma –3.80 mm (Franklin and Paxinos, 2007). White arrows represent colocalized GFP+ cells and vGluT mRNA; the red arrow shows a GFP+ cell that does not contain vGluT mRNA.
Figure 5.

OTR-expressing cells in the VTA colocalize with vesicular glutamate transporter (vGluT) mRNA. Male OTR-cre mice were injected with cre-dependent AAV-ChR2-YFP in the VTA. RNAscope in situ hybridization for vGluT mRNA was performed to evaluate the extent to which OTR are expressed by glutamatergic neurons. The eYFP signal was enhanced with GFP immunohistochemistry. A–C: representative projection image comprised of 1-µm thick sections of the VTA with 203 objective magnification. Section corresponds to the parainterfas-cicular region of the VTA at bregma –3.80 mm (Franklin and Paxinos, 2007). A: The GFP immunoreactivity indicative of OTR-expressing cells. B: RNAscope in situ hybridization for vGluT mRNA. C: Merged image depicting GFP immunoreactivity colocalized with vGluT mRNA. White arrows represent colocalization. Yellow arrows represent noncolocalizing GFP-labeled cells. D: The number of colocalizations of GFP and vGluT mRNA compared to GFP-only in each subregion of the VTA. Error bars represent SEM (n = 6). E: Total percent of colocalization of GFP and vGluT mRNA observed throughout the VTA.
OTR-expressing DA neurons in the VTA project to numerous regions of the forebrain
Some of the forebrain regions where GFP+ fiber expression was described earlier (Fig. 3) were further examined for fibers that expressed both GFP and TH. As expected, DA neurons were found to project throughout the forebrain, including the NAc, PFC, and amygdala, and a subset of these fibers were positive for both GFP and TH (Fig. 6). Colocalization between GFP+ fibers and TH+ fibers was seen in the NAc core (Fig. 6E–H) as well as along the core-shell border. In the amygdala, fibers positive for both GFP and TH were present in the basomedial nuclei (Fig. 6A–D). In the PFC, fibers positive for both GFP and TH were present in the rostral prelimbic cortex (Fig. 6I–L). Colocalization of GFP and TH in fibers was not characterized for the ventral pallidum or lateral habenula though GFP+ fibers were seen in these regions.
Figure 6.

OTR-expressing DA neurons in the VTA project throughout the forebrain. Male OTR-cre mice were injected with cre-dependent AAV-ChR2-YFP in VTA. After 2 weeks the mice were perfused and the brains were collected and coronally sectioned at 30 µm. GFP immunohistochemistry was used to amplify the YFP signal and TH immunohistochemistry was used to identify DA fibers. A,E,I: The PFC, NAc, and amygdala with 2.53 objective magnification, respectively. The white box indicates the region of interest in all other panels. B,F,J: OTR expressing fibers with 20× objective magnification. C,G,K: TH 1 fibers with 203 objective magnification. D,H,L: A merged image of the colocalization of OTR-expressing fibers and TH + fibers. Merged images were generated from 1-µm thick z-stacks taken through the region. White arrows indicate colocalization. ac = anterior commissure, CPu = caudate putamen, ec = external capsule, fmi = forceps minor of the corpus callosum, lv = lateral ventricle.
DISCUSSION
Using a novel transgenic mouse model and a credependent AAV, OTR-expressing cells were identified throughout all medial and lateral subregions of the VTA. Fibers from these neurons were found in many of the known projection sites of VTA neurons. Over 89% of cells expressing eYFP colocalized with OTR mRNA, indicating the specificity of cre-mediated viral expression of eYFP in OTR-expressing cells. A small number of GFP+ fibers but no GFP+ cells were seen in the substantia nigra compacta, suggesting either that the AAV did not diffuse out of the VTA to other brain regions or that cells in substantia nigra do not express OTR. An average of 5% of GFP+ cells in the VTA were colocalized with TH+ cells, while an average of 44% of GFP+ cells were colocalized with vGluT mRNA, although the exact numbers of OTR-expressing DA and GLU neurons varied between subregions of VTA. OTR-expressing DA neurons sent axons to brain nuclei known to receive efferent DA projections from the VTA, including the prelimbic cortex of the PFC, the NAc, and the basomedial amygdala (see Ikemoto, 2007).
A surprising finding of this study was the low percentage of OTR expression by DA neurons in VTA, given the indirect evidence of OT’s ability to modulate DA circuitry (Melis et al., 2007; Shahrokh et al., 2010) and neuronal firing (Tang et al., 2014). The highest percentage of OTR-expressing DA neurons (8%) occurred in the parabrachial pigmented nucleus, which is the densest region of DA neurons in the VTA (Sanchez-Catalan et al., 2014), with a much lower incidence of colocalization of TH and GFP in more medial areas. Recently, it has been suggested that neurons in the VTA are better described along a phenotypic spectrum based on evidence they express DA markers, such as TH and the DA transporter, to varying degrees along with differential expression of markers for multiple neurotransmitters (Lammel et al., 2008, 2015; Stuber et al., 2015). Specifically, many midbrain DA neurons express TH to a much lesser degree than expected (Lammel et al., 2015; Stuber et al., 2015). Therefore, it is possible that some OTR-expressing DA neurons in the posteromedial VTA were not adequately identified using TH antibody, thereby limiting the number of colocalizations of TH with GFP in the present study. Additionally, since the virus might not have transfected 100% of OTR-expressing neurons, this may also contribute to the underestimation of OTR expression by DA neurons. Since the number of OTR-expressing DA neurons in the VTA may actually be higher than shown here, electrophysiology studies combined with IHC for additional DA markers will help better elucidate the presence of OTR on DA cell bodies in subregions of the VTA and their role in regulating DA neuronal activity.
Fibers from DA neurons that express OTR were found to project to the NAc, PFC, and amygdala. Specifically, fibers from OTR-expressing DA neurons to NAc were more commonly found in the border between shell and core of NAc, which is consistent with our finding that most GFP/TH colocalizations occurred in more lateral regions of VTA and findings in the literature that projections from DA neurons from the parabrachial pigmented area tend to project to these subregions of NAc (see Ikemoto, 2007). These data indicate that even the small number of OTR-expressing DA neurons found in VTA still contribute significant innervation of target forebrain regions. However, it is unknown whether these were fibers of passage or were nerve terminals that release DA onto postsynaptic neurons residing in these regions, as suggested by others (Melis et al., 2007; Shahrokh et al., 2010). Future colocalization studies using cellular and synaptic markers can determine if such fibers are terminating in these different brain regions, especially the NAc.
The potential role of OTR regulation of DA neurons in the VTA could be twofold. Posteromedial DA neurons have distinct electrophysiological properties and differing responses to rewarding or aversive stimuli based on their projection sites. Specifically, DA neurons projecting to NAc medial shell showed increased AMPAR/ NMDAR ratios when exposed to rewarding stimuli, while DA neurons projecting to mPFC showed the same increase only when exposed to aversive stimuli (Lammel et al., 2011). In the present study, colocalization between GFP+ and TH+ cells was sparse, but colocalized fibers were seen projecting to both the NAc shell and PFC. The optogenetic potential of this particular AAV construct can be used to study the behavioral changes that occur with selective activation of OTR-expressing neurons that terminate within the NAc or PFC.
Based on our results, almost half of the OTR-expressing cell bodies observed in the VTA appear to be GLU neurons. Other studies have found that GLU colocalizes with DA in some VTA neurons (Yamaguchi et al., 2007, 2011, 2015), especially in the medial sub-regions. Although we did see occasional vGluT and TH colocalization in these regions (data not shown), there was no evidence of OTR expression by these “DA/GLU” neurons in the limited number of mice (n 5 3) that were labeled with all three markers. Both GLU and DA/ GLU neurons project to the NAc, PFC, and amygdala (Taylor et al., 2014). Activation of GLU neurons in the VTA might provide both direct and indirect mechanisms for modulation of the traditional DA to NAc reward pathway (Britt et al., 2012). Additionally, GLU neurons within the VTA send projections to the lateral habenula and ventral pallidum (Root et al., 2014a; Taylor et al., 2014; Lammel et al., 2015), two brain nuclei where fibers from OTR-expressing VTA neurons were observed but not phenotypically characterized in the present study. Recently, activation of GLU neurons in the VTA was found to promote aversive conditioning through projections to the lateral habenula (Root et al., 2014b), thus allowing for the possibility of OT regulation of aversive conditioning. Future studies utilizing optogenetic stimulation of OTR-expressing fibers coupled with microdialysis and behavioral experiments may ultimately delineate the role of OTR-mediated GLU release in these projection areas on both appetitive and aversive learning processes.
Unfortunately, a significant proportion of OTR-expressing cell bodies in the VTA remained uncharacterized in terms of neurotransmitter phenotype in our study when colabeled separately with DA or GLU markers. A small subset of mice (n 5 3) were labeled with both TH and vGluT markers simultaneously, and in these animals around half of GFP-labeled neurons were neither TH- nor vGluT-positive. This suggests that there are OTR-expressing cells that are neither DA nor GLU neurons. Previous electrophysiological and pharmaco-logical studies suggest that a large subpopulation of neurons in the VTA is GABAergic (Morales and Root, 2014) and it is possible the unidentified GFP+ neurons in this study were GABAergic. The GABAergic neurons within the VTA are primarily interneurons, but also project to areas of the limbic system including the amygdala and lateral habenula (Taylor et al., 2014) and GFP+ fibers were observed in these brain nuclei in the present study. These two brain regions modulate reward devaluation (Kawasaki et al., 2015) and aversive and negative reward conditions (Stamatakis et al., 2013). Therefore, it is possible OTR regulation of GABA neurons in the VTA may provide a mechanism for regulation of these behaviors via inhibition of these brain regions and future studies should examine this possibility.
It should be noted that there was variance in the number of GFP+ cells observed between animals. Some mice showed a large number of OTR-expressing neurons and correspondingly had a higher frequency of colocalizations with TH+ neurons, although the total percent colocalization for any one mouse was never greater than 14%. These differences in observed OTR expression could be due to intersubject variability in OTR expression, the amount of time between virus injection and brain collection, volume of virus injection, or targeting of viral injections, although all efforts were made to limit the variability due to the latter three factors. However, the same degree of variability in OTR expression was seen between mice used for vGluT labeling, yet colocalization between GFP and vGluT was still significantly higher than that for TH. Finally, as already described, some mice were processed for triple labeling of GFP, TH, and vGluT and in those cases, colocalization of GFP and vGluT clearly predominated over that of GFP and TH.
An important consideration when characterizing OTR expression by any neuronal population is their dynamic expression. The distribution of OTR in the brain can be influenced by gender- and/or species-specific patterns of behavior (see Grinevich et al., 2016). OTR expression is very fluid during prenatal and early postnatal development, especially in the mesolimbic pathway where expression can be influenced by maternal care and environmental enrichment (see Grinevich et al., 2015, 2016). OTR distribution reaches its pattern of permanence between postnatal days 60–90 (Grinevich et al., 2015). This was the age range of the mice used in this study. It is possible that the stress of stereotaxic surgery and an environment change from group housing to single housing postsurgery affected the expression of OTR in the VTA. Similarly, unknown differences in the experiences of individual mice (e.g., weaning order, maternal care) might have contributed to variability in OTR expression between different neuronal phenotypes in VTA that persisted to adulthood.
The use of the OTR-Cre mice identifies most OTR- expressing neurons originating in the VTA but does not indicate whether the OTR are expressed on dendrites or cell bodies in the VTA or on presynaptic terminals in projection areas. Electrophysiology studies show that depolarization occurs when cells in the VTA are exposed to OT (Tang et al., 2014) and infusion of OT into the VTA increases DA release in the NAc (Shahrokh et al., 2010). Together with our data, this suggests that OTR expression on cell bodies or dendrites of DA neurons within the VTA directly modulates DA levels in the NAc and potentially other projection sites as well. There is less evidence for the presence of OTR on presynaptic terminals of VTA neurons that project to the NAc. Lesioning DA neurons in the NAc did not change the OTR number in receptor autoradiography studies (Lim et al., 2004), indicating that the majority of OTR is not present on DA terminals in NAc. Pharmacological studies selectively knocking out OTR on VTA neurons and then administering OTR agonists/antagonists to VTA projection sites would more definitively test for the presence of presynaptic OTRs.
Our results indicate that OTR regulation of VTA neurons and their projections throughout the forebrain is more complex than a direct action on only DA neurons that project to NAc. Instead, OTR expression is found on multiple neuronal phenotypes within the VTA, and the projection profile of these neurons appears to be equally as diverse. Thus, OTR regulation of reward circuitry includes direct regulation of DA, GLU, and possibly GABA neurons that project to NAc, medial PFC, amygdala, and other limbic regions. Additionally, if OTR expressing VTA neurons includes the GLU and GABA interneurons that synapse on DA VTA neurons (Omelchenko and Sesack, 2009; Dobi et al., 2010), this could provide indirect regulation of reward circuitry through excitation, inhibition, or even disinhibition of DA neurons.
Finally, the possibility of OTR expression by non-neuronal cells in VTA must be considered. Oxtr mRNA and protein expression is present in enriched cultures of both microglia and astrocytes, and activation of this signaling produces antioxidant and antiinflammatory effects during cerebral ischemia (Karelina et al., 2011). Hypothalamic astrocytes respond rapidly to OT exposure with an increase in cytosolic calcium levels that is presumably dependent on OTR activation (Kuo et al., 2009). Thus, OT has the potential to influence glial populations that might impact VTA neuronal activity. Although the morphology of the GFP1 cells visualized in our study did not suggest a glial phenotype, future studies should use glial cell markers in combination with measurement of OTR expression to identify possible expression of OTR by glial populations in the VTA.
Along with regulation of naturally motivated behavior and reward-related learning, the mesocorticolimbic pathway also mediates reward from addictive substances, thereby providing the possibility of OT regulation of susceptibility to addiction (see Buisman-Pijlman et al., 2014). There is ample evidence for OT inhibition of self-administration of a number of abused drugs including cocaine (Westenbroek et al., 2013), methamphetamine (Carson et al., 2010), heroin (Kovacs et al., 1985), and alcohol (MacFadyen et al., 2016; Peters et al., 2016). It has been proposed that OT facilitates social attachment and protects against addiction by stimulating the shift from novelty seeking to preference for familiarity (see Tops et al., 2013). Along these same lines, social bonding decreases the rewarding properties of amphetamine (Liu et al., 2011), while amphetamine impairment of social bonding seems to be mediated via activation of D1-like DA receptors in the NAc (Liu et al., 2010). A direct effect of OT on reward circuitry is also indicated since OT reversal of amphetamine-induced deficits in social bonding involves increases in accumbal DA levels (Young et al., 2014). Recently, intracerebroventricular OT not only decreased voluntary ethanol consumption but also prevented ethanol stimulation of accumbal DA levels (Peters et al., 2016). Based on their hypothesis, OT has been suggested as a possible treatment for drug addiction (see McGregor and Bowen, 2012) and has been used successfully to decrease withdrawal-induced anxiety and alcohol cravings in alcoholics in a treatment center (Pedersen et al., 2013). Thus, under-standing the influence of OT on specific circuitry of reward pathways in the brain may provide new information about OT treatment of addiction.
TABLE 3.
Abbreviations
| 3V | Third ventricle | OTR | Oxytocin receptor |
| ac | Anterior commissure | PBP | Parabrachial pigmented nuclei |
| CPu | Caudate putamen | PFC | Prefrontal cortex |
| ec | External capsule | PIF | Parainterfascicular nuclei |
| eYFP | Enhanced yellow fluorescent protein | PN | Paranigral nuclei |
| fmi | Forceps minor, corpus callosum | RLi | Rostral linear nucleus |
| fr | Fascicular retroflexus | RN | Red nuclei |
| GFP | Green fluorescent protein | SNr | Substantia nigra reticulata |
| Hipp | Hippocampus | TH | Tyrosine hydroxylase |
| IF | Interfascicular nucleus | vGluT | Vesicular glutamate transporter |
| lv | Lateral ventricle | VP | Ventral pallidum |
| ml | Medial lemniscu0073 | VTA | Ventral tegmental area |
| VTAR | Rostral ventral tegmental area |
ACKNOWLEDGMENT
The authors thank Helmut Hiller for technical support provided during these experiments.
Grant sponsor: University of Florida Research Foundation award (to J.P.); Grant sponsor: Department of Pharmacodynamics and NHLBI; Grant number: 122494 (to E.G.K.).
Footnotes
CONFLICT OF INTEREST
None of the authors have a known or potential conflict of interest including financial, personal, or other relationships with other people or organizations within 3 years of beginning the submitted work that could inappropriately influence, or be perceived to influence, the work presented in this article.
LITERATURE CITED
- Brill-Maoz N, Maroun M. 2016. Extinction of fear is facilitated by social presence: Synergism with prefrontal oxytocin. Psychoneuroendocrinology 66:75–81. [DOI] [PubMed] [Google Scholar]
- Britt JP, Benaliouad F, McDevitt RA, Stuber GD, Wise RA, Bonci A. 2012. Synaptic and behavioral profile of multiple glutamatergic inputs to the nucleus accumbens. Neuron 76:790–803. [DOI] [PMC free article] [PubMed] [Google Scholar]
- Buisman-Pijlman F, Sumracki NM, Gordon JJ, Hull PR, Carter CS, Tops M. 2014. Individual differences underlying suspectibility to addiction: Role for the endogenous oxytocin system. Pharmacol Biochem Behav 119:22–38. [DOI] [PubMed] [Google Scholar]
- Carson DS, Cornish JL, Guastella AJ, Hunt GE, McGregor IS. 2010. Oxytocin decreases methamphetamine self-administration, methamphetamine hyperactivity, and relapse to methamphetamine-seeking behavior in rats. Neuropharmacology 58:38–43. [DOI] [PubMed] [Google Scholar]
- de Kloet AD, Wand L, Ludin JA, Smith JA, Pioquinto DJ, Hiller H, Steckelings UM, Scheuer DA, Sumners C, Krause EG. 2016. Reporter mouse strain provides a novel look at angiotensin type-2 receptor distribution in the central nervous system. Brain Struct Funct 221:891–912. [DOI] [PMC free article] [PubMed] [Google Scholar]
- Dobi A, Margolis EB, Wang HL, Harvey BK, Morales M. 2010. Glutamatergic and nonglutamatergic neurons of the ventral tegmental area establish local synaptic contacts with dopaminergic and nondopaminergic neurons. J Neurosci 30:218–229. [DOI] [PMC free article] [PubMed] [Google Scholar]
- Dumais KM, Bredewold R, Mayer TE, Veenema AH. 2013. Sex differences in oxytocin receptor binding in forebrain regions: Correlations with social interest in brain region-and sex-specific ways. Horm Behav 64:693–701. [DOI] [PubMed] [Google Scholar]
- Franklin KBJ, Paxinos G. 2007. The mouse brain in stereotaxic coordinates New York: Academic Press. [Google Scholar]
- Freeman SM, Walum H, Inoue K, Smith AL, Goodman MM, Bales KL, Young LJ. 2014. Neuroanatomical distribution of oxytocin and vasopressin 1a receptors in the socially monogamous coppery titi monkey (Callicebus cupreus). Neuroscience 273:12–23. [DOI] [PMC free article] [PubMed] [Google Scholar]
- Fu Y, Yuan Y, Halliday G, Rusznak Z, Watson C, Paxinos G. 2012. A cytoarchitectonic and chemoarchitectonic analysis of the dopamine cell groups in the substantia nigra, ventral tegmental area, and retrorubral field in the mouse. Brain Struct Funct 217:591–612. [DOI] [PubMed] [Google Scholar]
- Fu Y, Paxinos G, Watson C, Halliday GM. 2016. The substantia nigra and ventral tegmental dopaminergic neurons from development to degeneration. J Chem Neuroanat doi: 10.1016/j.chemneu.2016.02.001 [Epub ahead of print]. [DOI] [PubMed] [Google Scholar]
- Gimpl G, Fahrenholz F. 2001. The oxytocin receptor system: structure, function, and regulation. Physiol Rev 81:629–683. [DOI] [PubMed] [Google Scholar]
- Gordon I, Martin C, Feldman R, Leckman JF. 2011. Oxytocin and social motivation. Dev Cogn Neurosci 1: 471–493. [DOI] [PMC free article] [PubMed] [Google Scholar]
- Grinevich V, Desarmenien MG, Chini B, Tauber M, Muscatelli F. 2015. Ontogenesis of oxytocin pathways in the mammalian brain: late maturation and psychosocial disorders. Front Neuroanat 8:1–18. [DOI] [PMC free article] [PubMed] [Google Scholar]
- Grinevich V, Knobloch-Bollmann HS, Eliava M, Busnelli M, Chini B. 2016. Assembling the puzzle: pathways of oxytocin signaling in the brain. Biol Psychiatry 79:155–164. [DOI] [PubMed] [Google Scholar]
- Ikemoto S 2007. Dopamine reward circuitry: Two projection systems from the ventral midbrain to the nucleus accumbens-olfactory tubercle complex. Brain Res Rev 56:27–78. [DOI] [PMC free article] [PubMed] [Google Scholar]
- Karelina K, Stuller KA, Jarrett B, Zhang N, Wells J, Norman GJ, DeVries AC. 2011. Oxytocin mediates social neuroprotection after cerebral ischemia. Stroke 42:3606–3611. [DOI] [PMC free article] [PubMed] [Google Scholar]
- Kawasaki K, Glueck AC, Annicchiarico I, Papini MR. 2015. Function of the centromedial amygdala in reward devaluation and open field activity. Neuroscience 303:73–81. [DOI] [PubMed] [Google Scholar]
- Kovacs GL, Borthaiser Z, Telegdy G. 1985. Oxytocin reduces intravenous heroin self-administration in heroin-tolerant rats. Life Sci 37:17–26. [DOI] [PubMed] [Google Scholar]
- Kovacs GL, Sarnyai Z, Szabo G. 1998. Oxytocin and addiction: A review. Psychoneuroendocrinology 23:945–962. [DOI] [PubMed] [Google Scholar]
- Kuo J, Hariri OR, Micevych P. 2009. An interaction of oxytocin receptors with metabotropic glutamate receptors in hypothalamic astrocytes. J Neuroendocrinol 21:1001–1006. [DOI] [PMC free article] [PubMed] [Google Scholar]
- Lammel S, Hetzel A, Hackel O, Jones I, Liss B, Roeper J. 2008. Unique properties of mesoprefrontal neurons within a dual mesocorticolimbic dopamine system. Neuron 57:760–773. [DOI] [PubMed] [Google Scholar]
- Lammel S, Ion DI, Roeper J, Malenka RC. 2011. Projection-specific modulation of dopamine neuron synapses by aversive and rewarding stimuli. Neuron 70:855–862. [DOI] [PMC free article] [PubMed] [Google Scholar]
- Lammel S, Lim BK, Malenka RC. 2014. Reward and aversion in a heterogeneous midbrain dopamine system. Neuro-pharmacology 76:1–21. [DOI] [PMC free article] [PubMed] [Google Scholar]
- Lammel S, Steinberg EE, Foldy C, Wall NR, Beier K, Luo L, Malenka RC. 2015. Diversity of transgenic mouse models for selective targeting of midbrain dopamine neurons. Neuron 85:429–438. [DOI] [PMC free article] [PubMed] [Google Scholar]
- Lim MM, Murphy AZ, Young LJ. 2004. Ventral striatopallidal oxytocin and vasopressin V1a receptors in the monogamous prairie vole (microtus ochrogaster). J Comp Neurol 468:555–570. [DOI] [PubMed] [Google Scholar]
- Liu Y, Aragona BJ, Young KA, Dietz DM, Kabbaj M, Mazei-Robinson M, Nestler EJ, Wang Z. 2010. Nucleus accumbens dopamine mediates amphetamine-induced impairment of social bonding in a monogamous rodent species. Proc Natl Acad Sci U S A 107:1217–1222. [DOI] [PMC free article] [PubMed] [Google Scholar]
- Liu Y, Young KA, Curtis JT, Aragona BJ, Wang Z. 2011. Social bonding decreases the rewarding properties of amphet-amine through a dopamine D1 receptor-mediated mechanism. J Neurosci 31:7960–7966. [DOI] [PMC free article] [PubMed] [Google Scholar]
- Love TM. 2014. Oxytocin, motivation and the role of dopamine. Pharmacol Biochem Behav 119:49–60. [DOI] [PMC free article] [PubMed] [Google Scholar]
- MacFadyen K, Smith J, Wang L, de Kloet A, Krause EG, Peris J. 2014. Oxytocin inhibits ethanol intake possibly via a direct effect on mesolimbic dopamine neurons. Alcohol Clin Exp Ther 38:84A. [Google Scholar]
- MacFadyen K, Loveless R, DeLucca B, Wardley K, Deogan S, Thomas C, Peris J. 2016. Peripheral oxytocin administration reduces ethanol consumption in rats. Pharmcol Biochem Behav 140:27–32. [DOI] [PMC free article] [PubMed] [Google Scholar]
- Manning M, Misicka A, Olma A, Bankowski K, Stoev S, Chini B, Durrox T, Mouillac B, Corbani M, Guillon G. 2012. Oxytocin and vasopressin agonists and antagonists as research tools and potential therapeutics. J Neuroendocrinol 24:609–628. [DOI] [PMC free article] [PubMed] [Google Scholar]
- Maroun M, Wagner S. 2016. Oxytocin and memory of emotional stimuli: Some dance to remember, some dance to forget. Biol Psychiatry 79:203–212. [DOI] [PubMed] [Google Scholar]
- McGregor IS, Bowen MT. 2012. Breaking the loop: Oxytocin as a potential treatment for drug addiction. Horm Behav 61:331–339. [DOI] [PubMed] [Google Scholar]
- Melis MR, Melis T, Cocco C, Succu S, Sanna F, Pillolla G, Boi A, Ferri GL, Argiolas A. 2007. Oxytocin injected into the ventral tegmental area induces penile erection and increases extracellular dopamine in the nucleus accumbens and paraventricular nucleus of the hypothalamus of male rats. Eur J Neurosci 26:1026–1035. [DOI] [PubMed] [Google Scholar]
- Morales M, Root DH. 2014. Glutamate neurons within midbrain dopamine regions. Neuroscience 282:60–68. [DOI] [PMC free article] [PubMed] [Google Scholar]
- Mouillac B, Manning M, Durrox T. 2009. Fluorescent agonists and antagonists for vasopressin/oxytocin G protein-coupled receptors: Usefulness in ligand screening assays and receptor studies. Mini Rev Med Chem 8:996–1005. [DOI] [PMC free article] [PubMed] [Google Scholar]
- Omelchenko N, Sesack SR. 2009. Ultrastructural analysis of local collaterals of rat ventral tegmental area neurons: GABA phenotype and synapses onto dopamine and GABA cells. Synapse 63:895–906. [DOI] [PMC free article] [PubMed] [Google Scholar]
- Otero-Garcia M, Agustin-Pavon C, Lanuza E, Martinez Garcia F. 2015. Distribution of oxytocin and co-localization with arginine vasopressin in the brain of mice. Brain Struct Funct 221:3445–3473. [DOI] [PubMed] [Google Scholar]
- Pedersen CA, Smedley KL, Leseman J, Jarskog LF, Rau SW, Kampov-Polevoi A, Casey RL, Fender T, Garbutt JC. 2013. Intranasal oxytocin blocks alcohol withdrawal in human subjects. Alcohol Clin Exp Res 37:484–489. [DOI] [PMC free article] [PubMed] [Google Scholar]
- Peters ST, Bowen MT, Bohrer K, McGregor IS, Neumann ID. 2016. Oxytocin inhibits ethanol consumption and ethanol induced dopamine release in the nucleus accumbens. Addict Biol doi: 10.1111/adb.12362 [Epub ahead of print]. [DOI] [PubMed] [Google Scholar]
- Root DH, Mejias-Aponte CA, Zhang S, Wang HL, Hoffman AF, Lupica CR, Morales M. 2014a. Single rodent mesohabenular axons release glutamate and GABA. Nat Neurosci 17:1543–1551. [DOI] [PMC free article] [PubMed] [Google Scholar]
- Root DH, Meijas-Aponte CA, Jia Qi, Morales M. 2014b. Role of glutamatergic projections from ventral tegmental area to lateral habenula in aversive conditioning. J Neurosci 34: 13906–13910. [DOI] [PMC free article] [PubMed] [Google Scholar]
- Sanchez-Catalan MJ, Kaufling J, Georges F, Veinante P, Barrot M. 2014. The antero-posterior heterogeneity of the ventral tegmental area. Neuroscience 282:198–216. [DOI] [PubMed] [Google Scholar]
- Sarnyai Z, Kovacs GL. 2014. Oxytocin in learning and addiction: From early discoveries to the present. Pharmacol Biochem Behav 119:3–9. [DOI] [PubMed] [Google Scholar]
- Schultz W 2010. Multiple functions of dopamine neurons. F1000 Biol Rep 2:2. [DOI] [PMC free article] [PubMed] [Google Scholar]
- Shahrokh DK, Zhang TY, Diorio J, Gratton A, Meaney MJ. 2010. Oxytocin-dopamine interactions mediate variations in maternal behavior in the rat. Endocrinology 151:2276–2286. [DOI] [PMC free article] [PubMed] [Google Scholar]
- Stamatakis AM, Jennings JH, Ung RL, Blair GA, Weinberg RJ, Neve RL, Boyce F, Mattis J, Ramakrishnan C, Deisseroth K, Stuber GD. 2013. A unique population of ventral teg-mental area neurons inhibits the lateral habenula to promote reward. Neuron 80:1039–1053. [DOI] [PMC free article] [PubMed] [Google Scholar]
- Stuber GD, Hnasko TS, Britt JP, Edwards RH, Bonci A. 2010. Dopaminergic terminals in the nucleus accumbens but not the dorsal striatum corelease glutamate. J Neurosci 30:8229–8233. [DOI] [PMC free article] [PubMed] [Google Scholar]
- Stuber GD, Stamatakis AM, Kantak PA. 2015. Considerations when using cre-driver rodent lines for studying ventral tegmental circuitry. Neuron 85:439–445. [DOI] [PMC free article] [PubMed] [Google Scholar]
- Swanson LW. 1982. The projections of the ventral tegmental area and adjacent regions: A combined fluorescent retro-grade tracer and immunofluorescence study in the rat. Brain Res Bull 9:321–353. [DOI] [PubMed] [Google Scholar]
- Tang Y, Chen Z, Tao H, Li C, Zhang X, Tang A, Liu Y. 2014. Oxytocin activation of neurons in ventral tegmental area and interfascicular nucleus of mouse midbrain. Neuro-pharmacology 77:277–284. [DOI] [PubMed] [Google Scholar]
- Taylor SR, Badurek S, Dileone RJ, Nashimi R, Minichiello L, Picciotto MR. 2014. GABAergic and glutamatergic efferent of the mouse ventral tegmental area. J Comp Neurol 522:3308–3334. [DOI] [PMC free article] [PubMed] [Google Scholar]
- Tecuapetla F, Patel JC, Xenias H, English D, Tadros I, Shah F, Berlin J, Deisseroth K, Rice ME, Tepper JM, Koos T. 2010. Glutamatergic signaling by mesolimbic dopamine neurons in the nucleus accumbens. J Neurosci 3:7105–7110. [DOI] [PMC free article] [PubMed] [Google Scholar]
- Tops M, Koole SL, IJzerman H, Buisman-Pijlman FT. 2013. Why social attachment and oxytocin protect against addiction and stress: Insights from the dynamics between ventral and dorsal corticostriatal systems. Pharmacol Biochem Behav 119:39–48. [DOI] [PubMed] [Google Scholar]
- Tritsch NX, Ding JB, Sabatini BL. 2012. Dopaminergic neurons inhibit striatal output through non-canonical release of GABA. Nature 490:262–266. [DOI] [PMC free article] [PubMed] [Google Scholar]
- Westenbroek C, Perry AN, Jagannathan L, Becker JB. 2013. Oxytocin differentially affects the motivation to self-administer methamphetamine in isolated and pair housed female rats. Soc Neurosci Abstracts Program 62.08.
- Williams RW, Rakic P. 1988. Three-dimensional counting: An accurate and direct method to estimate numbers of cells in sectioned material. J Comp Neurol 278:344–352. [DOI] [PubMed] [Google Scholar]
- Yamaguchi T, Sheen W, Morales M. 2007. Glutamatergic neurons are present in the rat ventral tegmental area. Eur J Neurosci 25:106–118. [DOI] [PMC free article] [PubMed] [Google Scholar]
- Yamaguchi T, Wang HL, Li X, Ng TH, Morales M. 2011. Mesocorticolimbic glutamatergic pathway. J Neurosci 31: 8476–8490. [DOI] [PMC free article] [PubMed] [Google Scholar]
- Yamaguchi T, Qi J, Wang HL, Zhang S, Morales M. 2015. Glutamatergic and dopaminergic neurons in the mouse ventral tegmental area. Eur J Neurosci 41:760–772. [DOI] [PMC free article] [PubMed] [Google Scholar]
- Yetnikoff L, Lavezzi HN, Reichard RA, Zahm DS. 2014. An update on the connections of the ventral mesencephalic dopaminergic complex. Neuroscience 282:23–48. [DOI] [PMC free article] [PubMed] [Google Scholar]
- Young KA, Liu Y, Gobrogge KL, Wang H, Wang Z. 2014. Oxytocin reverses amphetamine-induced deficits in social bionding: Evidence for an interaction with nucleus accumbens dopamine. J Neurosci 34:8499–8506. [DOI] [PMC free article] [PubMed] [Google Scholar]