

Abstract
The authors performed a systematic review of the association of complement component 2(C2)/complement factor B (CFB) gene polymorphisms with age-related macular degeneration (AMD). In total, data from 19 studies published between 2006 and 2011 were pooled for 4 polymorphisms: rs9332739 and rs547154 in the C2 gene and rs4151667 and rs641153 in the CFB gene. Data extraction and assessments for risk of bias were independently performed by 2 reviewers. Allele frequencies and allele and genotypic effects were pooled. Heterogeneity and publication bias were explored. Pooled minor allele frequencies for all 4 SNPs were between 4.7% and 9.6% for all polymorphisms, except for an Indian population in which the C allele at rs9332739 was the major allele. For the C2 polymorphisms, the minor C allele at rs9332739 and the minor T allele at rs547154 carried estimated relative risks (odds ratios) of 0.55 (95% confidence interval (CI): 0.46, 0.65) and 0.47 (95% CI: 0.39, 0.57), respectively. For the CFB polymorphisms, the minor A alleles at rs4151667 and rs614153 carried estimated risks of 0.54 (95% CI: 0.45, 0.64) and 0.41 (95% CI: 0.34, 0.51), respectively. These allele effects contributed to an absolute lowering of the risk of all AMD in Caucasian populations by 2.0%–6.0%. This meta-analysis provides a robust estimate of the protective association of C2/CFB with AMD.
Keywords: complement component factor 2; complement factor B; genetic association studies; genetics; genome, human; macular degeneration; meta-analysis; molecular epidemiology
Editor's note : This article also appears on the website of the Human Genome Epidemiology Network (http://www.cdc.gov/genomics/hugenet/default.htm).
Age-related macular degeneration (AMD) is one of the leading causes of blindness worldwide (1–4), accounting for half of all new registered cases of blindness (5). With the increase in longevity, the burden of AMD is set to grow, with almost 30% of persons older than 75 years showing early signs of the disease (1, 6, 7). The pathologic hallmark of the disease is drusen, deposits of proteins and lipids, in the retinal pigment epithelium; these deposits, along with pigmentary irregularities, constitute early AMD. Progression to late AMD involves geographic atrophy, in which there is loss of retinal pigment epithelium and photoreceptors and/or neovascularization.
Genome-wide association studies have had considerable success in identifying genetic contributions to complex disorders. The first success in ocular diseases came in 2005, with the discovery of an association between polymorphic variation in the complement factor H gene (CFH) and AMD. Following this, other loci at 10q26, ARMS2/HTRA1 (8–12), were implicated, in addition to several genes involved in the complement pathway. The discovery of CFH variants and the alternative complement pathway in the pathophysiology of AMD subsequently led to the investigation of other complement factors, such as complement component 3 (C3) (13–30), complement component 2 (C2), and complement factor B (CFB) (13, 31–37). We previously performed a systematic review of C3 (38). The current review focuses on the C2 and CFB variants.
The C2 gene, located on 6p21.33, encodes a serum glycoprotein that functions as part of the classical complement pathway, which is involved in innate immunity and inflammation (Online Mendelian Inheritance in Man (OMIM) number 613927). Two polymorphisms (rs9332739 G > C and rs547154 G > T) have been implicated in AMD. The C2 polymorphisms may be associated directly with AMD or indirectly through the high level of linkage disequilibrium (LD) that exists between C2 and CFB, which is located downstream on the same chromosome (OMIM number 138470) and which contains additional variants that are also highly associated with AMD (33, 36), rs4151667 T > A and rs641153 G > A. Therefore, we conducted a systematic review to pool the results of all available population-based association studies on C2 (rs547154 and rs9332739), CFB (rs4151667 and rs641153), and AMD, with the following objectives:
To estimate the prevalence of the minor alleles of C2 and CFB.
To ascertain whether there are genetic associations with AMD susceptibility and, if so, to estimate the magnitude of those associations and the possible genetic modes of action.
MATERIALS AND METHODS
Search strategy
Studies were identified from the MEDLINE (US National Library of Medicine), EMBASE (Excerpta Medica Database; Elsevier B.V., Amsterdam, the Netherlands), and Scopus (SciVerse Scopus; Elsevier B.V.) databases using the PubMed, Ovid, and Scopus search engines up to June 18, 2011, by 1 reviewer (A. T.). Search strategies used for PubMed were as follows: (gene or allele or polymorphism) and (macular degeneration) and (“complement component 2” or “C2” or “complement factor 2”) or (“CFB” or “complement factor B”). Where there were multiple publications with the same subjects, the most complete and recent results were used. The reference lists of the selected articles were also reviewed to identify additional relevant publications. Details of other search strategies are described in the Appendix.
Inclusion criteria
Two reviewers (A. T. and M. M.) independently went through all titles and abstracts of the identified studies. Any human population-based association study, regardless of sample size, was included if it met the following criteria:
Genotyped C2 (rs547154 G > T and rs9332739 G > C) or CFB (rs4151667 T > A and rs641153 G > A) polymorphisms.
The outcome was AMD, and there was at least 1 comparison/control group.
There was sufficient description of the results—that is, numbers of subjects in genotype and outcome groups. Where eligible, the authors of articles with insufficient information were contacted, with a request for additional information. If they did not provide data after 2 contacts, those studies were excluded from our review.
Data extraction
Summary data for C2 and CFB were extracted independently by 2 reviewers (A. T. and M. M.) using a standardized data extraction form. Data on covariables such as mean age, percentage of males, percentage of smokers, and ethnicity were also extracted. Any disagreement was resolved by consensus.
Risk of bias assessment
The quality of studies was independently assessed by 2 reviewers (A. T. and M. M.) using a risk of bias assessment for genetic association studies, described in detail previously (38). Briefly, the assessment considered 5 domains: selection bias, information bias, confounding bias, multiple tests and selective reports, and assessment of Hardy-Weinberg equilibrium (HWE). Each item was classified with regard to risk of bias (“yes/no”) or as unclear if there was insufficient information to assess risk of bias (“unclear”).
Statistical analysis
Data in the control group of each study were used to assess HWE using an exact test. Genetic effects were stratified by ethnicity (Caucasian or Asian) and analyzed using 2 approaches, as described below (38, 39).
Per-allele approach
Suppose that g and G are minor and major alleles, respectively, and gg, Gg, and GG are minor homozygous, heterozygous, and common homozygous genotypes, respectively, for each polymorphism. A minor g allele frequency was estimated for each study, and data were then pooled using meta-analysis for pooling prevalence (40). Odds ratios for g alleles versus G alleles, along with 95% confidence intervals, were estimated. Heterogeneity of odds ratios across studies was assessed using a Q test, and the degree of heterogeneity was quantified using I2. If heterogeneity was present (i.e., if the Q test was significant or I2 was greater than 25%), the cause of heterogeneity was explored by fitting a covariable (e.g., age, percent male, or percent smokers) in a meta-regression model, when the data for these covariables were available (41–44).
Per-genotype approach
Two odds ratios (gg vs. GG, denoted odds ratio 1 (OR1), and Gg vs. GG, denoted odds ratio 2 (OR2)) were estimated for each study. Heterogeneity of odds ratios was assessed using the method mentioned previously. If there was heterogeneity in at least 1 of these odds ratios, the cause of heterogeneity was explored using meta-regression analysis. A mixed-effects hierarchical model with a logit link function (40) was applied to determine the overall gene effect using the xtmelogit command in STATA (StataCorp LP, College Station, Texas). The genotypes were considered in the model as fixed effects, whereas the study was considered a random effect. A likelihood ratio test was used to assess whether an overall gene effect was significant. Pooled odds ratios and 95% confidence intervals were then estimated from the mixed model.
The mode of genetic effect, measured by the parameter lambda (λ), which is defined as the ratio of log OR2 to log OR1, was then estimated using the model-free Bayesian approach (45). The value of lambda ranges from 0 to 1. If λ = 0, a recessive model is suggested; if λ = 1, a dominant model is suggested; and if λ = 0.5, a codominant model is suggested. If λ > 1 or λ < 0, then a homozygous or heterosis model is likely, although this is rare.
Sensitivity analyses were performed by including and excluding studies not in HWE. Publication bias (study-size effect) was assessed using the Egger test and contour-enhanced funnel plots (46–48). Trim-and-fill meta-analysis was applied to impute unidentified studies (49). The population attributable risk (PAR) for genotypes was calculated as in the papers by Hayden et al. (50) and Rossman et al. (51). Analyses were performed using STATA, version 11.1 (52), and WinBUGS 1.4.2 (53), with normal vague prior distributions for estimation of parameters (i.e., lambda and the odds ratio). The analyses were run with a burn-in of 1,000 iterations, followed by 10,000 iterations for parameter estimates. A P value less than 0.05 was considered statistically significant, except for tests of heterogeneity, where a level of 0.10 was used.
RESULTS
Identifying studies
A total of 59, 87, and 319 studies were located from MEDLINE, EMBASE, and Scopus (Figure 1), respectively. After removal of 110 duplicates, 355 titles or abstracts were screened, with 23 determined to be eligible. The full articles on the 23 remaining studies were reviewed; 4 studies were further excluded, leaving 19 studies for data extraction. Among the 19 included studies, 11 (57.9%) were identified in all 3 databases, 5 (26.3%) were identified through both MEDLINE and EMBASE, 2 (10.5%) were identified only in Scopus, and 1 (5.3%) was identified only in EMBASE. Sixteen studies had data on rs9332739 polymorphisms, 13 studies had data on rs547154, 14 studies had data on rs4151667, and 14 studies had data on rs641153. The characteristics of these 19 studies are given in Table 1.
Figure 1.
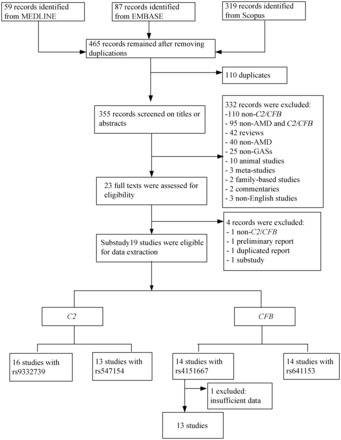
Selection of published studies (2006–2011) for a systematic review and meta-analysis of the association of complement component 2(C2)/complement factor B (CFB) gene polymorphisms with age-related macular degeneration (AMD). (GAS, genetic association study).
Table 1.
General Characteristics of Studies Included in a Systematic Review and Meta-Analysis of the Association of Complement Component 2(C2)/Complement Factor B (CFB) Gene Polymorphisms With Age-Related Macular Degeneration, 2006–2011a
| First Author, Year (Reference No.) | Mean Age, years | % Male | % Smokers | Study Design | Type of Case | Type of Control |
|---|---|---|---|---|---|---|
| Maller, 2006 (13) | 76.3 | 45.5 | Case-control | Advanced AMD | Non-AMD | |
| Gold, 2006 (32) | 73.6 | Matched case-control | AMD | Non-AMD | ||
| Spencer, 2007 (36) | 73.7 | 38.8 | 57.6 | Case-control | AMD grades 3–5 | AMD grade 1-2 |
| Chu, 2008 (56) | 67.1 | 54.8 | Matched case-control | Exudative AMD | Non-AMD | |
| Jakobsdottir, 2008 (33) | 76.2 | 43.7 | 43.3 | Case-control | 56%–66% GA and CNV | Non-AMD |
| Scholl, 2008 (26) | 73.5 | 43.6 | 47.5 | Case-control | 69.6% CNV | Non-AMD |
| Bergeron-Sawitzke, 2009 (15) | 65.4 | 45.7 | 46.5 | Age-, sex-, and race-matched case-control | AMD grades 3–5 | Non-AMD |
| Francis, 2009 (19)—AREDS | Cohort | GA/CNV | AMD grade 1 | |||
| Francis, 2009 (19)—CEIMDC | 76.7 | 33.2 | Case-control | GA/CNV | Drusen, <63 µm in diameter | |
| Farwick, 2009 (31) | 70.9 | 40.4 | 40.2 | Cross-sectional | 30.5% advanced AMD | Non-AMD |
| Goto, 2009 (20) | 73 | 54.8 | Matched case-control | Advanced AMD | Non-AMD | |
| Park, 2009 (22) | Cohort | Early and late (54.6%) | AMD grade 1 | |||
| Pei, 2009 (23) | 69.9 | 53 | 45.8 | Age- and sex-matched case-control | CNV | Non-AMD |
| Reynolds, 2009 (24) | 50 | 54.4 | Case-control | Grade 4 (GA)/5(CNV) in one or both eyes | AMD grade 1 in both eyes | |
| Richardson, 2009 (35) | 73.1 | 34.7 | Case-control | 71.7% advanced AMD | Drusen, <63 µm in diameter | |
| Seddon, 2009 (27) | Case-control | Advanced AMD | AMD grade 1 | |||
| Kaur, 2010 (37) | Matched case-control | |||||
| Liu, 2010 (55) | 64.2 | 45.4 | Age-matched case-control | 66.4% CNV and 33.6% drusen | Non-AMD | |
| McKay, 2009 (34) | 74.9 | 38.5 | Age-matched case-control | GA/CNV | Non-AMD | |
| Chen, 2011 (54) | 77.1 | 43.8 | 35.7 | Case-control | 38% GA and 72% CNV | Non-AMD |
Abbreviations: AMD, age-related macular degeneration; AREDS, Age-Related Eye Disease Study; CEIMDC, Casey Eye Institute Macular Degeneration Center; CNV, choroidal neovascularization; GA, geographic atrophy.
a For details on the AMD grading scale, see the AREDS website (https://web.emmes.com/study/areds/mop.htm) and the article by Seddon et al. (65).
Risk of bias assessment
As is shown in Web Table 1 (available on the Journal's website (http://aje.oxfordjournals.org/)), the criteria for diagnosis of early and late AMD and controls were clearly described for all included studies, and therefore the risk of ascertainment bias was low. The risk of bias was highest in the quality control for genotyping (unclear or not mentioned in 8 out of 19 studies, or 42.1%), followed by selective reporting (7/19, 36.8%) and not assessing HWE (5/19, 26.3%).
C2 rs9332739
In 16 studies, investigators assessed the association between rs9332739 and AMD (see Web Table 2). Among these, 14 studies were carried out among persons of European descent (13, 15, 19, 22, 24, 26, 27, 31–36, 54) and 2 were carried out in Asian populations (37, 55). HWE was assessed in the control groups and was met in all studies. Among the Caucasian studies, the pooled frequency of minor allele C was lower in AMD cases than in non-AMD populations, with frequencies of 2.5% (95% confidence interval (CI): 2.0, 3.0) and 4.8% (95% CI: 3.9, 5.6), respectively. The odds ratios were mildly heterogeneous (χ2 = 17.46 (14 df), P = 0.233, I2 = 19.8%), with a pooled odds ratio of 0.55 (95% CI: 0.46, 0.65), suggesting that the C allele was approximately half as frequent in the AMD group as in controls. The frequency of the C allele in the single Chinese population was very similar to that in Caucasians (approximately 2%), but it was the major allele in the single Indian population, at approximately 96%, and was more prevalent in cases than in controls.
Genotype frequencies in the AMD and control groups are shown in Table 2. The gene effects for OR1 (CC vs. GG) and OR2 (GC vs. GG), along with 95% confidence intervals, were plotted across studies in Caucasian populations (see Web Figure 1, parts A and B). OR1 was homogenous (χ2 = 2.33 (14 df), P = 1.00, I2 = 0%), whereas OR2 showed mild heterogeneity across studies (χ2 = 18.69 (14 df), P = 0.177, I2 = 25.1%). The mixed logit model yielded pooled estimates for OR1 and OR2 of 0.38 (95% CI: 0.14, 1.08) and 0.52 (95% CI: 0.45, 0.61), respectively, which suggested that persons with CC and GC genotypes had approximately 62% and 48% lower risks of AMD than persons with the GG genotype.
Table 2.
Frequencies of the Complement Component 2 (C2) rs9332739 Genotype in AMD and Control Groups and Genotype Effects of Studies Included in the Meta-Analysis, 2006–2011
| First Author, Year (Reference No.) | No. of Subjects |
Genotype Effect |
||||||||||
|---|---|---|---|---|---|---|---|---|---|---|---|---|
| AMD Group |
Non-AMD Group |
CC vs. GG |
GC vs. GG |
|||||||||
| CC | GC | GG | Total | CC | GC | GG | Total | OR1a | 95% CI | OR2 | 95% CI | |
| Caucasians | ||||||||||||
| Maller, 2006 (13) | 1 | 63 | 1,174 | 1,238 | 3 | 95 | 836 | 934 | 0.24 | 0.03, 2.29 | 0.47 | 0.34, 0.66 |
| Gold, 2006 (32) | 1 | 35 | 861 | 897 | 1 | 40 | 340 | 381 | 0.40 | 0.03, 6.33 | 0.19 | 0.12, 0.29 |
| Spencer, 2007 (36) | 1 | 40 | 657 | 698 | 1 | 27 | 254 | 282 | 0.39 | 0.02, 6.20 | 0.57 | 0.34, 0.95 |
| Jakobsdottir, 2008 (33) | 0 | 10 | 172 | 182 | 1 | 9 | 156 | 166 | 0.30 | 0.01, 7.48 | 1.01 | 0.40, 2.54 |
| Scholl, 2008 (26) | 0 | 7 | 105 | 112 | 0 | 5 | 62 | 67 | 0.59 | 0.01, 30.23 | 0.83 | 0.25, 2.72 |
| Bergeron-Sawitzke, 2009 (15) | 0 | 17 | 404 | 421 | 0 | 22 | 193 | 215 | 0.48 | 0.01, 24.20 | 0.37 | 0.19, 0.71 |
| Farwick, 2009 (31) | 2 | 35 | 767 | 804 | 0 | 7 | 95 | 102 | 0.62 | 0.03, 13.06 | 0.62 | 0.27, 1.43 |
| Francis, 2009 (19)—AREDS | 0 | 37 | 484 | 521 | 1 | 37 | 370 | 408 | 0.25 | 0.01, 6.28 | 0.76 | 0.48, 1.23 |
| Francis, 2009 (19)—CEIMDC | 0 | 6 | 392 | 398 | 0 | 20 | 256 | 276 | 0.65 | 0.01, 33.04 | 0.20 | 0.08, 0.49 |
| Park, 2009 (22) | 0 | 9 | 114 | 123 | 0 | 10 | 138 | 148 | 1.21 | 0.02, 61.44 | 1.09 | 0.43, 2.77 |
| Reynolds, 2009 (24) | 0 | 8 | 96 | 104 | 0 | 9 | 48 | 57 | 0.50 | 0.01, 25.72 | 0.44 | 0.16, 1.22 |
| Richardson, 2009 (35) | 0 | 23 | 494 | 517 | 0 | 11 | 146 | 157 | 0.30 | 0.01, 15.00 | 0.62 | 0.29, 1.30 |
| Seddon, 2009 (27) | 0 | 8 | 272 | 280 | 2 | 90 | 1,075 | 1,167 | 0.79 | 0.04, 16.55 | 0.35 | 0.17, 0.74 |
| McKay, 2009 (34) | 1 | 29 | 395 | 425 | 0 | 45 | 383 | 428 | 2.91 | 0.12, 71.63 | 0.62 | 0.38, 1.02 |
| Chen, 2011 (54) | 1 | 78 | 1,256 | 1,335 | 1 | 48 | 460 | 509 | 0.37 | 0.02, 5.87 | 0.60 | 0.41, 0.87 |
| Pooled data | 7 | 405 | 7,642 | 8,054 | 10 | 475 | 4,812 | 5,297 | 0.38 | 0.14, 1.08 | 0.52 | 0.45, 0.61 |
| Asians | ||||||||||||
| Kaur, 2010 (37) | 164 | 11 | 2 | 177 | 154 | 20 | 1 | 175 | 0.53 | 0.05, 5.93 | 0.28 | 0.02, 3.39 |
| Liu, 2010 (55) | 0 | 10 | 228 | 238 | 0 | 10 | 210 | 220 | 0.92 | 0.02, 46.64 | 0.95 | 0.39, 2.34 |
| Pooled data | 164 | 21 | 230 | 415 | 154 | 30 | 211 | 395 | 0.77 | 0.43, 1.38 | 0.54 | 0.46, 0.63 |
Abbreviations: AMD, age-related macular degeneration; AREDS, Age-Related Eye Disease Study; CEIMDC, Casey Eye Institute Macular Degeneration Center; CI, confidence interval; OR, odds ratio.
a Continuing correction was performed by adding 0.5 in all cells for OR1.
The estimated lambda value was 0.69 (95% CI: 0.37, 0.97), suggesting that a dominant or additive mode of effect was most likely. Publication bias was assessed for OR1 and OR2 using funnel plots, which suggested symmetry of gene effects for both odds ratios (see Web Figure 1, parts C and D) (for OR1, Egger test coefficient = 0.92 (standard error (SE), 0.66), P = 0.188; for OR2, Egger test coefficient = 0.23 (SE, 0.85), P = 0.789). Adding the 2 Asian studies yielded very similar results, with a lambda value of 0.71 (95% CI: 0.34, 0.99). Despite the C allele's being the major allele in the Indian population (37, 55), the direction of the association was still protective. Pooling only advanced AMD cases in 6 Caucasian studies yielded summary estimates of OR1 and OR2 of 0.22 (95% CI: 0.04, 1.10) and 0.52 (95% CI: 0.43,0.63), respectively.
C2 rs547154
Thirteen studies (13, 15, 19, 20, 22, 26, 31–33, 35–37, 55) were eligible for pooling of gene effects of the rs547154 polymorphism (see Web Table 3). Ten studies (15, 19, 22, 26, 31–33, 35, 36) were in Caucasians, and 3 studies (20, 37, 55) in Asians. The allele frequency in 1 Caucasian study (19) was not in HWE and was excluded from pooling. The pooled frequencies of the T allele in AMD and non-AMD populations were 4.6% (95% CI: 4.0, 5.2) and 9.0% (95% CI: 7.3, 10.8), respectively. The odds ratios (T vs. G) were moderately heterogeneous (χ2 = 13.12 (8 df), P = 0.108, I2 = 39.0%), with a pooled odds ratio of 0.47 (95% CI: 0.37, 0.60). This suggested that the T allele was about half as frequent in AMD cases as in controls. There was no evidence of publication bias (Egger test coefficient = 0.02, P = 0.986). Sensitivity analysis was performed by including the study which did not observe HWE; this yielded similar results, with a pooled odds ratio of 0.42 (95% CI: 0.32, 0.55). Subgroup analysis in advanced AMD cases was not performed because of insufficient data.
In Asian studies, the absolute frequency of the T allele in cases and controls was almost double that in Caucasians, with similar relative frequencies (pooled odds ratio = 0.48, 95% CI: 0.22, 1.05).
Genotype frequencies were characterized in the AMD and non-AMD groups separately by ethnicity (see Table 3). OR1 (TT vs. GG) was homogenous across studies (χ2 = 1.38 (8 df), P = 0.994, I2 = 0%), but OR2 (GT vs. GG) was moderately heterogeneous (χ2 = 13.47 (8 df), P = 0.097, I2 = 40.6%) (see Web Figure 2, parts A and B). A mixed-effects model was applied and resulted in pooled OR1 and OR2 estimates of 0.23 (95% CI: 0.11, 0.48) and 0.48 (95% CI: 0.42, 0.56), respectively, indicating that persons with the TT and GT genotypes had approximately 77% and 52% significantly lower risks of having AMD compared with persons with the GG genotype, respectively. The estimated lambda value was 0.53 (95% CI: 0.30, 0.93), which suggested that an additive model was most likely. Neither the Egger test nor the funnel plot suggested asymmetry of the funnel plot for OR1 (coefficient = 0.33 (SE, 29), P = 0.347) or OR2 (coefficient = −0.16 (SE, 1.14), P = 0.892) (see Web Figure 2, parts C and D). The gene effects in the 3 Asian studies were moderately to highly heterogeneous, with I2 values of 52.3% (χ2 = 4.19 (2 df), P = 0.123) and 82.8% (χ2 = 11.65 (2 df), P = 0.003) for OR1 and OR2, respectively. The pooled OR1 and OR2 were 0.32 (95% CI: 0.12, 0.83) and 0.40 (95% CI: 0.28, 0.56), respectively, which were similar to the associations in Caucasians.
Table 3.
Frequencies of the Complement Component 2 (C2) rs547154 Genotype in AMD and Control Groups and Genotype Effects of Studies Included in the Meta-Analysis, 2006–2011
| First Author, Year (Reference No.) | No. of Subjects |
Genotype Effect |
||||||||||
|---|---|---|---|---|---|---|---|---|---|---|---|---|
| AMD Group |
Non-AMD Group |
TT vs. GG |
GT vs. GG |
|||||||||
| TT | GT | GG | Total | TT | GT | GG | Total | OR1a | 95% CI | OR2 | 95% CI | |
| Caucasians | ||||||||||||
| Maller, 2006 (13) | 4 | 126 | 1,108 | 1,238 | 9 | 164 | 761 | 934 | 0.31 | 0.09, 0.99 | 0.53 | 0.41, 0.68 |
| Gold, 2006 (32) | 2 | 86 | 806 | 894 | 5 | 75 | 302 | 382 | 0.15 | 0.03, 0.78 | 0.43 | 0.31, 0.60 |
| Spencer, 2007 (36) | 2 | 66 | 630 | 698 | 4 | 55 | 223 | 282 | 0.18 | 0.03, 0.97 | 0.42 | 0.29, 0.63 |
| Jakobsdottir, 2008 (33) | 0 | 9 | 170 | 179 | 0 | 31 | 130 | 161 | 0.77 | 0.02, 38.83 | 0.22 | 0.10, 0.48 |
| Scholl, 2008 (26) | 0 | 6 | 106 | 112 | 0 | 10 | 57 | 67 | 0.54 | 0.01, 27.57 | 0.32 | 0.11, 0.93 |
| Bergeron-Sawitzke, 2009 (15) | 0 | 51 | 379 | 430 | 0 | 39 | 176 | 215 | 0.47 | 0.01, 23.53 | 0.61 | 0.39, 0.96 |
| Farwick, 2009 (31) | 0 | 60 | 609 | 669 | 0 | 5 | 83 | 88 | 0.14 | 0, 6.95 | 1.64 | 0.64, 4.19 |
| Francis, 2009 (19)b,c | 0 | 14 | 184 | 198 | 0 | 139 | 167 | 306 | 0.91 | 0.02, 46.01 | 0.09 | 0.05, 0.16 |
| Park, 2009 (22) | 1 | 31 | 354 | 386 | 1 | 26 | 133 | 160 | 0.38 | 0.02, 6.05 | 0.45 | 0.26, 0.78 |
| Richardson, 2009 (35) | 2 | 54 | 469 | 525 | 3 | 41 | 156 | 200 | 0.22 | 0.04, 1.34 | 0.44 | 0.28, 0.68 |
| Pooled data | 11 | 489 | 4,631 | 5,131 | 22 | 446 | 2,022 | 2,490 | 0.23 | 0.11, 0.48 | 0.48 | 0.42, 0.56 |
| Asians | ||||||||||||
| Goto, 2009 (20) | 2 | 7 | 89 | 98 | 4 | 28 | 158 | 190 | 0.89 | 0.16, 4.94 | 0.44 | 0.19, 1.06 |
| Kaur, 2010 (37) | 2 | 26 | 149 | 177 | 11 | 74 | 90 | 175 | 0.11 | 0.02, 0.51 | 0.21 | 0.13, 0.36 |
| Liu, 2010 (55) | 2 | 28 | 208 | 238 | 2 | 32 | 186 | 220 | 0.89 | 0.12, 6.41 | 0.78 | 0.45, 1.35 |
| Pooled data | 6 | 61 | 446 | 513 | 17 | 134 | 434 | 585 | 0.32 | 0.12, 0.83 | 0.40 | 0.28, 0.56 |
Abbreviations: AMD, age-related macular degeneration; CI, confidence interval; OR, odds ratio.
a Continuing correction was performed by adding 0.5 in all cells for OR1.
b Both subsamples (Age-Related Eye Disease Study and Casey Eye Institute Macular Degeneration Center) were included.
c Not included in pooling because of departure from Hardy-Weinberg equilibrium.
CFB rs4151667
Fourteen studies (13, 15, 19, 22, 23, 26, 31–35, 37, 55, 56) assessed the association between rs4151667 and AMD. After unsuccessful attempts to contact the authors, 1 study (56) was excluded because of insufficient data. Allele frequency data for the remaining 13 studies were characterized by ethnicity (see Web Table 4), and all studies observed HWE. The pooled frequencies of the A allele in the 10 Caucasian studies were 2.4% (95% CI: 2.1, 2.7) and 4.7% (95% CI: 4.4, 5.1) in AMD and non-AMD groups, respectively. The allele-effect odds ratios (A vs. T) were homogeneous across studies (χ2 = 7.20 (9 df), P = 0.616, I2 = 0%), with a pooled odds ratio of 0.54 (95% CI: 0.45, 0.64), suggesting that the A allele was approximately half as frequent in the AMD group as in controls. Allele frequencies in Asians were 2.4% (95% CI: 1.1, 3.6) and 3.5% (95% CI: 0.9, 6.0) in AMD and non-AMD groups, respectively—largely similar to Caucasians.
Genotype frequencies from the 13 studies are shown in Table 4. In the 10 Caucasian studies, genotypic effects for OR1 (AA vs. TT) and OR2 (AT vs. TT) were homogenous, with I2 values of 0% for both OR1 (χ2 = 3.16 (9 df), P = 0.957) and OR2 (χ2 = 7.19 (9 df), P = 0.618). The mixed-effects logit model yielded pooled estimates for OR1 and OR2 of 0.99 (95% CI: 0.28, 3.58) and 0.50 (95% CI: 0.42, 0.61), respectively, which suggested a nonsignificant risk association for the AA genotype (likely due to the outlier study by McKay et al. (34)) but a significant preventive association for the AT genotype when compared with the TT genotype (see Web Figure 3, parts A and B). The estimated lambda value was 0.70 (95% CI: 0.37, 0.98), suggesting that a dominant or additive effect was most likely. Neither the Egger test not the funnel plot suggested asymmetry of the funnel for either OR1 (coefficient = −0.14 (SE, 1.12), P = 0.509) or OR2 (coefficient = 0.51 (SE, 0.78), P = 0.530) (see Web Figure 3, parts C and D).
Table 4.
Frequencies of the Complement Factor B (CFB) rs4151667 Genotype in AMD and Control Groups and Genotype Effects of Studies Included in the Meta-Analysis, 2006–2011
| First Author, Year (Reference No.) | No. of Subjects |
Genotype Effect |
||||||||||
|---|---|---|---|---|---|---|---|---|---|---|---|---|
| AMD |
Non-AMD Group |
AA vs. TT |
AT vs. TT |
|||||||||
| AA | AT | TT | Total | AA | AT | TT | Total | OR1a | 95% CI | OR2 | 95% CI | |
| Caucasians | ||||||||||||
| Maller, 2006 (13) | 1 | 70 | 1,167 | 1,238 | 2 | 89 | 843 | 934 | 0.36 | 0.03, 3.99 | 0.57 | 0.41, 0.79 |
| Gold, 2006 (32) | 1 | 35 | 867 | 903 | 1 | 41 | 341 | 383 | 0.39 | 0.02, 6.31 | 0.34 | 0.21, 0.54 |
| Jakobsdottir, 2008 (33) | 0 | 10 | 168 | 178 | 1 | 10 | 156 | 167 | 0.31 | 0.01, 7.66 | 0.93 | 0.38, 2.29 |
| Scholl, 2008 (26) | 0 | 7 | 105 | 112 | 0 | 5 | 62 | 67 | 0.59 | 0.01, 30.23 | 0.83 | 0.25, 2.72 |
| Bergeron-Sawitzke, 2009 (15) | 0 | 17 | 404 | 421 | 0 | 22 | 193 | 215 | 0.48 | 0.01, 24.20 | 0.37 | 0.19, 0.71 |
| Farwick, 2009 (31) | 2 | 35 | 765 | 802 | 0 | 7 | 95 | 102 | 0.62 | 0.03, 13.09 | 0.62 | 0.27, 1.44 |
| Francis, 2009 (19)b | 0 | 6 | 191 | 197 | 0 | 11 | 150 | 161 | 0.79 | 0.02, 39.84 | 0.43 | 0.15, 1.18 |
| Park, 2009 (22) | 0 | 19 | 367 | 386 | 0 | 15 | 145 | 160 | 0.40 | 0.01, 20.05 | 0.50 | 0.25, 1.01 |
| Richardson, 2009 (35) | 0 | 23 | 497 | 520 | 0 | 12 | 150 | 162 | 0.30 | 0.01, 15.31 | 0.58 | 0.28, 1.19 |
| McKay, 2009 (34) | 3 | 23 | 399 | 425 | 0 | 45 | 383 | 428 | 6.72 | 0.35, 130.53 | 0.49 | 0.29, 0.83 |
| Pooled data | 7 | 245 | 4,930 | 5,182 | 4 | 257 | 2,518 | 2,779 | 0.99 | 0.28, 3.58 | 0.50 | 0.42, 0.61 |
| Asians | ||||||||||||
| Pei, 2009 (23) | 0 | 5 | 118 | 123 | 0 | 8 | 122 | 130 | 1.03 | 0.02, 52.53 | 0.65 | 0.21, 2.03 |
| Kaur, 2010 (37) | 1 | 12 | 164 | 177 | 1 | 20 | 154 | 175 | 0.94 | 0.06, 15.14 | 0.56 | 0.27, 1.19 |
| Liu, 2010 (55) | 0 | 8 | 230 | 238 | 0 | 7 | 213 | 220 | 0.93 | 0.02, 46.89 | 1.06 | 0.38, 2.97 |
| Pooled data | 1 | 25 | 512 | 538 | 1 | 35 | 489 | 525 | 0.96 | 0.06, 15.31 | 0.68 | 0.40, 1.16 |
Abbreviations: AMD, age-related macular degeneration; CI, confidence interval; OR, odds ratio.
a Continuing correction was performed by adding 0.5 in all cells for OR1.
b Both subsamples (Age-Related Eye Disease Study and Casey Eye Institute Macular Degeneration Center) were included.
Only 4 studies (13, 19, 22, 34) had data on advanced AMD cases. The AA and AT effects were homogeneous (for OR1, χ2 = 2.49 (3 df), P = 0.477, I2 = 0; for OR2, χ2 = 0.45 (3 df), P = 0.929, I2 = 0), with the pooled OR1 and OR2 being equal to 0.53 (95% CI: 0.41, 0.68) and 1.66 (95% CI: 0.30, 9.09), respectively; the discrepancy in the pooled OR2 was probably due to the outlier study by McKay et al. (34).
The genotyping effects in the 4 Asian studies were homogenous for both OR1 and OR2, with an I2 value of 0%. The pooled OR1 and OR2 were 0.96 (95% CI: 0.06, 15.31) and 0.68 (95% CI: 0.40, 1.16), respectively.
CFB rs641153
Fourteen studies (13, 23, 24, 26, 27, 31, 32, 34–37, 54–56) had data for the CFB rs641153 polymorphism. Of these, 10 studies (13, 24, 26, 27, 31, 32, 34–36, 54) were conducted in Caucasians, and 4 (23, 37, 55, 56) were conducted in Asians (see Web Table 5). All control groups were in HWE. Among the Caucasian studies, the pooled frequency of the A allele was 4.1% (95% CI: 3.1, 5.2) in AMD groups and 9.6% (95% CI: 7.9, 11.3) in non-AMD groups. The allele-effect odds ratios were moderately heterogeneous across studies (χ2 = 22.44 (8 df), P = 0.004, I2 = 59.9%). The pooled odds ratio (A vs. G) was 0.40 (95% CI: 0.31, 0.52); that is, having the A allele was less than half as frequent in AMD cases as in controls. The pooled absolute frequency of the A allele within the 4 Asian studies was slightly higher than that in Caucasians, but the relative frequency was very similar (OR = 0.55, 95% CI: 0.30, 1.02).
The odds ratios for genotypic effects, OR1 (AA vs. GG) and OR2 (GA vs. GG), were estimated for each study (see Table 5). Pooled estimates were homogenous for OR1 (χ2 = 1.42 (9 df), P = 0.998, I2 = 0%) but highly heterogeneous for OR2 (χ2 = 25.96 (9 df), P = 0.002, I2 = 65.3%) (see Web Figure 4, parts A and B). The mixed logit model yielded pooled OR1 and OR2 estimates of 0.26 (95% CI: 0.14, 0.48) and 0.42 (95% CI: 0.37, 0.48), respectively, indicating that persons with the AA and GA genotypes were at 74% and 58% lower risk of AMD, respectively, than those with the GG genotype. The estimated lambda value was 0.72 (95% CI: 0.44, 0.98), which suggested that a dominant or additive effect was more likely. The Egger test found no evidence of asymmetry of the funnels for either OR1 (coefficient = −0.10 (SE, 0.37), P = 0.790) or OR2 (coefficient = −1.87 (SE, 1.42), P = 0.226) (see Web Figure 4, parts C and D). The genotypic effects in advanced AMD cases were determined within 5 studies (13, 24, 27, 34, 54), which suggested a homogenous effect for OR1 (χ2 = 1.02 (4 df), P = 0.907, I2 = 0%) but a moderately heterogeneous effect for OR2 (χ2 = 7.60 (4 df), P = 0.107, I2 = 47.4%); the corresponding OR1 and OR2 were 0.27 (95% CI: 0.12, 0.59) and 0.45 (95% CI: 0.38, 0.53), respectively. There was no evidence of publication bias.
Table 5.
Frequencies of the Complement Factor B (CFB) rs641153 Genotype in AMD and Control Groups and Genotype Effects of Studies Included in the Meta-Analysis, 2006–2011
| First Author, Year (Reference No.) | No. of Subjects |
Genotype Effect |
||||||||||
|---|---|---|---|---|---|---|---|---|---|---|---|---|
| AMD |
Non-AMD Group |
AA vs. GG |
GA vs. GG |
|||||||||
| AA | GA | GG | Total | AA | GA | GG | Total | OR1a | 95% CI | OR2 | 95% CI | |
| Caucasians | ||||||||||||
| Maller, 2006 (13) | 3 | 106 | 1,129 | 1,238 | 10 | 171 | 753 | 934 | 0.20 | 0.06, 0.73 | 0.41 | 0.32, 0.53 |
| Gold, 2006 (32) | 2 | 52 | 497 | 551 | 3 | 53 | 213 | 269 | 0.29 | 0.05, 1.72 | 0.42 | 0.28, 0.64 |
| Spencer, 2007 (36) | 2 | 66 | 630 | 698 | 3 | 50 | 229 | 282 | 0.24 | 0.04, 1.46 | 0.48 | 0.32, 0.71 |
| Scholl, 2008 (26) | 0 | 6 | 106 | 112 | 0 | 10 | 57 | 67 | 0.54 | 0.01, 27.57 | 0.32 | 0.11, 0.93 |
| Farwick, 2009 (31) | 0 | 26 | 750 | 776 | 0 | 26 | 93 | 119 | 0.12 | 0.002, 6.32 | 0.12 | 0.07, 0.22 |
| Reynolds, 2009 (24) | 0 | 6 | 97 | 103 | 0 | 11 | 46 | 57 | 0.48 | 0.01, 24.41 | 0.26 | 0.09, 0.74 |
| Richardson, 2009 (35) | 2 | 54 | 473 | 529 | 3 | 41 | 155 | 199 | 0.22 | 0.04, 1.32 | 0.43 | 0.28, 0.67 |
| Seddon, 2009 (27) | 0 | 23 | 256 | 279 | 6 | 138 | 1,023 | 1,167 | 0.31 | 0.02, 5.47 | 0.67 | 0.42, 1.06 |
| McKay, 2009 (34) | 3 | 33 | 389 | 425 | 5 | 86 | 337 | 428 | 0.52 | 0.12, 2.19 | 0.33 | 0.22, 0.51 |
| Chen, 2011 (54) | 3 | 128 | 1,204 | 1,335 | 4 | 83 | 422 | 509 | 0.26 | 0.06, 1.18 | 0.54 | 0.40, 0.73 |
| Pooled data | 15 | 500 | 5,531 | 6,046 | 34 | 669 | 3,328 | 4,031 | 0.26 | 0.14, 0.48 | 0.42 | 0.37, 0.48 |
| Asians | ||||||||||||
| Chu, 2008 (56) | 1 | 30 | 113 | 144 | 4 | 32 | 90 | 126 | 0.20 | 0.02, 1.81 | 0.75 | 0.42, 1.32 |
| Pei, 2009 (23) | 0 | 18 | 105 | 123 | 0 | 18 | 112 | 130 | 1.07 | 0.02, 54.23 | 1.07 | 0.53, 2.16 |
| Kaur, 2010 (37) | 2 | 18 | 142 | 162 | 10 | 53 | 95 | 158 | 0.13 | 0.03, 0.62 | 0.23 | 0.13, 0.41 |
| Liu, 2010 (55) | 0 | 17 | 221 | 238 | 1 | 25 | 194 | 220 | 0.29 | 0.01, 7.23 | 0.60 | 0.31, 1.14 |
| Pooled data | 3 | 83 | 581 | 667 | 15 | 128 | 491 | 634 | 0.17 | 0.05, 0.59 | 0.55 | 0.41, 0.74 |
Abbreviations: AMD, age-related macular degeneration; CI, confidence interval; OR, odds ratio.
a Continuing correction was performed by adding 0.5 in all cells for OR1.
Pooling genotypic effects within the 4 Asian studies yielded estimates for OR1 and OR2 of 0.17 (95% CI: 0.05, 0.59) and 0.55 (95% CI: 0.41, 0.74), respectively—largely consistent with those seen in Caucasians.
DISCUSSION
We performed a systematic review and meta-analysis of the associations between C2 (rs9332739, rs547154) and CFB (rs4151667, rs641153) polymorphisms and AMD, including Caucasian subjects numbering 7,121–13,351 and Asian subjects numbering 810–1,301. The results suggest robust associations in Caucasians; that is, carriage of a minor allele of C or T in the C2 rs9332739 and C2 rs547154 polymorphisms decreases the risks of having AMD by approximately 45% and 53% relative to carriage of G and G major alleles, respectively. A similar trend was found for the CFB polymorphisms; carrying a minor allele A in rs4151667 and rs641153 decreased the risks of AMD by approximately 46% and 59%, respectively, relative to a major allele of T and G. The genetic mode of action could be additive or dominant for all polymorphisms. Sensitivity analyses, including and excluding studies not observing HWE, yielded similar results.
The minor C and T protective alleles of the C2 polymorphisms investigated here are quite rare in Caucasians, with frequencies of 4.8% and 9.0%, respectively. The minor protective alleles for the 2 CFB polymorphisms are equally rare, with frequencies of 4.7% and 9.6%, respectively. The pooled odds ratios for AMD for these corresponding alleles were 0.55, 0.47, 0.54, and 0.41, respectively, and the PARs were 2.0%, 5.0%, 2.2%, and 6.0%. This does not imply that these alleles are causally responsible for the association with AMD and, given the LD in this region, they are probably overlapping effects. Nevertheless, we can say that these C2/CFB polymorphisms together probably serve as a marker for an absolute lowering of the risk of all AMD in Caucasians by 2.0%–6.0%.
Genetic effects for both sets of polymorphisms were very similar across Caucasian and Asian ethnic groups represented in this meta-analysis, and is in accord with the findings of Ioannidis et al. (57). Allele frequencies differed only slightly across ethnic groups, except for the C2 rs9332739 polymorphism, in which the minor C allele frequency was dramatically higher in Indians than in Caucasians (37) (96% vs. 3%). Kaur et al. (37) confirmed that these results were verified by sequencing and hence do not represent a miscalled strand. This raises the possibility of the “flip-flop” phenomenon, in which varying LD structure between different populations leads to a flip in the direction of the allelic effect, presumably because the genotyped SNP is tagging the causative allele, and different marker alleles are in LD with the causative allele across different populations (58–60). However, the C allele in the Indian population was consistent in having a protective association, similar to other ethnic groups, which did not fit with the “flip-flop” phenomenon.
These genetic associations are very similar to the ones recently described in a meta-analysis of genome-wide association studies for AMD (61); the allele effect for C2 rs9332739 was 0.46, and the allele effect for CFB rs641153 was 0.54. These pooled estimates were derived from over 2,500 cases and over 4,100 controls, and the consistency of the results shows that this effect size is robust.
Multilocus associations
Although some studies had assessed compound genotype effects of the 2 SNPs in C2 and CFB, the way in which investigators had reported their data did not allow us to pool haplotype effects. Previous reports show nearly complete LD between C2 rs9332739 and CFB rs4151667 (r = 0.91–1.00) (32–34) and separately between C2 rs547154 and CFB rs641153 (r = 0.92–0.96) (35, 36), indicative of dependent genetic effects. Given that all 4 SNPs showed similar magnitudes of genetic effects, identification of functional causal variants from the existing data would be difficult and might require very diverse populations with smaller LD blocks to isolate functional regions. This is a timely reminder that distance is a poor proxy for LD; the 2 SNPs examined here in CFB are only 156 base pairs apart and are not in LD (r2 = 0.004), yet rs641153 in CFB is in complete LD with rs547154 in C2, which is 3,242 base pairs away (http://hapmap.ncbi.nlm.nih.gov/). Likewise, the 2 SNPs in C2, which are 7,134 base pairs apart, are not in LD (r2 = 0.004), but rs9332739 in C2 is in complete LD with rs 4151667 in CFB, which is 10,220 base pairs away.
The fact that 2 LD blocks are equally powerful markers for AMD risk but are independent of each other leads to the possibility that they are both tagging a causative SNP that is not in either LD block. Fine mapping or next-generation sequencing may shed more light on this possibility.
Burden of disease
The C2 and CFB polymorphisms analyzed here contribute only 2%–6% of the population risk of AMD. In terms of public health prevention, focusing on smoking cessation would carry a much greater benefit, with a PAR of 36.9% (34), and stronger genetic loci, such as CFH, carry a much greater PAR (i.e., 58.9%) (11). Some groups of researchers have combined the PAR of the 14 variants identified to obtain much larger and clinically useful estimates (61) in an attempt to develop a genetic risk score (27). Others have generated haplotypes, which is concordant with the evolving view that this could represent a more robust method of analysis (35).
Strengths and weaknesses
This study had a number of strengths. We followed a rigorous protocol of systematic review, identifying data from 3 different databases. Data extraction was carried out in duplicate. We pooled allele frequencies and genetic effects separately, as suggested by the guidelines of the Human Genome Epidemiology Network (62). We pooled effects using a model-free method, which allows the data to suggest which genetic mode of action might be at work. We thoroughly investigated heterogeneity and study-size effects and estimated the PAR. However, we could not assess haplotype effects, which would have required individual patient data or compound genotype summary data. Another potential drawback is that the majority of the studies were clinic-based case-control studies, which might have produced overestimation of the genetic association. This bias could be avoided through the use of population-based nested case-control studies, but these types of studies are few, because it is costly to perform examinations and fundus photographs on thousands of people to determine who has early signs of AMD. In addition, few people would have advanced AMD in such studies.
In summary, our meta-analysis provides evidence for an association between C2/CFB polymorphisms and AMD. Carriage of preventive alleles for C2 rs9332739 and rs547154 would decrease the risk of AMD in Caucasians by approximately 45% and 53%, respectively; carriage of preventive alleles for CFB rs415667 and rs641153 would decrease it by approximately 46% and 59%. These allele effects contribute to an absolute lowering of the risk of all AMD in general Caucasian populations by 2.0%–6.0%. Although these associations appear consistent in Caucasian and Asian ethnic groups, the data are still sparse, and further studies are required to estimate the effects in non-Caucasian ethnic groups with more precision. Early work indicates that these polymorphisms may affect binding affinities (e.g., between CFB and C3b (63, 64)), promoting or retarding the complement cascade; however, better understanding of the full functional implications of these alleles will require more research.
Supplementary Material
ACKNOWLEDGMENTS
Author affiliations: Section for Clinical Epidemiology and Biostatistics, Faculty of Medicine, Ramathibodi Hospital, Mahidol University, Bangkok, Thailand (Ammarin Thakkinstian); Centre for Clinical Epidemiology and Biostatistics, University of Newcastle, Newcastle, New South Wales, Australia (Mark McEvoy, John Attia); Centre for Public Health, Queen's University of Belfast, Belfast, United Kingdom (Usha Chakravarthy, Gareth J. McKay, Giuliana Silvestri); Brien Holden Eye Research Centre, L. V. Prasad Eye Institute, Hyderabad, India (Subhabrata Chakrabarti, Inderjeet Kaur); Department of Health Sciences Research, Mayo Clinic, Rochester, Minnesota (Euijung Ryu); Macular Degeneration Center, Casey Eye Institute, Oregon Health and Science University, Portland, Oregon (Peter Francis); Division of Molecular and Cellular Biology, National Institute of Sensory Organs, National Hospital Organization Tokyo Medical Center, Tokyo, Japan (Takeshi Iwata, Masakazu Akahori); Leibniz Institute of Arteriosclerosis Research, Münster, Germany (Astrid Arning); Institute of Molecular Biology, University of Oregon, Eugene, Oregon (Albert O. Edwards); Ophthalmic Epidemiology and Genetics Service, Department of Ophthalmology, Tufts University School of Medicine and Tufts Medical Center, Boston, Massachusetts (Johanna M. Seddon); and John Hunter Hospital and Hunter Medical Research Institute, Newcastle, New South Wales, Australia (John Attia).
Conflict of interest: none declared.
APPENDIX
Search strategy used for EMBASE (Ovid)
1. Gene
2. Allele
3. Polymorphism
4. Macular degeneration
5. Complement component 2
6. Complement factor 2
7. Component 2
8. C2
9. Complement factor B
10. Component B
11. CFB
12. FB
13. (1 OR 2 OR 3)
14. (5 OR 6 OR 7 OR 8)
15. (9 OR 10 OR 11 OR 12)
16. 13 AND 4 AND (14 OR 15)
Search strategy used for Scopus
[(ALL(“gene”) OR ALL(“allele”) OR ALL(“polymorphism”)] AND [ALL(“macular degeneration”)] AND [(ALL(“complement component 2”) OR ALL(“complement factor 2”) OR ALL(“c2”) OR ALL(“component 2”)] OR [ALL(“complement factor B”) OR ALL(“component B”) OR ALL(“cfb”) OR ALL(“bf”)] AND [LIMIT-TO(SUBJAREA, “MEDI”) OR LIMIT-TO(SUBJAREA, “BIOC”)] AND [EXCLUDE(SUBJAREA, “NEUR”) OR EXCLUDE(SUBJAREA, “IMMU”) OR EXCLUDE(SUBJAREA, “AGRI”)] AND [EXCLUDE(SUBJAREA, “MULT”) OR EXCLUDE(SUBJAREA, “PHAR”) OR EXCLUDE(SUBJAREA, “CHEM”)].
REFERENCES
- 1.Klein ML, Schultz DW, Edwards A, et al. Age-related macular degeneration: clinical features in a large family and linkage to chromosome 1q. Arch Ophthalmol. 1998;116(8):1082–1088. doi: 10.1001/archopht.116.8.1082. [DOI] [PubMed] [Google Scholar]
- 2.Mitchell P, Smith W, Attebo K, et al. Prevalence of age-related maculopathy in Australia. The Blue Mountains Eye Study. Ophthalmology. 1995;102(10):1450–1460. doi: 10.1016/s0161-6420(95)30846-9. [DOI] [PubMed] [Google Scholar]
- 3.Pang CP, Baum L, Chan WM, et al. The apolipoprotein E ε4 allele is unlikely to be a major risk factor of age-related macular degeneration in Chinese. Ophthalmologica. 2000;214(4):289–291. doi: 10.1159/000027506. [DOI] [PubMed] [Google Scholar]
- 4.VanNewkirk MR, Nanjan MB, Wang JJ, et al. The prevalence of age-related maculopathy: the Visual Impairment Project. Ophthalmology. 2000;107(8):1593–1600. doi: 10.1016/s0161-6420(00)00175-5. [DOI] [PubMed] [Google Scholar]
- 5.Evans J, Wormald R. Is the incidence of registrable age-related macular degeneration increasing? Br J Ophthalmol. 1996;80(1):9–14. doi: 10.1136/bjo.80.1.9. [DOI] [PMC free article] [PubMed] [Google Scholar]
- 6.Schmidt S, Klaver C, Saunders A, et al. A pooled case-control study of the apolipoprotein E (APOE) gene in age-related maculopathy. Ophthalmic Genet. 2002;23(4):209–223. doi: 10.1076/opge.23.4.209.13883. [DOI] [PubMed] [Google Scholar]
- 7.Vingerling JR, Dielemans I, Hofman A, et al. The prevalence of age-related maculopathy in the Rotterdam Study. Ophthalmology. 1995;102(2):205–210. doi: 10.1016/s0161-6420(95)31034-2. [DOI] [PubMed] [Google Scholar]
- 8.Rivera A, Fisher SA, Fritsche LG, et al. Hypothetical LOC387715 is a second major susceptibility gene for age-related macular degeneration, contributing independently of complement factor H to disease risk. Hum Mol Genet. 2005;14(21):3227–3236. doi: 10.1093/hmg/ddi353. [DOI] [PubMed] [Google Scholar]
- 9.Conley YP, Jakobsdottir J, Mah T, et al. CFH, ELOVL4, PLEKHA1 and LOC387715 genes and susceptibility to age-related maculopathy: AREDS and CHS cohorts and meta-analyses. Hum Mol Genet. 2006;15(21):3206–3218. doi: 10.1093/hmg/ddl396. [DOI] [PubMed] [Google Scholar]
- 10.Despriet DD, Klaver CC, Witteman JC, et al. Complement factor H polymorphism, complement activators, and risk of age-related macular degeneration. JAMA. 2006;296(3):301–309. doi: 10.1001/jama.296.3.301. [DOI] [PubMed] [Google Scholar]
- 11.Thakkinstian A, Han P, McEvoy M, et al. Systematic review and meta-analysis of the association between complement factor H Y402H polymorphisms and age-related macular degeneration. Hum Mol Genet. 2006;15(18):2784–2790. doi: 10.1093/hmg/ddl220. [DOI] [PubMed] [Google Scholar]
- 12.Kaur I, Katta S, Hussain A, et al. Variants in the 10q26 gene cluster (LOC387715 and HTRA1) exhibit enhanced risk of age-related macular degeneration along with CFH in Indian patients. Invest Ophthalmol Vis Sci. 2008;49(5):1771–1776. doi: 10.1167/iovs.07-0560. [DOI] [PubMed] [Google Scholar]
- 13.Maller J, George S, Purcell S, et al. Common variation in three genes, including a noncoding variant in CFH, strongly influences risk of age-related macular degeneration. Nat Genet. 2006;38(9):1055–1059. doi: 10.1038/ng1873. [DOI] [PubMed] [Google Scholar]
- 14.Maller JB, Fagerness JA, Reynolds RC, et al. Variation in complement factor 3 is associated with risk of age-related macular degeneration. Nat Genet. 2007;39(10):1200–1201. doi: 10.1038/ng2131. [DOI] [PubMed] [Google Scholar]
- 15.Bergeron-Sawitzke J, Gold B, Olsh A, et al. Multilocus analysis of age-related macular degeneration. Eur J Hum Genet. 2009;17(9):1190–1199. doi: 10.1038/ejhg.2009.23. [DOI] [PMC free article] [PubMed] [Google Scholar]
- 16.Cui L, Zhou H, Yu J, et al. Noncoding variant in the complement factor H gene and risk of exudative age-related macular degeneration in a Chinese population. Invest Ophthalmol Vis Sci. 2010;51(2):1116–1120. doi: 10.1167/iovs.09-4265. [DOI] [PubMed] [Google Scholar]
- 17.Despriet DD, van Duijn CM, Oostra BA, et al. Complement component C3 and risk of age-related macular degeneration. Ophthalmology. 2009 doi: 10.1016/j.ophtha.2008.09.055. 116(3):474.e2–480.e2. [DOI] [PubMed] [Google Scholar]
- 18.Edwards AO, Fridley BL, James KM, et al. Evaluation of clustering and genotype distribution for replication in genome wide association studies: the Age-Related Eye Disease Study. PLoS One. 2008;3(11):e3813. doi: 10.1371/journal.pone.0003813. () [DOI] [PMC free article] [PubMed] [Google Scholar]
- 19.Francis PJ, Hamon SC, Ott J, et al. Polymorphisms in C2, CFB and C3 are associated with progression to advanced age related macular degeneration associated with visual loss. J Med Genet. 2009;46(5):300–307. doi: 10.1136/jmg.2008.062737. [DOI] [PubMed] [Google Scholar]
- 20.Goto A, Akahori M, Okamoto H, et al. Genetic analysis of typical wet-type age-related macular degeneration and polypoidal choroidal vasculopathy in Japanese population. J Ocul Biol Dis Infor. 2009;2(4):164–175. doi: 10.1007/s12177-009-9047-1. [DOI] [PMC free article] [PubMed] [Google Scholar]
- 21.Gu J, Pauer GJ, Yue X, et al. Assessing susceptibility to age-related macular degeneration with proteomic and genomic biomarkers. Mol Cell Proteomics. 2009;8(6):1338–1349. doi: 10.1074/mcp.M800453-MCP200. [DOI] [PMC free article] [PubMed] [Google Scholar]
- 22.Park KH, Fridley BL, Ryu E, et al. Complement component 3 (C3) haplotypes and risk of advanced age-related macular degeneration. Invest Ophthalmol Vis Sci. 2009;50(7):3386–3393. doi: 10.1167/iovs.08-3231. [DOI] [PubMed] [Google Scholar]
- 23.Pei XT, Li XX, Bao YZ, et al. Association of c3 gene polymorphisms with neovascular age-related macular degeneration in a Chinese population. Curr Eye Res. 2009;34(8):615–622. doi: 10.1080/02713680903003484. [DOI] [PubMed] [Google Scholar]
- 24.Reynolds R, Hartnett ME, Atkinson JP, et al. Plasma complement components and activation fragments: associations with age-related macular degeneration genotypes and phenotypes. Invest Ophthalmol Vis Sci. 2009;50(12):5818–5827. doi: 10.1167/iovs.09-3928. [DOI] [PMC free article] [PubMed] [Google Scholar]
- 25.Scholl HP, Fleckenstein M, Fritsche LG, et al. CFH, C3 and ARMS2 are significant risk loci for susceptibility but not for disease progression of geographic atrophy due to AMD. PLoS One. 2009;4(10):e7418. doi: 10.1371/journal.pone.0007418. () [DOI] [PMC free article] [PubMed] [Google Scholar]
- 26.Scholl HP, Charbel Issa P, Walier M, et al. Systemic complement activation in age-related macular degeneration. PLoS One. 2008;3(7):e2593. doi: 10.1371/journal.pone.0002593. () [DOI] [PMC free article] [PubMed] [Google Scholar]
- 27.Seddon JM, Reynolds R, Maller J, et al. Prediction model for prevalence and incidence of advanced age-related macular degeneration based on genetic, demographic, and environmental variables. Invest Ophthalmol Vis Sci. 2009;50(5):2044–2053. doi: 10.1167/iovs.08-3064. [DOI] [PMC free article] [PubMed] [Google Scholar]
- 28.Seitsonen SP, Onkamo P, Peng G, et al. Multifactor effects and evidence of potential interaction between complement factor H Y402H and LOC387715 A69S in age-related macular degeneration. PLoS One. 2008;3(12):e3833. doi: 10.1371/journal.pone.0003833. () [DOI] [PMC free article] [PubMed] [Google Scholar]
- 29.Spencer KL, Olson LM, Anderson BM, et al. C3 R102G polymorphism increases risk of age-related macular degeneration. Hum Mol Genet. 2008;17(12):1821–1824. doi: 10.1093/hmg/ddn075. [DOI] [PMC free article] [PubMed] [Google Scholar]
- 30.Yates JR, Sepp T, Matharu BK, et al. Complement C3 variant and the risk of age-related macular degeneration. N Engl J Med. 2007;357(6):553–561. doi: 10.1056/NEJMoa072618. [DOI] [PubMed] [Google Scholar]
- 31.Farwick A, Dasch B, Weber BH, et al. Variations in five genes and the severity of age-related macular degeneration: results from the Muenster Aging and Retina Study. Eye (Lond) 2009;23(12):2238–2244. doi: 10.1038/eye.2008.426. [DOI] [PubMed] [Google Scholar]
- 32.Gold B, Merriam JE, Zernant J, et al. Variation in factor B (BF) and complement component 2 (C2) genes is associated with age-related macular degeneration. Nat Genet. 2006;38(4):458–462. doi: 10.1038/ng1750. [DOI] [PMC free article] [PubMed] [Google Scholar]
- 33.Jakobsdottir J, Conley YP, Weeks DE, et al. C2 and CFB genes in age-related maculopathy and joint action with CFH and LOC387715 genes. PLoS One. 2008;3(5):e2199. doi: 10.1371/journal.pone.0002199. () [DOI] [PMC free article] [PubMed] [Google Scholar]
- 34.McKay GJ, Silvestri G, Patterson CC, et al. Further assessment of the complement component 2 and factor B region associated with age-related macular degeneration. Invest Ophthalmol Vis Sci. 2009;50(2):533–539. doi: 10.1167/iovs.08-2275. [DOI] [PubMed] [Google Scholar]
- 35.Richardson AJ, Amirul Islam FM, Guymer RH, et al. Analysis of rare variants in the complement component 2 (C2) and factor B (BF) genes refine association for age-related macular degeneration (AMD) Invest Ophthalmol Vis Sci. 2009;50(2):540–543. doi: 10.1167/iovs.08-2423. [DOI] [PubMed] [Google Scholar]
- 36.Spencer KL, Hauser MA, Olson LM, et al. Protective effect of complement factor B and complement component 2 variants in age-related macular degeneration. Hum Mol Genet. 2007;16(16):1986–1992. doi: 10.1093/hmg/ddm146. [DOI] [PubMed] [Google Scholar]
- 37.Kaur I, Katta S, Reddy RK, et al. The involvement of complement factor B and complement component C2 in an Indian cohort with age-related macular degeneration. Invest Ophthalmol Vis Sci. 2010;51(1):59–63. doi: 10.1167/iovs.09-4135. [DOI] [PubMed] [Google Scholar]
- 38.Thakkinstian A, McKay GJ, McEvoy M, et al. Systematic review and meta-analysis of the association between complement component 3 and age-related macular degeneration: a HuGE review and meta-analysis. Am J Epidemiol. 2011;173(12):1365–1379. doi: 10.1093/aje/kwr025. [DOI] [PubMed] [Google Scholar]
- 39.Thakkinstian A, Thompson JR, Minelli C, et al. Choosing between per-genotype, per-allele, and trend approaches for initial detection of gene-disease association. J Appl Stats. 2009;36(6):633–646. [Google Scholar]
- 40.Thakkinstian A, McEvoy M, Minelli C, et al. Systematic review and meta-analysis of the association between β2-adrenoceptor polymorphisms and asthma: a HuGE review. Am J Epidemiol. 2005;162(3):201–211. doi: 10.1093/aje/kwi184. [DOI] [PubMed] [Google Scholar]
- 41.Thompson JR, Minelli C, Abrams KR, et al. Meta-analysis of genetic studies using Mendelian randomization—a multivariate approach. Stat Med. 2005;24(14):2241–2254. doi: 10.1002/sim.2100. [DOI] [PubMed] [Google Scholar]
- 42.Thompson SG. Why sources of heterogeneity in meta-analysis should be investigated. BMJ. 1994;309(6965):1351–1355. doi: 10.1136/bmj.309.6965.1351. [DOI] [PMC free article] [PubMed] [Google Scholar]
- 43.Thompson SG, Sharp SJ. Explaining heterogeneity in meta-analysis: a comparison of methods. Stat Med. 1999;18(20):2693–2708. doi: 10.1002/(sici)1097-0258(19991030)18:20<2693::aid-sim235>3.0.co;2-v. [DOI] [PubMed] [Google Scholar]
- 44.Thompson SG, Smith TC, Sharp SJ. Investigating underlying risk as a source of heterogeneity in meta-analysis. Stat Med. 1997;16(23):2741–2758. doi: 10.1002/(sici)1097-0258(19971215)16:23<2741::aid-sim703>3.0.co;2-0. [DOI] [PubMed] [Google Scholar]
- 45.Minelli C, Thompson JR, Abrams KR, et al. The choice of a genetic model in the meta-analysis of molecular association studies. Int J Epidemiol. 2005;34(6):1319–1328. doi: 10.1093/ije/dyi169. [DOI] [PubMed] [Google Scholar]
- 46.Egger M, Davey Smith G, Schneider M, et al. Bias in meta-analysis detected by a simple, graphical test. BMJ. 1997;315(7109):629–634. doi: 10.1136/bmj.315.7109.629. [DOI] [PMC free article] [PubMed] [Google Scholar]
- 47.Palmer TM, Peter JL, Sutton AJ, et al. Contour-enhanced funnel plots in meta-analysis. STATA J. 2008;8(2):242–254. [Google Scholar]
- 48.Peters JL, Sutton AJ, Jones DR, et al. Contour-enhanced meta-analysis funnel plots help distinguish publication bias from other causes of asymmetry. J Clin Epidemiol. 2008;61(10):991–996. doi: 10.1016/j.jclinepi.2007.11.010. [DOI] [PubMed] [Google Scholar]
- 49.Duval S, Tweedie R. Trim and fill: a simple funnel-plot-based method of testing and adjusting for publication bias in meta-analysis. Biometrics. 2000;56(2):455–463. doi: 10.1111/j.0006-341x.2000.00455.x. [DOI] [PubMed] [Google Scholar]
- 50.Hayden KM, Zandi PP, Lyketsos CG, et al. Apolipoprotein E genotype and mortality: findings from the Cache County Study. J Am Geriatr Soc. 2005;53(6):935–942. doi: 10.1111/j.1532-5415.2005.53301.x. [DOI] [PubMed] [Google Scholar]
- 51.Rossman MD, Thompson B, Frederick M, et al. HLA-DRB1*1101: a significant risk factor for sarcoidosis in blacks and whites. Am J Hum Genet. 2003;73(4):720–735. doi: 10.1086/378097. [DOI] [PMC free article] [PubMed] [Google Scholar]
- 52.StataCorp LP. Stata Statistical Software: Release 11.0. College Station, TX: StataCorp LP; 2009. [Google Scholar]
- 53.Spiegelhalter D, Thomas A, Best N, et al. WinBUGS User Manual. Cambridge, United Kingdom: MRC Biostatistics Unit, Institute of Public Health, University of Cambridge; 2007. [Google Scholar]
- 54.Chen Y, Zeng J, Zhao C, et al. Assessing susceptibility to age-related macular degeneration with genetic markers and environmental factors. Arch Ophthalmol. 2011;129(3):344–351. doi: 10.1001/archophthalmol.2011.10. [DOI] [PMC free article] [PubMed] [Google Scholar]
- 55.Liu X, Zhao P, Tang S, et al. Association study of complement factor H, C2, CFB, and C3 and age-related macular degeneration in a Han Chinese population. Retina. 2010;30(8):1177–1184. doi: 10.1097/IAE.0b013e3181cea676. [DOI] [PubMed] [Google Scholar]
- 56.Chu J, Zhou CC, Lu N, et al. Genetic variants in three genes and smoking show strong associations with susceptibility to exudative age-related macular degeneration in a Chinese population. Chin Med J (Engl) 2008;121(24):2525–2533. [PubMed] [Google Scholar]
- 57.Ioannidis JP, Ntzani EE, Trikalinos TA. ‘Racial’ differences in genetic effects for complex diseases. Nat Genet. 2004;36(12):1312–1318. doi: 10.1038/ng1474. [DOI] [PubMed] [Google Scholar]
- 58.Clarke GM, Cardon LR. Aspects of observing and claiming allele flips in association studies. Genet Epidemiol. 2010;34(3):266–274. doi: 10.1002/gepi.20458. [DOI] [PubMed] [Google Scholar]
- 59.Zaykin DV, Shibata K. Genetic flip-flop without an accompanying change in linkage disequilibrium [letter] Am J Hum Genet. 2008;82(3):794–796. doi: 10.1016/j.ajhg.2008.02.001. [DOI] [PMC free article] [PubMed] [Google Scholar]
- 60.Lin PI, Vance JM, Pericak-Vance MA, et al. No gene is an island: the flip-flop phenomenon. Am J Hum Genet. 2007;80(3):531–538. doi: 10.1086/512133. [DOI] [PMC free article] [PubMed] [Google Scholar]
- 61.Yu Y, Bhangale TR, Fagerness J, et al. Common variants near FRK/COL10A1 and VEGFA are associated with advanced age-related macular degeneration. Hum Mol Genet. 2011;20(18):3699–3709. doi: 10.1093/hmg/ddr270. [DOI] [PMC free article] [PubMed] [Google Scholar]
- 62.Little J, Higgins J, editors. The HuGENet™ HuGE Review Handbook, Version 1.0. Ottawa, Ontario, Canada: University of Ottawa; 2006. [Google Scholar]
- 63.Heurich M, Martínez-Barricarte R, Francis NJ, et al. Common polymorphisms in C3, factor B, and factor H collaborate to determine systemic complement activity and disease risk. Proc Natl Acad Sci U S A. 2011;108(21):8761–8766. doi: 10.1073/pnas.1019338108. [DOI] [PMC free article] [PubMed] [Google Scholar]
- 64.Montes T, Tortajada A, Morgan BP, et al. Functional basis of protection against age-related macular degeneration conferred by a common polymorphism in complement factor B. Proc Natl Acad Sci U S A. 2009;106(11):4366–4371. doi: 10.1073/pnas.0812584106. [DOI] [PMC free article] [PubMed] [Google Scholar]
- 65.Seddon JM, Sharma S, Adelman RA. Evaluation of the Clinical Age-Related Maculopathy Staging System. Ophthalmology. 2006;113(2):260–266. doi: 10.1016/j.ophtha.2005.11.001. [DOI] [PubMed] [Google Scholar]
Associated Data
This section collects any data citations, data availability statements, or supplementary materials included in this article.