Abstract
Mass spectrometry has played a critical role in the identification and quantitation of neutral lipids such as cholesteryl esters and triacylglycerols present in biological extracts. Various strategies have emerged in order to carry out such lipidomics studies since a large number of neutral lipid molecular species exist in tissues. These include both shotgun approaches as well as those engaging liquid chromatographic separation of species prior to mass spectrometric analysis. Nonetheless challenges remain at every level of the lipidomics experiment, including extraction of lipids, identification of specific species, and quantitation of the vast array of lipids present in the sample extract. Unambiguous identification of molecular species present (qualitative analysis) as well as precise quantitation remains as significant challenges. The relative quantitation enables quite accurate assessment of fold changes of complex lipid species without exact quantitation. The availability of reference standard material as well as relevant internal standards continue to be limited.
Introduction
Neutral lipids are a diverse family of naturally occurring and abundant lipids present in all cells. For example of the three most abundant lipids circulating in human plasma, two neutral lipids classes, cholesteryl esters (CE) and triacylglycerols (TG), are present in amounts at 1–2 millimoles per liter (1). Interestingly these molecules are not soluble in water but are carried in plasma within lipoprotein particles such as chylomicrons and low-density lipoproteins. Abundant CE and TG are also found within a subcellular organelle called the lipid droplet present in virtually all cells (2). Additional neutral lipids include diacylglycerols, monoacylglycerols, wax esters (esters of long-chain fatty acids with long chain fatty alcohols), as well as endocannabinoids such as anandamide, and other primary fatty acyl amides of ethanolamine and neurotransmitter N-acyl amides (3). Other neutral lipids found in biology include prenol lipids such as farensol, ubiquinones, and dolichols, and fatty aldehydes such as retinal, as well as the hydrocarbon squalene, which is quite abundant in hair follicles (4) but also is the biochemical precursor of the large class of compounds classified as sterols and steroids. Numerous sterols, as well as cholesterol itself, are neutral lipids. All of these neutral lipids play important roles in biochemistry and are essential components of the living organism. Each neutral lipid is the product of multiple enzymatic reactions and thus abundance within a cell is influenced by gene expression as well as gene polymorphism.
The mass spectrometry of neutral lipids has been studied in varying depth (5). The CE, TG, sterols, and endocannabinoids have been the most widely examined species using various forms of mass spectrometry. A challenge in the analysis of these charge-neutral compounds is that ionization is required as a critical event prior to mass spectrometric analysis. For most neutral lipids the formation of positive ions through cationization is the most commonly used ionization process. Electrospray ionization can be used to form adducts such as [M+NH4]+ or [M+ alkali metal ion]+ as a relatively efficient process, depending on the cations present in the electrospray solution, LC mobile phase, or biofluid extract in a direct infusion experiment. For aqueous insoluble lipids, these charging cations can be added post LC column or to the infusion solvent system. Ionization efficiency is a property of each neutral lipid class as well as individual molecular species within each class adding further complications. Some neutral lipids such as the estrogen steroids (estradiol and estriol) as well as aldosterone efficiently form negative ions due to uniquely acidic protons that can be ionized at pHs easily achieved in LC mobile phases. I will restrict this review to the challenges encountered in the analysis of positive ions derived from the common CE and TG molecular species as archetypal examples of abundant neutral lipids.
Each of the ionized forms of neutral lipids have their own unique behavior when collisionally activated in the MS/MS experiment of a tandem mass spectrometer (6). Highly efficient decomposition reactions are observed for the ammonium attachment ions of lipid esters, while the sodiated adducts are very difficult to decompose unless higher collision energies are employed (7). Tandem mass spectrometry is engaged when molecular species identification of neutral lipids is desired either in combination with liquid chromatography or in direct analysis without prior separation of closely related lipids. Quantitation of neutral lipids can be another important outcome of a lipidomics experiment and has additional challenges as discussed below.
Tandem Mass Spectrometry of Neutral Lipids (Qualitative Analysis)
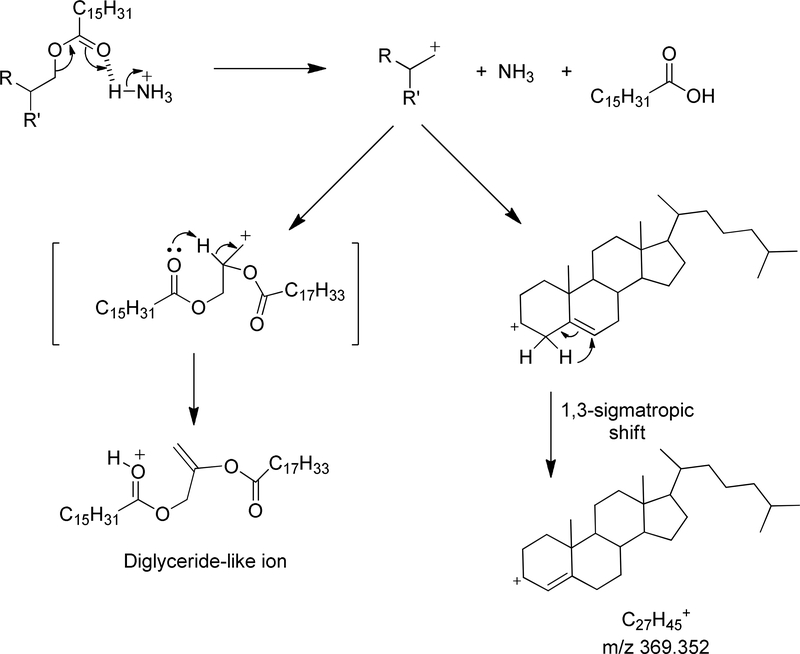
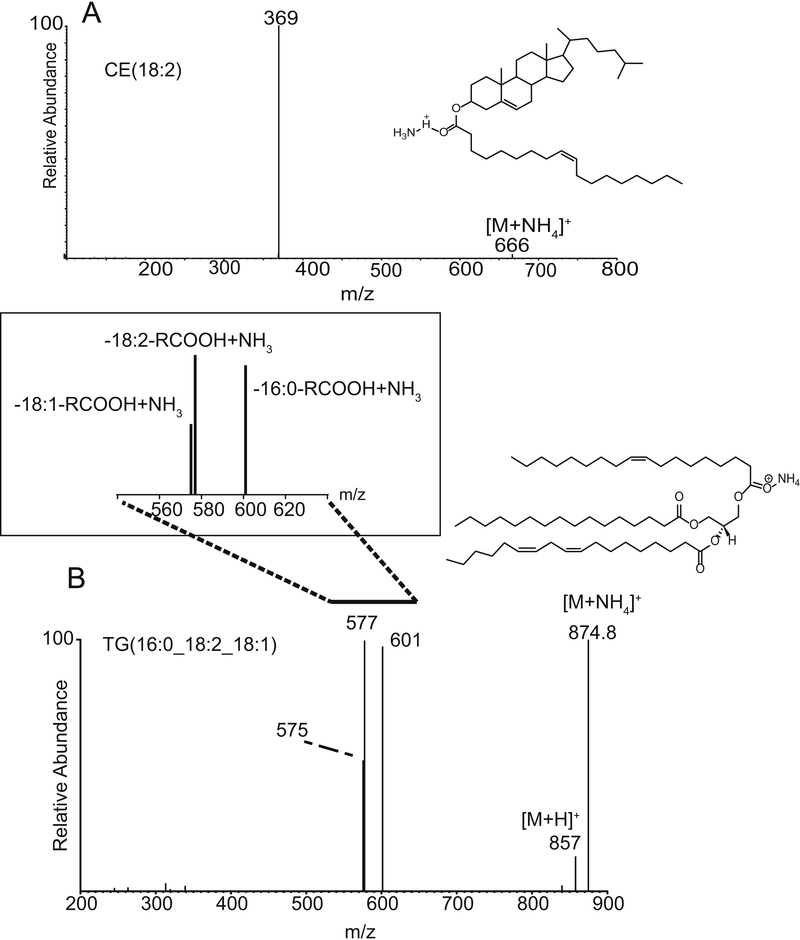
Tandem mass spectrometry of an ammonium adduct of neutral lipids undergo rather facile decomposition reactions driven by the loss of two neutral species. One species is free ammonia (NH3) and the other neutral product being a free carboxylic acid, both derived from a concerted decomposition reaction (Scheme 1). While not implying actual sequence of these proposed reactions, this can be readily illustrated for cholesteryl esters by the formation of the abundant product ion corresponding to the cholesteryl cation. We have proposed that this further involves a 1,3 sigmatropic proton shift that results in a stabilization of the charge by an allylic double bond (8). In the case of the glyceryl lipids, a nascent carbocation site can be stabilized by proton rearrangement facilitated by one of the non-bonded electrons from an ester carbonyl oxygen atom present (triacylglycerols, diacylglycerols, or monoacylglycerols) to form a double bond and charge site relocation to yield an oxonium ion. In the case of cholesteryl esters, a common fragment ion, namely them m/z 369.352 is formed for all molecular species (Figure 1A), but in the case of glyceryl lipids a family of product ions are formed, each corresponding to the loss of one of the fatty acyl esters as a neutral fatty acid and free ammonia. The example of a mixed triacylglycerol yields three abundant product ions (Figure 1B) which we call “diglyceridelike” ions. Thus the information obtained from tandem mass spectrometry is identification of a fatty acid ester by neutral loss of the corresponding carboxylic acid plus ammonia. By mass difference one can identify each ester moiety covalently attached to cholesterol or a glyceryl backbone (8). The study of alkali metal adducts (Na+, K+ or Li+) have also been reported but the tandem mass spectrometry of these cations is not as simple as the [M + NH4]+ tandem mass spectrometry (7,9).
Scheme 1.
Collision induced ion chemistry responsible for the formation of abundant fragment ions from [M+NH4]+ of cholesteryl esters and triglycerides.
Figure 1:
(A) Collisional activation and tandem mass spectrometry of cholesteryl linoleate CE(18:2) [M+NH4]+ at m/z 666. The major product ion corresponds to the cholesteryl cation at m/z 369. (B) Collisional activation and tandem mass spectrometry of the mixed triacylglycerol TG(16:0_18:2_18:1) [M+NH4]+ at m/z 874.8. The diglyceride-like product ions at m/z 575,577, and 601 reveal the loss of each fatty acyl group as a free carboxylic acid plus neutral ammonia (NH3).
Complete structural elucidation of the fatty acyl groups present in a triacylglycerol requires MS3 and unique decomposition mechanisms specific to the oxonium ion formed during the loss of the first fatty acyl group (6). However location of double bonds and double bond geometry of a unsaturated fatty acyl group, required for accurate description each fatty acid ester, is typically out of the realm of most lipidomic experiments (10–12).
Identification of a triacylglycerol can be limited to the level of total number of fatty acyl carbon atoms plus double bonds (from high-resolution data) (e.g. TG(50:2)) or possible fatty acids present through observed neutral loss (tandem mass spectrometry) (TG18:0_16:0_16:1). This shorthand abbreviation system has been developed to designate identification of a lipid ion based on the level of mass spectrometry employed and is now widely accepted (13). For cholesteryl esters, product ion formation of m/z 369.3, uniquely identifies CE molecular species as to the fatty acyl group plus total number of double bonds (e.g. CID of m/z 666.6 suggests CE(18:2)), but does not identify this cholesteryl ester as being cholesteryl linoleate, since the positions of the two double bonds nor the geometry of each of the double bonds were not determined at this level of mass spectrometric analysis. For triacylglycerols obtained from either plant or animal sources, this is further complicated by the presence of multiple molecular species having the same molecular weight (isobaric species). Rather than having only three ions product ions formed following the collisional activation of a single [M + NH4]+ from a biologically derived triacylglycerol, it is not uncommon to observe as many as nine or ten carboxylic acid neutral loss product ions (6). This complicates unambiguous qualitative analysis of biologically derived triacylglycerols.
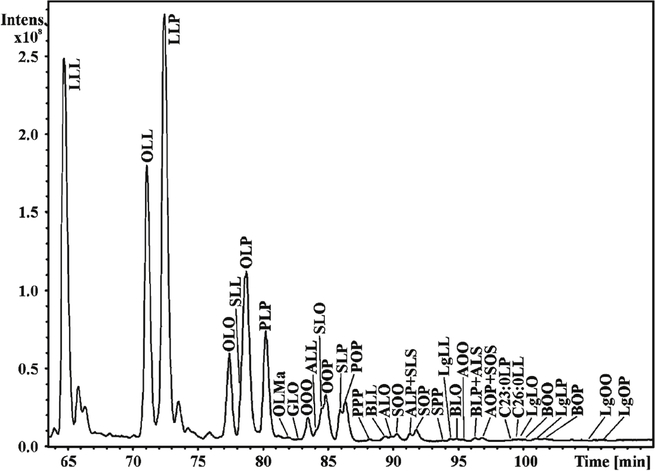
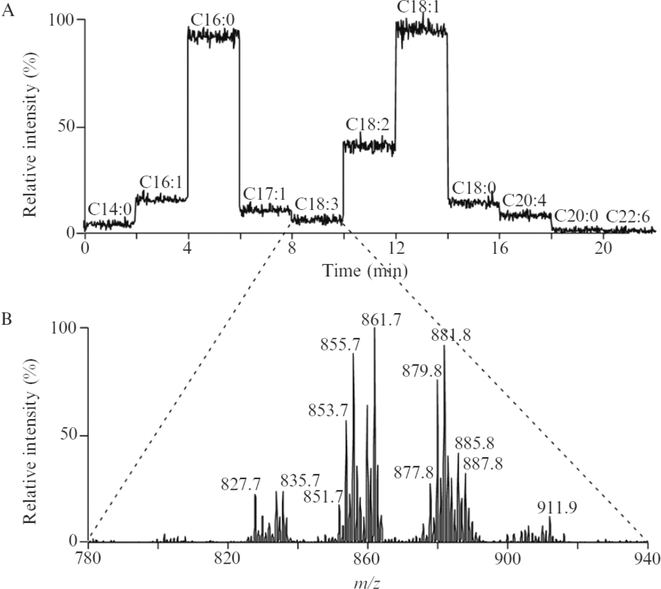
One solution to this problem of multiple isobaric TGs has been the use of reverse phase LC as exemplified by the separation triacylglycerol molecular species derived from plant oils by lipophilic properties (Figure 2) (14). This approach is quite useful since both retention time, high resolution analysis of [M + NH4]+, and tandem mass spectrometry can be employed to more accurately define the molecular species. This is an excellent approach if one is interested in the glyceride lipidome. However reverse phase LC is rather time consuming if other lipids are relevant targets in the analytical protocol, and multiple chromatographic analyses would be required for a more complete lipidomic analysis. An alternative approach to identifying specific fatty acyl groups present in the triacylglycerol extract involves using a MS/MS or multiple reaction monitoring (MRM) approach. A related, shotgun analysis has been used in protocols that reveal molecular species of triacylglycerols (Figure 3) that contain a specific fatty acyl group as a neutral loss from each [M + Li] + (15). However this example does present the confounding feature that collisional activation of lithium adducts of neutral triacylglycerols yield a neutral loss of both RCOOLi and RCOOH, rendering this neutral loss (284 u) possibly due to loss of RCOOLi from an 18:3-containing TG as well as RCOOH from an 18:0-containing TG. The large number of isobaric TG species in a biological extract renders complete description of all molecular species a significant analytical challenge.
Figure 2:
Reverse phase separation of molecular species of triacylglycerols extracted from cottonseed oil (Gossypium hirsutum) and analyzed by LC-APCI-MS. With permission from Elsevier, M. Lísa and M. Holčapek, 2008 (14).
Figure 3:
(A) Total ion current chromatogram of stepwise neutral loss scanning (NL) of fatty acids (RCOOH and RCOOLi) during the infusion of TG molecular species as the lithium adduct [M+Li]+ from a human plasma lipid extract using the shotgun approach. Each segment of individual NL scanning was taken for 2 min. (B) An example of an averaged mass NL mass spectrum corresponding to loss of 284 u (i.e., RCOOLi=18:3 or RCOOH=18:0). This reveals which TG molecular species in this extract contained the fatty acyl groups-18:3/18:0. With permission from Elsevier, RW Gross and X Han, 2007(15).
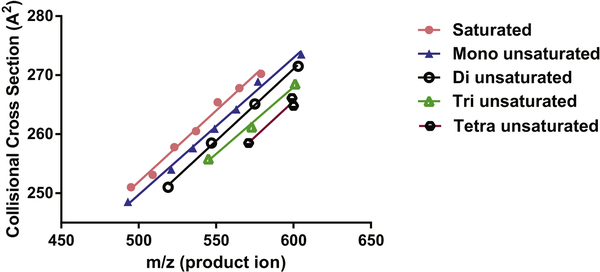
Newer approached to address these problems has been measurement of ion mobilities of neutral lipids (16,17). One such approach has been to utilize product ion mobilities of diglyceride-like ions to assist in structural characterization of triacylglycerol molecular species. As exemplified in Figure 4, the collisional cross section of diglyceride-like ions was found to be strongly correlated with degree of unsaturation present in the total fatty acyl groups. This data can be obtained quite rapidly using a shotgun lipidomics approach in a quadrupole time of flight instrument with an intermediate traveling wave ion mobility sector (17).
Figure 4:
Calculated collisional cross section of product diglyceride-like ions derived following the collisional activation of triacylglycerol molecular species [M+ NH4]+ present in an extract of human serum. Ion mobility was measured in a traveling wave sector of a quadrupole time-offlight mass spectrometer. Collisional cross section ion mobility (Å2)was linearly related to massto-charge ratio (m/z) of the diglyceride-like ion and total number of double bonds (n = 0 to 4) in the fatty acyl groups. With permission, American Chemical Society, from JA Hankin et al., 2016 (17).
Challenges in Quantitation
Mass spectrometric quantitation is a well-established, highly sensitive technique proven to be highly accurate and precise. Yet specific details must be adhered to in order to achieve such results. For example stable isotope dilution strategies are often required to obtain absolute quantitation and the highest accuracy and precision. The reasons for this, reside in the unique properties of stable isotope labeled molecules that behave in an identical manner during extraction, chromatography, and mass spectrometric analysis to that of the molecule which is the analytical target. A basic tenent of stable isotope dilution, is that the ratio of the target signal to the signal for the isotope labeled internal standard (target m/z ion current divided by the internal standard m/z ion current) is the fundamental quantitative measure of the target molecule. The abundance of an ion (or intensity measurement such as counts per second using ion counting strategies) is fundamentally a function of lipid concentration at that moment of ion formation in the ESI ion source. But the measured ion abundance is also a direct function of ion stability, instrument performance, voltage settings, and local environment within the electrospray plume which is influenced by additional components present at that moment. The stable isotope internal standard abundance ion signal is also influenced by these same parameters. Since the isotope labeled internal standard has the same ion stability, experiences the same instrument performance, as well as local environment, all of these factors are canceled leaving the abundance of the concentration of the analyte and the concentration of the internal standard as the major components that influence an ion abundance ratio measurement.
It is important that the internal standard is added to the sample as early as possible in the analytical workflow for this tenent to be valid and fix the ratio of analyte to internal standard. This reduction of mass spectrometric assay to a ratio-based method is a critical feature to remove the inherent variability in mass spectrometric absolute sensitivity and losses of the target molecule during isolation and purification. Yet in order to convert the measured ratio of target to internal standard into moles of target molecule, a standard curve needs to be generated by addition of the identical amount of internal standard to known amounts of a reference standard of the target molecule as separate samples. This standard curve provides precise information as to the mass spectrometric response factor each analyte has relative to another. Linear regression of the change in the ratio as a function of absolute amount of reference standard yields an equation that is used to convert ratio values into absolute quantities. These standard curves are expected to have correlation coefficients (r2) of 0.999 or even higher.
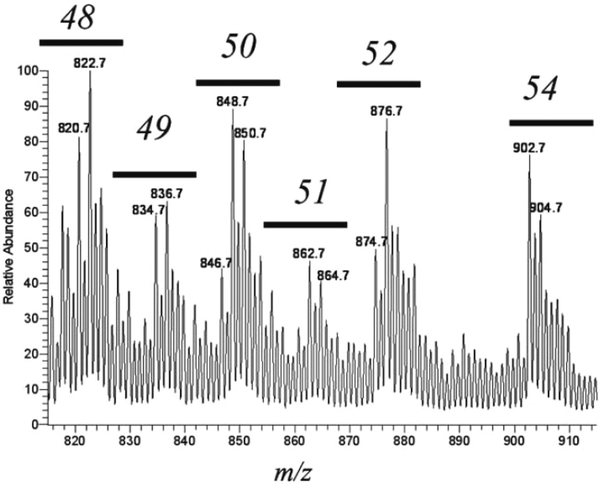
The stable isotope dilution strategy and quantitative mass spectrometry has been employed in lipidomic-like studies for over 40 years notably in the quantitative analysis of metabolites of arachidonic acid in biological extracts (18). Various stable isotope labeled prostaglandins and leukotrienes are commercially available as well as reference standard material, corresponding unlabeled prostaglandins and leukotrienes for over 20 different eicosanoids. However for neutral lipids quantitative assays are considerably more complex. First of all a relatively small number of stable isotope labeled neutral lipids are commercially available as well as a small number of unlabeled neutral lipid molecular species that could possibly be employed as reference material. A second problem is that for some neutral lipids such as triacylglycerols, hundreds of molecular species are typically present in a biological extract each of which have significant [M+1]+, [M+2]+, and [M+3]+ isotope ions. This leaves only a few mass-to-charge ratio values that do not correspond to an endogenous triacylglycerol in the mass range of interest, making it impossible to have a stable isotope labeled analog for each and every endogenous triacylglycerol molecular species even if they were available (Figure 5).
Figure 5:
ESI mass spectra of the neutral lipid fraction from RAW 264.7 cells obtained on a linear ion trap mass spectrometer showing the TG region of the mass spectrum, m/z 810 to 920 corresponding to TGs [M+ NH4]+ containing a total of 48 to 54 fatty acyl carbon atoms. With permission of the American Society for Mass Spectrometry, A McAnoy et al., 2005 (6).
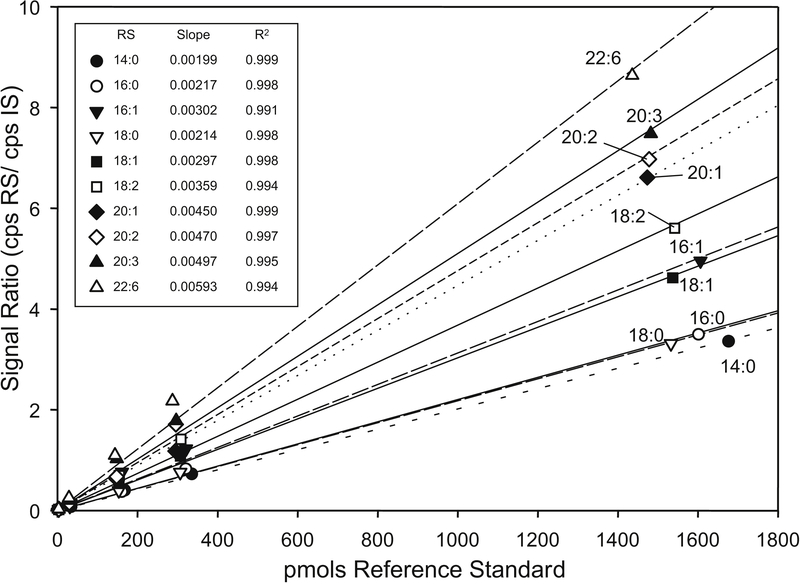
These challenges in the analysis of neutral lipids, or for that matter all lipidomic studies involving any lipid class with a large number of naturally occurring molecular species, have been faced by making several compromises. For example it is common for investigators to use one or at most two or three internal standards for the analysis of cholesteryl esters or triacylglycerols (19). Relatively few cholesteryl ester molecular species are normally present in blood or lipid droplets, at most 15 to 20 unique species. Most of these molecular species are commercially available so that one can generate a standard curve for each of the 20 species observed in an extract. A report of the quantitation of 10 different cholesteryl ester molecular species appeared where each molecular specie had reference standard curves generated using only one isotope labeled internal standard, namely [ ]-CE(18:1) internal standard (Figure 6 ). In spite of the close relationship of these analytes (only differing by the fatty acid ester portion of the molecule), quite different slopes for the linear regression lines were found for the ratio of analyte to internal standard relative to the absolute amount of the reference CE. The 10 different cholesteryl ester species had response factors that differed by over a factor of three from the most highly saturated fatty acyl ester to the polyunsaturated fatty acyl groups (20). Such behavior has also been reported for triacylglycerol molecular species in terms of relative response (21).
Figure 6:
Calibration curves of 10 cholesteryl ester reference standards using a single isotopelabeled CE([]18:1) as internal standard. The linear regression lines were forced through the origin and slopes and regression correlation coefficients (r2) indicated in the table inset. With permission granted by the American Society for Biochemistry and Molecular Biology from P Hutchins et al., 2009 (21).
If one does not take into account these differences in response factors as revealed by independently determined calibration curves, significant errors are introduced in the absolute quantities calculated from the mass spectrometric ratio measurement data. Thus absolute quantitation remains a significant challenge if one does not have reference material available for each and every molecular species so that precise response factors can be assessed even though a single internal standard could possibly correct for variations in electrospray ionization or collision induced ion chemistry.
A further compromise has been the use of non-isotope labeled internal standard standards such as homologous lipids either being chain shortened species or odd carbon number fatty acyl species. The short-chain homolog internal standard is typically chosen so that the molecular weight of the internal standard is far removed from where the endogenous species appear along the m/z scale or by chromatographic separation. In general the same concern must be raised as to the appropriate response factors employed to convert the measured mass spectrometric ratio into absolute quantities if not all molecular species have individual standard curves. There is a further concern in that the homologue or odd-chain fatty acyl neutral lipids may not behave identically during extraction and chromatography, thus not correct precisely for losses that may occur for each of the individual components of the mixture of neutral lipids. Nonetheless the strategy using non-isotope labeled internal standards and a limited number of reference molecular species for standard curve assessment of response factors has become the mode of operation for most lipidomic studies.
Relative Quantitation
Biochemical and pharmacological studies frequently involve measuring levels of lipids including neutral lipids, in a series of very closely related experiments. For example lipid molecular species are quantitatively measured in a specific number of cells treated with different concentrations of a cytokine, or in a clinical study, a series of plasma or urine samples taken from normal human subjects and human subjects with a disorder. For such studies, important information may not be the absolute quantity of lipid measured but rather the fold change induced by the experimental variables or by the disease process. An alternative way to express quantitative lipid data rather than by absolute levels is by accurately assessing fold change across the experimental paradigm. This strategy has been used in a large number of studies over the past several years where the signal of the target lipid relative to the internal standard, is presented rather than conversion of this ratio to an absolute number of moles per number of cells, or tissue wet weight, or volume of plasma. The operational difference between the absolute and relative quantitation approach is a standard curve to precisely determine the total signal abundance of the target to that of reference standards. However the important feature is that quantitative information is already present in the ratio.
Considering our working hypothesis that the quantitative information (concentration of the target lipid) carried by the abundance of an ion measured by mass spectrometry is influenced by various factors including lipid ionization efficiency, ion stability, instrument operating parameters, and the electrospray plume environment, when the same lipid molecular species are directly compared, many of these confounding factors are cancelled. This leaves the ratio of the target ion abundance divided by the internal standard abundance as a valid quantitating measurement. Using the ion abundance of the same ion (normalized by the internal standard abundance) across an experimental set of data, eliminates factors such as ionization efficiency and ion stability since these are constants for the same lipid molecular species. What remains to be kept constant are the experimental parameters such as sample workup, number of cells (or tissue wet weight), volume of extract injected on column, and quantity of internal standard added to each sample. Thus the ratio of ion abundance-to-internal standard is a very quantitative measure for each individual lipid molecular species across multiple experiments and this ratio can be used to calculate accurate fold-changes for each individual lipid molecular species. This concept of fold-change as a quantitative measure is not particularly, new but widely used in other areas of biological research such as the measurement of gene expression. Nevertheless it is important to state that one cannot compare one molecular species abundance ratio, e.g. CE(18:2), to that of another molecular species, e.g. CE(16:0), since the response factors of these two different cholesteryl esters are not identical. In spite of this inability to cross compare molecular species of lipids, valuable information can be gleaned relevant to the biological experimental parameters in altering levels of specific lipids. For example insight into alterations in the biochemistry of neutral lipids synthesis, metabolism or influx of exogenous polyunsaturated fatty acids (22).
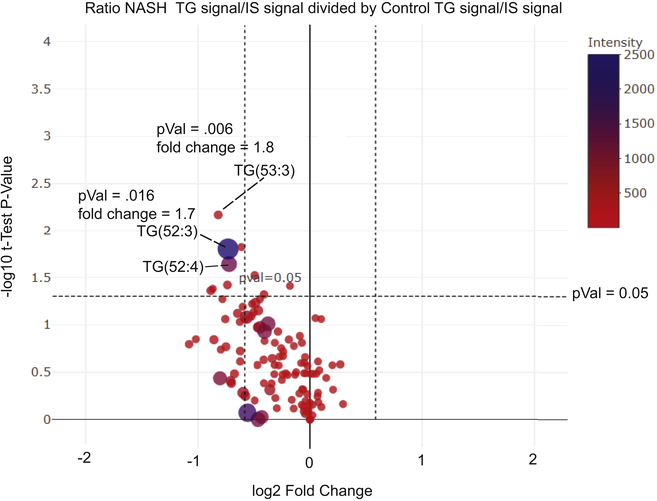
Furthermore fold-changes can be readily compared by using modern statistical methods such as principal component analysis, linear discriminant analysis, and even volcano plots. An example volcano plot (Figure 7) is the comparison of individual molecular species of many neutral lipids by fold-change and t-test significance in a single graphical representation. Individual molecular species of cholesteryl esters and triacylglycerols in plasma from a clinical study of nonalcoholic steatohepatitis (NASH) compared to matched control human subjects (23). This plot reveals a significant fold change in specific molecular species that appear in the upper left-hand quadrant or upper right head quadrant of this graphical representation. The size of the circle indicates magnitude of the signal. Such treatment of this relative quantitative data is useful in discovering unique molecular species relevant to a specific biological process, in this case significant as markers for the NASH phenotype.
Figure 7:
Relative quantitation of triacylglycerol molecular species in plasma obtained in a previously published study (23) of human subjects diagnosed with non-alcoholic steatohepatitis (NASH) or from plasma samples from normal human subjects (Control) compared by a Volcano plot that graph fold-change between NASH (denominator) and Control (signal divided by internal standard) for each separate TG molecular species as well as the Student’s t-Test significance. The size of the circles as well as color indicates the signal abundance. Specific molecular species that are statistically significant (p<.05) with a greater than 1.5 fold change) are indicated.
In conclusion, the measurement of neutral lipids by mass spectrometry has emerged as a powerful tool in the lipidomics toolbox that enables one to answer specific questions about alterations in neutral lipid biochemical pathways. Important challenges as to the unique identification of neutral lipids remain in spite of the fact the quite sophisticated mass spectrometry, including high-resolution mass analysis as well as tandem mass spectrometry and ion mobility are powerful tools to identify neutral lipid species of cholesteryl esters and triacylglycerols. Challenges include determination of double bond position as well as double bond geometry that is difficult to obtain in a high throughput manner. Approaches are emerging such as using ozonolysis reactions (10) and photochemical reactions during HPLC separation (11) that add information as to double bonds position in a fatty acyl group. Quantitation of neutral lipids using internal standards is complicated by the lack of a large number of reference standards to generate standard curves for the majority of neutral lipid species. This limits the absolute accuracy of neutral lipid measurements but not the precision. An alternative to absolute quantitative measures is emerging in popularity where relative quantitation of only identical lipid molecular species are precisely and accurately compared and evaluated over a series of biological experiments. This latter technique has facilitated more sophisticated informatic approaches to be applied to neutral lipidomic data.
Acknowledgment
This work was supported in part by grants from the National Institutes of Health (U54-GM069338) and the Seattle Children’s Foundation (Preventing Preterm Birth −15013).
Abbreviations:
- CID
collision-induced dissociation
- CE
cholesteryl esters
- MRM
tandem mass spectrometry-multiple reaction monitoring
- TG
triacylglycerols
Footnotes
Publisher's Disclaimer: This is a PDF file of an unedited manuscript that has been accepted for publication. As a service to our customers we are providing this early version of the manuscript. The manuscript will undergo copyediting, typesetting, and review of the resulting proof before it is published in its final citable form. Please note that during the production process errors may be discovered which could affect the content, and all legal disclaimers that apply to the journal pertain.
References
- 1.Quehenberger O, Armando AM, Brown AH, Milne SB, Myers DS, Merrill AH, Bandyopadhyay S, Jones KN, Kelly S, Shaner RL, Sullards CM, Wang E, Murphy RC, Barkley RM, Leiker TJ, Raetz CR, Guan Z, Laird GM, Six DA, Russell DW, McDonald JG, Subramaniam S, Fahy E, Dennis EA. Lipidomics reveals a remarkable diversity of lipids in human plasma. J Lipid Res 51:3299–3305 (2010). [DOI] [PMC free article] [PubMed] [Google Scholar]
- 2.Chen Jue, Goldberg Ira, Reue Karen, Abumrad Nada, Bickel Perry, Cohen Sarah, Fisher Edward, Galis Zorina, Granneman James, E Douglas Lewandowski Robert Murphy, Olive Michelle, Schaffer Jean, Lisa Schwartz Longacre Gerald Shulman, and Walther Tobias. Deciphering the Role of Lipid Droplets in Cardiovascular Disease: A Report from the 2017 National Heart, Lung, and Blood Institute Workshop. Circulation, in press (2018). [DOI] [PMC free article] [PubMed] [Google Scholar]
- 3.Murphy RC. Tandem Mass Spectrometry of Lipids: Molecular Analysis of Complex Lipids. New Developments in Mass Spectrometry , Chapter 3 p. 75–104, Royal Society of Chemistry, London, UK: (2015). [Google Scholar]
- 4.Fitzgerald M, Murphy RC. Electrospray mass spectrometry of human hair wax esters. J Lipid Res, 48:1231–1246 (2007). [DOI] [PubMed] [Google Scholar]
- 5.Murphy RC. Tandem Mass Spectrometry of Lipids: Molecular Analysis of Complex Lipids. New Developments in Mass Spectrometry , Chapter 4 p. 105–129, Royal Society of Chemistry, London, UK: (2015). [Google Scholar]
- 6.McAnoy AM, Wu CC, Murphy RC. Direct qualitative analysis of triacylglycerols by electrospray mass spectrometry using a linear ion trap. J Am Soc Mass Spectrom 16:1498–1509 (2005). [DOI] [PubMed] [Google Scholar]
- 7.Hsu FF, Turk J. Structural characterization of triacylglycerols as lithiated adducts by electrospray ionization mass spectrometry using low-energy collisionally activated dissociation on a triple stage quadrupole instrument. J Am Soc Mass Spectrom 10:587–599 (1999). [DOI] [PubMed] [Google Scholar]
- 8.Murphy RC. Tandem Mass Spectrometry of Lipids: Molecular Analysis of Complex Lipids. New Developments in Mass Spectrometry , Chapter 7 p. 244, Royal Society of Chemistry, London, UK: (2015). [Google Scholar]
- 9.Herrera LC, Potvin MA, Melanson JE. Quantitative analysis of positional isomers of triacylglycerols via electrospray ionization tandem mass spectrometry of sodiated adducts. Rapid Commun Mass Spectrom, 24:2745–2752 (2010). [DOI] [PubMed] [Google Scholar]
- 10.Brown SH, Mitchell TW, Blanksby SJ. Analysis of unsaturated lipids by ozone-induced dissociation. Biochim. Biophys. Acta, 1811: 807–817(2011). [DOI] [PubMed] [Google Scholar]
- 11.Ma X, Chong L. Tian R, Shi R, Hu TY, Ouyang Z, Xia Y. Identification and quantitation of lipid C=C location isomers: A shotgun lipidomics approach enabled by photochemical reaction. Proc. Natl. Acad. Sci. U. S. A, 113:2573–2578 (2016). [DOI] [PMC free article] [PubMed] [Google Scholar]
- 12.Murphy RC, Okuno T, Johnson CA, Barkley RM. Analysis of double bond positions in polyunsaturated fatty acids. Anal Chem, 89:8545–8553 (2017). [DOI] [PubMed] [Google Scholar]
- 13.Liebisch G, Vizcaíno JA, Köfeler H, Trötzmüller M, Griffiths WJ, Schmitz G, Spener F, Wakelam MJ. Shorthand notation for lipid structures derived from mass spectrometry. J Lipid Res. 54:1523–1530 (2013). [DOI] [PMC free article] [PubMed] [Google Scholar]
- 14.Lísa M, Holčapek M. Triacylglycerols profiling in plant oils important in food industry, dietetics and cosmetics using high-performance liquid chromatography-atmospheric pressure chemical ionization mass spectrometry. J Chromatogr A. 1198-1199:115–130 (2008). [DOI] [PubMed] [Google Scholar]
- 15.Gross RW, Han X. Lipidomics in diabetes and the metabolic syndrome. Methods Enzymol. 433:73–90 (2007). [DOI] [PubMed] [Google Scholar]
- 16.Šala M, Lísa M, Campbell JL, Holčapek M. Determination of triacylglycerol regioisomers using differential mobility spectrometry. Rapid Commun Mass Spectrom. 30:256–264 (2016). [DOI] [PubMed] [Google Scholar]
- 17.Hankin JA, Barkley RM, Deng Y, Murphy RC. Mass spectrometric collisional activation and product ion mobility of human serum neutral lipid extracts. Anal Chem 88:6274–6282 (2016). [DOI] [PMC free article] [PubMed] [Google Scholar]
- 18.Murphy RC. Mass spectrometric quantitation and analysis of leukotrienes and other 5lipoxygenase metabolites. Prostaglandins 28:597–601 (1984). [Google Scholar]
- 19.Han X, Gross RW. Quantitative analysis and molecular species fingerprinting of triacylglyceride molecular species directly from lipid extracts of biological samples by electrospray ionization tandem mass spectrometry. Anal Biochem. 295:88–100 (2001). [DOI] [PubMed] [Google Scholar]
- 20.Hutchins PM, Barkley RM, Murphy RC. Separation of cellular non–polar neutral lipids by normal phase chromatography and analysis by electrospray ionization mass spectrometry. J Lipid Res 49:804–813 (2008). [DOI] [PMC free article] [PubMed] [Google Scholar]
- 21.Li X, Collins EJ, Evans JJ. Examining the collision-induced decomposition spectra of ammoniated triacylglycerols as a function of fatty acid chain length and degree of unsaturation. II. The PXP/YPY series. Rapid Commun Mass Spectrom. 20:171–177 (2006). [DOI] [PubMed] [Google Scholar]
- 22.Chilton FH, Murphy RC, Wilson BA, Sergeant S, Ainsworth H, Seeds MC, Mathias RA. Diet-gene interactions and PUFA metabolism: A potential contributor to health disparities and human diseases. Nutrients 6:1993–2022 (2014). [DOI] [PMC free article] [PubMed] [Google Scholar]
- 23.Gorden DL, Myers DS, Ivanova PT, Fahy E, Maurya MR, Gupta S, Min J, Spann NJ, McDonald JG, Kelly SL, Duan J, Sullards MC, Leiker TJ, Barkley RM, Quehenberger O, Armando AM, Milne SB, Mathews TP, Armstrong MD, Li C, Melvin WV, Clements RH, Washington MK, Mendonsa AM, Witztum JL, Guan Z, Glass CK, Murphy RC, Dennis EA, Merrill AH Jr, Russell DW, Subramaniam S, Brown HA. Biomarkers of NAFLD progression: A lipidomics approach to an epidemic. J Lipid Res 56:722–736 (2015). [DOI] [PMC free article] [PubMed] [Google Scholar]


