Abstract
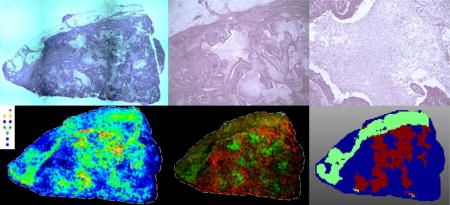
Tissue necrosis is a form of cell death common in advanced and aggressive solid tumors, and is associated with areas of intratumoral chronic ischemia. The histopathology of necrotic regions appear as a scaffold of cellular membrane remnants, reflective of the hypoxia and cell degradation events associated with this cellular death pathway. Changes in the glycosylation of cell surface proteins is another common feature of cancer progression. Using a recently developed mass spectrometry imaging approach to evaluate N-linked glycan distributions in human formalin-fixed clinical cancer tissues, differences in the glycan structures of regions of tumor, stroma and necrosis were evaluated. While the structural glycan classes detected in the tumor and stromal regions are typically classified as high mannose or branched glycans, the glycans found in necrotic regions displayed limited branching, contained sialic acid modifications and lack fucose modifications. While this phenomenon was initially classified in breast cancer tissues, it has been also seen in cervical, thyroid and liver cancer samples. These changes in glycosylation within the necrotic regions could provide further mechanistic insight to necrotic changes in cancer tissue and provide new research directions for identifying prognostic markers of necrosis.
Keywords: necrosis, glycosylation, mass spectrometry imaging, hypoxia, N-linked glycans, formalin-fixed tissues
Graphical abstract
1. Introduction
Glycosylation is the enzymatic process that results in the incorporation of monosaccharides via glycosidic linkages to proteins, lipids and other saccharides. This process is an abundant post-translational protein modification including N-linked, O-linked, and glycosaminoglycan glycoconjugates that function as major constituents of the cell surface and extracellular matrix [1,2]. In this role, alterations and changes in glycosylation are associated with many disease processes, and are well known as important mediators in cancer development, invasiveness and metastasis [3–7]. Identifying cancer-associated changes in N- and O-linked glycans and glycosaminoglycans in tumor tissues and biofluids can be challenging due to the complexity of the glycan structures and the many variations of attachment sites on carrier proteins. Increasingly, mass spectrometry-based approaches are used to address these challenges, and the effectiveness of these methods have evolved in coordination with the continued improvements in mass spectrometer instrumentation, increased detection sensitivities, and data analysis tools [8–10]. An emerging approach to study changes in N-linked glycosylation directly in clinical and experimental FFPE tissues is the use of MALDI-TOF and MALDI-FTICR mass spectrometry imaging [11–17]. Following release of tissue N-glycans by digestion with peptide N-glycosidase F, the relative abundance and spatial localization of 50 or more detected glycans can be directly correlated to the histopathology of the tissue. In cancer tissues, this has allowed the mapping and structural grouping of glycan classes to specific regions of tumor, stroma and inflammation [12–17].
Necrosis is a form of cell death that is often activated by ischemia or hypoxia, and is commonly found in advanced stages of solid tumor types, including breast, colon and lung [18–20]. When a cell undergoes necrosis, it first swells, followed by the collapse of the plasma membrane and rapid cell lysis. For in vitro cell line studies, necrosis is most commonly caused by hypoxia, glucose or other essential nutrients [18,21]. In vivo, necrosis typically occurs during tumor growth when there is inadequate vascularization, which is typically caused by energy deprivation [18–20]. Mechanistically, there are several components of the immune system that have the ability to induce necrosis via different stimuli. Some of the receptors that have been connected to the triggering of this process include TNF, FAS, TRAIL, and TLR [18,22]. DNA damage can activate necrosis either directly (e.g., radiation) or indirectly (e.g., oxidative stress). Large DNA breaks can result in the activation of PARP, leading to depletion of NAD+ and ATP, and therefore activating the necrotic pathway due to lack of energy [23]. This can also lead to the activation of RIP1 and JNK, resulting in mitochondrial damage. RIP1 and JNK can also be activated by receptor stimuli [24,25]. The final stage of the necrotic destruction pathway is the activation of proteases and caspases, inducing an inflammatory response [18]. When looking at human clinical tissue specimens, necrosis is characterized as an area of cell remnants with infiltration by inflammatory cells. Depending on the context in which it is found, tissue necrosis within tumors can be a positive or a negative indicator of the disease state. In patients receiving anti-cancer therapies, the presence of necrosis is generally viewed as an encouraging sign that the patient is reacting to the therapy and an immune response is being elicited. However, in tumors from individuals who have not been treated, the presence of necrosis is viewed as a negative prognostic indicator because it is often associated with highly aggressive disease, which has been described for breast, colon and lung cancers [18–20].
Evaluation of tumor necrosis and hypoxia in xenograft and animal model tissues by MS imaging approaches has been reported previously for the analysis of lipids and proteins [26–29]. Clinically derived fresh frozen ovarian tumor tissues with and without necrotic regions have been evaluated by DESI-MS for lipids and metabolites [30], and one description of a single N-linked glycan detected by MALDI-TOF MS imaging in necrotic regions of FFPE ovarian cancer tissues has been reported [17]. While characterizing the N-glycan distributions of different human breast cancer tissues by MALDI-FTICR MS imaging, it was observed that areas of necrosis in several tissues had distinct N-glycan profiles with a shared structural class. In this report, we describe the characterization of the different N-linked glycan distributions in a small cohort of diverse tumor tissues. The cumulative results indicate the presence of an apparently conserved N-linked glycosylation pattern unique to necrosis regions in tumor tissues, independent of the originating organ and tissue type. This is the type of result that would not have been possible to obtain in homogenized tissue lysates, highlighting the utility of MALDI MS imaging in identifying unique structural features in tissues.
2. Materials
Trifluoroacetic acid, α-cyano-4-hydroxycinnamic acid (CHCA) was obtained from Sigma-Aldrich (St. Louis, MO, USA). HPLC grade methanol, ethanol, acetonitrile, xylene and water were obtained from Fisher Scientific (Pittsburgh, PA, USA). Tissue Tack positively charged microscope slides were purchased from Polysciences, Inc. (Warrington, PA, USA). Citraconic anhydride for antigen retrieval was from Thermo Scientific (Bellefonte, PA, USA). Recombinant Peptide N-Glycosidase F (PNGaseF) was obtained from the laboratory of Dr. Anand Mehta (Charleston, SC, USA) as described [11]. Hematoxylin and eosin stains were obtained from Cancer Diagnostics (Durham, NC, USA).
3. Methods
3.1 FFPE Tissues
All tissues used were de-identified and determined to be not human research classifications by the respective Institutional Review Boards at MUSC and UCSD. De-identified breast tissues, described as invasive ductal carcinomas were obtained from the Hollings Cancer Center Biorepository at MUSC. All breast cancer tissues were from surgeries performed as primary initial therapy with no prior treatments.
3.2 Tissue Preparation and PNGaseF Digestion
Formalin-fixed paraffin-embedded (FFPE) tissues were sectioned at 5μm and mounted onto charged slides (Polysciences Inc.). Tissue slides were dewaxed and rehydrated for antigen retrieval using citraconic anhydride buffer (25 μl citraconic anhydride (Thermo Fisher Scientific, Waltham, MA), 2 μl 12M HCl, 50 ml HPLC-grade water, pH 3.0–3.5) as previously described [12]. Recombinant PNGaseF enzyme (0.1 μg/μl) was applied to dessicated, antigen-retrieved slides using a TMSprayer (HTX Technologies LLC., Chapel Hill, NC). Enzyme was sprayed onto the slide at a rate of 25 μl/min for 15 passes at 45°C at a velocity of 1200, and a 0 mm offset. Slides were placed in a humidity chamber at 37°C for two hours. After incubation, slides were desiccated and 7 mg/ml CHCA matrix was applied using the TMSprayer at 0.1 ml/min for 10 passes at 80°C at a velocity of 1300 and a 1 mm offset. Slides were stored in a desiccator until MALDI-FTICR MS analysis.
3.3 N-Glycan MALDI-FTIMS Analysis
Released N-linked glycan ions were detected using a Solarix dual source 7T FTICR mass spectrometer (Bruker Daltonics) (m/z 490–5000) with a SmartBeam II laser operating at 2000 Hz, and a laser spot size of 15 μm. A total of 200 laser shots were collected for each pixel, using the smartwalk feature set to 25 μm with one scan per pixel. Time domain was set to 512K word with a mass range of 500–5,000 m/z, resulting in a 1.2059 transient with a calculated resolving power of 160,000 at m/z 400. Ion accumulation time was 0.1 second. Following MS analysis, data was loaded into FlexImaging Software focusing on the range m/z = 700–4000. FlexImaging 4.0 (Bruker Daltonics) was used to generate images of differentially expressed glycans normalized to total ion current. Observed glycans were searched against the glycan database generated using GlycoWorkbench [31]. Indicated glycan structures were generated in GlycoWorkbench and represent compositionally correct structures determined by accurate mass, as well as previous structural characterizations [12–17]. SCiLS 2016b (Bruker Daltonics) imaging software was also used for further glycan expression analysis, comparison, and statistical evaluation (normalized to total ion current).
3.4 Histopathological Correlation
After analysis, matrix was washed from slides using 100% ethanol for 5 minutes. Slides were stained with hematoxylin and eosin (H&E) (Cancer Diagnostics). Stained slides were analyzed and notated by a pathologist for glycan map comparison, and were visualized and imaged on a Evos FL Auto microscope.
4. Results
As part of a larger study, N-linked glycosylation differences in different genetic subtypes of several hundred human FFPE breast cancer tissues have been evaluated using MALDI-FTICR MS imaging. The method relies on enzymatic release of N-glycans by PNGaseF digestion prior to detection. As an example of the results obtained, data for a large grade III invasive ductal carcinoma positive for the estrogen and progesterone receptors is shown in Figures 1–3, including N-glycans primarily localized to tumor (Figure 1), and different stroma regions (Figures 2 and 3). The large open area in the center of the tissue is the track of a biopsy needle. A cumulative list of masses and images for detected glycans are included in Supplemental Table 1 and Supplemental Figure 1. For tumor, a broad range of high mannose and paucimannose glycans were detected, which is common for many human tumor types [14,17]. Also present in tumor regions were branched tetra-antennary glycans (Figure 1). In Figure 2, N-glycans with a common structural theme of bi-antennary structure and a single core-fucose on the first N-acetylglucosamine residue (which was formerly the site of attachment to the glycoprotein) are shown. These core-fucosylated glycans are typically associated with regions of stroma with high collagen content [14]. Shown in Figure 3 is another bi-antennary glycan class that lack the core fucose residue, which is also localized to the stroma adjacent to the tumor. This type of mixed stroma distribution of the aforementioned N-glycans has been consistent across most tumor tissues and tumor types that have been examined by the method [12,14–17]. In contrast, a distinct tissue region with an enhanced detection of the bi-antennary, non-fucosylated N-glycans was also evident. As shown in Figure 3a, annotation of the tissue by a pathologist confirmed this area to be a large region of tissue necrosis (Figure 3b) that corresponded to the glycan pattern shown in Figure 3e. Further, the specific spatial distributions of each glycan class were assigned different colors in an overlay image of representative glycans corresponding to the tumor, stromal and necrotic region of the tissue (Figure 3f). A non-sialylated and sialylated tri-antennary glycan lacking a core fucose also co-localized to the necrotic region.
Figure 1. The most abundant tumor-localized N-glycans detected in an invasive ductal breast carcinoma.
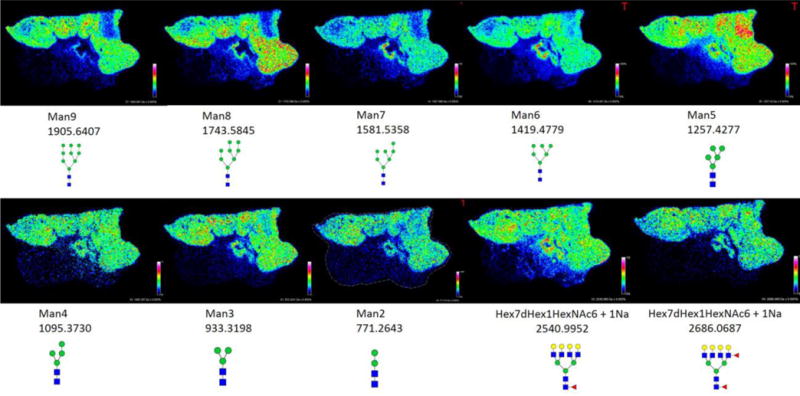
Tumor glycans representing high mannose (top row), paucimannose (bottom row, left to right, images 1–3) and branched chain structures (bottom row, left to right, images 4–5), their m/z values, and distribution throughout the tissue are shown. Areas of greater signal intensity are displayed in red as indicated in the pixel scale bar, with dark blue areas representing minimal intensities. Images were created with FlexImaging 4.0 software and normalized to the total ion current (TIC).
Figure 3. Comparative N-glycan histopathology localization and image overlay.
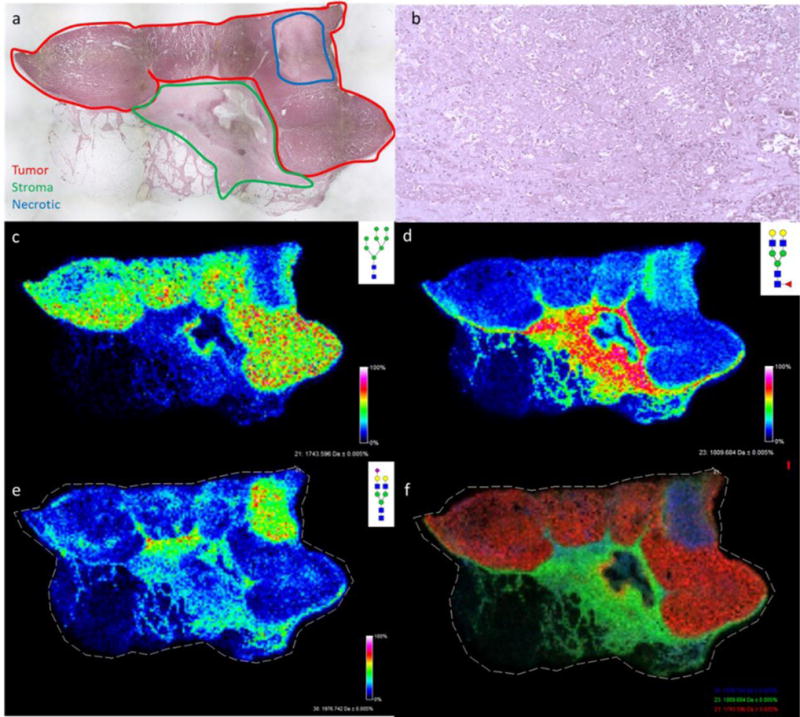
a) A 2X magnification of the H&E stained invasive ductal carcinoma tissue with colored areas highlighted for red = tumor, stroma = green, blue = necrotic; b) 20X magnification of the necrotic region (see also Supplemental Figure 2a); c) Distribution of the tumor glycan Hex8HexNAc2 + 1Na m/z: 1743.5845 (Man8); d) Distribution of stromal core fucosylated Hex5dHex1HexNAc4 + 1Na m/z: 1809.6413.; e) Distribution of stroma and necrosis localized Hex5NexNAc4NeuAc1 + 2Na m/z: 1976.6618; f) Overlay of Hex5dHex1HexNAc4 + 1Na (green), Hex8HexNAc2 + 1Na (red), and Hex5HexNAc4NeuAc1 + 2Na (blue). Images were created with FlexImaging 4.0 software.
Figure 2. Comparison of core fucosylated glycans in the stromal region and non-fucosylated glycans in the necrotic region.
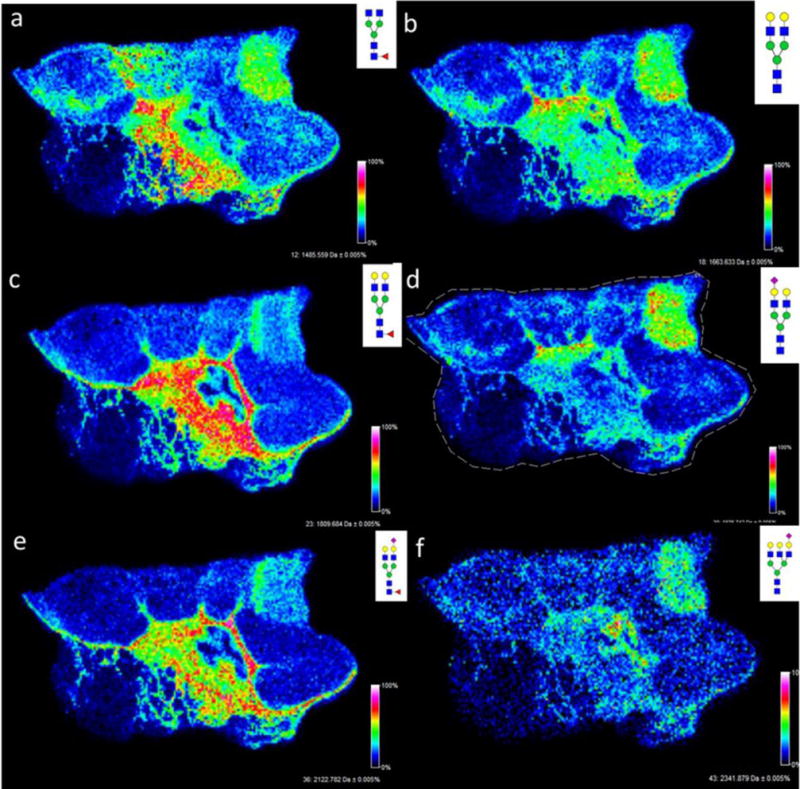
a,c,e) Core fucosylated glycans: a, Hex3dHex1HexNAc4 (1485.5343); c, Hex5dHex1HexNAc4 (1809.6413); e, Hex5dHex1HexNAc4NeuAc1 (2122.7243). b,d,f) Non-fucosylated glycans; b, Hex5HexNAc4 (1663.5839); d, Hex5HexNAc4NeuAc1 (1976,6618); f, Hex6HexNAc5NeuAc1 (2341.8056). Images were created with FlexImaging 4.0 software.
This result for specific distributions of N-glycans in necrotic tissue regions was further examined in a triple negative invasive ductal carcinoma tissue with necrotic regions present throughout the tumor (Figure 4–5). As seen in the initial tissue, glycans such as Hex5HexNAc4NeuAc1 + 1Na, displayed a spatial localization that correlated directly with the necrotic regions (Figure 4). When directly overlaying the profiles of glycans that mapped to the tumor region, compared with glycans that mapped to the necrotic region, the specificity of these markers became distinctly obvious (Figure 4d). Using the SCiLS software, a segmentation analysis was performed to classify the groups of glycans in each region (Figure 5a). Glycan spectra were classified into three groups: tumor (represented by the dark blue color), stromal (represented by the light green color), and necrotic (represented by the maroon color). Co-localization analysis was performed to identify the glycan spectra specific to the necrotic region with a threshold greater than 0.5. Five glycan peaks were identified within this threshold: Hex5HexNAc4 + 1Na, Hex3dHex1HexNAc6 + 1Na, Hex5HexNac4NeuAc1 + 1Na, Hex6HexNAc5 + 1Na, and Hex6HexNAc5NeuAc1 + 1Na (Figures 5b–5f).
Figure 4. N-glycan distribution in a triple-negative invasive ductal carcinoma with necrotic regions.

a) A 2X magnification of H&E stained tissue (see also Supplemental Figure 2b); b and c) a direct overlay of the H&E image with Hex5HexNAc4NecAc1 + 1Na m/z: 1954.7026 distribution throughout tissue to show co-localization with regions of necrosis; overlay (b) and glycan image alone (c). d) Overlay of tumor associated glycan Hex8HexNAc2 + 1Na m/z 1743.5606 (red) with necrosis associated glycan Hex5HexNAc4NeuAc1 + 1 Na m/z: 1954.7026 (green). Images were created with FlexImaging 4.0 software.
Figure 5. Segmentation analysis of N-glycan distribution.
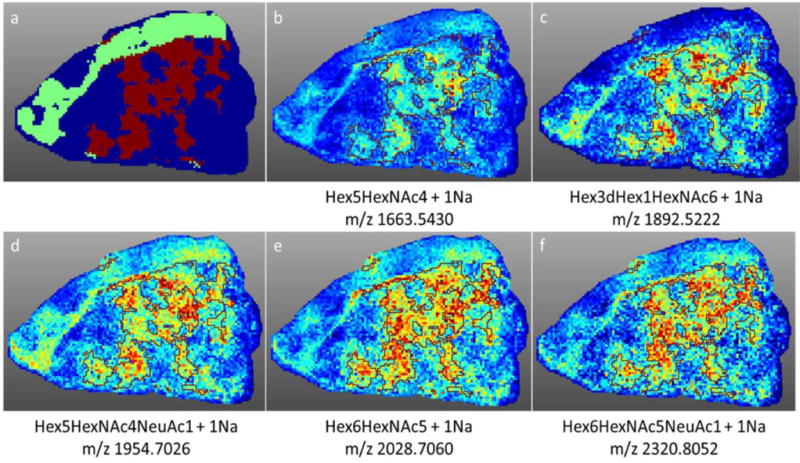
Using SCiLS software, a segmentation analysis was performed to classify the groups of glycans in each region of the triple negative breast cancer tissue. a) Glycan spectra were classified into three groups: tumor (represented by the dark blue color), stromal (represented by the light green color), and necrotic (represented by the maroon color). b–f) Co-localization analysis was performed to identify the glycan spectra specific to the necrotic region (outlined in maroon) with a threshold greater than 0.5. Five glycan peaks were identified within this threshold: b) Hex5HexNAc4 + 1Na c) Hex3dHex1HexNAc6 + 1Na d) Hex5HexNac4NeuAc1 + 1Na e) Hex6HexNAc5 + 1Na and f) Hex6HexNAc5NeuAc1 + 1Na.
In previous N-glycan imaging studies from our group, tissues were analyzed that did not contain regions of necrosis, or at least were not targeted for such. For comparison to the two breast cancer tissues shown in the previous figure, the N-glycan analysis of two invasive ductal carcinoma breast tumors that do not contain necrotic regions are shown in Figure 6. The N-glycans that appeared as specific for necrotic regions were present in the stroma and tumor areas, similar to the core-fucosylated glycans, or only present in low abundance (Figure 6).
Figure 6. Representative N-glycans in two invasive ductal carcinoma breast samples with no necrotic regions.
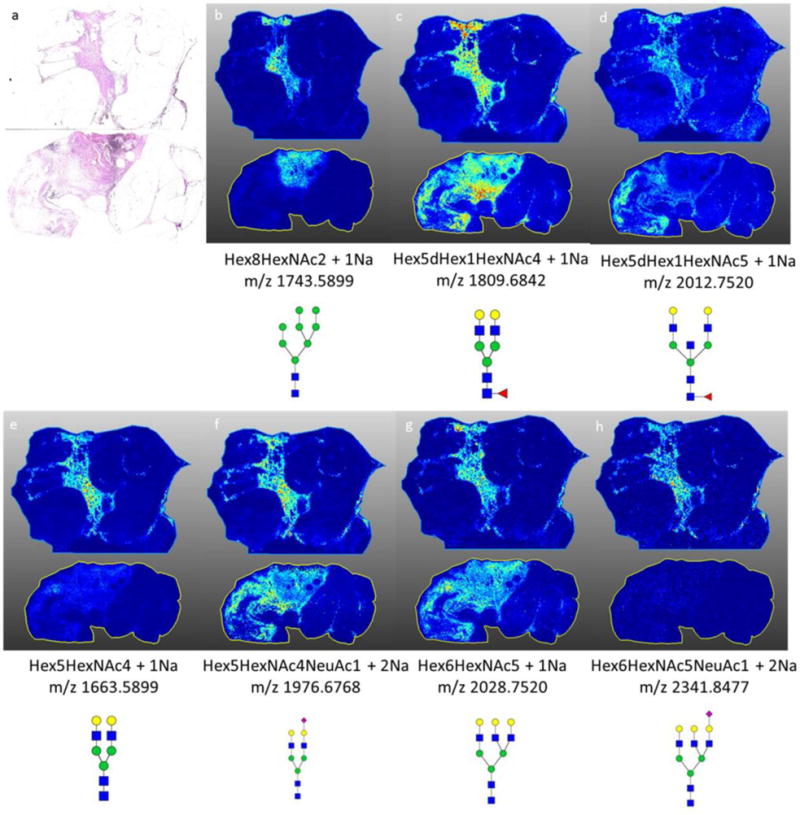
a) H&E stain of both invasive ductal carcinoma samples b) spatial localization of Hex8HexNAc + 1Na, high mannose structure with strong localization to the tumor region of the tissue; c–d) spatial localization of (c) Hex5dHex1HexNAc4 + 1Na and (d) Hex5dHex1HexNAc5 + 1Na, core fucosylated glycan with stromal association; e–h) spatial localization of glycans detected in the necrotic regions of breast tissues. MS images are from data analysis in SCiLS 2016b software.
Because this phenomenon was so obvious in the breast cancer samples with necrosis, three other tissues with necrotic regions were evaluated by N-glycan imaging, representing liver, thyroid, and cervical cancers. Each tissue was selected and annotated by a pathologist to verify that there were specific areas of tumor necrosis (Supplemental Figure 3). As shown in Figures 7 for a representative panel of the breast cancer necrosis glycans, these non-fucosylated glycans were also specific to the necrotic regions of the liver, cervical and thyroid cancer samples. The results, while only representing a small number of samples, imply that the N-glycans detected in necrotic tissues are likely representative of this cell death pathway and not the tissue/tumor of origin.
Figure 7. N-glycan necrosis profiles in other cancer tissues types.
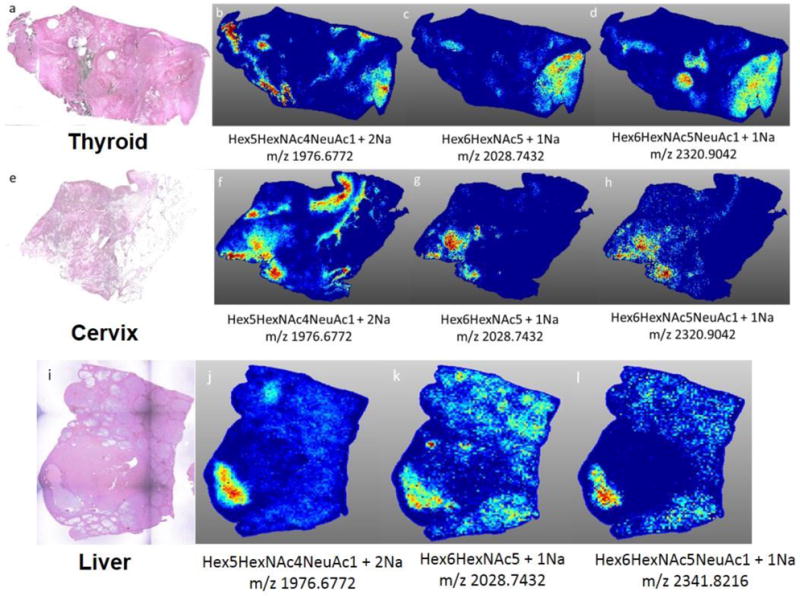
Three representative necrosis glycans (Hex5HexNAc4NeuAc1, Hex6HexNAc5, Hex6HexNAc5NeuAc1) are shown for each cancer type. a) H&E of thyroid cancer tissue (anaplastic, grade IV). b–d) spatial localization of necrotic region specific glycans. e) H&E of cervical cancer tissue (well differentiated, invasive squamous cell carcinoma) f–h) spatial localization of necrotic region specific glycans. i) H&E of liver cancer tissue (well differentiated, grade IV, HCV+);(j–l) spatial localization of necrotic region specific glycans. MS images are from data analysis in SCiLS 2016b software.
5. Discussion & Future Directions
Tumor necrosis in tissues occurs primarily in the most advanced and fastest growing tumors [18–20]. The glycans found to be specific to the necrotic regions all represent a structural class of N-glycans not typically known for abundant localization within the tumor region of cancers. Typically, the majority of the glycans that are found to be highly expressed within tumor regions are the high mannose, paucimannose or tri- and tetraantennary structures, highlighted in Figure 1. The increased presence of these branching structures has been linked to immune cell binding, and the ability of the cell to bind to distant organ or tissue sites. When this branching is not present, tumor progression is limited [6]. Stroma specific N-glycans, particularly those associated with collagens, typically contain a fucose modification, usually on the core N-acetylglucosamine of the structure. Because the glycans detected in these necrotic regions do not belong to either of these glycan classes typically found within the tumor microenvironment, their structural differences could be an indicator of a specific functional role within the necrotic tissue. A smaller mass N-glycan lacking core fucose, Hex3HexNAc5, was reported in the necrotic region of an advanced ovarian cancer tissue [17]. The overall complexity of the tumor microenvironment, the necrotic pathway and immune cell interactions combined with inherent tumor heterogeneity preclude a definitive conclusion that the N-glycans detected herein are the only ones that will be detected in necrotic tissues. However, this structural theme can be the basis for further studies of additional necrotic tissues in breast and other cancer types.
These findings indicate several possible directions that will need to be further explored. There are only a few reported studies that link the regulation of glycosylation with a cell death signaling pathway. Increased expression and activity of sialyltransferases has been described for tumor hypoxia [32]. The majority of the glycans detected in the necrotic regions contained sialic acid modifications, or were represented by simple structures with limited branching and fucosylation. This increase in sialylation could be due to the increased expression of TNFα. When examining human bronchial mucosa, studies found that the presence of TNFα increased the expression of glycosyltransferases that were responsible for the synthesis of sialylated glycans [33,34]. Because TNF is activated when a cancer tissue is undergoing necrosis, it could also be activating sialyltransferases which would result in the increase in sialic acid-containing glycans in areas of tumor necrosis. This theme held true not only within samples from varying breast cancer subtypes, but also in cervical, liver and thyroid cancer samples.
A broad conclusion from previous MALDI MS imaging studies evaluating hypoxia or necrosis in tissues is that in areas of necrosis, there were specific molecular signatures detected for lipids, metabolities and proteins [26–30]. Identifying specific N-glycan signatures in necrotic regions is therefore consistent with these other molecules. It is thus feasible that when necrosis is occurring that there are necrosis-specific glycoproteins involved and/or newly expressed, and their glycan structures reflect this function. Specific proteomic analysis of necrotic tissue in FFPE tissues is warranted, as this may highlight participating glycoproteins, as well as facilitate evaluation of changes in O-linked glycosylation and glycosaminoglycans. In support of this, one prior study of a metastatic mouse mammary tumor model used combined quantitative proteomics, laser capture microdissection and MALDI MS imaging methods to identify hypoxia-induced proteins in the tumor tissues. In addition to detection of expected metabolic enzymes, a known hypoxia-induced carbohydrate binding protein, galectin-1, was one of the major proteins identified as being differentially expressed and co-localized to hypoxic tissue regions [29]. There is a definitive nexus of metabolomic, lipidomic, glycomic and proteomic biomolecules specifically associated with hypoxic and necrotic tumor tissues that can be further evaluated.
Clearly, many additional samples with and without necrotic regions will need to be evaluated to verify that the N-glycans detected are representative of the necrotic cell death pathway and independent of the tissue of origin. It is evident from multiple MS imaging studies that there are distinct molecular signatures associated with necrotic tissue regions, including metabolites, lipids, proteins and glycans. The histopathological co-localization of the N-glycans in the necrotic tissue regions, and their relative abundance, represents a novel finding and continued study could lead to further mechanistic insights of cancer progression.
Supplementary Material
Highlights.
MALDI-FTICR MS imaging of N-glycans released by PNGaseF in FFPE tumor tissues allows structural classes of N-glycans to be specifically co-localized with regions of tumor and stroma.
A sub-class of abundant N-glycans were detected specifically in regions of tumor necrosis in breast, thyroid, cervic and liver cancer tissues.
The structures of the N-glycans present in regions of necrosis were generally non-fucosylated bi-antennary or tri-antennary structures with sialic acid modifications.
The presence of these necrosis-associated glycans appears to be due to the pathway of necrosis, and not the tumor tissue of origin.
Acknowledgments
This work was supported in part by grants from the National Cancer Institute, R21 CA207779 and R21 CA186799-01 to RRD, R01 CA120206 and U01 CA168856 to ASM, and by the Biorepository and Tissue Analysis Shared Resource, Hollings Cancer Center, Medical University of South Carolina (P30 CA138313). Additional support was from the SmartState South Carolina Centers of Economic Excellence (RRD and ASM).
Abbreviations
- CHCA
alpha-cyano-4-hydroxycinnamic acid
- DESI-MS
desorption electrospray ionization mass spectrometry
- FFPE
formalin-fixed paraffin embedded
- H&E
hematoxylin and eosin
- MALDI-FTICR MS
Matrix Assisted Laser Desorption/Ionization Fourier Transform Ion Cyclotron Resonance Mass Spectrometry
- MALDI-TOF MS
Matrix Assisted Laser Desorption/Ionization Time-of-Flight Mass Spectrometry N-linked, asparagine-linked
- PNGase F
peptide N-glycosidase F
- TNF
tumor necrosis factor
- FAS
apoptosis antigen 1
- TRAIL
tumor necrosis factor-related apoptosis-inducing ligand
- TLR
toll-like receptor
- PARP
polyADPribose polymerase, NAD+, nicotinamide adenine dinucleotide
- JNK
c-Jun N-terminal protein kinase
- RIP1
receptor-interacting protein 1
Footnotes
Publisher's Disclaimer: This is a PDF file of an unedited manuscript that has been accepted for publication. As a service to our customers we are providing this early version of the manuscript. The manuscript will undergo copyediting, typesetting, and review of the resulting proof before it is published in its final citable form. Please note that during the production process errors may be discovered which could affect the content, and all legal disclaimers that apply to the journal pertain.
References
- 1.Moremen KW, Tiemeyer M, Nairn AV. Vertebrate protein glycosylation: diversity, synthesis and function. Nature Reviews Molecular Cell Biology. 2012;13(7):448. doi: 10.1038/nrm3383. [DOI] [PMC free article] [PubMed] [Google Scholar]
- 2.Varki A. Biological roles of glycans. Glycobiology. 2016;27(1):3–49. doi: 10.1093/glycob/cww086. [DOI] [PMC free article] [PubMed] [Google Scholar]
- 3.Kudelka MR, Ju T, Heimburg-Molinaro J, Cummings RD. Simple sugars to complex disease-mucin-type o-glycans in cancer. Advances in Cancer Research. 2015;126:53–135. doi: 10.1016/bs.acr.2014.11.002. [DOI] [PMC free article] [PubMed] [Google Scholar]
- 4.Christiansen MN, Chik J, Lee L, Anugraham M, Abrahams JL, Packer NH. Cell surface protein glycosylation in cancer. Proteomics. 2014;14(4–5):525–546. doi: 10.1002/pmic.201300387. [DOI] [PubMed] [Google Scholar]
- 5.Pinho SS, Reis CA. Glycosylation in cancer: mechanisms and clinical implications. Nature Reviews Cancer. 2015;15(9):540–555. doi: 10.1038/nrc3982. [DOI] [PubMed] [Google Scholar]
- 6.Taniguchi N, Kizuka Y. Glycans and cancer: role of N-glycans in cancer biomarker, progression and metastasis, and therapeutics. Advances in Cancer Research. 2015;126:11–51. doi: 10.1016/bs.acr.2014.11.001. [DOI] [PubMed] [Google Scholar]
- 7.Munkley J, Elliott DJ. Hallmarks of glycosylation in cancer. Oncotarget. 2016;7(23):35478–35489. doi: 10.18632/oncotarget.8155. [DOI] [PMC free article] [PubMed] [Google Scholar]
- 8.Banazadeh A, Veillon L, Wooding KM, Zabet M, Mechref Y. Recent advances in mass spectrometric analysis of glycoproteins. Electrophoresis. 2017;38(1):162–189. doi: 10.1002/elps.201600357. [DOI] [PMC free article] [PubMed] [Google Scholar]
- 9.Thaysen-Andersen M, Packer NH. Advances in LC-MS/MS-based glycoproteomics: getting closer to system-wide site-specific mapping of the N- and O-glycoproteome. Biochimie Biophysica Acta. 2014;1844(9):1437–1452. doi: 10.1016/j.bbapap.2014.05.002. [DOI] [PubMed] [Google Scholar]
- 10.Khatri Hu H, Klein K, Leymarie J, Zaia NJ. A review of methods for interpretation of glycopeptide tandem mass spectral data. Glycoconj J. 2016;33(3):285–296. doi: 10.1007/s10719-015-9633-3. [DOI] [PMC free article] [PubMed] [Google Scholar]
- 11.Powers TW, Jones EE, Betesh LR, Romano PR, Gao P, Copeland JA, et al. Matrix assisted laser desorption ionization imaging mass spectrometry workflow for spatial profiling analysis of N-linked glycan expression in tissues. Analytical Chemistry. 2013;85:9799–9806. doi: 10.1021/ac402108x. [DOI] [PMC free article] [PubMed] [Google Scholar]
- 12.Powers TW, Neely BA, Shao Y, Tang H, Troyer DA, Mehta AS, et al. MALDI imaging mass spectrometry profiling of N-glycans in formalin-fixed paraffin embedded clinical tissue blocks and tissue microarrays. PLoS One. 2014;9(9):e106255. doi: 10.1371/journal.pone.0106255. [DOI] [PMC free article] [PubMed] [Google Scholar]
- 13.Powers TW, Holst S, Wuhrer M, Mehta AS, Drake RR. Two-Dimensional N-Glycan Distribution Mapping of Hepatocellular Carcinoma Tissues by MALDI-Imaging Mass Spectrometry. Biomolecules. 2015;5(4):2554–2272. doi: 10.3390/biom5042554. [DOI] [PMC free article] [PubMed] [Google Scholar]
- 14.Drake RR, Jones EE, Powers TW, Nyalwidhe JO. Altered glycosylation in prostate cancer. Adv Cancer Res. 2015;126:345–82. doi: 10.1016/bs.acr.2014.12.001. [DOI] [PubMed] [Google Scholar]
- 15.Heijs B, Holst S, Briaire-de Bruijn IH, van Pelt GW, de Ru AH, van Veelen, et al. Multimodal Mass Spectrometry Imaging of N-Glycans and Proteins from the Same Tissue Section. Analytical Chemistry. 2016;88:7745–7753. doi: 10.1021/acs.analchem.6b01739. [DOI] [PubMed] [Google Scholar]
- 16.Holst S, Heijs B, de Haan N, van Zeijl RJ, Briaire-de Bruijn IH, van Pelt GW, et al. Linkage-Specific in Situ Sialic Acid Derivatization for N-Glycan Mass Spectrometry Imaging of Formalin-Fixed Paraffin-Embedded Tissues. Analytical Chemistry. 2016;88(11):5904–5913. doi: 10.1021/acs.analchem.6b00819. [DOI] [PubMed] [Google Scholar]
- 17.Everest-Dass AV, Briggs MT, Kaur G, Oehler MK, Hoffmann P, Packer NH. N-Glycan MALDI Imaging Mass Spectrometry on Formalin-Fixed Paraffin-Embedded Tissue Enables the Delineation of Ovarian Cancer Tissues. Molecular and Cellular Proteomics. 2016;15(9):3003–3016. doi: 10.1074/mcp.M116.059816. [DOI] [PMC free article] [PubMed] [Google Scholar]
- 18.Proskuryakov SY, Gabai VL. Mechanisms of Tumor Cell Necrosis. Current Pharmaceutical Design. 2010;16:56–68. doi: 10.2174/138161210789941793. [DOI] [PubMed] [Google Scholar]
- 19.Richards CH, Mohammed Z, Qayyum T, Horgan PG, McMillan DC. The prognostic value of histological tumor necrosis in solid organ malignant disease: a systematic review. Future Oncol. 2011;7(10):1223–35. doi: 10.2217/fon.11.99. [DOI] [PubMed] [Google Scholar]
- 20.Zhang X, Chen L. The recent progress of the mechanism and regulation of tumor necrosis in colorectal cancer. J Cancer Res Clin Oncol. 2016;142:453–463. doi: 10.1007/s00432-015-1997-z. [DOI] [PMC free article] [PubMed] [Google Scholar]
- 21.Airley RE, Mobasheri A. Hypoxic regulation of glucose transport, anaerobic metabolism and angiogenesis in cancer: novel pathways and targets for anticancer therapeutics. Chemotherapy. 2007;53(4):233–56. doi: 10.1159/000104457. [DOI] [PubMed] [Google Scholar]
- 22.Meurette O, Rebillard A, Huc L, Le Moigne G, Merino D, Micheau O, Lagadic-Gossmann D, Dimanche-Boitrel MT. TRAIL induces receptor-interacting protein 1-dependent and caspase-dependent necrosis-like cell death under acidic extracellular conditions. Cancer Res. 2007;67(1):218–26. doi: 10.1158/0008-5472.CAN-06-1610. [DOI] [PubMed] [Google Scholar]
- 23.Eliasson MJ, Sampei K, Mandir AS, Hurn PD, Traystman RJ, Bao J, Pieper A, Wang ZQ, Dawson TM, Snyder SH, Dawson VL. Poly(ADP-ribose) polymerase gene disruption renders mice resistant to cerebral ischemia. Nat Med. 1997;3(10):1089–95. doi: 10.1038/nm1097-1089. [DOI] [PubMed] [Google Scholar]
- 24.Shen HM, Lin Y, Choksi S, Tran J, Jin T, Chang L, Karin M, Zhang J, Liu ZG. Essential roles of receptor-interacting protein and TRAF2 in oxidative stress-induced cell death. Mol Cell Biol. 2004;24(13):5914–5922. doi: 10.1128/MCB.24.13.5914-5922.2004. [DOI] [PMC free article] [PubMed] [Google Scholar]
- 25.Wu YT, Zhang S, Kim YS, Tan HL, Whiteman M, Ong CN, Liu ZG, Ichijo H, Shen HM. Signaling pathways from membrane lipid rafts to JNK1 activation in reactive nitrogen species-induced non-apoptotic cell death. Cell Death Differ. 2008;15(2):386–397. doi: 10.1038/sj.cdd.4402273. [DOI] [PubMed] [Google Scholar]
- 26.Jiang L, Chughtai K, Purvine SO, Bhujwalla ZM, Raman V, Paša-Tolić L, Heeren RM, Glunde K. MALDI-Mass Spectrometric Imaging Revealing Hypoxia-Driven Lipids and Proteins in a Breast Tumor Model. Anal Chem. 2015;87(12):5947–5956. doi: 10.1021/ac504503x. [DOI] [PMC free article] [PubMed] [Google Scholar]
- 27.Fernández R, Garate J, Lage S, Terés S, Higuera M, Bestard-Escalas J, López DH, Guardiola-Serrano F, Escribá PV, Barceló-Coblijn G, Fernández JA. Identification of Biomarkers of Necrosis in Xenografts Using Imaging Mass Spectrometry. J Am Soc Mass Spec. 2016;27:244–254. doi: 10.1007/s13361-015-1268-x. [DOI] [PubMed] [Google Scholar]
- 28.Tata A, Woolman M, Ventura M, Bernards N, Ganguly M, Gribble A, Shrestha B, Bluemke E, Ginsberg HJ, Vitkin A, Zheng J, Zarrine-Afsar A. Rapid Detection of Necrosis in Breast Cancer with Desorption Electrospray Ionization Mass Spectrometry. Sci Rep. 2016;6:35374. doi: 10.1038/srep35374. [DOI] [PMC free article] [PubMed] [Google Scholar]
- 29.Djidja MC, Chang J, Hadjiprocopis A, Schmich F, Sinclair J, Mršnik M, Schoof EM, Barker HE, Linding R, Jørgensen C, Erler JT. Identification of hypoxia-regulated proteins using MALDI-mass spectrometry imaging combined with quantitative proteomics. J Proteome Res. 2014;13(5):2297–313. doi: 10.1021/pr401056c. [DOI] [PubMed] [Google Scholar]
- 30.Sans M, Gharpure K, Tibshirani R, Zhang J, Liang L, Liu J, Young JH, Dood RL, Sood AK, Eberlin LS. Metabolic Markers and Statistical Prediction of Serous Ovarian Cancer Aggressiveness by Ambient Ionization Mass Spectrometry Imaging. Cancer Res. 2017;77(11):2903–2913. doi: 10.1158/0008-5472.CAN-16-3044. [DOI] [PMC free article] [PubMed] [Google Scholar]
- 31.Damerell D, Ceroni A, Maass K, Ranzinger R, Dell A, Haslam SM. Annotation of glycomics MS and MS/MS spectra using the GlycoWorkbench software tool. Methods Mol Biol. 2015;1273:3–15. doi: 10.1007/978-1-4939-2343-4_1. [DOI] [PubMed] [Google Scholar]
- 32.Kannagi R, Sakuma K, Miyazaki K, Lim KT, Yusa A, Yin J, Izawa M. Altered expression of glycan genes in cancers induced by epigenetic silencing and tumor hypoxia: clues in the ongoing search for new tumor markers. Cancer Sci. 2010;101(3):586–593. doi: 10.1111/j.1349-7006.2009.01455.x. [DOI] [PMC free article] [PubMed] [Google Scholar]
- 33.Colomb F, Vidal O, Bobowski M, Krzewinski-Recchi MA, Harduin-Lepers A, Mensier E, Jaillard S, Lafitte JJ, Delannoy P, Groux-Degroote S. TNF induces the expression of the sialyltransferase ST3Gal IV in human bronchial mucosa via MSK1/2 protein kinases and increases FliD/sialyl-Lewis(x)-mediated adhesion of Pseudomonas aeruginosa. Biochem J. 2014;457(1):79–87. doi: 10.1042/BJ20130989. [DOI] [PubMed] [Google Scholar]
- 34.Delmotte P, Degroote S, Lafitte JJ, Lamblin G, Perini JM, Roussel P. Tumor Necrosis Factor alpha Increases the Expression of Glycosyltransferases and Sulfotransferases Responsible for the Biosynthesis of Sialylated and/or Sulfated Lewis X Epitopes in the Human Bronchial Mucosa. Journal of Biological Chemistry. 2002;277:424–431. doi: 10.1074/jbc.M109958200. [DOI] [PubMed] [Google Scholar]
Associated Data
This section collects any data citations, data availability statements, or supplementary materials included in this article.


