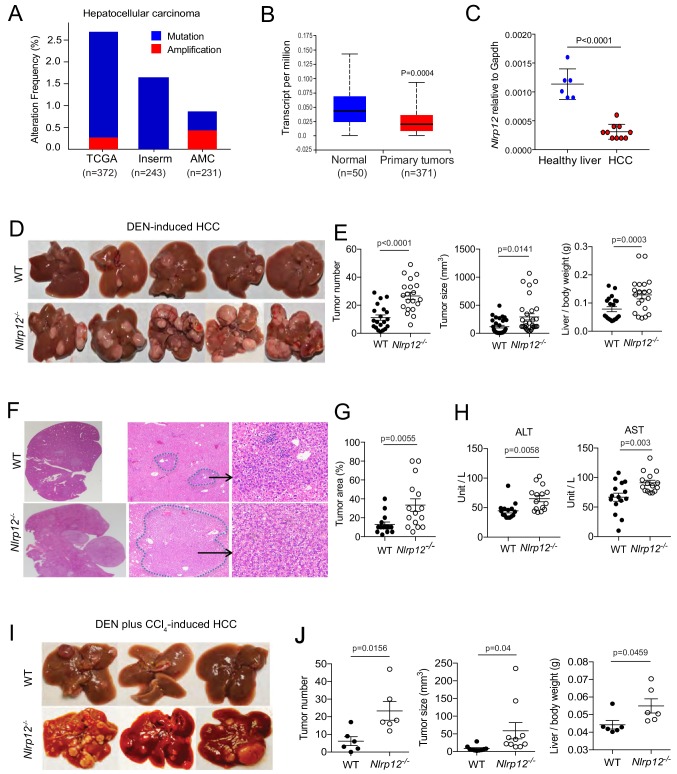
Figure 1. NLRP12 negatively regulates hepatocellular carcinoma.
(A) Analysis of genetic association of NLRP12 in HCC using the TCGA database through the cBioportal online platform. (B) Analysis of NLRP12 expression in human normal liver and HCC RNA-seq data in the TCGA database through the UALCAN web-portal. Data are presented in a box plot where whiskers represent maximum and minimum variables. (C) WT mice were injected with DEN (25 mg/kg i.p.) at the age of 14 days or left untreated. Livers from DEN-treated (n = 10) and untreated mice (n = 6) were analyzed for the expression of Nlrp12 by real-time qPCR. Data represent means ± SEM. (D–H) WT mice (n = 20) and Nlrp12-/- (n = 20) were injected with DEN (25 mg/kg i.p.) at the age of 14 days and sacrificed at 10 months after DEN injection. (D) Representative images of liver tumors are shown. (E) The number of tumors per liver, tumor sizes, and liver to body weight ratios were measured. Data represent means ± SEM (n = 20). Statistical difference was determined by two-tailed unpaired t-test. (F) Livers from mice described in D were stained for H and E. Representative H and E-stained sections are shown. (G) H and E-stained liver sections were histopathologically examined for adenoma development. Data represent means ± SEM (n = 15). Statistical difference was determined by two-tailed unpaired t-test. (H) Serum ALT and AST levels in tumor-bearing mice. Data represent means ± SEM (n = 15). Statistical difference was determined by two-tailed unpaired t-test. (I–J) WT (n = 6) and Nlrp12-/- (n = 6) mice were injected with DEN (25 mg/kg i.p.) at the age of 14 days followed by eight weekly injections of CCl4 (0.5 ml/kg i.p., dissolved in corn oil) starting at 10 weeks of age and euthanized at the age of 6 months. (I) Representative images of liver tumors are shown. (J) The numbers, sizes, and liver to body weight ratio were measured. Data represent means ± SEM. Statistical difference was determined by two-tailed unpaired t-test.


