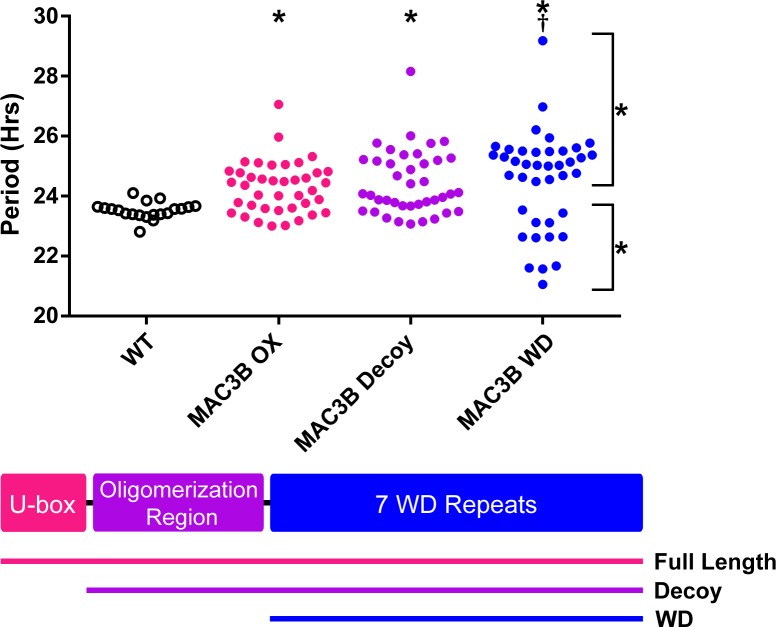
Figure 12. Period analyses of MAC3B overexpression constructs.
Period was measured in T1 MAC3B full length, MAC3B decoy, and MAC3B WD insertion plants. Period values presented are raw period values measured by CCA1p::Luciferase expression. A schematic of which domains are in each construct is included below.

