Abstract
BACKGROUND. HDL that contains apolipoprotein E (apoE) is a subspecies especially active in steps in reverse cholesterol transport, a process that brings cholesterol from peripheral cells to the liver. Here, we studied the effect of dietary unsaturated fat compared with carbohydrate on the metabolism of HDL containing apoE.
METHODS. We enrolled 9 adults who were overweight or obese and had below-average HDL-cholesterol in a crossover study of a high-fat diet, primarily unsaturated, and a low-fat, high-carbohydrate diet. A metabolic tracer study was performed after each diet period.
RESULTS. Dietary fat increased the secretion, metabolism, and clearance of HDL subspecies containing apoE. Dietary fat increased the rate of clearance of large cholesterol-rich HDL containing apoE and increased their conversion to small HDL containing apoE, indicating selective cholesterol ester delivery to the liver. The high-unsaturated-fat diet did not affect the metabolism of HDL lacking apoE.
CONCLUSION. HDL containing apoE is a diet-responsive metabolic pathway that renders HDL more biologically active in reverse cholesterol transport. This may be a mechanism by which unsaturated fat protects against coronary heart disease. Protein-based HDL subspecies such as HDL containing apoE may be used to identify additional atheroprotective treatment targets not evident in the total HDL-cholesterol measurement.
TRIAL REGISTRATION. ClinicalTrials.gov NCT01399632.
FUNDING. NIH and the National Center for Advancing Translational Science.
Keywords: Metabolism
Keywords: Lipoproteins
HDL containing apoE is a diet responsive metabolic pathway that renders HDL more biologically active in reverse cholesterol transport.
Introduction
A major function of HDL is to bring cholesterol from peripheral cells to the liver, either directly or via transfer to apolipoprotein B–containing (apoB-containing) lipoproteins, a process called reverse cholesterol transport. Reverse cholesterol transport consists of secretion of HDL, transfer of cholesterol from peripheral cells to HDL, size expansion of HDL, generation of small from large HDL by selective removal of cholesterol ester by hepatic scavenger receptor class B type 1 (SR-B1), and holoparticle clearance of HDL. In addition, transfer of cholesterol ester from HDL to apoB-containing lipoproteins may also be considered a component pathway of reverse cholesterol transport. Other enzymes and transfer proteins may participate in remodeling of HDL that facilitates clearance of HDL. There is evidence for reverse cholesterol transport in humans, primates, and mouse models. For example, a synthetic small HDL particle composed of phospholipid and apoA-I injected in humans increases its size over 24 hours as it circulates by taking up cholesterol (1). Small HDL particles, prepared by column chromatography or by delipidation and injected into monkeys, expand and subsequently are cleared while circulating (2, 3). Cholesterol ester in loaded macrophages injected in mice appears in the feces, a process dependent on the presence of HDL (4–6). Cholesterol nanoparticles injected into humans appear in HDL and are gradually esterified (7). This evidence supports the hypothesis that reverse cholesterol transport is a functioning pathway in humans that may be atheroprotective.
We adapted metabolic tracer methods and compartmental modeling used in our studies of apoB metabolism to find that all sizes of HDL are secreted into the circulation (8). Most plasma apoA-I HDL flux occurs within stable sizes ranging from 7 to 12 nm, and does not involve an increase in size category, for example from very small pre-β to large α-2 or α-3. HDL in each size category may expand and contract within its size range, as a function of the apoA-I trefoil structure (9, 10). Cholesterol transfer from cells to HDL can be useful in reverse cholesterol transport only if the expanded HDL particle has a means for efficient delivery of its cholesterol to the liver where it can perform its homeostatic role.
ApoE is a prime candidate for this hypothesis, because it facilitates all the steps of reverse cholesterol transport: HDL biogenesis, size expansion, regeneration of small HDL by selective cholesterol uptake by the liver from larger HDL, and holoparticle clearance by the liver of size-expanded HDL. First, HDL apoE increases HDL biogenesis in vitro by interacting with ATP-binding cassette, subfamily A, member 1 (ABCA1) (11). HDL containing apoE is a subspecies accounting for 5%–10% of total plasma apoA-I and has a relatively rapid secretion rate compared with HDL not containing apoE (12). Second, apoE facilitates size expansion in vitro by interacting with lecithin-cholesterol acyltransferase (LCAT) (11, 13–15), and apoE enhances HDL size expansion in vivo in humans (12). Finally, evidence in vitro and in animal models suggests that apoE facilitates removal of cholesterol-containing HDL from the body (16–19). This is due to the ability of apoE to bind to various liver receptors, including LDL receptor (LDL-R) (20), LDL-R–related protein (LRP) (21), and heparin/heparan sulfate proteoglycans (22–25). In abetalipoproteinemia, in which HDL is the main plasma lipoprotein, apoA-I on apoE-containing HDL is cleared from the circulation faster than apoA-I on HDL that does not contain apoE (26). In normal humans, we have shown that HDL containing apoE undergoes size expansion more so than HDL not containing apoE, and the expanded HDL is cleared from the circulation 5–10 times faster (12). Given these findings, we investigated whether this apoE-dependent, apparently protective process could be increased by an intervention such as dietary unsaturated fat.
Dietary fat increases plasma HDL-cholesterol (HDL-C) concentration when it replaces carbohydrates or protein in the diet (27, 28). Several studies found that dietary fat replacing carbohydrate increases the synthesis of plasma total apoA-I (29–31), whereas the effects on the fractional catabolic rate were mixed. It is not known whether the increased apoA-I synthesis is indicative of increased flux through reverse cholesterol transport pathways such as those involving apoE. We hypothesized that dietary unsaturated fat enhances these putatively beneficial pathways, as a mechanism by which it protects against cardiovascular disease (32). Up to now, research has not identified a mechanism involving HDL metabolism that links an HDL-C–raising treatment to prevention of atherosclerosis and cardiovascular disease (32). If such a mechanism exists, we hypothesized that it could be found in a diet effect that raises HDL-C and prevents cardiovascular disease, i.e., unsaturated fat.
Results
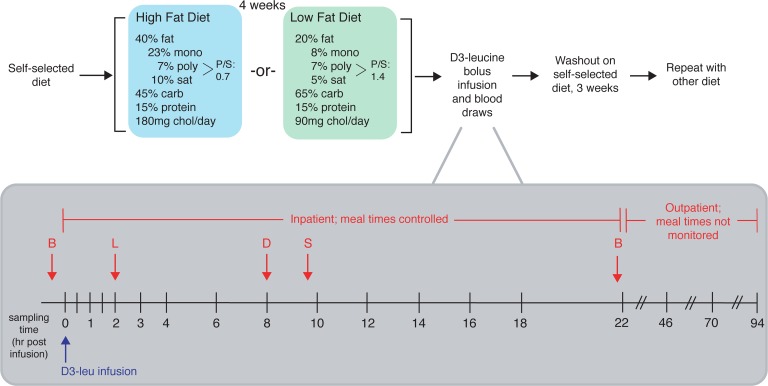
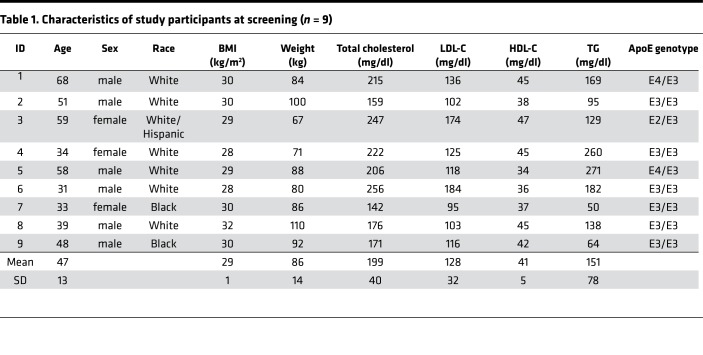
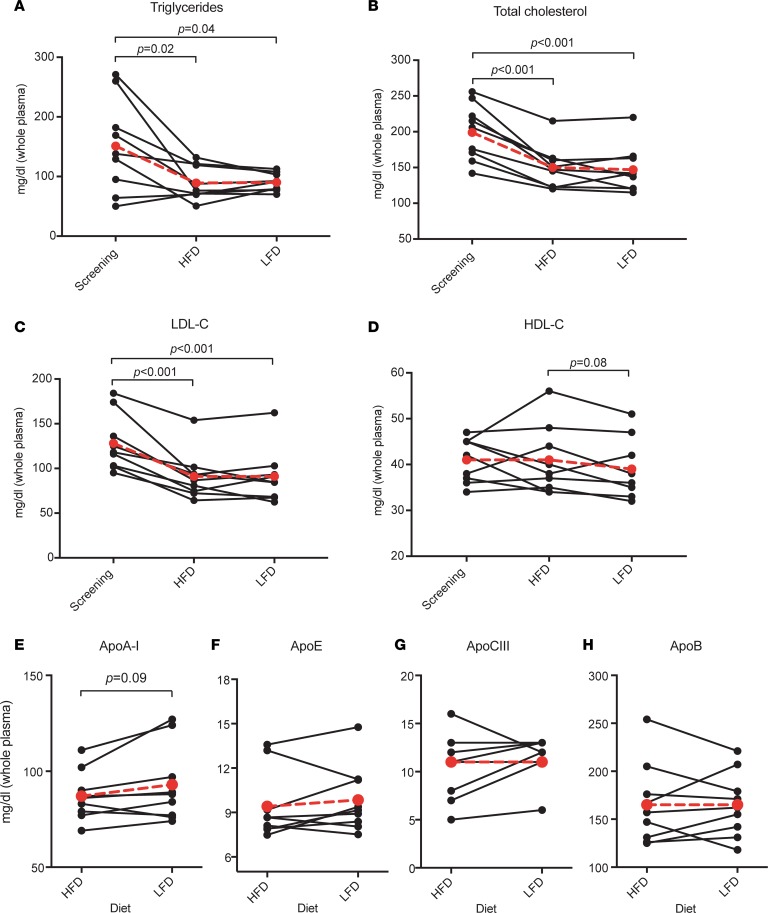
Nine participants completed the dietary intervention and tracer infusion protocol (Figure 1). Participants were randomized to either receive a high-unsaturated-fat (40% fat: composed of 23% monounsaturated, 7% polyunsaturated fat, and 10% saturated; 45% carbohydrate) or low-fat (20% fat: composed of 8% monounsaturated, 7% polyunsaturated, and 5% saturated; 65% carbohydrate) diet for 4 weeks. Outside food and any alcohol were not permitted. Participants were weighed weekly by dietitians to ensure that the diets remained isocaloric. On the morning of day 29, participants were admitted to the hospital for the tracer infusion protocol. They were instructed to eat the prescribed study breakfast before coming to the hospital. At 10 am (time 0), each participant received a bolus infusion of [5,5,5-2H3]-l-leucine (D3-leucine). Samples were collected at 0, 0.5, 1, 1.5, 2, 3, 4, 6, 8, 10, 12, 14, 16, 18, and 22 hours after infusion while the study participants were in the hospital. Participants also ate lunch, dinner, and a snack in the hospital, after which they were discharged from the hospital to return for the remaining blood draws (46, 70, and 94 hours). Before receiving the alternate diet and repeating the study protocol, participants were instructed to return to their usual diet for a washout period of 3 weeks. The characteristics of the participants are shown in Table 1. The average age was 47 years and all participants were overweight or obese (average BMI 29 kg/m2). Mean LDL-cholesterol was 128 mg/dl (range 95–184 mg/dl), mean triglycerides (TGs) were 151 mg/dl (range 50–260 mg/dl), and all participants had low HDL-C (mean 41 mg/dl, range 34–47 mg/dl). Six participants had the E3/E3 genotype, 2 had E4/E3, and 1 had E2/E3. Figure 2 shows the effect of the 2 study diets on fasting lipids and apolipoproteins. Both diets reduced plasma TG by approximately 30% (Figure 2A). Both diets significantly reduced total cholesterol (Figure 2B) and LDL-cholesterol (Figure 2C) by 25%–30% compared with levels at the screening visit when study participants were eating self-selected diets (P ≤ 0.001 for both diets). The changes on each diet were not significantly different from each other. There were no differences in HDL-C compared with screening. HDL-C was 5% higher on the high-fat compared with the low-fat diet (P = 0.076) (Figure 2D), whereas apoA-I was 7% lower (P = 0.09). The diets did not significantly affect plasma total concentrations of apoA-I, apoE, apoCIII, or apoB (Figure 2, E–H). Body weight of the participants was stable throughout the study, as intended (Supplemental Figure 1; supplemental material available online with this article; https://doi.org/10.1172/jci.insight.124620DS1).
Figure 1. Overview of dietary intervention and sampling protocol.
After screening, study participants were instructed to continue on their usual diet (self-selected diet) prior to the study period, upon which they were randomized to either receive a high-unsaturated-fat or low-fat diet for 4 weeks. After 4 weeks on either diet, subjects were admitted to the hospital on the morning of day 29 for the infusion protocol. They were instructed to eat the prescribed study breakfast (B) before coming to the hospital. At 10 am (time 0), each subject received a bolus infusion of D3-leucine. Samples were collected at 0, 0.5, 1, 1.5, 2, 3, 4, 6, 8, 10, 12, 14, 16, 18, and 22 hours after infusion while the study participants were in the hospital. Participants also ate lunch (L), dinner (D), and a snack (S) in the hospital. After the 22-hour sample was collected, participants were released from the hospital with their remaining study meals and were instructed to return to the hospital at 10 am for the next 3 days for the remaining blood draws (46, 70, and 94 hours). Before receiving the alternate diet and repeating the study protocol, they were instructed to return to their usual diet for a washout period of 3 weeks. Mono, monounsaturated fat; poly, polyunsaturated fat; sat, saturated fat; carb, carbohydrate; chol, cholesterol.
Table 1. Characteristics of study participants at screening (n = 9).
Figure 2. Effect of diet on fasting concentrations of plasma lipids and apolipoproteins.
Values (mg/dl) were measured at each study participant’s screening visit (lipids only) and following completion of each dietary intervention. HFD, high-fat diet; LFD, low-fat diet. Mean values (n = 9) shown in larger red circles and dotted red lines. P values were calculated using 2-tailed t test. (A) Triglycerides. (B) Total cholesterol. (C) LDL-cholesterol. (D) HDL-cholesterol. (E) ApoA-I. (F) ApoE. (G) ApoCIII. (H) ApoB.
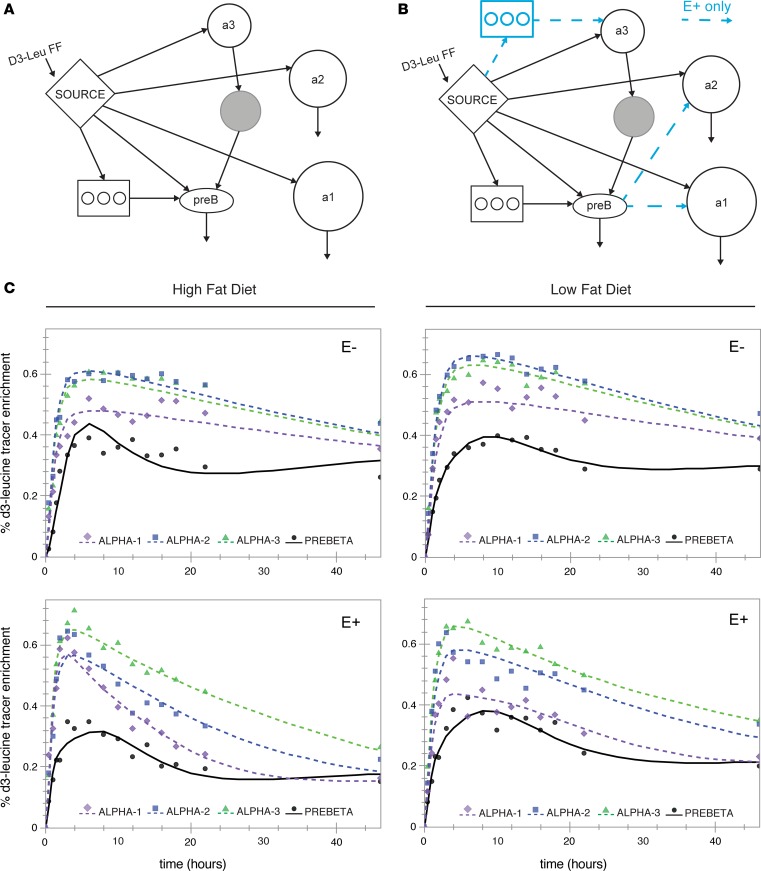
Figure 3 shows the models and model fits of the D3-leucine tracer enrichment of apoA-I on 4 sizes of HDL either containing apoE or not containing apoE (E+ or E–, respectively, in the figures). We started with the most parsimonious bare-minimum model (Figure 3A; see ref. 12) This model fit the apoA-I tracer enrichments of apoA-I on HDL not containing apoE, showing excellent visual fits as well as low standard deviations for each parameter value. Adjustments to the bare-minimum model are shown in Figure 3B (12). This model had size expansion pathways from pre-β HDL to the larger α-2 and α-1 sizes, and an intravascular delay compartment feeding into α-3 synthesis. These additional pathways were necessary to fit the apoA-I tracer enrichments in HDL containing apoE.
Figure 3. Model fit for apoA-I tracer enrichments for each HDL subspecies across 2 diets.
(A) SAAM-II compartmental model (bare-minimum model; see ref. 12). (B) Modifications to the bare-minimum model. Blue arrows and delay compartment represent additional pathways for the HDL containing apoE (E+) subspecies only. (C) Model fit for the mean (n = 9) apoA-I tracer enrichment on 4 sizes of HDL, across each HDL subspecies and diet. The percentage D3-leucine (D3-Leu) tracer enrichments (D3-leucine/[D3-leucine + D0-leucine] × 100) were generated by averaging all participants’ enrichments (n = 9) at each time point and modeling them as a single participant. Points = data; lines = model fit; a1 = α-1; a2 = α-2; a3 = α-3; preb = pre-β. FF, forcing function.
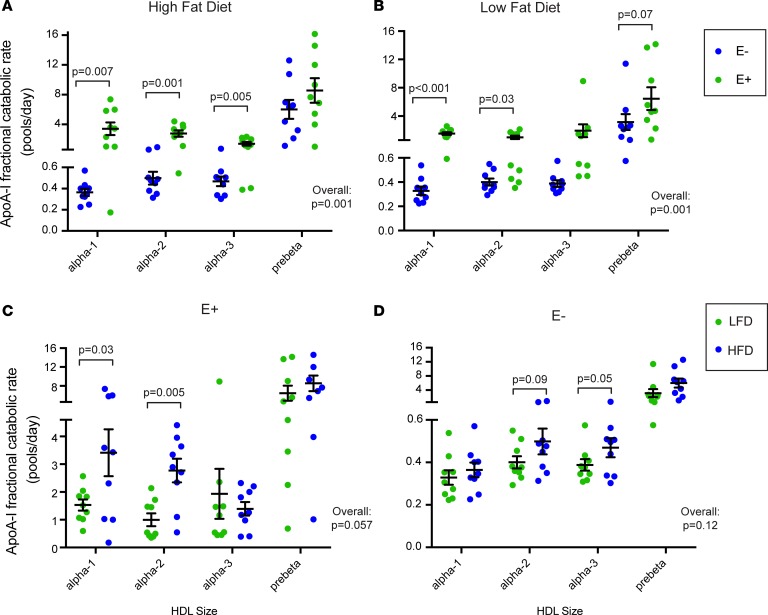
Figure 3C shows the mean (n = 9) D3-leucine tracer enrichment and SAAM-II model fit for apoA-I on 4 sizes of HDL either containing apoE or not containing apoE across 2 diets. The latest time points (70 and 94 hours) were removed from the analysis for visual purposes after determining that they did not affect fitting of the descending slope of the tracer enrichment curve. All sizes of HDL appeared in circulation around the same time. HDL containing apoE reached peak enrichment around 4–6 hours, and HDL not containing apoE at about 8–10 hours. Compared with apoA-I on HDL not containing apoE, apoA-I on HDL containing apoE had steeper ascending and descending slopes from the peak tracer enrichment, generally indicative of faster fractional catabolic rate (FCR). These faster rates are confirmed by compartmental kinetic analysis (Figure 4). On either diet, apoA-I on HDL containing apoE was cleared from the circulation approximately 10 times faster than HDL not containing apoE, except on the smallest pre-β HDL (Figure 4, A and B). When considering all sizes together, the overall difference in clearance between HDL containing apoE and HDL not containing apoE was highly significant for both diets (P = 0.001). The effect of diet was striking on HDL containing apoE (Figure 4C). The high-fat diet significantly increased apoA-I FCR on the larger HDL sizes, α-1 and α-2, by approximately 150%, and increased that of all sizes pooled together by 75% (P = 0.057). HDL not containing apoE had a 37% faster FCR on the high-fat diet, but the difference was not significant (P = 0.12) (Figure 4D). The differences in diet were not due to enrichment of apoE in HDL; the ratio of apoE/apoA-I was not significantly different between the 2 diets (high-fat diet 0.9 ± 0.1, low-fat diet 1.0 ± 0.3, P = 0.48)
Figure 4. Dietary unsaturated fat increases the metabolism of HDL containing apoE.
(A and B) HDL containing apoE (E+) has a faster FCR than HDL lacking apoE (E–) on both high-fat and high-carbohydrate diets. (C and D) Dietary unsaturated fat increases the clearance rates of the larger sizes (α-1 and α-2) of E+. ApoA-I fractional catabolic (turnover) rates (FCRs) in pools/day are shown for each HDL subspecies during intake of 2 diets. Each data point is an individual study participant (n = 9 for all). Black bar = mean, error bars = SEM. LFD, low-fat diet; HFD, high-fat diet. P values were calculated using paired 2-tailed t test. Overall P value for comparison considering all sizes together is shown on each graph. (A) Comparison of apoA-I FCRs on subspecies of E+ or E– in the context of a high-fat diet. (B) Comparison of apoA-I FCRs on subspecies of E+ or E– in the context of a low-fat diet. (C) Comparison of apoA-I FCRs across 2 diets only among the subspecies of E+. (D) Comparison of apoA-I FCRs across 2 diets only among the subspecies of E–.
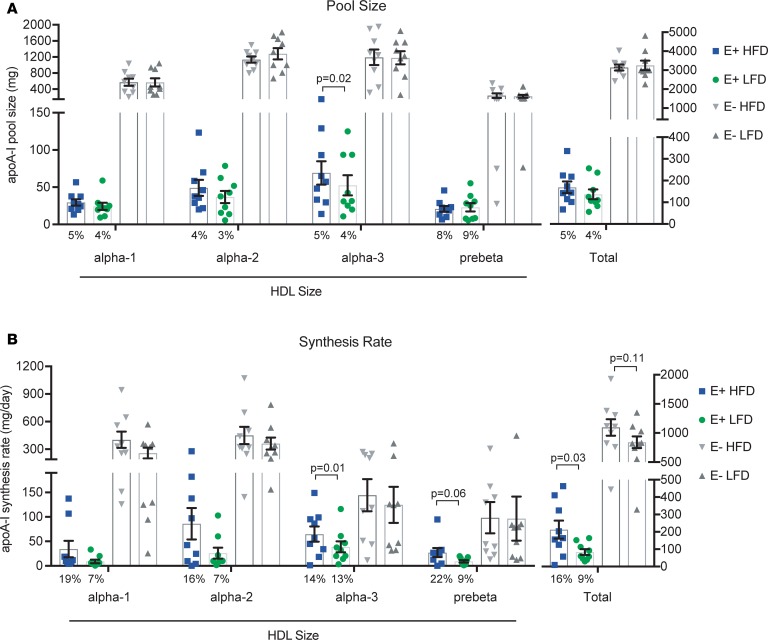
Figure 5 shows the effect of diet on the distribution of apoA-I mass and synthesis rates across 4 sizes of HDL either containing apoE or not containing apoE. Approximately 5% of apoA-I was present on HDL containing apoE, irrespective of diet (Figure 5A). About 70% of apoA-I was on the middle HDL sizes (α-2 and α-3), regardless of diet or subspecies (containing or not containing apoE). Overall, there was no effect of diet on apoA-I pool size.
Figure 5. Dietary unsaturated fat increases the synthesis of HDL containing apoE.
Mean (n = 9) plasma apoA-I pool sizes and synthesis rates are shown in 4 sizes of HDL subspecies containing apoE (E+) or not containing apoE (E–), across 2 diets (HFD, high-fat diet; LFD, low-fat diet). Error bars = SEM. P values were calculated using paired 2-tailed t test. (A) Mean pool size of apoA-I (mg) and percentage of apoA-I on E+ HDL (numbers below bars). (B) Mean synthesis rate of apoA-I (mg/day) and percentage of apoA-I synthesized on E+ HDL per day (numbers below bars).
The high-fat diet significantly increased the synthesis of apoA-I on HDL containing apoE by approximately 150% (P = 0.03) (Figure 5B). There was no significant dietary effect on the metabolism of HDL not containing apoE. Relative to its pool size, a disproportionate amount of apoA-I synthesis occurred on HDL containing apoE, especially on the high-fat diet (16% of total apoA-I synthesis vs. 5% of total apoA-I pool size).
The data from Figures 4 and 5 are tabulated in Supplemental Table 1.
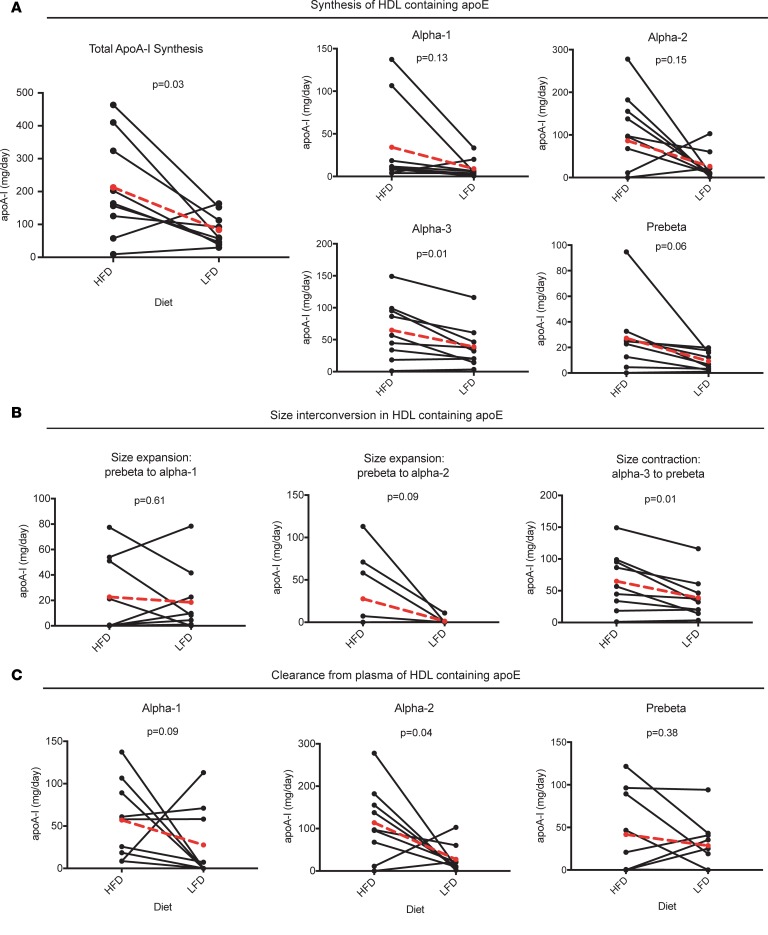
Figure 6 illustrates the effect of diet on HDL apoA-I flux in the apoE-containing subspecies via synthesis, size interconversion, and clearance pathways. The high-fat diet significantly increased the synthesis rate evident in each size subfraction (Figures 5B and 6A). The high-fat diet tended to increase size expansion from pre-β to α-2 (P = 0.09), and size contraction from α-3 to pre-β (P = 0.01) (Figure 6B). The high-fat diet also increased the clearance of α-1 by approximately 200% (P = 0.09) and that of α-2 by approximately 400% (P = 0.04) (Figure 6C).
Figure 6. HDL containing apoE (E+): dietary unsaturated fat increases apoA-I flux through synthesis, size interconversion, and clearance pathways.
Individual values shown, with mean value (n = 9) in larger red circles and dotted red line. HFD, high-fat diet; LFD, low-fat diet. P values were calculated using paired 2-tailed t test. (A) Pathways from the source compartment to each HDL size, representing synthesis and secretion from the liver (or small intestine) and appearance in plasma. (B) Pathways between HDL sizes, representing HDL size expansion or contraction. The source size and destination size are indicated above each graph. (C) Clearance of apoA-I on each HDL size from plasma. Note that all of α-3 is converted to pre-β and is thus not directly cleared from plasma (see Figure 3, A and B).
Discussion
Most of our knowledge of human HDL metabolism, as it occurs in vivo, has until recently been limited to synthesis and clearance rates of the total HDL. These broad parameters are difficult to associate with HDL functions, especially those in reverse cholesterol transport that represent HDL’s key function in controlling cholesterol accumulation in cells such as those in the arterial subendothelial space. HDL consists of subspecies that differ in specific proteins that operate in potentially health-related metabolic processes. HDL that contains apoE is a subspecies that accelerates steps in reverse cholesterol transport, such as size interconversions and clearance of large, cholesterol-rich HDL from the circulation (12). It has been unknown whether treatments including diet can affect the concentration or metabolism of the HDL apoE subspecies. We show that indeed dietary unsaturated fat causes metabolic changes in HDL apoE that have beneficial implications for prevention of atherosclerosis (32). Generalizing, these and other HDL subspecies may act to favor or suppress anti-atherogenic actions. This could open a new area of HDL research to identify and characterize subspecies defined by specific protein contents that could be targeted by nonpharmacological and pharmacological therapies.
The unsaturated-fat diet greatly affected the metabolism of the HDL subspecies containing apoE by increasing its synthetic rate by 150%, the generation of small from large HDL in the circulation by 67%, representing cholesterol ester removal by SR-B1 or cholesterol ester transfer protein (CETP), and the clearance rate by 75%. Of special relevance to reverse cholesterol transport, the high-unsaturated-fat diet increased the clearance rate of the large sizes of HDL containing apoE by 150%, and did not affect the smaller sizes, α-3 and pre-β. It is critically important for an HDL particle type that increased substantially in size by taking up and esterifying cholesterol to have an exit from the circulation to carry out the last step in reverse cholesterol transport. ApoE does that for HDL by interacting with several hepatic cell-surface receptors (20–25). Overall, flux through this pathway comprised 9% of total apoA-I flux on the low-fat diet, which the unsaturated-fat diet increased to 16%. These fluxes may be higher in those who are not overweight and who do not have dyslipidemia, as were the participants in this study, because those who were overweight or obese have more HDL containing apoCIII compared with participants with normal body weight (33). ApoCIII suppresses the size expansion and clearance rate of HDL containing apoE (12). Circumstances did not allow us to study the dietary effects on HDL apoCIII in this study. We do not know the pathways through which apoE appears on HDL, for example through direct synthesis of HDL particles, or by transfer in the circulation of apoE from other HDL particles or apoB lipoproteins. It is also unknown to what extent apoE is catabolized with its associated HDL particles or independently of the particles.
Our previous findings identifying unique metabolic properties of HDL containing apoE were in the context of a high-unsaturated-fat diet (12). Here, we replicated these results in the same participants but provided with a low-fat, high-carbohydrate diet. Although the number of participants is 9 here and 18 in the previous study, the consistency upon replication, moreover on a different diet, strengthens the central metabolic uniqueness of the apoE-containing HDL subspecies.
Although, overall, HDL that contains apoE is a minority of HDL particles, it is especially active in specific kinetic pathways that imply reverse cholesterol transport. Dietary fat–induced acceleration of synthesis, size expansion, contraction, and clearance may over the long run gradually improve cholesterol balance in the arterial wall.
A critical finding of this work is that a study on HDL metabolism that only involves plasma total HDL conceals the important effects of an intervention on HDL subspecies. Therapeutics aimed at increasing HDL-C or apoA-I concentrations could be misguided efforts if they increase HDL-C but do not enhance reverse cholesterol transport, and conversely, therapeutics that do not alter levels of HDL-C or apoA-I could have unseen adverse metabolic effects such as impaired reverse cholesterol transport. A potentially more useful approach is designing therapies that, regardless of their consequent effects on HDL-C or apoA-I, target the steps of reverse cholesterol transport: increasing HDL biogenesis, facilitating size expansion by cholesterol efflux, increasing generation of small from large HDL, and increasing clearance of cholesterol-rich large HDL. We have seen all aspects of this process in HDL containing apoE (12), which we now show are further driven by dietary unsaturated fat.
Strengths of our study are in the study population, dietary intervention, and robustness of kinetic models. Our study population is heterogeneous, including both males and females over a large age range, with the clinically relevant low-HDL, high-BMI phenotype (Table 1). The diets were completely controlled rather than relying on participants to select and prepare the high- and low-fat diets, and self-report food intake. Additionally, both diets were isocaloric, removing the confounding effects of weight change on HDL and apoA-I levels. Both diets featured contemporary foods and were not extreme in their macronutrient formulations; our intent was to study the differences between ordinary healthy diets. Finally, our kinetic models (12) were universally used across all participants on both diets, strengthening the concept that the framework for HDL metabolism is conserved across people and diets.
Limitations of our study include the lack of a normal HDL-C, non-obese comparison group. We anticipate that the function of HDL containing apoE, represented by flux of apoA-I through this subspecies, will be greater in a normal group. Second, the small sample size led to insufficient power to detect modest dietary effects on metabolism, such as on HDL not containing apoE. Third, we infer but do not study directly effects of diet on steps in reverse cholesterol transport. Fourth, it is not known to what extent total reverse cholesterol transport, measured in an in vivo kinetic study, is correlated with macrophage-specific reverse cholesterol transport which may bear more directly on atheroprotection (6, 34). Finally, although dietary unsaturated fat compared with carbohydrate has beneficial effects on lipoprotein risk factors and relative risk for coronary heart disease, low-fat diets may also have health-promoting effects depending on their composition (32).
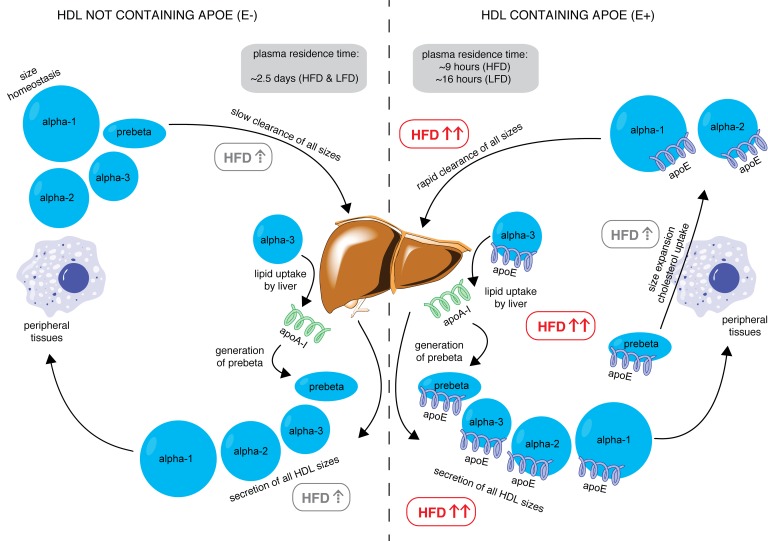
In conclusion, we have shown for the first time to our knowledge that an intervention can drive the metabolism of HDL subspecies, and thus potentially facilitate reverse cholesterol transport in humans (Figure 7). Compared with a low-fat diet, a diet high in unsaturated fat preferentially increases the appearance in plasma of HDL containing apoE, a particle type that is presumably active in reverse cholesterol transport; promotes size interconversion of HDL apoE, indicative of cholesterol uptake by HDL and transfer to cells and apoB lipoproteins; and increases the holoparticle clearance from plasma of this HDL subspecies. These metabolic properties, augmented by dietary unsaturated fat, could render this HDL subspecies more proficient in reverse cholesterol transport, the hallmark of HDL function, and reveal a new mechanism for the protection by unsaturated fat against CVD and a new target for new therapies that act on HDL. Generalizing, other HDL subspecies may act to favor or suppress anti-atherogenic actions. This could open a new area of HDL research to identify and characterize subspecies defined by specific protein contents that could be targeted by nonpharmacological and pharmacological therapies.
Figure 7. Model of reverse cholesterol transport stimulated by dietary unsaturated fat (HFD) through HDL containing apoE.
In the left panel, HDL not containing apoE is secreted in all sizes by the liver, which is weakly stimulated by HFD (gray box with dashed up arrow). This HDL subspecies visits peripheral tissues (represented by the macrophage), where it may take up cholesterol but is insufficient to increase HDL to a larger size category. This HDL subspecies is cleared slowly by the liver with an average residence time of approximately 2.5 days, regardless of diet. In the right panel, the HFD significantly increases secretion of all sizes of HDL containing apoE (red box with bold red arrows). This HDL visits peripheral tissues, takes up cholesterol, and undergoes size expansion, which is stimulated by HFD. HFD significantly increases clearance of this subspecies as well as size contraction from α-3, representing lipid uptake and pre-β generation at the liver, reducing the residence time to approximately 9 hours (HFD) and 16 hours (low-fat diet, LFD). These actions together may represent enhanced reverse cholesterol transport (RCT) driven by high-unsaturated-fat diets.
Methods
Eligibility criteria.
We recruited adults 21–75 years old who had low HDL-C (≤45 mg/dl for men, ≤55 mg/dl for women) and high BMI (25–35 kg/m2), and at least one apoE3 allele. We hypothesized that apoE3 from a single allele is sufficient to affect HDL metabolism. Exclusion criteria included HDL-C (<20 mg/dl), LDL-C (>190 mg/dl), TGs (>500 mg/dl), use of lipid-lowering medications or hormone replacement therapy, or history of diabetes.
Dietary protocol and infusion protocol.
A schema of the study protocol is shown in Figure 1. The participants received 2 diets in a random (variable order, computer generated) crossover design: a high-unsaturated-fat diet (45% carbohydrate, 40% fat [10% saturated, 23% monounsaturated, 7% polyunsaturated], 15% protein, 180 mg cholesterol per day) and a low-fat diet (65% carbohydrate, 20% fat [10% saturated, 8% monounsaturated, 7% polyunsaturated], 15% protein, 90 mg cholesterol per day), each for 28 days. The identity of the diets was not concealed. The study manager enrolled the participants and assigned them to a sequence. Both diets were designed to be healthy, heavily featuring vegetable oils, nuts, and whole grains. Registered dieticians formulated the diets at the Center for Clinical Investigation nutrition research unit of Brigham and Women’s Hospital. Participants picked up all their food to take home on Monday, Wednesday, and Friday at the study site. All food and beverages were provided, and participants were not allowed to eat any other food, but were allowed diet soda, coffee, and tea. Alcoholic beverages were not included or permitted. Participants were asked not to alter their usual physical activity pattern. Participants were weighed during food pickups and dietitians adjusted the amount of food to prevent changes in weight (Supplemental Figure 1). These procedures have been used in our previous studies (8, 12, 35, 36).
After 4 weeks on the first diet, participants were admitted to the Clinical and Translational Science Center at Brigham and Women’s Hospital for a bolus infusion of [5,5,5-2H3]-l-leucine (D3-leucine), an amino acid isotope tracer (Cambridge Isotope Laboratories), at a dose of 10 mg/kg of body weight, administered in a volume of 150 ml over 10 minutes. Blood was taken right before the infusion (time 0) and at regular time points following the infusion up to 94 hours (0.5, 1, 1.5, 2, 3, 4, 6, 8, 10, 12, 14, 16, 18, 22, 46, 70, and 94 hours after infusion), into chilled tubes that had been kept at 4°C. Up to 22 hours, participants received a low-leucine diet in the hospital as an inpatient so as to promote the incorporation of tracer leucine, rather than dietary leucine, into synthesized proteins. Following the 22-hour time point, participants were released from the hospital with the remaining study meals and instructed to return every morning for the next 3 days, up to 94 hours. After the completion of the last time point, participants were instructed to return to their normal diet for a washout period of 2 weeks before restarting the protocol with the second diet.
Collected plasma was separated immediately in a refrigerated centrifuge and aliquoted into tubes containing phenylmethanesulfonyl fluoride, gentamicin, benzamidine, and a protease inhibitor cocktail (all from MilliporeSigma). Aliquots were immediately placed into storage at –80°C until lipoprotein separation began after a median time of 3.5 months (range 1 to 18 months).
HDL subspecies separation using immunoaffinity column chromatography.
These methods have been described in detail (33). Briefly, thawed plasma from each time point was incubated with Sepharose 4B immunoaffinity columns (Bio-Rad) containing affinity-purified polyclonal antibodies against apoA-I (Academy Biomedical, catalog 11A-G2b). The apoA-I–containing bound lipoproteins were eluted with 3 M sodium thiocyanate, and immediately desalted in PBS. This procedure was repeated with the unbound lipoproteins to improve recovery of apoA-I. Then, apoA-I–containing lipoproteins were incubated in an anti-apoE immunoaffinity column (Academy Biomedical, catalog 50A-G1b) to separate HDL into 2 subspecies: HDL not containing apoE and HDL containing apoE. Repeat incubation of unbound HDL with apoE columns was not needed. Efficiency of columns was measured and determined to be 90% for apoA-I and 99% for apoE.
HDL size separation and apoA-I purification.
These methods have been described in detail (8). Briefly, the HDL subspecies were separated by using nondenaturing polyacrylamide gel electrophoresis (PAGE) in a 4%–30% gradient gel (Jule Biotechnologies) into 4 sizes, from largest to smallest: α-1 (9.5–12.2 nm), α-2 (8.2–9.5 nm), α-3 (7.1–8.2 nm), and pre-β (<7.1 nm) and then electrophoretically transferred to 0.45-μm polyvinylidene difluoride (PVDF) membranes. The membranes were then stained with 0.2% amido black. HDLs of each size were excised from the PVDF membranes and eluted overnight at 4°C in Tris/SDS/Triton X-100. ApoA-I from each HDL size was purified using SDS-PAGE in a 4%–20% gradient, transferred to a PVDF membrane, and stained with 0.2% amido black. Excised apoA-I bands underwent amino acid hydrolysis and derivatization to heptafluorobutyric acid esters. Measurements of tracer enrichment were performed by gas chromatography/single-ion-monitoring mass spectrometry as previously described (35). Investigators and laboratory technicians were blinded to the diet allocation of each sample during laboratory separation and purification.
Tracer enrichment and pool size.
The apoA-I tracer enrichment at each time point was defined as the area under the curve (AUC) of D3-leucine/(AUC of D3-leucine + AUC of D0-leucine). ApoA-I concentration of each HDL subspecies was measured at each time point using SDS-PAGE band densitometry, corrected to plasma total apoA-I values determined by ELISA. ApoA-I pool size was determined by multiplying apoA-I concentration by plasma volume, which was assumed to be 4.4% of ideal body weight (calculated using a BMI of 25 kg/m2). Because all participants were overweight, we adjusted the plasma volume using the following formula: Adjusted plasma volume = ideal body weight × 0.044 + excess weight × 0.010 (37).
Model development and kinetic analysis.
Compartmental modeling was performed using SAAM-II (The Epsilon Group) (38). We constructed models using prior knowledge about human HDL physiology (8, 12). The input was a forcing function using free plasma leucine isotopic enrichment. The model outputs were rate constants (in pools/hour, converted to pools/day) and flux measurements (in mg/hour, converted to mg/day), each with a standard deviation and 95% confidence interval. For each HDL subspecies, we chose the most parsimonious model (fewest number of parameters), on the condition that it had favorable statistics (95% confidence intervals for parameter estimations that excluded zero). FCRs for a specific HDL subspecies were calculated by summing all the rate constants out of the compartment for that subspecies. All models were initially established by using the average data of the participants, following which the data for each participant were modeled individually to achieve population statistics. For more information on model development, the reader is referred to Morton et al. (12) supplemental.
Plasma lipid and apolipoprotein measurements.
Plasma lipid concentrations were measured at screening and the 18-hour time point of the infusion protocol, 8.5 hours after dinner. Cholesterol and TGs were measured using an enzymatic assay (Thermo Fisher Scientific). HDL-C was measured in the supernatant of plasma after the precipitation of apoB-containing lipoproteins with dextran sulfate (50,000 MW, Genzyme). LDL-C was estimated using the Friedewald equation (39). ELISA using affinity-purified antibodies (Academy Bio-Medical Co.) was performed to measure fasting plasma concentrations of apoA-I, apoE, apoCIII, and apoB. ELISA plates were read with a BioTek Synergy HT 96-well plate reader controlled by Gen5 1.10 software. All assays were completed in triplicate, and any sample with an intra-assay coefficient of variation greater than 15% was repeated. Final data were exported to GraphPad Prism for analysis and database management.
ApoE genotyping.
We performed genotyping on buffy coat samples using the ABI PRISM 7900HT Sequence Detection System (Applied Biosystems) in 384-well format. The TaqMan 5′ nuclease assay was used to distinguish the 2 alleles of a gene. PCR amplification was carried out on 5–20 ng DNA using 1× TaqMan universal PCR master mix (no AmpErase UNG) in a 5 ml reaction volume. Amplification conditions on an AB 9700 dual plate thermal cycler (Applied Biosystems) were as follows: 1 cycle of 95°C for 10 minutes, followed by 50 cycles of 92°C for 15 seconds and 60°C for 1 minute. TaqMan assays were ordered using the ABI Assays-on-Demand service.
Statistics.
The main outcomes were the pool size, production, and clearance rates of apoA-1 in HDL that contains apoE. Sample size was determined from variability data of metabolic rates from previous studies of lipoprotein metabolism (8, 36). These were simply projections because the outcome variables had never been measured. We also took into account that a sample size of 9 sufficed to identify significant differences in metabolic rates between types of participants and dietary effects. The results are presented as means ± SEM unless otherwise specified. Paired 2-tailed t tests were used to compare 2 parameters in the same participants (for example, apoA-I FCRs in HDL containing vs. not containing apoE, or apoA-I pool sizes in HDL containing apoE on a high-fat vs. low-fat diet). Tests to compare HDL subspecies were carried out independently in each HDL size. Significance was defined as P < 0.05 unless otherwise specified. All statistical analysis was performed using GraphPad Prism 7.
Study approval.
The study was performed in accordance with the principles of the Declaration of Helsinki and all procedures were approved by the Human Subjects Committee at Brigham and Women’s Hospital and Harvard T.H. Chan School of Public Health. All participants gave written informed consent.
Author contributions
AMM conducted experiments, developed compartmental models, analyzed the data, and drafted the manuscript. COM, JDF, and FMS designed the research studies and laboratory methods. FMS revised the manuscript and secured funding.
Supplementary Material
Acknowledgments
The authors would like to acknowledge Louise Bishop and the dietetics team at the Clinical and Translational Science Center at Brigham and Women’s Hospital for their assistance with participant recruitment and the dietary protocol. The authors would also like to acknowledge Jane Lee, Warren Fletcher, Barry Guglielmo, Meghan Bettencourt, and Sue Wong-Lee for technical assistance and Vanessa Byles for assistance with apoE genotyping. This work was supported by NIH grant R01HL095964 to FMS and by a grant to the Harvard Clinical and Translational Science Center (8UL1TR0001750) from the National Center for Advancing Translational Science.
Version 1. 04/04/2019
Electronic publication
Footnotes
COM’s present address is: Department of Medicine, Universidad de los Andes, Bogotá, Colombia and Section of Endocrinology, Department of Internal Medicine, Fundación Santa Fe de Bogotá, Bogotá, Colombia.
Conflict of interest: FMS was a consultant to Pfizer and MedImmune-Astra Zeneca on drug development and was an expert witness in cases involving Aegerion, Abbvie, and Pfizer. FMS and JDF are inventors on patents awarded to Harvard University pertaining to HDL.
Copyright: © 2019, American Society for Clinical Investigation.
Reference information: JCI Insight. 2019;4(7):e124620. https://doi.org/10.1172/jci.insight.124620.
References
- 1.Nanjee MN, et al. Intravenous apoA-I/lecithin discs increase pre-beta-HDL concentration in tissue fluid and stimulate reverse cholesterol transport in humans. J Lipid Res. 2001;42(10):1586–1593. [PubMed] [Google Scholar]
- 2.Colvin PL, Moriguchi E, Barrett PH, Parks JS, Rudel LL. Small HDL particles containing two apoA-I molecules are precursors in vivo to medium and large HDL particles containing three and four apoA-I molecules in nonhuman primates. J Lipid Res. 1999;40(10):1782–1792. [PubMed] [Google Scholar]
- 3.Sacks FM, et al. Selective delipidation of plasma HDL enhances reverse cholesterol transport in vivo. J Lipid Res. 2009;50(5):894–907. doi: 10.1194/jlr.M800622-JLR200. [DOI] [PMC free article] [PubMed] [Google Scholar]
- 4.Zhang Y, Zanotti I, Reilly MP, Glick JM, Rothblat GH, Rader DJ. Overexpression of apolipoprotein A-I promotes reverse transport of cholesterol from macrophages to feces in vivo. Circulation. 2003;108(6):661–663. doi: 10.1161/01.CIR.0000086981.09834.E0. [DOI] [PubMed] [Google Scholar]
- 5.Moore RE, et al. Increased atherosclerosis in mice lacking apolipoprotein A-I attributable to both impaired reverse cholesterol transport and increased inflammation. Circ Res. 2005;97(8):763–771. doi: 10.1161/01.RES.0000185320.82962.F7. [DOI] [PubMed] [Google Scholar]
- 6.Cuchel M, Rader DJ. Macrophage reverse cholesterol transport: key to the regression of atherosclerosis? Circulation. 2006;113(21):2548–2555. doi: 10.1161/CIRCULATIONAHA.104.475715. [DOI] [PubMed] [Google Scholar]
- 7.Cuchel M, et al. A novel approach to measuring macrophage-specific reverse cholesterol transport in vivo in humans. J Lipid Res. 2017;58(4):752–762. doi: 10.1194/jlr.M075226. [DOI] [PMC free article] [PubMed] [Google Scholar]
- 8.Mendivil CO, Furtado J, Morton AM, Wang L, Sacks FM. Novel pathways of apolipoprotein A-I metabolism in high-density lipoprotein of different sizes in humans. Arterioscler Thromb Vasc Biol. 2016;36(1):156–165. doi: 10.1161/ATVBAHA.115.306138. [DOI] [PMC free article] [PubMed] [Google Scholar]
- 9.Huang R, et al. Apolipoprotein A-I structural organization in high-density lipoproteins isolated from human plasma. Nat Struct Mol Biol. 2011;18(4):416–422. doi: 10.1038/nsmb.2028. [DOI] [PMC free article] [PubMed] [Google Scholar]
- 10.Sacks FM, Jensen MK. From high-density lipoprotein cholesterol to measurements of function: prospects for the development of tests for high-density lipoprotein functionality in cardiovascular disease. Arterioscler Thromb Vasc Biol. 2018;38(3):487–499. doi: 10.1161/ATVBAHA.117.307025. [DOI] [PMC free article] [PubMed] [Google Scholar]
- 11.Kypreos KE, Zannis VI. Pathway of biogenesis of apolipoprotein E-containing HDL in vivo with the participation of ABCA1 and LCAT. Biochem J. 2007;403(2):359–367. doi: 10.1042/BJ20061048. [DOI] [PMC free article] [PubMed] [Google Scholar]
- 12.Morton AM, et al. Apolipoproteins E and CIII interact to regulate HDL metabolism and coronary heart disease risk. JCI Insight. 2018;3(4):98045. doi: 10.1172/jci.insight.98045. [DOI] [PMC free article] [PubMed] [Google Scholar]
- 13.Mahley RW, Huang Y, Weisgraber KH. Putting cholesterol in its place: apoE and reverse cholesterol transport. J Clin Invest. 2006;116(5):1226–1229. doi: 10.1172/JCI28632. [DOI] [PMC free article] [PubMed] [Google Scholar]
- 14.Koo C, Innerarity TL, Mahley RW. Obligatory role of cholesterol and apolipoprotein E in the formation of large cholesterol-enriched and receptor-active high density lipoproteins. J Biol Chem. 1985;260(22):11934–11943. [PubMed] [Google Scholar]
- 15.Settasatian N, Barter PJ, Rye KA. Remodeling of apolipoprotein E-containing spherical reconstituted high density lipoproteins by phospholipid transfer protein. J Lipid Res. 2008;49(1):115–126. doi: 10.1194/jlr.M700220-JLR200. [DOI] [PubMed] [Google Scholar]
- 16.Innerarity TL, Pitas RE, Mahley RW. Receptor binding of cholesterol-induced high-density lipoproteins containing predominantly apoprotein E to cultured fibroblasts with mutations at the low-density lipoprotein receptor locus. Biochemistry. 1980;19(18):4359–4365. doi: 10.1021/bi00559a032. [DOI] [PubMed] [Google Scholar]
- 17.Hui DY, Innerarity TL, Mahley RW. Lipoprotein binding to canine hepatic membranes. Metabolically distinct apo-E and apo-B,E receptors. J Biol Chem. 1981;256(11):5646–5655. [PubMed] [Google Scholar]
- 18.Blum CB, Deckelbaum RJ, Witte LD, Tall AR, Cornicelli J. Role of apolipoprotein E-containing lipoproteins in abetalipoproteinemia. J Clin Invest. 1982;70(6):1157–1169. doi: 10.1172/JCI110714. [DOI] [PMC free article] [PubMed] [Google Scholar]
- 19.Funke H, Boyles J, Weisgraber KH, Ludwig EH, Hui DY, Mahley RW. Uptake of apolipoprotein E-containing high density lipoproteins by hepatic parenchymal cells. Arteriosclerosis. 1984;4(5):452–461. doi: 10.1161/01.ATV.4.5.452. [DOI] [PubMed] [Google Scholar]
- 20.Mahley RW, Innerarity TL. Lipoprotein receptors and cholesterol homeostasis. Biochim Biophys Acta. 1983;737(2):197–222. doi: 10.1016/0304-4157(83)90001-1. [DOI] [PubMed] [Google Scholar]
- 21.Beisiegel U, Weber W, Ihrke G, Herz J, Stanley KK. The LDL-receptor-related protein, LRP, is an apolipoprotein E-binding protein. Nature. 1989;341(6238):162–164. doi: 10.1038/341162a0. [DOI] [PubMed] [Google Scholar]
- 22.Mahley RW, Weisgraber KH, Innerarity TL. Interaction of plasma lipoproteins containing apolipoproteins B and E with heparin and cell surface receptors. Biochim Biophys Acta. 1979;575(1):81–91. doi: 10.1016/0005-2760(79)90133-4. [DOI] [PubMed] [Google Scholar]
- 23.Futamura M, Dhanasekaran P, Handa T, Phillips MC, Lund-Katz S, Saito H. Two-step mechanism of binding of apolipoprotein E to heparin: implications for the kinetics of apolipoprotein E-heparan sulfate proteoglycan complex formation on cell surfaces. J Biol Chem. 2005;280(7):5414–5422. doi: 10.1074/jbc.M411719200. [DOI] [PubMed] [Google Scholar]
- 24.Williams KJ, Chen K. Recent insights into factors affecting remnant lipoprotein uptake. Curr Opin Lipidol. 2010;21(3):218–228. doi: 10.1097/MOL.0b013e328338cabc. [DOI] [PubMed] [Google Scholar]
- 25.Gonzales JC, Gordts PL, Foley EM, Esko JD. Apolipoproteins E and AV mediate lipoprotein clearance by hepatic proteoglycans. J Clin Invest. 2013;123(6):2742–2751. doi: 10.1172/JCI67398. [DOI] [PMC free article] [PubMed] [Google Scholar]
- 26.Ikewaki K, Rader DJ, Zech LA, Brewer HB. In vivo metabolism of apolipoproteins A-I and E in patients with abetalipoproteinemia: implications for the roles of apolipoproteins B and E in HDL metabolism. J Lipid Res. 1994;35(10):1809–1819. [PubMed] [Google Scholar]
- 27.Mensink RP, Zock PL, Kester AD, Katan MB. Effects of dietary fatty acids and carbohydrates on the ratio of serum total to HDL cholesterol and on serum lipids and apolipoproteins: a meta-analysis of 60 controlled trials. Am J Clin Nutr. 2003;77(5):1146–1155. doi: 10.1093/ajcn/77.5.1146. [DOI] [PubMed] [Google Scholar]
- 28.Appel LJ, et al. Effects of protein, monounsaturated fat, and carbohydrate intake on blood pressure and serum lipids: results of the OmniHeart randomized trial. JAMA. 2005;294(19):2455–2464. doi: 10.1001/jama.294.19.2455. [DOI] [PubMed] [Google Scholar]
- 29.Brinton EA, Eisenberg S, Breslow JL. A low-fat diet decreases high density lipoprotein (HDL) cholesterol levels by decreasing HDL apolipoprotein transport rates. J Clin Invest. 1990;85(1):144–151. doi: 10.1172/JCI114405. [DOI] [PMC free article] [PubMed] [Google Scholar]
- 30.Vélez-Carrasco W, et al. Dietary restriction of saturated fat and cholesterol decreases HDL ApoA-I secretion. Arterioscler Thromb Vasc Biol. 1999;19(4):918–924. doi: 10.1161/01.ATV.19.4.918. [DOI] [PubMed] [Google Scholar]
- 31.Desroches S, et al. Apolipoprotein A-I, A-II, and VLDL-B-100 metabolism in men: comparison of a low-fat diet and a high-monounsaturated fatty acid diet. J Lipid Res. 2004;45(12):2331–2338. doi: 10.1194/jlr.M400287-JLR200. [DOI] [PubMed] [Google Scholar]
- 32.Sacks FM, et al. Dietary fats and cardiovascular disease: A presidential advisory from the American Heart Association. Circulation. 2017;136(3):e1–e23. doi: 10.1161/CIR.0000000000000510. [DOI] [PubMed] [Google Scholar]
- 33.Talayero B, Wang L, Furtado J, Carey VJ, Bray GA, Sacks FM. Obesity favors apolipoprotein E- and C-III-containing high density lipoprotein subfractions associated with risk of heart disease. J Lipid Res. 2014;55(10):2167–2177. doi: 10.1194/jlr.M042333. [DOI] [PMC free article] [PubMed] [Google Scholar]
- 34.Khera AV, et al. Cholesterol efflux capacity, high-density lipoprotein function, and atherosclerosis. N Engl J Med. 2011;364(2):127–135. doi: 10.1056/NEJMoa1001689. [DOI] [PMC free article] [PubMed] [Google Scholar]
- 35.Zheng C, Khoo C, Ikewaki K, Sacks FM. Rapid turnover of apolipoprotein C-III-containing triglyceride-rich lipoproteins contributing to the formation of LDL subfractions. J Lipid Res. 2007;48(5):1190–1203. doi: 10.1194/jlr.P600011-JLR200. [DOI] [PubMed] [Google Scholar]
- 36.Mendivil CO, Zheng C, Furtado J, Lel J, Sacks FM. Metabolism of very-low-density lipoprotein and low-density lipoprotein containing apolipoprotein C-III and not other small apolipoproteins. Arterioscler Thromb Vasc Biol. 2010;30(2):239–245. doi: 10.1161/ATVBAHA.109.197830. [DOI] [PMC free article] [PubMed] [Google Scholar]
- 37.Nikkilä EA, Kekki M. Plasma triglyceride metabolism in thyroid disease. J Clin Invest. 1972;51(8):2103–2114. doi: 10.1172/JCI107017. [DOI] [PMC free article] [PubMed] [Google Scholar]
- 38.Barrett PH, et al. SAAM II: simulation, analysis, and modeling software for tracer and pharmacokinetic studies. Metab Clin Exp. 1998;47(4):484–492. doi: 10.1016/S0026-0495(98)90064-6. [DOI] [PubMed] [Google Scholar]
- 39.Friedewald WT, Levy RI, Fredrickson DS. Estimation of the concentration of low-density lipoprotein cholesterol in plasma, without use of the preparative ultracentrifuge. Clin Chem. 1972;18(6):499–502. [PubMed] [Google Scholar]
Associated Data
This section collects any data citations, data availability statements, or supplementary materials included in this article.


