

Abstract
The transcriptional programs that establish neuronal identity evolved to produce the rich diversity of neuronal cell types that arise sequentially during development. Remarkably, transient expression of certain transcription factors can also endow non-neural cells with neuronal properties. The relationship between reprogramming factors and the transcriptional networks that produce neuronal identity and diversity remains largely unknown. Here, from a screen of 598 pairs of transcription factors, we identify 76 pairs of transcription factors that induce mouse fibroblasts to differentiate into cells with neuronal features. By comparing the transcriptomes of these induced neuronal cells (iN cells) with those of endogenous neurons, we define a ‘core’ cell-autonomous neuronal signature. The iN cells also exhibit diversity; each transcription factor pair produces iN cells with unique transcriptional patterns that can predict their pharmacological responses. By linking distinct transcription factor input ‘codes’ to defined transcriptional outputs, this study delineates cell-autonomous features of neuronal identity and diversity and expands the reprogramming toolbox to facilitate engineering of induced neurons with desired patterns of gene expression and related functional properties.
Reporting summary.
Further information on experimental design is available in the Nature Research Reporting Summary linked to this paper.
Neurons comprise a conspicuously diverse but clearly recognizable cell type. All neurons share defining features such as electrical excitability and synaptic connectivity. However, in even the simplest organisms, neurons also exhibit extensive diversity that affords each species its unique sensory modalities, behaviours and cognitive capabilities. The extent to which this diversity reflects the action of intrinsic cellular programs or depends on environmental and developmental cues is a central question in neuroscience.
Despite the elaborate sequential mechanisms that specify cell identity during development, recent studies have shown that transient overexpression of transcription factors can stably reprogram cells from one lineage to another without cell division, including the direct conversion of fibroblasts into iN cells using three transcription factors1–3. This discovery has enabled engineering of iN cells that resemble various endogenous subtypes, typically by adding transcription factors to the orginal neuron-inducing factors3–10. The majority of these protocols included achaete-scute homolog 1 (ASCL1, encoded by the Ascl1 gene), suggesting that this may be an essential factor11. However, we showed that replacing ASCL1 with neurogenin 1 (encoded by Neurog1) or neurogenin 2 (encoded by Neurog2), while co-expressing POU4F1 (also known as BRN3A, encoded by Pou4f1), selectively induced a population of cells that resembled dorsal root ganglion (DRG) sensory neurons12.
These studies raised several important questions. First, is the capacity to ectopically induce neuronal identity limited to only a few sets of transcription factors or might there be a larger set of inducing factors? Second, what features of neuronal identity and diversity can be produced outside the context of development and the brain? Third, how might we generate iN cells with desired functional properties or patterns of gene expression?
To explore these questions, we screened 598 pairs of transcription factors, testing their ability to induce neuronal identity in fibroblasts. Unexpectedly, more than 12% (76 of 598) of the transcription factor pairs could reprogram fibroblasts into iN cells that express key neuronal markers, exhibit neuronal morphologies, are electrically active and can form synaptic connections without co-culturing with glia. Neurons within a given iN cell population are relatively homogenous, while different iN cell populations exhibit transcriptional and functional diversity. These studies define a new set of cell-autonomous transcriptional networks underlying neuronal identity and establish a database of transcription factor ‘codes’ to produce iN cells that express desired receptors, neurotransmitters, ion channels, synaptic proteins and other useful features of neuronal diversity.
An unbiased screen of transcription factor pairs
We generated an inducible library of 598 transcription factor pairs comprised of 46 basic-helix–loop–helix (bHLH), one nuclear receptor and 12 Pit-Oct-Unc (POU) transcription factors, by cloning cDNAs encoding the transcription factors into doxycycline-inducible lentiviral vectors. Two weeks after induction of mouse embryonic fibroblasts (MEFs), 76 (12.7%) of the 598 transcription factor pairs produced cells that expressed the neuron-specific class III β-tubulin (TUJ1, encoded by Tubb3) and had neuronal morphologies (Fig. 1a, b, Extended Data Fig. 1a, Supplementary Table 1). Most individual transcription factors had no effect; however, four factors produced rare TUJ1+ cells with atypical morphologies—these were subtracted when scoring hits (Extended Data Fig. 1b, c). The majority of TUJ1+ candidate iN cells also expressed the neuronal markers MAP2 (85–99%), synapsin (86–98%) and tau (based on later experiments using tau–eGFP knock-in mice) (Fig. 1c, d). All tested pairs (12 of 12) were also able to reprogram adult tail-tip fibroblasts (TTFs) and MEFs depleted of p75-expressing neural crest cells12 (Extended Data Fig. 1d–h).
Fig. 1 |. Screening transcription factor pairs for iN cell induction.

a, Reprogramming schematic. Candidate iN cells were identified by expression of neuronal markers and neuronal morphologies. Red, TUJ1; green, tau–eGFP; blue, DAPI. b, Positive (76) and negative (522) transcription factor pairs identified in the screen. All tested POU and nuclear receptor factors are included but the 30 bHLH factors that did not produce iN cells are omitted for clarity. Each box contains the normalized average percentage of TUJ1+ cells per well (n = 3 wells, 2 × 10⁴ fibroblasts per well). c, MEFs were transfected with vectors encoding Neurog3/Pou1f1 to generate iN cells. Immunofluorescence showing co-labelling of TUJ1+ (red) candidate iN cells with tau–eGFP (green), MAP2 (green) and synapsin (green) with nuclei in blue (DAPI) from n = 5, 5 and 3 independent experiments, left to right, respectively. Scale bars, 100 μm. d, Percentage of TUJ1+ cells that co-express tau–eGFP (n = 574), MAP2 (n = 574) or synapsin (n = 293) for iN cells induced by Neurog3/Pou1f1 (N3.P1, n = 5, 5 and 3 independent experiments, respectively), Neurog3/Pou5f1 (N3.O4, n = 4, 4 and 3 independent experiments, respectively), Ascl2/Pou4f3 (A2.B3c, n = 3, 3 and 3 independent experiments, respectively), Neurod2/Pou4f3 (ND2.B3c, n = 4, 4 and 3 independent experiments, respectively) and Atoh1/Pou4f3 (Atoh1.B3c, n = 3, 3 and 3 independent experiments, respectively). Pou4f3 is also known as Brn3c. Data are mean ± s.d.
Neurons are most stringently defined by their electrophysiological properties. We analysed the electrophysiology of five candidate iN cell populations that included transcription factors not previously reported to induce neurons in vitro (Fig. 2). The majority of candidate iN cells (expressing tau–eGFP and TdTomato driven by a synapsin promoter) (58 of 60, 97%) fired action potentials and displayed resting membrane potentials (−61.7 ± 7.8 mV) and other properties consistent with neuronal identity, whereas negative control cells did not. Voltage sag and input resistance were similar to those of endogenous neurons, but varied among some populations of iN cells (Fig. 2, Extended Data Fig. 2). Unexpectedly, we detected excitatory post-synaptic currents (EPSCs), in five recorded candidate iN cells (Fig. 2d, Extended Data Fig. 2n). The formation of active synapses is rarely observed in stemcell derived neurons after 16–24 days of culture in the absence of glia. These results provide strong evidence that the candidate iN cells have acquired neuronal identity.
Fig. 2 |. Electrophysiological properties of iN cells.

a, Representative whole-cell patch-clamped candidate iN cell expressing synapsin–TdTomato (red). TdTomato intensity was adjusted to show neurites and soma. Scale bar, 25 μm. b, Membrane voltage responses from an iN cell generated with Ascl2/Pou4f3 under whole-cell patch-clamp conditions at maximum current injection (top) and current steps until the first induction of action potentials (middle), with current traces (bottom). c, iN cells generated with five transcription factor pairs exhibit current-induced action potentials in the majority of cells: Neurog3/Pou1f1 (N3. P1, 15 of 15 cells), Neurog3/Pou5f1 (N3.O4; 10 of 10 cells), Ascl2/Pou4f3 (A2.B3c; 15 of 16 cells), Neurod2/Pou4f3 (ND2.B3c; 10 of 10 cells) and Atoh1/Pou4f3 (Atoh1.B3c; 8 of 9 cells). AP, action potential. d, Current trace showing EPSCs from an iN cell generated with Neurog3/Pou5f1. e, Membrane voltage responses to depolarizing current steps of iN cells with neuronal morphology generated from Neurog3/Pou5f1 (N3.O4, top) and Neurod2/Pou4f3 (ND2.B3c, bottom). f, Quantification of voltage sag (Vsag) behaviour for candidate iN cells that exhibited current-induced action potentials: N3.P1 (n = 15 cells), N3.O4 (n = 10), A2.B3c (n = 15), ND2.B3c (n = 10) and Atoh1.B3c (n = 8). Voltage sag is plotted as the slope of the voltage sag versus current. Coloured points correspond to the plotted cells. Data are mean ± s.d., *P = 0.0207, one-way ANOVA, Tukey’s multiple comparison test.
Both MEFs and human embryonic fibroblast-like cells (HEFs) derived from iPSCs can be reprogrammed with pairs of mouse transcription factors12–14. Here we show that mouse and human versions of NEUROG3 and POU1F1 (also known as PIT1), can reprogram HEFs with similar efficiency. All tested mouse transcription factor pairs (14 of 14) generated human iN cells that expressed TUJ1 and MAP2. The iN cells could fire action potentials (n = 21 of 27 iN cells produced with NEUROG3 and POU1F1, 77%) and exhibited membrane properties and voltage-dependent Na+ and K+ currents comparable to those reported previously7–9,12 (Extended Data Fig. 3). These experiments establish the likely utility of the mouse screen for guiding human cell reprogramming experiments.
iN cells resemble endogenous neurons
The iN cells produced in this study exhibit neuronal morphologies, express defining markers of mature neurons and fire action potentials. To establish the extent to which the transcriptomes of iN cells resemble endogenous neural populations, we performed fluorescence-activated cell sorting (FACS) and RNA sequencing (RNA-seq) analysis on 35 mouse iN cell populations generated from MEFs derived from tau–eGFP knock-in mice, which express GFP specifically in neurons3. For comparison, we transcriptionally profiled whole brain RNA, control MEFs and eight FACS-purified populations of endogenous neurons, selected to encompass the peripheral and central nervous system and to include multiple neurotransmitter identities (Fig. 3a, Extended Data Fig. 4, Supplementary Table 2).
Fig. 3 |. RNA-seq of iN cell populations.

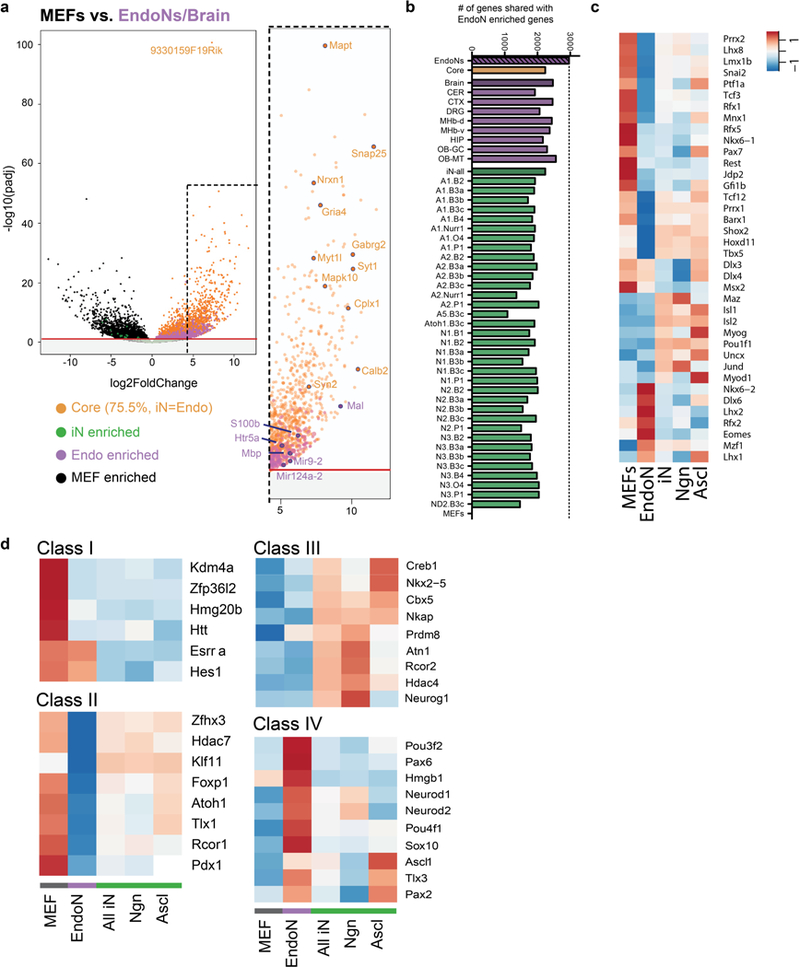
a, RNA-seq schematic for MEFs, induced neurons (iN cells), endogenous neurons (EndoNs) and whole brain samples. b, PCA from MEF (n = 1 population in duplicate biological samples, grey), iN cell (n = 35 in duplicate; green), endogenous neuron (n = 6 in duplicate, n = 2 in triplicate; purple) and brain (n = 1 in duplicate; dark purple) RNA-seq data. Loadings for principal components PC1, PC2 and PC3 are reported on x, y and z axes, respectively. Larger spheres represent centroids of each set of samples. Right, candidate iN cell populations (green), MEFs (grey), endogenous neurons (purple) and brain samples (dark purple) plotted along a vertical axis (loadings) for the first three principal components. c, Enriched GO terms for the differentially expressed genes based on DESeq2 comparisons of the MEFs compared to the iN cells plotted at fold enrichment with the associated P value at the end of each bar. Pos., position; reg., regulation. d, Abbreviated volcano plot of log2(fold change) versus –log(adjusted P value per gene) for MEFs (black) versus the pooled endogenous neuron and brain RNAseq data. Plotted are enriched core genes that are shared between iN cell and endogenous neurons and brain populations (orange, 75.5% of the significantly enriched endogenous neurons and brain genes), genes enriched in endogenous neurons and brain (purple, endo-enriched) and genes enriched in iN cells (green, iN cell-enriched). The red line represents–log(0.05 P-adjusted value) (See Extended Data Fig. 5a). e, Schematic of predicted transcriptional repressors (R) and activators (A) that silence and activate neuronal genes in MEFs and neuronal populations, respectively. TSS, transcription start site. f, Expression of representative predicted transcriptional core gene regulators from each class identified by both HOMER and IPA plotted as DESeq2 vsd-normalized RNA-seq counts with groups averaged and scaled by row.
Principal component analysis (PCA) of RNA-seq data showed that the iN cell, endogenous neuron and brain populations intersected and were segregated from the MEFs (Fig. 3b). Using DESeq215, we identified the 3,860 genes that were upregulated in the iN cells in comparison to the MEFs. These genes were enriched for gene ontology (GO) terms associated with neuronal development, neuronal function and synaptic transmission16. Similarly, the 3,467 genes that were downregulated in iN cells were enriched for GO terms associated with immune function and cell division (Fig. 3c, Supplementary Table 3). These analyses indicate that the iN cells have acquired global transcriptional programs similar to those of endogenous neurons.
Defining a core neuronal transcriptome
Gene networks shared by the iN cells and endogenous neuron and brain samples are of interest as they could define a ‘core’ neuronal transcriptome that arises both in vivo and in vitro. Conversely, genes found in the endogenous neuron and brain samples but not in the iN cells could reflect differences in cell types, neuronal maturity, the influence of exogenous signalling, or signs of incomplete reprogramming. In our analysis, the number of genes differentially expressed in the endogenous neuron and brain samples compared to MEFs (n = 2,965) was similar to that of the iN cells. We defined a candidate core neuronal transcriptome from the intersection (75.5% overlap) of the iN cell-enriched genes (versus MEFs) and the endogenous neuron and brain-enriched genes (versus MEFs). The number of genes shared between the core transcriptome and each individual population was similar among endogenous and iN cell populations (78 ± 7%, range 63–86%). Genes that were not enriched in iN cells were associated with GO terms related to glia, myelination and neural development, suggesting that iN cells express the majority of ‘pan-neuronal’ genes but not genes characteristic of glia or neuronal precursors (Fig. 3d, Extended Data Fig. 5a, b, Supplementary Table 3).
This highlights the capacity for diverse transcription factor pairs to independently converge on shared transcriptional signatures of neuronal identity and suggests that the result of direct reprogramming is similar to the result of normal neuronal development with respect to this core transcriptome.
This observation raises the question of whether the gene networks shared by iN cells and endogenous neurons are governed by similar mechanisms. Regulatory mechanisms resulting in neuronal identity may include loss of repressors of neuronal identity and/or gain of activators of neuronal genes (Fig. 3e). To identify candidate regulatory factors we applied two complementary bioinformatic tools, ingenuity pathway analysis (IPA) and hypergeometric optimization of motif enrichment (HOMER). IPA identified 39 candidate transcriptional regulators that we divided into five classes (I–V). HOMER motif analyses identified 48 enriched motifs of which four overlapped with the results from IPA. Class I and II genes appear to be repressors because they are more highly expressed in MEFs compared to iN cells or endogenous neurons (Fig. 3f). We termed Class I genes ‘common repressors’ because they are expressed at lower levels in all iN cells and endogenous neurons, whereas Class II repressors exhibit subclass-specific patterns. The most enriched binding domain is that of the Class I gene Rest17, which was recently shown to increase the efficiency of direct reprogramming when knocked down using silencing short hairpin RNAs (shRNAs), highlighting the potential for network analyses to uncover mechanisms that may enable improved reprogramming methods18 (Fig. 3f, Extended Data Fig. 5c, d, Supplementary Table 3).
Class III and IV genes represent candidate activators, based on reduced expression in MEFs in comparison to endogenous neurons (Class III) or iN cells (Class IV). These include genes for transcription factors that are known to regulate neuronal differentiation and diversity, such as Isl1 and Eomes. We identified only one candidate Class V ‘common activator’ transcription factor (Mecp2) that was expressed in all iN cells and endogenous neurons at higher levels than in MEFs, consistent with its high expression level in the brain and role in synaptic function. Together, these analyses suggest a model in which common mechanisms for gene derepression operate both in development and direct reprogramming, whereas gene activation may arise through different mechanisms (Fig. 3e, f, Extended Data Fig. 5c, d, Supplementary Table 3).
Single–cell RNA–seq of iN cells
A key question regarding the iN cell populations is the extent to which they exhibit homogeneity versus heterogeneity. We investigated this using single-cell RNA-seq (scRNA-seq). We analysed four representative iN cell populations (Fig. 4a, Methods). iN cells that were produced with the same transcription factor pair display relative homogeneity and generally cluster together. Cells falling outside of the main clusters have low total unique molecular identifier (UMI) counts, which is likely to lead to low expression of subtype genes and miscategorization (Fig. 4a, Extended Data Fig. 6a). The majority of iN cells expressed pan-neuronal markers such as Mapt (encoding tau) and Tubb3 and mature markers (Map2 and Snap25), although iN cells derived with the non-POU factor encoded by Nr4a2 (also known as Nurr1) exhibited a slightly more graded expression, perhaps due to lower overall UMI counts (Fig. 4b).
Fig. 4 |. Single-cell RNA-seq of four iN cell populations.

a-c, Cells are colour-coded as Neurog1/Pou4f1 (N1.B3a, green, n = 134 cells), Neurog3/ Pou5f1 (N3.O4, pink, n = 415), Neurog3/Pou3f4 (N3.B4, blue, n = 313) and Ascl2/Nr4a2 (A2.NR1, orange, n = 90). a, t-SNE projection of 952 single cells derived from the four pairwise combinations of transcription factors. Black arrows indicate clusters of cells with low total UMI counts (Extended Data Fig. 5a). b, Single-cell log2 UMI expression of pan-neuronal (Mapt, Tubb3) and mature neuron (Map2, Snap25) markers. The rectangle of the box plot spans the interquartile range, the dividing segment denotes the median. The whiskers above and below the box represent the minimum and maximum. c, Single-cell log2 UMI expression of receptors and transmembrane proteins among the top 20 differentially expressed genes with each transcription factor combination relative to all other combinations (see Extended Data Fig. 5f). Pou3f4 is also known as Brn4.
Population RNA-seq experiments detected low levels of myocyte-related genes in iN cells produced using an Ascl family member, but not in other populations. Mapping these genes onto the Ascl2/Nr4a2 single-cell data identified a small subpopulation of cells (3 of 90) with that exhibited coordinated co-expression of these genes, consistent with previous studies19 (Extended Data Figs. 6b, 7b).
Similarly, the weak residual expression of MEF genes observed in population RNA-seq of iN cells could derive from rare contaminating MEFs in the sorted cells and/or residual MEF gene expression in the iN cells. We sorted and profiled single MEFs (tau–eGFP–) and iN cells (tau–eGFP+) from the same reprogramming experiment. This revealed a small population of cells with strong MEF gene expression, suggesting that contaminating MEFs in the FACS experiment may account for much of this signature. However, a few candidate MEF genes were expressed at low levels throughout the iN cell populations (Extended Data Fig. 6c, d).
We also explored the diversity of iN cells by identifying genes that are differentially expressed between different iN cell populations using scRNA-seq. Among these were receptors, ion channels and transmembrane proteins, some of which have known roles in disease (Fig. 4c, Extended Data Fig. 6f). Individual iN cells within a population also exhibited mosaic expression of certain genes, either owing to inherent cellular diversity or high drop-out rates seen with scRNA-seq. However, t-distributed stochastic neighbour embedding (t-SNE) clustering of each individual transcription factor combination did not detect significant subclusters within populations, supporting a model in which iN cells exhibit low intra-population heterogeneity (Extended Data Fig. 6e). Therefore, while population RNA-seq data are sensitive to small subpopulations of contaminating cells, the overall predictions they make map well to the patterns of gene expression in individual iN cells. This suggests that each transcription factor pair induces a limited set of potentially related iN cell fates, as shown for induced sensory neurons12.
Diversity among iN cells
To assess patterns of transcriptional diversity among the iN cell populations, we applied weighted gene co-expression network analysis (WGCNA) to generate co-expression modules20,21. As expected, several modules resembled the core transcriptome; they were enriched in most iN cells compared to in MEFs and included genes related to neuronal differentiation, synapses and metabolism (based on enriched GO terms)22,23. Other modules were expressed only in subsets of iN cells. Module 24 was enriched in iN cells generated with the POU4F (also known as Brn3) family of transcription factors, whereas two modules enriched for neurogenic genes were reciprocally expressed in iN cells generated with different bHLH family genes (Neurog versus Ascl families), with the latter including myogenic genes19. Other ‘synergistic’ modules were expressed in diverse iN cell populations generated with non-overlapping transcription factor pairs (Fig. 5a, Extended Data Fig. 7a, b, Supplementary Table 4). These analyses document multiple axes of diversity among iN cells and provide evidence for synergistic interactions between transcription factor pairs.
Fig. 5 |. Transcriptional and functional diversity of iN cell populations.
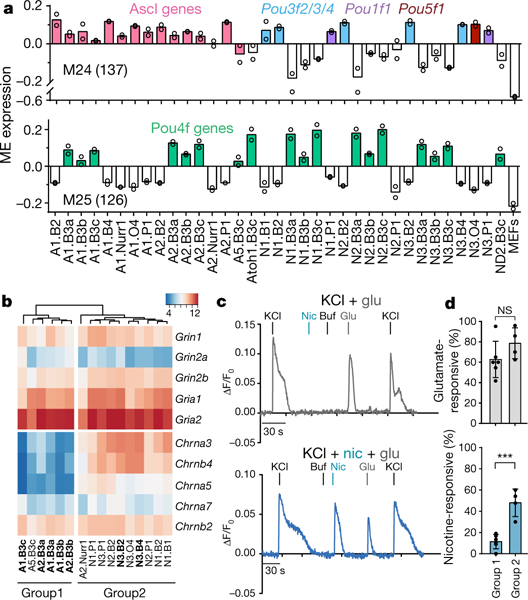
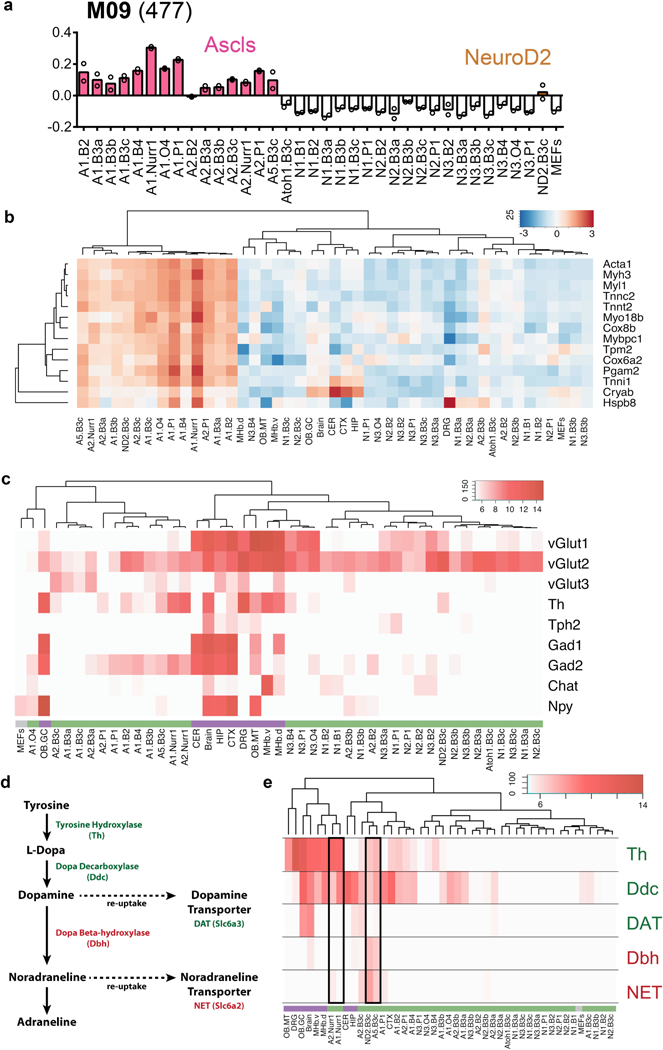
a, Average WGCNA module eigengene (ME) expression of the 35 iN cell populations (in duplicate) for representative modules correlated with POU subclasses (module 24 (M24), 137 genes assigned) and nonlinear or synergistic modules (module 25 (M25), 126 genes). Colours highlight populations generated with shared transcription factors. b, Expression of selected glutamate and nicotinic acetylcholine receptor subunit genes in iN cell populations, grouped using hierarchical clustering based on correlation distance. Expression is shown as the mean of two DESeq2 vsd-normalized RNA-seq counts. Bolded iN cell populations were used in calcium imaging experiments (Extended Data Fig. 8b). c, Calcium responses of two representative cells (group 1, top, grey; group 2, bottom, blue) to 100–250 mM KCl and 1 mM glutamate (glu), 100 μM nicotine (nic) and buffer alone (buf) plotted as ΔF/F0 versus time. d, Percentages of glutamate- and nicotine-responsive cells per group out of total KCl-responsive cells (n = 218 total cells). Group 1 and group 2 (n = 6 and 4 independendent experiments, respectively) comprise iN cell populations with the lowest and highest overall expression of nicotinic acetylcholine receptors, respectively. ***P = 0.0004, NS, not significant; unpaired Student’s t-test. Data are mean ± s.d.
Producing iN cells with desired neurotransmitter expression profiles is of interest for translational medicine. Here we show that different iN cell populations express different neurotransmitter-related genes, such as those integral to excitatory, inhibitory and cholinergic identities. However, most of these genes are expressed at lower levels than in the endogenous neurons (but higher than in MEFs). This lower expression level could reflect mixed or immature iN cell populations; however, our detection of EPSCs, which involve presynaptic neurotransmitter release, indicates that these levels can have functional relevance (Extended Data Fig. 7c).
Previous studies showed that Ascl1/Nr4a2 (alone or in combination with Lmx1a) can produce functional induced dopaminergic neurons4,6,24–26. Our results are partly consistent with these studies; we detected expression of tyrosine hydroxylase (Th) and dopamine decarboxylase (Ddc) genes and low levels of the noradrenergic or adrenergic genes (Dbh, Slc6a2 (also known as NET)) in iN cells generated with Ascl1 or Ascl2 and Nr4a2 compared to other Th-expressing iN cell populations. However, we did not reliably detect the dopamine transporter DAT (also known as Slc6a3) in any iN cell population, perhaps owing to a requirement for further maturation or a different combination of transcription factors (Extended Data Fig. 7d, e).
This reprogramming screen can be applied to generate iN cell populations that express neuroactive ligand receptors, ion channels or other genes related to human neurologic disease27. For example, human genetic variation at the CHRNA3–CHRNB4–CHRNA5 nicotinic receptor gene cluster influences susceptibility to nicotine addiction, lung cancer and alcoholism28. We identified groups of iN cell populations that expressed similar levels of glutamate receptor subunits but differed in expression of Chrna3, Chrnb4 and Chrna5 (Fig. 5b, Extended Data Fig. 8a). Calcium imaging showed that while all iN cells responded equally to glutamate, iN cells enriched in Chrna3, Chrnb4 and Chrna5 responded preferentially to nicotine, providing proof-of-principle that the iN cell dataset offers guidance for engineering iN cells that exhibit desired functional properties (Fig. 5c, d, Extended Data Fig. 8b).
Next, we compared the transcriptional profiles of iN cell populations to endogenous neural populations (Extended Data Figs. 9, 10). These analyses, including cell-type specific enrichment analysis (CSEA)29,30, successfully distinguished between neuronal and glial identity and identified similarities between iN cells that resemble peripheral sensory neurons and endogenous DRG neurons. Several iN cell populations exhibited similarities to endogenous subpopulations, including habenula, hypothalamic and hippocampal neurons. However, in most cases, the sets of genes driving the relative similarity are relatively small and inconsistent with any conclusive assignment to a known endogenous subtype. This is perhaps unsurprising given the large number of neuronal subtypes, their inherent transcriptional heterogeneity, and the expected differences between neurons cultured in vitro versus those responding to the dynamic environment in a living animal.
Finally, we established a searchable database that links any gene to its pattern of expression among all iN cells and identifies other highly correlated genes (http://biogps.org/dataset/BDS_00016/). This ‘look-up table’ for producing iN cell populations expressing genes-of-interest can be used as a starting point for optimizing production of diverse iN cell subtypes or for pharmacogenomics, disease modelling and translational studies.
Discussion
Direct reprogramming has challenged the principles underlying plasticity of differentiated cell states established by decades of developmental studies by showing that transient expression of transcription factors can convert cell types across lineages. One interpretation of direct reprogramming studies is that only a small number of combinations of transcription factors may be capable of rewiring cell fate for each resulting lineage31. Our study suggests the opposite—more than 12% of reprogramming pairs we tested reprogrammed fibroblasts into neuron-like cells (iN cells).
Despite the use of many different combinations of transcription factors, and of transcription factors that are not recognized as promoting neuronal identity (such as POU5F1, also known as OCT4), all iN cells we tested exhibited key traits of differentiated neurons, including neuronal morphology, electrical excitability and expression of synaptic markers. The stabilization of these aspects of neuronal identity suggests the involvement of positive-feedback transcriptional networks that are actively maintained and arise in a cell-autonomous manner—independently of neural environment or developmental context. One interpretation of these data is that reprogramming may engage a restricted set of convergent transcriptional networks that mirror those used to establish or maintain aspects of neuronal diversity in vivo. Alternatively, iN cells may represent somewhat artificial cell types (as is the case for induced pluripotent stem cells); yet they may still be useful for interrogating the cellular function of neuronal genes in vitro. Though we favour the former hypothesis, additional transcriptional analyses of diverse sets of endogenous neurons and iN cells will be required to address this issue32–34. Finally, expanding the screen to include human transcription factors may enable production of novel human iN cell subtypes that are useful for deciphering human- specific aspects of neuronal cell biology and mechanisms related to human neurologic disease.
METHODS
The Institutional Animal Care and Use Committees of The Scripps Research Institute approved all animal procedures. As experimental comparison of groups of animals was not conducted in this study, sample size choice, randomization, sex of animals and blinding were not relevant for animal procedures. Human iN cells were produced from induced pluripotent stem cell lines generated from de-identified donors; the cells were validated in the Baldwin laboratory and are routinely tested for mycoplasma. Investigators were blinded to perform the induced neuronal cell counts in the original screen which were replicated in some cases by non-blinded investigators. In no other experiments were investigators blinded.
Embryonic fibroblast isolation and derivation.
Wild-type CD1 mice and heterozygous tau–eGFP mice (Jackson Laboratory, Mapttm1(EGFP)Klt/J, 004779) were bred at The Scripps Research Institute animal facility. Mouse embryonic fibroblasts (MEFs) were isolated under a dissection microscope from E13.5 embryos by removing the heads, limbs, internal organs and spinal columns to eliminate neurogenic cells. The remaining tissue was manually dissociated with 0.25% trypsin (Gibco) for 20 min at 37 °C. The trypsin was subsequently diluted with MEF medium (DMEM, 10% FBS and penicillin–streptomycin) and removed via centrifugation. Pelleted cells were re-suspended in MEF medium and seeded on gelatin-coated (0.01%) tissue culture plates. MEFs were grown to confluence and passaged at least twice before use.
Primary TTFs were isolated from 2–4-mm-long tail tips of P3 mouse pups. Tail tips were first rinsed in 70% ethanol, washed with HBSS (Invitrogen), chopped into smaller pieces and dissociated 0.25% trypsin for 60 min at 37 °C. Subsequent steps are the same as in the MEF isolation protocol.
For derivation of human embryonic fibroblasts (HEFs), human iPSCs colonies were collected using 0.5 mM EDTA (Invitrogen) and differentiated by embryoid body formation. For human iPSCs, normal blood donor (NBD) lines previous generated in an independent study35 were used and approved by the Scripps Institutional Review Board (IRB-11–5676). The embryoid bodies were cultured for seven days in non-adherent suspension culture dishes (Corning), two days in mTeSR medium (StemCell Technologies) and the following five days in DMEM containing 10% FBS (vol/vol). On day 8, the embryoid bodies were plated onto adherent tissue culture dishes and passaged according to primary fibroblast protocols using 0.25% trypsin for two to three passages before the start of experiments.
Molecular cloning, cell culture and lentiviral transduction.
cDNAs for transcription factors were cloned into lentiviral constructs under the control of the tetracycline operator (TetO). The cDNA for POU4F1 (previously known as BRN3A) and NHLH2 (previously HEN2) are the only human transcription factors we used; the human BRN3A protein shares 97% homology with the mouse protein. The BRN3A gene was cloned as described12. Replication-incompetent VSVg-coated lentiviral particles were packaged in 293 T cells (ATCC), collected 48 h after transfection, and filtered through a 45- μm PVDF membrane before use. HEK 293T cells were tested and authenticated by ATCC before experiments. The reprogramming method is a modification of a previously described protocol12. Passage two MEFs were infected with lentivirus in MEF medium. After 12–24 h of infection, virus-containing medium was replaced with fresh MEF medium. Transcription factors were induced 48 h after infection by switching to MEF medium supplemented with 5 μM doxycycline (Sigma). Four days after initiating induction with doxycycline, MEF medium was replaced with N3 medium3, but using N2 supplement (Gibco) in place of some components. Eight days after induction, doxycycline was withdrawn. Ten days after induction, the cells were switched to neural maintenance medium, which consisted of a 1:1 mix of N3 medium and Neurobasal medium (Invitrogen) supplemented with B27 (minus vitamin A, Gibco) and bFGF (10 ng/ml) (N3/NB medium). Efficiency of conversion was measured by the number of TUJ1+ cells divided by the initial number of plated cells. Transcription factor pairs that included bHLH factors Ascl1, Ascl2, Neurog1 and Neurog3 were normalized by subtracting the percentage of TUJ1+ cells generated from the bHLH factors alone (range 0.01–0.39%).
Immunohistochemistry.
Cells for immunofluorescence staining were fixed with 4% paraformaldehyde for 10 min at room temperature. Cells were then washed three times with phosphate-buffered saline and subsequently blocked in 5% horse serum and 0.1% Triton X-100 (Sigma) for 1 h at room temperature. Primary staining was performed overnight at 4 °C in the blocking buffer. Cells were again washed three times and then stained with secondary antibodies diluted in blocking buffer for 1 h at room temperature. The following primary antibodies and dilutions were used: TUJ1 (Sigma-Aldrich T2200, Rabbit, polyclonal, 1:500), MAP2 (Sigma-Aldrich M4403, mouse, HM-2, monoclonal, 1:500), and synapsin 1 (Synaptic Systems 106103, Rabbit, polyclonal, 1:500). Antibodies were validated using mouse primary neurons and tissue as a positive control and mouse embryonic fibroblasts as a negative control.
Electrophysiology.
MEFs from tau–eGFP mice were reprogrammed and cultured as described on Thermanox plastic coverslips (33 mm diameter). Coverslips were placed in the recording chamber mounted on an Olympus BX51 microscope. To identify tau–eGFP+ cells that expressed synapsin, we transduced candidate iN cells with lentivirus encoding the fluorescent red protein TdTomato, under the control of a Syn1 promoter. Spontaneous activity and evoked responses were recorded from identified cells at day 16 to 24 post-induction under whole-cell patch clamp at 33 °C. Similar to the electrophysiology protocol described12, signals were amplified using a MultiClamp700B (Molecular Devices) and acquired using the data acquisition software DASYLab v.11 (National Instruments) at 20 kHz. Patch pipettes with input resistances of 6–8 MΩ were pulled from standard wall glass of 1.5-mm OD (Warner Instruments) and filled with solution containing 120 mM potassium gluconate, 10 mM KCl, 10 mM HEPES, 10 mM EGTA, 2 mM MgATP, 0.3 mM Na3GTP at pH 7.3. The bath solution (artificial cerebrospinal fluid) was composed of 125 mM NaCl, 2.5 mM KCl, 2 mM CaCl2, 1 mM MgCl2, 1.25 mM NaH2PO4, 26 mM NaHCO3 and 25 mM glucose. To record voltage responses of the identified iN cells, we used incremental levels of constant, rectangular current steps of350-ms duration. The initial current step level was –50 to –200 pA, depending on the observed input resistance of the cell. Steps were incremented by + 2 or + 5 pA in successive cycles of stimulation at a rate of 1 Hz. Analysis of the evoked responses was performed in software developed by A. Szücs (IVAnalyzer). For each cell, several physiological parameters, including the resting membrane potential, rheobase, input resistance at rest and spike amplitude, were measured.
Spontaneous postsynaptic potentials were occasionally observed in the recorded iN cells. We performed voltage-clamp recordings of postsynaptic current whenever such activity was detected (150–200-s recordings at –50 mV holding potential). At this potential, the inward currents we observed were identified as EPSCs, considering the typical resting membrane potential of the iN cells (near –50 mV). GABAergic inputs do not typically produce such prominent EPSCs at this holding potential.
Human iN cells generated from HEFs were also identified using the SYN1-TdTomato reporter virus. Recordings were performed between 26 and 31 days after induction with doxycycline. Voltage-gated currents were induced by 400-ms voltage steps to –115 mV to –5 mV in 10-mV increments from the initial potential of –65 mV. The leak currents were subtracted from the voltage-gated currents before analysis. Leak currents were calculated using the currents induced by stimulation from –65 mV to –55 mV and scaling them to the corresponding membrane voltage. Whole-cell currents were filtered at 2 kHz and sampled at 20 kHz with a Digidata 1440 interface controlled by pClamp Software (Molecular Devices).
Cell sorting.
Reprogrammed candidate iN cells generated from heterozygous tau–eGFP MEFs were prepared for FACS by first detaching cells from the culture plate using Accutase (Innovative Cell Technologies). Accutase was subsequently diluted with neural maintenance media (N3/NB media) and removed by centrifugation. Pelleted cells were resuspended in neural maintenance medium, triturated and strained through 35-μm nylon mesh filter to obtain single-cell suspensions. Viability markers DAPI (1 μM) and DRAQ5 (1 μM, BioStatus DR50050) were added to the suspension at least 10 min before sorting. Appropriate gates for FACS were set based on tau–eGFP, DAPI and DRAQ5 intensities to isolate live tau–eGFP+ cells as shown in Extended Data Fig. 4c–d using the MoFlo Astrios (Beckman Coulter). Isolated cells were sorted into TRIzol LS (Invitrogen).
Similarly, endogenous neuronal populations were isolated from the appropriate transgenic reporter mice at postnatal day 21 (Extended Data Fig. 4i–o, Supplementary Table 2). Dissected tissue samples were dissociated as described36, with the following modifications. Manual homogenization was conducted with a scalpel rather than with a tissue slicer. We also used papain-containing L-cysteine (PAP2 10 U ml–1, Worthington Biochemical) because its higher activity allowed for shorter dissociation times37 (15 min total). During papain digestion, samples were triturated every 5 min using P1000 plastic tips instead of siliconized Pasteur glass pipettes. After centrifugation using the density gradient, we found viable neurons in the fraction containing the cell pellet and the fraction 2 ml immediately above the pellet. Both fractions were combined and washed once in 10 ml HAGB (Hibernate-A (Gibco A1247501), 1 × B-27 supplement (Gibco 12587010), 500 μM GlutaMAX (Gibco 35050061)). After subsequent centrifugation, pelleted cells were resuspended in HAGB, filtered and kept on ice until FACS sorting. As with the candidate iN cells, viability markers DAPI and DRAQ5 were added to the suspension and appropriate gates were set to purify cells into TRIzol LS.
Population RNA isolation.
Total RNA was isolated from FACS-sorted cells using Direct-zol RNA MiniPrep Kit (Zymo Rsearch) according to the manufacturer’s protocol, except linearized acrylamide (1 μg) was added to each sample before the first step and Zymo-Spin IC columns were used in replacement of Zymo-Spin IIC columns. RNA quality and quantity was determined with an Agilent 2100 Bioanalyzer. RNA integrity numbers (RINs) for all iN cell samples were between and 10 (median = 8.7). The amount of RNA per sorted event was between 1 and 15 pg (median = 7.9 pg). Therefore, approximately 1,500 to 2,000 cells were required to yield 10 ng RNA for library input.
Population RNA-seq library preparation and sequencing.
RNA-seq libraries were prepared from duplicate populations of tau–eGFP+ cells generated from 35 different transcription factor pairs 16 days after induction. Additional sequenced populations included biological replicates of MEFs, representative endogenous postnatal-day-21 neural populations, and whole-brain samples. Typically 10 ng purified, high quality RNA served as input for SMARTer Ultra Low Input RNA Kit for Sequencing v3 (Clontech Laboratories). A few replicate libraries were prepped from 1–7 ng of input total RNA (Supplementary Table 2). These were comparable to libraries prepped from 10 ng RNA since correlation coefficients were greater than 0.98 between libraries prepped from 1, 5 and 10 ng of the same total RNA (Extended Data Fig. 2f–h). Amplified cDNA was assessed for quality using High Sensitivity DNA Kit (Agilent Technologies) and sheared using the Covaris system. Sequencing libraries were subsequently prepped using NEBNext Ultra DNA Library Prep Kit for Illumina. Seventy-five-base-pair single-end reads generated using Illumina’s NextSeq platform were mapped to the mouse genome (UCSC mm10 database) by first removing adapters and low quality bases using Trimmomatic (v0.32, ILLUMINACLIP: TruSeq3-SE.fa:2:30:10 LEADING:3 TRAILING:3)38. Reads were then aligned using STAR39 and counts were generated using HTSeq40. Mm10 did not include Ascl5; therefore, we added it to the reference GTF file in HTSeq. It is also important to note that some libraries were prepared using SMARTer Ultra Low Input RNA for Illumina Sequencing - HV (Clontech Laboratories) and sequenced on Illumina’s HiSeq platform, resulting in 100-bp single reads. Libraries were sequenced to a mean of ~37.5 million uniquely mapped 75-bp single-end reads per replicate (Supplementary Table 2).
RNA-seq data analysis (DESeq2 and principal component analysis).
RNA-seq data were analysed using several R41 packages available through Bioconductor42. Differential gene expression analysis was conducted using DESeq215. Heat maps were generated using gplots43. PCA plots were drawn using rgl44 and pca3d45.
Ingenuity upstream regulator analysis.
Ingenuity upstream regulator analysis in Qiagen’s Ingenuity Pathway Analysis (IPA) was used to identify the cascade of upstream regulators of the core gene set. IPA utilizes a priori knowledge of expected interactions between transcriptional regulators and their target genes stored in Ingenuity Knowledge Base, a scientific literature-based database.
Hypergeometric optimization of motif enrichment analysis.
To determine the regulatory elements acting within the iN cells, specifically transcription factors, motif enrichment was performed on the promoters of differentially expressed genes in the iN cells. The known motif enrichment routine in the findMotifs.pl routine available in HOMER software was used to perform the analysis46. Known motif enrichment in HOMER is performed by scanning a defined set of promoter regions for motifs defined by a set of position weight matrices (PWMs) and using ZOOPS (zero or one occurrence per sequence) counting coupled with a hypergeometric enrichment test to determine significance. Built into HOMER is a curated set of binding site motifs taken from the TRANSFAC database47. To expand our search entries in JASPAR core48, a curated collection of transcription factor binding profiles was converted into PWMs for use in the analysis. HOMER asks for a threshold to be set for all PWMs. This threshold determines the minimum log odds score that is allowed for a sequence to be considered a match with the motif described in a given PWM. When converting the JASPAR profiles, the threshold was set by allowing for the least likely base in the most likely mismatched nucleotide of each motif, which was chosen because it allowed for some degeneracy when searching for possible transcription factor binding sites while excluding overly mismatched sequences.
Several promoter sets are available within HOMER. We used the mm9 genome build with a promoter region defined as 2,000-bp upstream and 50-bp downstream of the transcription start site for all identified genes in the mm9 build. The background gene set was restricted to those genes that were detectable in the RNA-seq experiments, excluding those genes whose transcripts had fewer than 100 reads mapped to them across all datasets. All other parameters available for findMotifs. pl were left as their defaults.
Single-cell RNA-seq.
For scRNA-seq, iN cells from each transcription factor combination were sorted by FACS as described above and loaded as independent suspension samples on a GemCode Single-Cell Instrument (10 × Genomics) which utilizes a droplet-based method. Single-cell libraries were generated using the commercially available Chromium Single Cell 3′ V2 Reagent Kit (10 × Genomics; PN-120237, PN-120236, PN-120262) following the manufacturer’s protocol49. Amplified cDNA and subsequent libraries were assessed for quantity and quality using High Sensitivity DNA Kit on an Agilent 2100 Bioanalyzer (Agilent Technologies). Libraries were sequenced as 150-bp paired-end reads on Illumina’s NextSeq platform. Samples were de-multiplexed, aligned and analysed using the 10 × Genomic CellRanger pipeline with default parameters. This pipeline implements STAR as an alignment tool. Multiple libraries were aggregated using the ‘cellranger aggr–normalized = mapped (default)’ command which sub-samples mapped reads so that each iN cell combination would have the same effective sequencing depth. Post-normalization mean reads per cell was 428,208. Visualization of t-SNE plots and UMI counts, and gene normalization and filtering of unexpressed genes were performed using the R package ‘cellrangerRkit’. Violin plots for individual genes were made using the R package ‘ggplot2’ from log-transformed gene-barcode matrices.
Cell type-specific expression analysis.
Cell type-specific expression analysis (CSEA) was done using the publicly available CSEA web-based tool provided30 by the Dougherty laboratory (http://genetics.wustl.edu/jdlab/csea-tool-2/, Version 1.0: updated 11th October 2013). Uniquely enriched genes of individual iN cell populations served as the input candidate gene lists. Uniquely enriched genes were defined as genes that were significantly enriched (P-adjusted value < 0.05) in each iN cell population versus all other iN cell populations and MEFs as determined by DESeq2 (Supplementary Table 4). Overlaps of these gene lists with a particular cell type or region for which data are currently available were identified by Fisher’s exact test with Benjamini–Hochberg correction.
Weighted gene co-expression network analysis.
Weighted gene co-expression network analysis (WGCNA) has previously been described in detail21 and summarized in papers using this technique50. DESeq2 vsd-normalized counts of all iN cell and MEF population replicates (n = 72) served as input into a user-friendly WGCNA R library20. To reduce the noise from low-expressing genes in our dataset, we only included genes in which the non-normalized counts were greater than 200 in at least one iN cell or MEF population, in both replicates (n = 12,549). We constructed a signed network, with a power of 12, using the default parameters except deepSplit = 4 and cutHeight = 0.999. Modules were merged if their module eigengenes were correlated with R > 0.8. Module hub genes were those that had the highest module membership (kME) for that module, which was calculated as the Pearson correlation between the gene and the corresponding ME.
Calcium imaging.
Calcium imaging was performed 16–24 days after induction on iN cells transduced with a MAP2::GCaMP5G lentiviral reporter25 and a Syn1-TdTomato lentiviral reporter. Imaging was performed in Tyrode’s solution (145 mM NaCl, 2.5 mM KCl, 10 mM Hepes, NaH2PO4, 2 mM CaCl2, 1 mM MgCl2, 10 mM Glucose and 0.4 mM ascorbic acid) at a constant flow rate. In a randomized order, we serially exposed the iN cells to 1 mM glutamate and 100 μM nicotine by direct application to the area of interest. We only analysed Syn1–TdTomato+ cells that responded to transient exposure to 100–250 mM KCl at the beginning and end of each recording to ensure iN cells exhibited neuronal identity and maintained functional viability throughout the recording. Additionally, we did not include mechanosensitive cells that responded to Tyrode’s solution alone. Similar to as previously described12, calcium responses were calculated as the change in fluorescence intensity (ΔF) over the initial fluorescence intensity (F – F0)/F0, in which F is the fluorescence at a given time point and F0 was calculated as the average of the first five unstimulated fluorescence measurements at the start of imaging. A non-response area for each recording was measured for background subtraction. The threshold for a positive calcium response to the addition of a ligand was determined as one (F – F0)/F0 greater than 0.01 in a 10-s window.
Statistics.
Statistical analyses were performed using GraphPad Prism7 and detailed in the corresponding figure legends. Data from electrophysiology experiments were analysed by one-way ANOVA followed by Bonferroni’s multiple comparison post hoc test. Similarity of variance between groups was confirmed by Brown–Forsythe test. Data from calcium imaging experiments were analysed by unpaired Student’s t-test. Similarity of variance between groups was confirmed by F test.
Extended Data
Extended Data Fig. 1 |. TUJ1 immunostaining of MEF- and TTF-derived iN cells and the p75-depletion experiment.
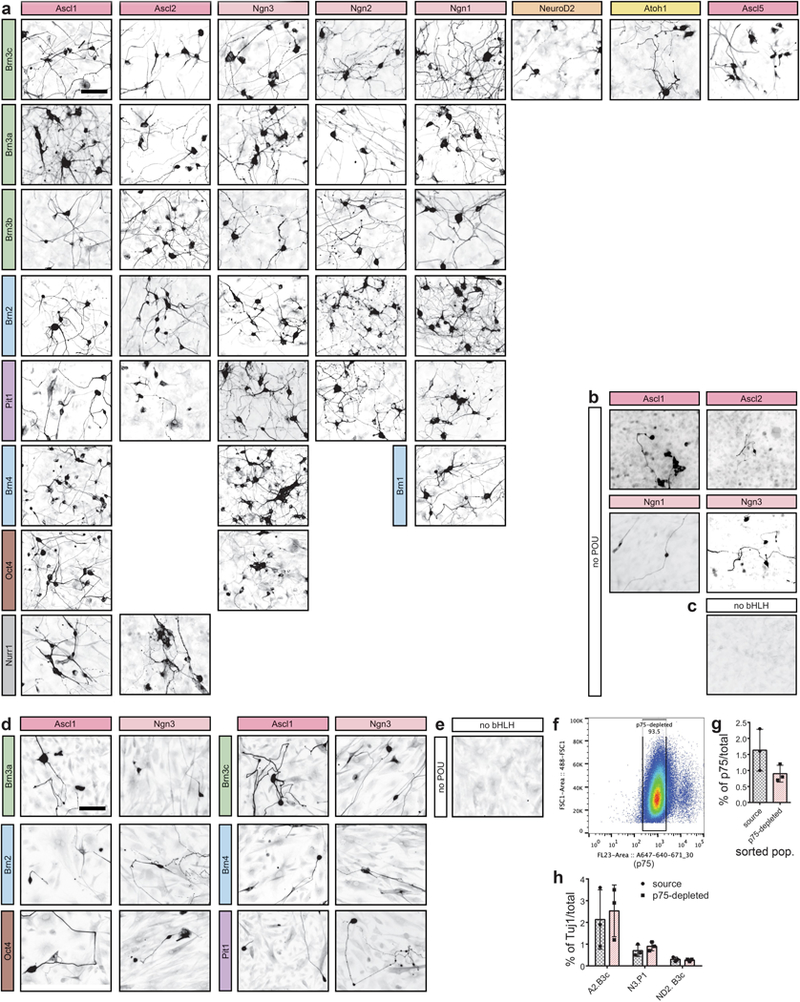
a, TUJ1 immunofluorescence labelling on day 14–16 post-induction of 35 of the 76 hits that were selected for whole-transcriptome analysis. n = 3 independent experiments. b, TUJ1 immunofluorescence labelling of conditions with individual bHLH factors Ascl1, Ascl2, Neurog1 and Neurog3. n = 3 independent experiments. c, TUJ1 immunofluorescence labelling of MEFs treated with only reverse tetracycline-controlled transactivator (rtTA), without reprogramming factors. n = 3 independent experiments. d, TUJ1 immunofluorescence labelling of TTFs derived from three-day-old mice and transduced with selected reprogramming combinations following the same reprogramming methods used with MEFs. Fixed and stained on day 16 post-induction. n = 1 independent experiment. e, TUJ1 immunofluorescence of TTFs treated with only rtTA, without reprogramming factors, and fixed and stained on day 16 post-induction. n = 1 independent experiment. f, Representative FACS gates of MEFs (~180,000 cells shown). MEFs were depleted of p75+ neural crest cells by first gating for DAPI– cells (not shown) and collecting only those that were p75– (~93% of the DAPI– population). g, Quantification of immunostaining for p75+ cells in source and p75-depleted MEF populations after expansion for four days after FACS, on the day of transduction for reprogramming. Data are mean ± s.d., n = 3 biologically independent samples. h, Percentage of TUJ1+ cells derived from source and p75-depleted MEF populations 16 days after induction. A2, Ascl2; N3, Neurog3; ND2, NeuroD2; B3c, Pou4f3; P1, Poulf1. Data are presented as the mean ± s.d., n = 3 biologically independent samples. Percentages of TUJ1+ cells were not significantly different between source and p75-depleted conditions (two-way ANOVA, Sidak’s multiple comparison test. A2.B3c, P = 0.895; N3.P1, P = 0.985; ND2.B3c, P > 0.999). Scale bars, 100 μm.
Extended Data Fig. 2 |. Additional electrophysiological recordings of iN cells from five transcription factor combinations.
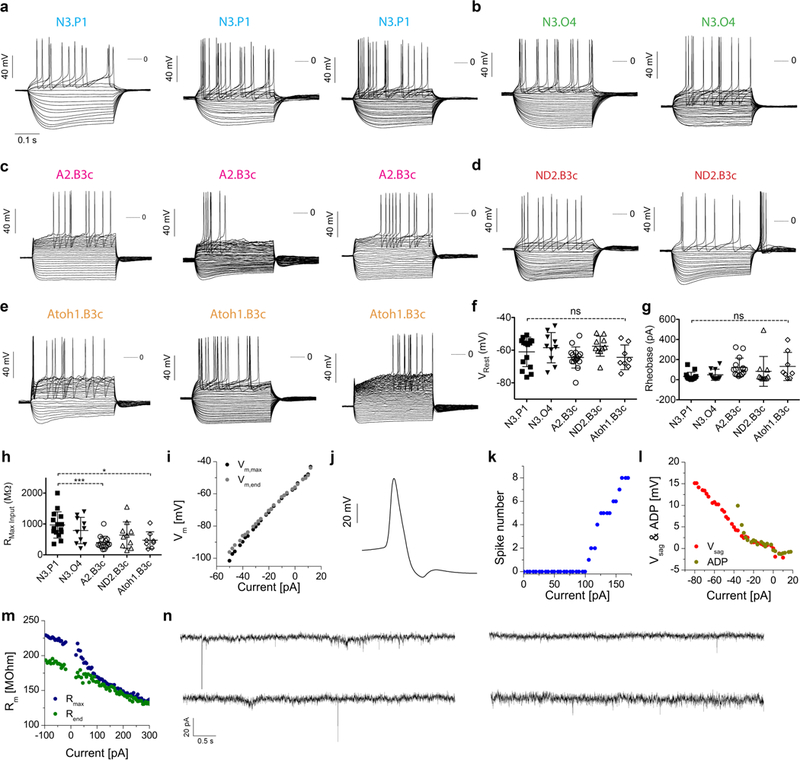
a–e, Example voltage responses of representative iN cells from five transcription factor combinations: Neurog3/Pou1f1 (a; n = 3 cells), Neurog3/Pou5f1 (b; n = 2 cells), Ascl2/Pou4f3 (c; n = 3 cells), Neurod2/Pou4f3 (d; n = 2 cells) and Atoh1/Pou4f3 (e; n = 3 cells). Cells were stimulated using incremental levels of intracellular current starting at –100 to –50 pA and reaching levels where intense firing of action potentials was observed. f–g, Quantification of resting membrane potential (f), rheobase (g) and membrane input resistance (h) for cells that exhibited current-induced action potentials. Neurog3/Pou1f1 (N3.P1, n = 15 cells), Neurog3/Pou5f1 (N3.O4; n = 10 cells), Ascl2/Pou4f3 (A2.B3c; n = 15 cells), Neurod2/Pou4f3 (ND2.B3c; n = 10 cells) and Atoh1/Pou4f3 (Atoh1.B3c; n = 8 cells). Data are mean ± s.d.; ***P = 0.0006, *P = 0.0228; ns, not significant. One-way ANOVA, Tukey’s multiple comparison test. i–m, Physiological properties of the cells. i, Current–voltage relationship obtained by plotting the observed membrane potential as a function of the injected current of both maximal voltage deflections (black) and the membrane potential at the end of the current step (grey). Data from the third Neurog3/Pou1f1 cell in a. j, Selected action potential of the second Neurog3/Pou5f1 cell in b. The dual spike after-hyperpolarization is indicative of Ca-dependent K+ currents in this neuron. k, Input–output curve of the number of spikes as a function of the injected current. This cell starts firing at + 100 pA (rheobase). l, Plot of the voltage sag (red) and after depolarization (dark yellow) as a function of the current. The Neurod2/Pou4f3 cells in d exhibit characteristic voltage sags under negative currents. The second Neurod2/Pou4f3 cell also produces post-inhibitory rebound spikes. m, Plot of membrane resistance versus current. Blue symbols are resistance values calculated from maximal voltage deflections and green symbols were obtained from voltage levels just before the termination of the current step of the third Atoh1/Pou4f3 cell in e. The decrease of membrane resistance as a function of current indicates the action of potent outward-rectifying K+ currents. n, Representative current traces from four cells showing EPSCs from tau–eGFP+, synapsin+ cells generated with Neurog3/Pou5f1 and Neurod2/Pou4f3.
Extended Data Fig. 3 |. Transcription factor pairs generate functional human iN cells from HEFs.

a, Representative TUJ1 immunofluorescence labelling of human iN cells reprogrammed from HEFs using mouse Neurog3/Pou1f1 or human NEUROG3/POU1F1. Scale bar, 100 μm. b, Quantification of TUJ1+ DAPI+ cells for mouse and human iN cells derived from mouse (m) or human (h) Neurog3 and Pou1f1 or rtTA only. Data from n = 2 biologically independent samples. c, Representative images of human iN cells reprogrammed from HEFs using pairs of mouse transcription factors. TUJ1 and MAP2 immunofluorescence labelling of 15 of the 76 positive pairwise combinations derived from the unbiased mouse screen. Fixed and stained on day 16–18 post-induction. Scale bar, 100 μm. Repeated with n = 2 independent experiments. d, Representative images of human iN cells reprogrammed from HEFs in an independent experiment from c. TUJ1 and MAP2 immunofluorescence labelling of four pairwise mouse transcription factor combinations. Fixed and stained on day 18 post-induction. Scale bar, 100 μm. e, Percentage fraction of MAP2+TUJ1+ cells from the four transcription factor combinations represented in d. Imaging from n = 2 biologically independent samples, 100 fields of view each. Number of TUJ1+ cells is as follows: Neurog1/Pou4f1 (n = 166 cells); Neurog3/Pou3f4 (n = 343 cells); Neurog3/Pou1f1 (n = 235 cells); Neurog3/Pou5f1 (n = 146 cells). Data are mean ± s.d. f, Representative synapsin (SYN1) and TUJ1 immunofluorescence labelling of human iN cells reprogrammed with Neurog3/Pou1f1 (91.5% positive for both). Scale bar, 100 μm. Repeated with n = 3 biologically independent samples. g–j, Electrophysiological recordings were performed on human iN cells generated with mouse Neurog3/Pou1f1 between 26 and 31 days postinduction. g, Representative voltage responses from a Syn1–TdTomato+ cell with neuronal morphology; 21 of 27 fluorescent cells tested (77%) generated action potentials upon current injection. h, Representative whole-cell currents evoked by hyperpolarizing and depolarizing voltage steps delivered from a holding potential of –65 mV i, Passive membrane properties of human iN cells. Quantification of resting membrane potential (left), capacitance (middle) and membrane resistance (right) is shown as mean ± s.d. (n = 15 cells). j, Steady-state currents versus voltage in individual cells reflect the expression of depolarization-induced voltage-gated outward currents (n = 9 cells).
Extended Data Fig. 4 |. FACS, RNA-seq library preparation and characterization of iN cell and endogenous neuron populations.
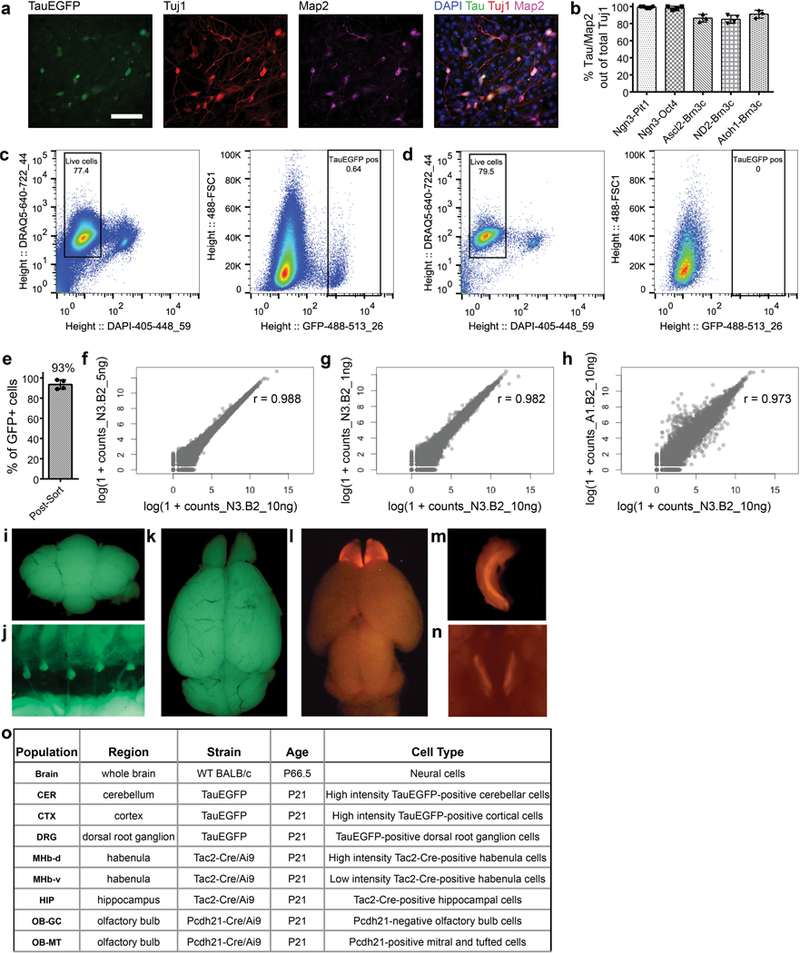
.a, Representative immunofluorescence labelling of tau–EGFP+ iN cell population (Ascl2/Pou4f2) on day 12 post-induction using neuronal antibodies TUJ1 and MAP2. Scale bars, 100 μm. Pou4f2 is also known as Brn3b. b, Quantification of co-labelling of tau–eGFP and MAP2 in Tuj1+ cells on day 12 post-induction calculated from various reprogramming transcription factor pairs. Data are presented as mean ± s.d. from n = 4 independent experiments and n = 574 cells. c, d, Representative FACS gates of an Ascl2/Pou4f2 iN cell population (500,000 cells shown) (c) and a negative rtTA-only control (40,000 cells shown) (d) sorted on day 16 post-induction. Live tau–eGFP+ cells were enriched by first gating DRAQ5+ DAPI– cells, then collecting only those that were GFP+. For Ascl2/Pou4f2, n = 2 independent experiments showed similar results, while for rtTA only, n = 40 independent experiments showed similar results. For all other iN cell populations, at least n = 2 independent experiments were performed to obtain biological replicates. e, Per cent of tau–eGFP+ cells out of total number of cells collected post-FACS, presented as mean ± s.d. (n = 4 sorts, > 100 cells per sort). f, g, Correlation plots between aligned counts from single sequenced libraries of a Neurog3/Pou3f2-iN cell population generated from 10 ng versus 5 ng input RNA (f) and 10 ng versus 1 ng input RNA (g). Pou3f2 is also known as Brn2. r, Pearson correlation coefficient. h, Correlation plots between aligned counts from single sequenced libraries of a Neurog3/Pou3f2 (10 ng input RNA) population and an Ascl1/Pou3f2 (10 ng input RNA) population. i–n, Representative images taken while dissecting tissue from various brain regions of appropriate mouse reporter strains used to isolate specific endogenous cell-type populations used for RNA-seq: cerebellum (CER) (i), DRG (j), cortex (CTX) (k), olfactory bulb mitral and tufted cells (OB-MT) and olfactory bulb granule cells (OB-GC) (l), hippocampus (HIP) (m), and dorsal-medial habenula (MHb-d) and ventral-medial habenula (MHb-v) (n). n = 2 independent RNA-seq experiments. o, Characteristics of the endogenous neuron populations used for RNA-seq.
Extended Data Fig. 5 |. Upstream regulator analysis for core neuronal genes.
a, Complete volcano plot of log2(fold change) versus –log(adjusted P value per gene) for MEFs (black) versus the pooled endogenous neuron and brain (endogenous neuron/brain) RNA-seq data. Genes enriched in MEFs and endogenous neuron/brain are plotted as negative and positive log2(fold change), respectively. Plotted are enriched core genes shared between iN cells and endogenous neuron/brain (orange, 75.5% of the significantly enriched endogenous neuron/brain genes), genes enriched in endogenous neuron/brain (purple, endo enriched), and genes enriched in iN cells (green, iN cell enriched). Red line, –log(0.05 P-adjusted value). Selected neural genes are labelled. b, Number of shared enriched genes between endogenous neurons and MEFs, individual endogenous neurons (purple) or iN cell (green) populations. Core genes (orange) are those shared collectively among iN cells and endogenous neurons. c, Heat map of expression of significant transcriptional regulators identified by HOMER only. Expression levels are defined as DESeq2 vsd-normalized RNA-seq counts with replicates averaged and scaled by row. d, Heat map of expression of significant class I–IV transcriptional regulators identified by IPA only. Class I, putative uniform neuronal repressor; Class II, putative non-uniform neuronal repressor; Class III, putative neuronal activator in iN cells; Class IV, putative neuronal activator in endogenous neurons. Expression levels are defined as DESeq2 vsd-normalized RNA-seq counts with groups averaged and scaled by row.
Extended Data Fig. 6 |. scRNA-seq analysis of iN cell populations.

a, t-SNE projection of single cells collected from four iN cell populations, Neurog3/Pou5f1 (N3.O4, n = 415 cells), Neurog3/Pou3f4 (N3.B4, n = 313 cells), Neurog1/Pou4f1 (N 1.B3a, n = 134 cells) and Ascl2/Nr4a2 (A2. NR1, n = 90 cells), coloured by log of UMI counts per cell. Arrows point to subpopulations of cells with low UMI, which includes a cluster composed of cells from each iN cell population. b, t-SNE projection of the same single cells shown in a, coloured by the log of UMI counts for the myogenic genes Acta1, Tnnc2 and Myl1. Inset areas are magnified to highlight the small fraction of cells positive for the myogenic genes (3 out of 90, threshold set at log(UMI counts) > 1) in the Ascl2/Nr4a2 (A2. NR1) population. The three myogenic genes plotted were those identified previously19 that were not highly expressed in any of our endogenous neuron populations. c, t-SNE projection of single cells collected from MEFs and five iN cell populations: Neurog3/Pou5f1 (N3.O4), Neurog3/Pou3f4 (N3.B4), Neurog1/Pou4f1 (N1.B3a), Ascl2/Nr4a2 (A1.NR1) and Neurog3/Pou1f1 (N3.P1). Cells are coloured by the log of UMI counts for genes Col1a2 and Lox, which represent MEF genes (10 out of 15 genes) that are highly expressed in the majority of the MEF population and in a small fraction of cells in the iN cell populations. Fifteen MEF genes were selected, based on the top genes enriched in MEFs compared to endogenous neuron/brain according to population RNA-seq that were not also expressed in endogenous neuronal single cells (data not shown). d, t-SNE projection of the same single cells as shown in c, coloured by the log of UMI counts for the genes Postn and Mmp2, which represent MEF genes (5 out of 15 genes) that are highly expressed in the majority of the MEF population and in a large fraction of cells in the iN cell populations. e,t-SNE projections of single cells coloured by log of UMI counts per cell for each of the individual iN cell populations sequenced: Neurog3/Pou3f4 (N3.B4), Neurog3/Pou5f1 (N3.O4), Neurog1/Pou4f1 (N1.B3a) and Ascl2/Nr4a2 (A1.NR1). The number of cells for each transcription factor combination is the same as in a. f, Expression of receptors and transmembrane proteins among the top 20 differentially expressed genes in each transcription factor pair relative to all other combinations, plotted as a simplified violin plot. One representative gene shown for each transcription factor pair.
Extended Data Fig. 7 |. Diversity across iN cell populations.
a, WGCNA module eigengene expression of the 35 iN cell populations (in duplicate) shown as bar plots of average module eigengene expression for module 09 (M09, n = 477 genes) correlated with bHLH subclasses. Colours highlight iN cells populations generated with the Ascl family of bHLH factors or an iN cell combination generated with the bHLH factor, Neurod2. b, Heat map of expression of myogenic genes reflects higher levels of expression in iN cell populations derived with the Ascl family of reprogramming factors compared to the Neurog family. The myogenic gene list is as described19. Expression levels are defined as DESeq2 vsd-normalized RNA-seq counts with replicates averaged and scaled by row. The dendrogram represents hierarchical clustering based on correlation distance. c, Heat map of expression of select neurotransmitter-associated genes. Expression levels in iN cell (green), endogenous neuron/brain (purple) and MEF populations (grey) are defined as DESeq2 vsd-normalized RNA-seq counts with replicates averaged. Dendrogram represents hierarchical clustering based on correlation distance. d, Schematic of dopamine and noradrenaline biosynthesis pathway. e, Heat map of expression of genes involved in dopamine and noradrenaline biosynthesis and re-uptake across all iN cell (green), endogenous neurons (purple) and MEF (grey) populations. Expression patterns for populations generated with Ascl1/Nr4a2, Ascl2/Nr4a2, Ascl5/Pou4f3 and Neurod2/Pou4f3 are outlined with a black frame. Expression levels are defined as DESeq2 vsd-normalized RNA-seq counts with replicates averaged. Dendrogram represents hierarchical clustering based on correlation distance.
Extended Data Fig. 8 |. Diverse glutamate and nicotine responses of iN cell populations.

a, Heat map of expression of glutamate and nicotinic acetylcholine receptor subunit genes across all iN cell populations. Expression levels are defined as DESeq2 vsd-normalized RNA-seq counts with replicates averaged. Dendrogram represents hierarchical clustering based on correlation distance. b, Percentages of glutamate- and nicotine- responsive cells out of total KCl-responsive cells in each individual iN cell population (n = 218 total cells). Group 1 (n = 6 independent experiments) and group 2 (n = 4) comprise iN cell populations with the lowest and highest overall expression of nicotinic acetylcholine receptors, respectively. ***P = 0.0004; ns, not significant (unpaired Student’s t-test). Data are mean ± s.d.
Extended Data Fig. 9 |. Comparison of iN cell and endogenous neuron populations.
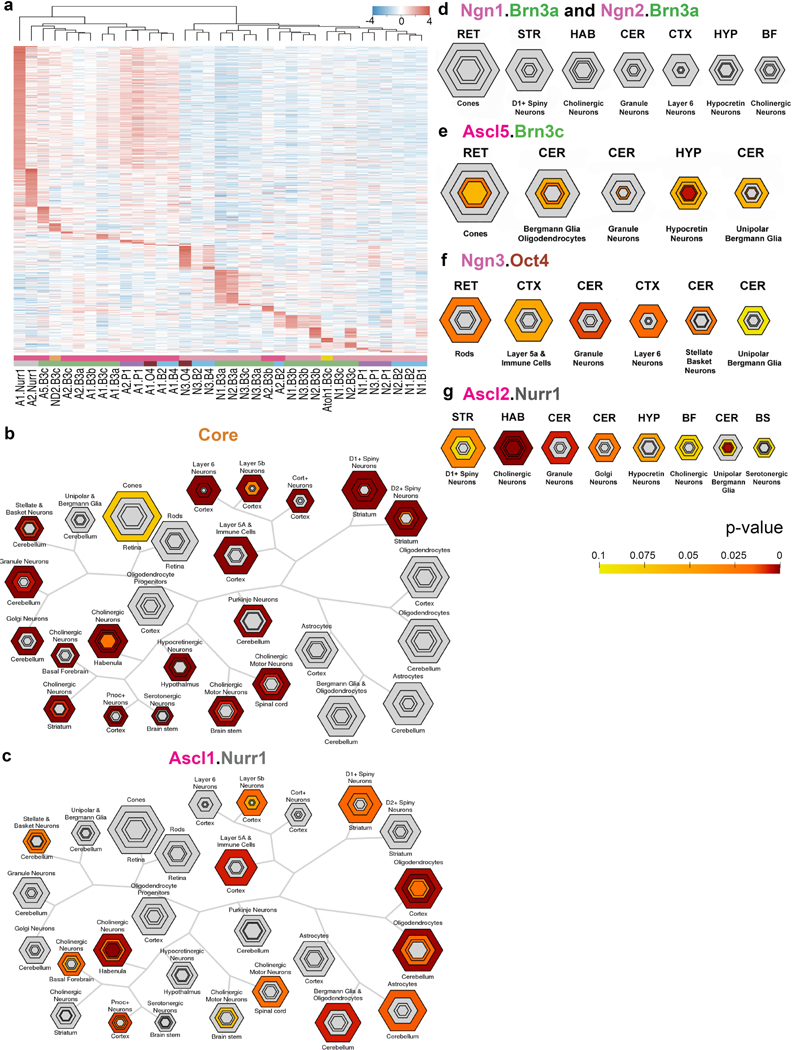
a, Heat map of expression of uniquely enriched genes in individual iN cell populations as defined by genes significantly enriched (P-adjusted value < 0.05) in each iN cell population versus all other iN cell populations and MEFs determined by DESeq2. Expression levels are defined as DESeq2 vsd-normalized RNA-seq counts with replicates averaged and scaled by row. Dendrogram represents hierarchical clustering based on Euclidean distance. b–g, Overlap of gene lists with a particular cell type or region for which data are currently available were identified by Fisher’s exact test (two-sided) with Benjamini–Hochberg correction using CSEA. Concentric, hexagonal plots represent each cell type or region. The sizes of the hexagons are scaled to the number of specifically enriched transcripts at set stringency thresholds with the innermost hexagon representing the most unique genes. Hexagons are colour coded by the P values of the Fisher’s exact test. RET, retina; HYP, hypothalamus; STR, striatum; HAB, habenula; BF, basal forebrain; BS, brainstem. b–d, CSEA of the core genes (enriched genes shared between iN cell and endogenous neuron/brain populations, n = 2,239 genes) (b) and uniquely enriched genes of iN cell populations Ascl1/Nr4a2 (A1. Nurr1, n = 282 genes) (c) and Neurog1/Pou4f1 and Neurog2/Pou4f1 (N1/N2.B3a, combined n = 93 genes total) (d). Uniquely enriched genes were defined in the same manner as in a. e–g, Modified CSEA visualization of uniquely enriched genes of individual iN cell populations: Ascl5/Pou4f3 (A5.B3c, n = 46 genes) (e), Neurog3/Pou5f1 (N3.O4, n = 51 genes) (f) and Ascl2/Nr4a2 (A2.NR1, n = 101 genes) (g). Uniquely enriched genes were defined in the same manner as in a.
Extended Data Fig. 10 |. Comparison of single-cell iN cell and endogenous neuron populations.

a, Pearson correlation values between individual single cells and bulk DRG plotted as kernel density distributions for each transcription factor pair, and colour-coded accordingly. To generate Pearson correlation values between endogenous populations and single cells, unique genes for each endogenous population (n = 1 population in duplicate biological samples) were defined using DESeq2 as the top 100 significant genes that were ranked by highest fold change when compared to all other endogenous populations (n = 5 in duplicate, n = 2 in triplicate biological samples). The expression level of these unique genes in their respective endogenous population was correlated with each single-cell for genes that were found in filtered gene-barcode matrices. Pearson correlation values were plotted as kernel density estimations to represent the distribution of single cells for each iN cell population: Neurog1/Pou4f1 (N1.B3a, n = 134 cells, green), Neurog3/Pou5f1 (N3. O4, n = 415 cells, pink), Neurog3/Pou3f4 (N3.B4, n = 313 cells, blue) and Ascl2/Nr4a2 (A2.NR1, 90 cells, orange). b, t-SNE projections of 952 single cells coloured by their correlation with bulk DRG. The Neurog1/Pou4f1 pair exhibits enrichment of highly correlated cells. c, Pearson correlation values between individual single cells (n = 952 cells) and bulk HIP plotted as kernel density distributions for each combination and colour coded accordingly. d, t-SNE projections of 952 single cells coloured by their correlation with bulk HIP. The Ascl2/Nr4a2 pair exhibits enrichment of highly correlated cells. e–g, Pearson correlation values between individual single cells and bulk CTX (e), MHb-v (f) and CER (g) plotted as kernel density distributions for each combination, and colour-coded accordingly.
Supplementary Material
Acknowledgements
We thank M. Haynes, B. Seeger and A. Saluk for cell sorting, S. Head, J. Shimashita and J. Lesdesma for next-generation sequencing, K. Spencer for microscopy, V. Lo Sardo, W. Ferguson, M. Duran, J. Hazen, A. Adler and the Topol laboratory for technical assistance, R. Vega Perez for cell counting, and A. Su and J. Fouquier for assistance with BioGPS. BioGPS work is funded by R01 GM083924 to A. Su. This research was supported the National Brain Research Program of Hungary (KTIA_NAP_13–2014-0018 to A.S.), by the NIH (NIDA, DA031566 to PPS.), by The Scripps Translational Science (A.T), (CTSA; 5 UL1 TR001114 to A.T), (U54GM114833 to A.T), (NIDCD, DC012592 to K.K.B.), (NIMH, MH102698 to K.K.B.), (NIA, DP1 AG055944), and the Dorris Neuroscience Center (K.K.B.), a pre-doctoral fellowship from CIRM (J.W.B., R.T and S.L.), an NSF Predoctoral Fellowship (R.T.) and the Andrea Elizabeth Vogt Memorial Award (J.W.B.).
Footnotes
Online content
Any Methods, including any statements of data availability and Nature Research reporting summaries, along with any additional references and Source Data files, are available in the online version of the paper at https://doi.org/10.1038/s41586–018-0103–5.
Data availability. RNA-seq data that support the findings of this study have been deposited to GEO with the accession code: GSE112381 and the BioGPS platform (http://biogps.org/dataset/BDS_00016/).
Competing interests The authors declare no competing interests.
Extended data is available for this paper at https://doi.org/10.1038/s41586-018-0103-5.
Supplementary information is available for this paper at https://doi.org/10.1038/s41586–018-0103–5.
Reprints and permissions information is available at http://www.nature.com/ reprints.
Publisher’s note: Springer Nature remains neutral with regard to jurisdictional claims in published maps and institutional affiliations.
References
- 1.Davis RL., Weintraub H. & Lassar AB. Expression of a single transfected cDNA converts fibroblasts to myoblasts. Cell 51, 987–1000 (1987). [DOI] [PubMed] [Google Scholar]
- 2.Takahashi K. & Yamanaka S. Induction of pluripotent stem cells from mouse embryonic and adult fibroblast cultures by defined factors. Cell 126, 663–676 (2006). [DOI] [PubMed] [Google Scholar]
- 3.Vierbuchen T. et al. Direct conversion of fibroblasts to functional neurons by defined factors. Nature 463, 1035–1041 (2010). [DOI] [PMC free article] [PubMed] [Google Scholar]
- 4.Caiazzo M. et al. Direct generation of functional dopaminergic neurons from mouse and human fibroblasts. Nature 476, 224–227 (2011). [DOI] [PubMed] [Google Scholar]
- 5.Chanda S., Marro S., Wernig M. & Sudhof TC. Neurons generated by direct conversion of fibroblasts reproduce synaptic phenotype caused by autism-associated neuroligin-3 mutation. Proc. Natl Acad. Sci. USA 110, 16622–16627 (2013). [DOI] [PMC free article] [PubMed] [Google Scholar]
- 6.Kim J. et al. Functional integration of dopaminergic neurons directly converted from mouse fibroblasts. Cell Stem Cell 9, 413–419 (2011). [DOI] [PMC free article] [PubMed] [Google Scholar]
- 7.Pang ZP. et al. Induction of human neuronal cells by defined transcription factors. Nature 476, 220–223 (2011). [DOI] [PMC free article] [PubMed] [Google Scholar]
- 8.Pfisterer U. et al. Direct conversion of human fibroblasts to dopaminergic neurons. Proc. Natl Acad. Sci. USA 108, 10343–10348 (2011). [DOI] [PMC free article] [PubMed] [Google Scholar]
- 9.Son EY. et al. Conversion of mouse and human fibroblasts into functional spinal motor neurons. Cell Stem Cell 9, 205–218 (2011). [DOI] [PMC free article] [PubMed] [Google Scholar]
- 10.Vadodaria KC. et al. Generation of functional human serotonergic neurons from fibroblasts. Mol. Psychiatry 21, 49–61 (2016). [DOI] [PubMed] [Google Scholar]
- 11.Wapinski OL. et al. Hierarchical mechanisms for direct reprogramming of fibroblasts to neurons. Cell 155, 621–635 (2013). [DOI] [PMC free article] [PubMed] [Google Scholar]
- 12.Blanchard JW. et al. Selective conversion of fibroblasts into peripheral sensory neurons. Nat. Neurosci. 18, 25–35 (2015). [DOI] [PMC free article] [PubMed] [Google Scholar]
- 13.Hockemeyer D. et al. A drug-inducible system for direct reprogramming of human somatic cells to pluripotency. Cell Stem Cell 3, 346–353 (2008). [DOI] [PMC free article] [PubMed] [Google Scholar]
- 14.Xu C. et al. Immortalized fibroblast-like cells derived from human embryonic stem cells support undifferentiated cell growth. Stem Cells 22, 972–980 (2004). [DOI] [PubMed] [Google Scholar]
- 15.Love MI., Huber W. & Anders S. Moderated estimation of fold change and dispersion for RNA-seq data with DESeq2. Genome Biol. 15, 550 (2014). [DOI] [PMC free article] [PubMed] [Google Scholar]
- 16.Dennis G Jr. et al. DAVID: Database for Annotation, Visualization, and Integrated Discovery. Genome Biol. 4, 3 (2003). [PubMed] [Google Scholar]
- 17.Schoenherr CJ., Paquette AJ. & Anderson DJ. Identification of potential target genes for the neuron-restrictive silencer factor. Proc. Natl Acad. Sci. USA 93, 9881–9886 (1996). [DOI] [PMC free article] [PubMed] [Google Scholar]
- 18.Drouin-Ouellet J. et al. REST suppression mediates neural conversion of adult human fibroblasts via microRNA-dependent and -independent pathways. EMBO Mol. Med. 9, 1117–1131 (2017). [DOI] [PMC free article] [PubMed] [Google Scholar]
- 19.Treutlein B. et al. Dissecting direct reprogramming from fibroblast to neuron using single-cell RNA-seq. Nature 534, 391–395 (2016). [DOI] [PMC free article] [PubMed] [Google Scholar]
- 20.Langfelder P. & Horvath S. WGCNA: an R package for weighted correlation network analysis. BMC Bioinformatics 9, 559 (2008). [DOI] [PMC free article] [PubMed] [Google Scholar]
- 21.Zhang B. & Horvath S. A general framework for weighted gene co-expression network analysis. Stat. Appl. Genet. Mol. Biol. 4, 10.2202/1544-6115.1128 (2005). [DOI] [PubMed] [Google Scholar]
- 22.Mi H., Poudel S., Muruganujan A., Casagrande JT. & Thomas PD. PANTHER version 10: expanded protein families and functions, and analysis tools. Nucleic Acids Res. 44 (D1), D336–D342 (2016). [DOI] [PMC free article] [PubMed] [Google Scholar]
- 23.Mi H., Muruganujan A., Casagrande JT. & Thomas PD. Large-scale gene function analysis with the PANTHER classification system. Nat. Protoc. 8, 1551–1566 (2013). [DOI] [PMC free article] [PubMed] [Google Scholar]
- 24.Oh SI. et al. Efficient reprogramming of mouse fibroblasts to neuronal cells including dopaminergic neurons. The Scientific World Journal 2014, 957548 (2014). [DOI] [PMC free article] [PubMed] [Google Scholar]
- 25.Addis RC. et al. Efficient conversion of astrocytes to functional midbrain dopaminergic neurons using a single polycistronic vector. PLoS ONE 6, e28719 (2011). [DOI] [PMC free article] [PubMed] [Google Scholar]
- 26.Dell’Anno MT. et al. Remote control of induced dopaminergic neurons in parkinsonian rats. J. Clin. Invest. 124, 3215–3229 (2014). [DOI] [PMC free article] [PubMed] [Google Scholar]
- 27.Albuquerque EX., Pereira EF., Alkondon M. & Rogers SW. Mammalian nicotinic acetylcholine receptors: from structure to function. Physiol. Rev. 89, 73–120 (2009). [DOI] [PMC free article] [PubMed] [Google Scholar]
- 28.Thorgeirsson TE. et al. A variant associated with nicotine dependence, lung cancer and peripheral arterial disease. Nature 452, 638–642 (2008). [DOI] [PMC free article] [PubMed] [Google Scholar]
- 29.Dougherty JD., Schmidt EF., Nakajima M. & Heintz N. Analytical approaches to RNA profiling data for the identification of genes enriched in specific cells. Nucleic Acids Res. 38, 4218–4230 (2010). [DOI] [PMC free article] [PubMed] [Google Scholar]
- 30.Xu X., Wells AB., O’Brien DR., Nehorai A. & Dougherty JD. Cell type-specific expression analysis to identify putative cellular mechanisms for neurogenetic disorders. J. Neurosci. 34, 1420–1431 (2014). [DOI] [PMC free article] [PubMed] [Google Scholar]
- 31.Chin MT. Reprogramming cell fate: a changing story. Front. Cell Dev. Biol. 2, 46 (2014). [DOI] [PMC free article] [PubMed] [Google Scholar]
- 32.Poulin JF, Tasic B., Hjerling-Leffler J., Trimarchi JM. & Awatramani R. Disentangling neural cell diversity using single-cell transcriptomics. Nat. Neurosci. 19, 1131–1141 (2016). [DOI] [PubMed] [Google Scholar]
- 33.Usoskin D. et al. Unbiased classification of sensory neuron types by large-scale single-cell RNA sequencing. Nat. Neurosci. 18, 145–153 (2015). [DOI] [PubMed] [Google Scholar]
- 34.Tasic B. et al. Adult mouse cortical cell taxonomy revealed by single cell transcriptomics. Nat. Neurosci. 19, 335–346 (2016). [DOI] [PMC free article] [PubMed] [Google Scholar]
- 35.Lo Sardo V. et al. Influence of donor age on induced pluripotent stem cells. Nat Biotechnol. 35, 69–74 (2017). [DOI] [PMC free article] [PubMed] [Google Scholar]
- 36.Brewer GJ. & Torricelli JR. Isolation and culture of adult neurons and neurospheres. Nat. Protoc. 2, 1490–1498 (2007). [DOI] [PubMed] [Google Scholar]
- 37.Hazen JL. et al. The complete genome sequences, unique mutational spectra, and developmental potency of adult neurons revealed by cloning. Neuron 89, 1223–1236 (2016). [DOI] [PMC free article] [PubMed] [Google Scholar]
- 38.Bolger AM., Lohse M. & Usadel B. Trimmomatic: a flexible trimmer for Illumina sequence data. Bioinformatics 30, 2114–2120 (2014). [DOI] [PMC free article] [PubMed] [Google Scholar]
- 39.Dobin A. et al. STAR: ultrafast universal RNA-seq aligner. Bioinformatics 29, 15–21 (2013). [DOI] [PMC free article] [PubMed] [Google Scholar]
- 40.Anders S., Pyl PT & Huber W. HTSeq—a Python framework to work with high-throughput sequencing data. Bioinformatics 31, 166–169 (2015). [DOI] [PMC free article] [PubMed] [Google Scholar]
- 41.R Core Team. R: A Language and Environment for Statistical Computing http://www.R-project.org/ (R Foundation for Statistical Computing, Vienna, Austria, 2013. [Google Scholar]
- 42.Gentleman RC. et al. Bioconductor: open software development for computational biology and bioinformatics. Genome Biol. 5, R80 (2004). [DOI] [PMC free article] [PubMed] [Google Scholar]
- 43.Warnes GR. gplots: Various R Programming Tools for Plotting Data. https://rdrr.io/cran/gplots/ (2015).
- 44.Adler D. et al. rgl: 3D Visualization Using OpenGL. https://rdrr.io/rforge/rgl/(2016).
- 45.pca3d: Three Dimensional PCA Plots. https://cran.r-project.org/web/packages/pca3d/index.html (2015).
- 46.Heinz S. et al. Simple combinations of lineage-determining transcription factors prime cis-regulatory elements required for macrophage and B cell identities. Mol. Cell 38, 576–589 (2010). [DOI] [PMC free article] [PubMed] [Google Scholar]
- 47.Matys V. et al. TRANSFAC and its module TRANSCompel: transcriptional gene regulation in eukaryotes. Nucleic Acids Res. 34, D108–D110 (2006). [DOI] [PMC free article] [PubMed] [Google Scholar]
- 48.Mathelier A. et al. JASPAR 2016: a major expansion and update of the open-access database of transcription factor binding profiles. Nucleic Acids Res. 44 (D1), D110–D115 (2016). [DOI] [PMC free article] [PubMed] [Google Scholar]
- 49.Zheng GX. et al. Massively parallel digital transcriptional profiling of single cells. Nat. Commun. 8, 14049 (2017). [DOI] [PMC free article] [PubMed] [Google Scholar]
- 50.Hawrylycz M. et al. Canonical genetic signatures of the adult human brain. Nat. Neurosci. 18, 1832–1844 (2015). [DOI] [PMC free article] [PubMed] [Google Scholar]
Associated Data
This section collects any data citations, data availability statements, or supplementary materials included in this article.