

Abstract
Abstract
The aim of this study was to evaluate the mycotoxicological quality of wheat flours used by bakeries from the North Region in Rio Grande do Sul state, Brazil, regarding the presence of mycotoxins. On collecting type-1 refined wheat flour, a conglomerate sampling from 13 cities and 3 bakeries per city (n = 39), selected from the defined region was performed. The mycotoxins analysis was using QuEChERS method and UPLC–MS/MS analysis. As a result, 100% of samples presented contamination by DON, with concentrations ranging from 76.7 to 3630.2 µg kg−1 and ZON was found in one sample (26.7 µg kg−1), which represented 2.6% of the analyzed wheat flours. Other mycotoxins (AFB1, AFB2, AFG1, AFG2, DAS, HT-2 toxin, OTA, FB1 and FB2) were not detected in the analyzed samples.
Graphical abstract

Keywords: Deoxynivalenol, Zearalenone, Cereal, UPLC–MS/MS
Introduction
Cereal crops, specially wheat (Triticum spp), are considered food staples as they are widely applied and have great nutritional characteristics. It is among the world’s most produced cereal crops and it is Brazilian second most cultivated cereal grain, surpassed only by corn (Scheuer et al., 2011). The Brazilian 2014/2015 wheat harvest season was 5900 million tons, representing 0.81% of global production. It’s known that the largest majority of that wheat is for production of refined wheat flour, widely employed by food industry. The annual per capita consumption of wheat flour in Brazil, on the period 2010–2014, varied from 42.3 to 44.5 kg, highlighting bakeries as the biggest wheat flour users (Prückler et al., 2014).
However, during production, harvest, storage, transport and even during processing, cereal crops can be exposed to fungal contamination and serious care must be given to mycotoxigenic fungi. Mycotoxins are fungi secondary metabolites, harmful to humans, animals and plants (Lindblad et al., 2013). Many studies has demonstrated the relation between the consumption of contaminated foods and the development of various reactions in the human body, such as allergenic, mutagenic and carcinogenic ones, it is also capable of affecting the immune system. Effects will vary depending on mycotoxin’s type and the concentration ingested. Among mycotoxins, special attention is given to aflatoxin (AF), deoxynivalenol (DON), diacetoxyscirpenol (DAS), HT-2 toxin, fumonisin (FB), ochratoxin A (OTA) and zearalenone (ZON), as the most studied and toxic ones (Ferraz et al., 2010). Furthermore, they present high stability and resistance during various food thermal processing stages.
As a way to better control such substances found on foods in Brazil, the Brazilian National Health Surveillance Agency (ANVISA), established the maximum tolerance level (MTL) for some mycotoxins in foods, based on Brazilian legislation (RDC, no 07/2011) (Brazil, 2011).
Given these considerations, the aim of this study has been to determine mycotoxins in wheat flours used by bakeries from cities located in the North Region in the state of Rio Grande do Sul, Brazil. In the study was evaluated the presence of mycotoxin (AFB1, AFB2, AFG1, AFG2, DON, DAS, HT-2 toxin, OTA, ZON, FB1 and FB2) using ultra performance liquid chromatography (UPLC) coupled to a tandem mass spectrometer (UPLC–MS/MS). The UPLC–MS/MS has been very much employed as an efficient analytical technique for fast determination of multi-toxins at low concentration levels, presenting proper selectivity (Soleimany et al., 2012). The results were compared with the MTL established by the current legislation and also elaborating an informative booklet to be handed out to bakeries located at the studied region.
Materials and methods
Sampling planning
A sampling by conglomerate was performed, initiated by the drawing of the cities involved in the study, followed by the drawing of bakeries for each single city. Drawing is deemed necessary in order to include possible variation sources to the study, granting the desired representation. The cities and bakeries were drawing by using the R 3.2.2 Statistical Computing Software (Vienna-Austria). The software’s “sample” function was chosen for the sample drawing, which randomly selected elements of a data set (without automatic resetting), not permitting the possibility of the same city or bakery to appear more than once on the sample, avoiding repetition.
For such, a randomized elements permutation it was made using the R software, rearranging it randomly and extracting a subgroup from that universe. That permutation was done based on a pseudo-random number generator, consisting of an algorithm programming that generates numbers of which properties are close to the sequence of random numbers. These numbers are not called random, since they are determined onwards the group of initial values (called random seed). The standard algorithm used by R software is the Mersenne-Twister, developed by Mastsumoto and Nishimura (1998), widely used by several software such as SPSS, SAS and Microsoft Visual C++.
The unilateral t test was used for the sample size calculation that compares the mean of a sample with the reference value, allowing establishing if there is any considerable difference between the two values—since one of the aims of this work was to compare the values found with the current Brazilian legislation. It was set the significance level at 5% and statistical power at 0.8. Once the values were set, the R software was used with “pwr” package and “pwr.t.test” functions for the sample calculation, noting that 33 samples were deemed necessary to reach the previously established parameters.
The flour’s type used for analysis was limited only to type-1 refined wheat flour (2015 harvest season). The sample collection was also restricted to bakeries from the North Region that encompasses of 34 cities, and the R software drew the following 13 cities from that group; Alpestre, Ametista do Sul, Caiçara, Erval Seco, Frederico Westphalen, Iraí, Nonoai, Palmitinho, Planalto, Rodeio Bonito, Seberi, Vicente Dutra and Vista Alegre. After the drawing of cities, a survey of existing bakeries from each city was carried out and the drawing using the R software was performed, drawing the bakery/city where the samples were obtained from and subsequently coded as follows: City 1 (TVS 2, TVS 3 and TVS 4); City 2 (ABJ 2, ABJ 3 and ABJ 5); City 3 (FQJ 1, FQJ 3 and FQJ 4); City 4 (DRO 1, DRO 3 and DRO 5); City 5 (EGT 4, EGT 5 and EGT 13); City 6 (YPB 1, YPB 2 and YPB 5); City 7 (XVL 1, XVL 2 and XVL 3); City 8 (LPD 1, LPD 2 and LPD 3); City 9 (IRM 2, IRM 3 and IRM 5); City 10 (VHT 1, VHT 2 and VHT 4); City 11 (WSP 2, WSP 4 and WSP 5); City 12 (LSK 1, LSK 3 and LSK 5) and City 13 (MQU 3, MQU 4 and MQU 5).
The wheat flour (Type-1) sample collection occurred between July and August 2015 at the bakeries from the drawn cities. An amount of 500 g of wheat flour were obtained for each sample. Wheat flour samples with absence of mycotoxin were used as a “blank” sample.
Mycotoxins determination
Reagents and reference standard
Reference standard of mycotoxins were obtained from Sigma-Aldrich (SP, Brazil). Pesticide grade acetonitrile, methanol, toluene and glacial acetic acid were supplied by J.T. Backer Chemicals (Millinckrodt, USA). Anhydrous magnesium sulphate was obtained from UCT (Bristol, PA, USA) and formic acid was obtained from Sigma Aldrich (St. Louis, USA). Milli-Q water was obtained from Millipore (Milford, MA, USA).
Chromatographic analysis
An ultra-performance liquid chromatography model Acquity UPLC, coupled to a mass spectrometer model Xevo TQS (Waters, Milford, MA, USA) using electrospray ionization in positive mode was employed for detection in multiple reactions monitoring (MRM) acquisition mode. The instrumental conditions (UPLC–MS/MS) used in this study were established by Souza (2014) (Table 1). Analyses were carried out using a BEH C18 (100 mm × 2.1 mm i.d. × 1.7 μm particle size, Waters, USA) chromatographic column at a constant temperature of 60 °C. The mobile phase was composed of acetonitrile (containing formic acid at 0.1%) and water (containing formic acid at 0.1%), in elution gradient mode and a constant flow rate of 0.45 mL min−1. Two microliters was used for injection in chromatographic system and total run time was 13 min. The MS conditions were capillary voltage of 2.0 kV, temperature desolvation of 400 °C, Nitrogen flow of 100 L h−1, cone flow of 7.0 L h−1, collision gas flow of 0.15 mL min−1.
Table 1.
Analytical parameters evaluated during method validation
| Parameters | Mycotoxins | |
|---|---|---|
| Group 1* | Group 2 | |
| Linear range (ng mL−1) | 0.1–50 | 5–2500 |
| Determination coefficient | r2 > 0.98 | r2 > 0.98 |
| LOD (µg kg−1) | 0.4 | 100 (FB1, FB2 and HT-2) |
| 20 (DON, DAS and ZON) | ||
| LOQ (µg kg−1) | 1 | 50 |
| Recovery range (RSD%) | Level 1 (1 µg kg−1) 78.9–85.2% (RSD < 10.9%) |
Level 1 (50 µg kg−1) 74.2–99.9% (RSD < 12.2%) |
| Level 2 (2.5 µg kg−1) 87.1–115.9% (RSD < 9.8%) |
Level 2 (125 µg kg−1) 73.6–100.1% (RSD < 13.3%) |
|
| Level 3 (10 µg kg−1) 81.4–92.3% (RSD < 6.9%) |
Level 3 (500 µg kg−1) 74.3–99.5% (RSD < 6.5%) |
|
*Souza (2014)
Sample preparation and extraction
The wheat flour samples were homogenized with water, obtaining a homogeneous suspension (slurry). An amount of 20 g were weighted and 30 g of water added to it, and then mixed thoroughly using Ultra-Turrax equipment—PT 3100 model (Polytron Corporation, Canada) at 10,000 rpm for 1 min. Afterwards, 12.5 g of the slurry was weighted followed by the addition of 10 mL of 1% acetic acid solution in acetonitrile and the procedure internal standard (Quinalphos at 12.5 μg L−1) in each tube, and then homogenized for around 1 min. After that, 5 g of anhydrous MgSO4 was added and the homogenization process was performed once again. Then, a 3 min centrifugation at 4000 rpm was performed. Subsequently, 500 μL of supernatant and 500 μL of methanol were added to a vial containing the instrument internal standard (propoxur at 10 μg L−1). The quantification was done by external standardization, that is to say, taking only in consideration the studied mycotoxins’ peak areas.
Method validation
The method validation parameters determined were established by Souza (2014). For mycotoxins group 1 (AFB1, AFB2, AFG1, AFG2 and OTA) the results were: linear range 0.1–50 ng mL−1 with determination coefficient (r2) > 0.98. LOD and LOQ 0.4 and 1.0 µg kg−1, respectively. The recovery range and RSD% were Level 1 (1 µg kg−1) 78.9–85.2% (RSD < 10.9%), Level 2 (2.5 µg kg−1) 87.1–115.9% (RSD < 9.8%) and Level 3 (10 µg kg−1) 81.4–92.3% (RSD < 6.9%).
Already for group 2 (DON, DAS, ZON, FB1, FB2 and HT-2) the linear range was 5–2500 ng mL−1 with determination coefficient (r2) > 0.98. The LOD were 20 µg kg−1 for DON, DAS, ZON and 100 µg kg−1 for FB1, FB2, HT-2. The LOQ was 50 µg kg−1 for all mycotoxins of this group. The recovery range and RSD% were Level 1 (50 µg kg−1) 74.2–99.9% (RSD < 12.2%), Level 2 (125 µg kg−1) 73.6–100.1% (RSD < 13.3%) and Level 3 (500 µg kg−1) 74.3–99.5% (RSD < 6.5%).
Statistical analysis
Results were treated statistically according to variance analysis (ANOVA), followed by comparison of mean differences by Tukey test and also by Cluster (dendrogram) analysis (Euclidian distance) at 95% confidence level, aided by Statistic 5.0 version software.
Results and discussion
Mycotoxin occurrence in wheat flour samples
Table 2 presents the results for DON on the wheat flour samples from bakeries of the 13 studied cities of Medium–High Uruguay Region, Brazil. It is possible to visualize the presence of DON mycotoxin in 100% of samples (n = 39) with a significant difference (p < 0.05) among the samples from the cities, with concentrations that ranged from 158 to 1606 µg kg−1.
Table 2.
DON concentrations of the samples and mean of the cities
| City | Samples | DON (µg kg−1) | SD | RSD (%) |
|---|---|---|---|---|
| 1 | TVS 2 | 368b | 4.8 | 1.3 |
| TVS 3 | 538a | 25.8 | 4.8 | |
| TVS 4 | 77c | 1.9 | 2.6 | |
| Mean | TVS | 328B | 202.5 | 71.2 |
| 2 | ABJ 2 | 687b | 12.4 | 1.8 |
| ABJ 3 | 1996a | 84.8 | 4.3 | |
| ABJ 5 | 155c | 3.4 | 2.2 | |
| Mean | ABJ | 946AB | 821.7 | 100.1 |
| 3 | FQJ 1 | 712c | 23.8 | 3.3 |
| FQJ 3 | 1774b | 819.5 | 46.2 | |
| FQJ 4 | 2243ª | 34.9 | 1.6 | |
| Mean | FQJ | 1576A | 793.8 | 49.8 |
| 4 | DRO 1 | 626b | 9.2 | 1.5 |
| DRO 3 | 138c | 3.8 | 2.8 | |
| DRO 5 | 782ª | 5.8 | 0.7 | |
| Mean | DRO | 515B | 291.2 | 65.3 |
| 5 | EGT 4 | 412c | 58.6 | 14.3 |
| EGT 5 | 594b | 101.1 | 17.0 | |
| EGT 13 | 1155ª | 42.4 | 3.7 | |
| Mean | EGT | 720AB | 341.0 | 53.8 |
| 6 | YPB 1 | 196a | 5.2 | 2.7 |
| YPB 2 | 100c | 3.7 | 3.7 | |
| YPB 5 | 179b | 7.6 | 4.3 | |
| Mean | YPB | 158B | 44.8 | 32.5 |
| 7 | XVL 1 | 381c | 9.5 | 2.5 |
| XVL 2 | 807b | 40.5 | 5.0 | |
| XVL 3 | 3630ª | 19.3 | 0.5 | |
| Mean | XVL | 1606A | 1529.4 | 109.9 |
| 8 | LPD 1 | 978ª | 23.9 | 2.5 |
| LPD 2 | 274c | 29.9 | 10.9 | |
| LPD 3 | 640b | 4.2 | 0.7 | |
| Mean | LPD | 630AB | 305.3 | 246.9 |
| 9 | IRM 2 | 1346ª | 16.3 | 1.2 |
| IRM 3 | 1144b | 45.5 | 4.0 | |
| IRM 5 | 161c | 2.53 | 1.6 | |
| Mean | IRM | 883.50AB | 549.7 | 71.8 |
| 10 | VHT 1 | 184c | 2.1 | 1.1 |
| VHT 2 | 308b | 6.2 | 2.0 | |
| VHT 4 | 885ª | 31.1 | 3.5 | |
| Mean | VHT | 459B | 324.2 | 81.5 |
| 11 | WSP 2 | 115c | 19.0 | 16.7 |
| WSP 4 | 570b | 10.9 | 1.9 | |
| WSP 5 | 875ª | 31.7 | 3.6 | |
| Mean | WSP | 520B | 331.9 | 73.6 |
| 12 | LSK 1 | 1127ª | 94.4 | 8.4 |
| LSK 3 | 408c | 46.8 | 11.5 | |
| LSK 5 | 455b | 5.7 | 1.3 | |
| Mean | LSK | 663.49AB | 352.4 | 60.6 |
| 13 | MQU 3 | 750b | 11.5 | 1.5 |
| MQU 4 | 171c | 3.8 | 3.2 | |
| MQU 5 | 2226a | 42.6 | 1.9 | |
| Mean | MQU | 1049AB | 917.9 | 101.0 |
Mean ± SD followed by lower/upper case letters in the columns indicate that there is no significant
The Fig. 1 show the Cluster dendrogram using the euclidian distance that made the cities clustering based on the average concentration of DON, that is to say, it has clustered cities in groups that have presented similar DON concentrations.
Fig. 1.
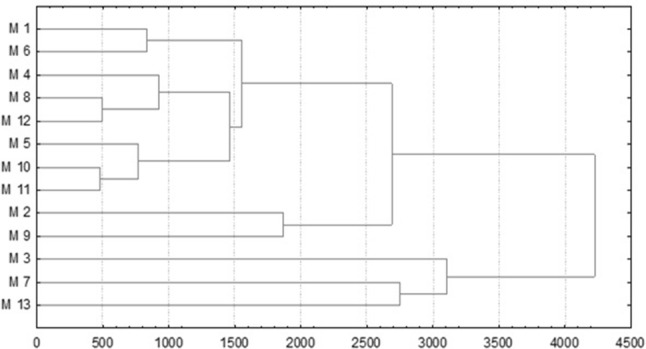
Cluster dendrogram using the Euclidian distance that made the cities (M1–M13) clustering based on DON mycotoxin
Three distinctive groups can be observed, being the first one comprised by cities 1, 6, 4, 8, 12, 5, 10 and 11 that presented an average of 499 µg kg−1. The second group comprised by cities 2 and 9, presented 915 µg kg−1 as average concentration and the third one comprised by cities 3, 7 and 13, presenting 1410 µg kg−1 as average. Therefore, when compared with the new MTL (RDC no 138/2017), 23.1% (n = 9) of the samples are would be above such level and sample XVL 3 (Table 2) would exceed around 4 times the MTL (1000 µg kg−1).
In the USA the MTL is 1000 µg kg−1 in finished wheat products such as flours, semolina and germs for human consumption (FDA, 2010). For the EU, the MTL for DON in unprocessed cereal crops (without any physical or thermal treatment) is 1250 µg kg−1, and in flours, semolina and germs it is 750 µg kg−1 (European Union, 2006). Thus, when the results of the present study are compared (Table 2) with these legislations from both the USA and EU, 23.1 (n = 9) and 38.5% (n = 15) of the samples would be out of MTL, respectively.
Various studies have been showing large contaminations by DON, particularly in Southern Brazil, that has the largest wheat output in the country.
Monitoring studies were carried out by Embrapa Trigo (Brazilian Agricultural Research Body—Wheat Branch) (2009–2012) and detected a mean concentration of DON as 1686 µg kg−1 in 81% of wheat grain samples from the Southern region (n = 545) (Tibola et al., 2013). Dos Santos et al. (2011) investigated wheat samples from Paraná state (n = 21) and Rio Grande do Sul state (n = 15) detecting the presence of DON in 72.2% of samples (n = 36) at levels ranging from 89 to 1592 µg kg−1. Valbring et al. (2014) evaluated DON contamination from wheat flour samples (n = 1391) produced in the west of Paraná state from 2012 and 2013 harvest seasons and found a mean of DON as 592 and 409 µg kg−1, respectively. Savi et al. (2016) analyzed 90 wheat-based samples sold in Southern Brazil and noted that 17% of bread samples (n = 30) and 10% of cream cracker biscuits (n = 30) presented DON contamination at average of 437 and 624 µg kg−1, respectively. Several studies show the presence of mycotoxins in wheat and its sub-products.
On the whole, the contamination by DON has been noticed in various countries. Rodrigues and Naehrer (2012) analysed samples (n = 7049) from various cereal crops and foodstuffs originated from South and North America, Europe, Asia, Middle-East and Africa, where 81% of the samples presented DON and ZON mycotoxins. DON average concentrations were 1000 µg kg−1 for South and North America, North and South Europe and North Asia, and 1534, 2251 and 5046 µg kg−1, respectively, for Central Europe, South-East Asia and Oceania. Cendoya et al. (2014) analyzed mycotoxins from 135 samples of standard wheat grain and 40 samples from Argentinean wheat grain Triticum durum, where 93% (n = 25) were contaminated with fumonisins and 96% (n = 24) were contaminated by DON, at 3211 µg kg−1 as average concentration. Liu et al. (2016) analyzed the presence of DON in wheat flour samples (n = 672) sold in China, where 91.5% were positive for it at concentrations ranging from 2.4 to 1130 µg kg−1. Kirincic et al. (2015) analyzed cereal crops and derived foodstuff samples from Slovenia, where 40% of cereal crops and derived foodstuff samples (n = 290) have been contaminated by at least one or more mycotoxins, and DON has been detected in 71% of the evaluated (wheat-based) samples. Rubert et al. (2011) found contamination by DON, AF (B2, G1 and G2), FB2, OTA and ZON in all analyzed wheat flour samples of the European Union. Quiles et al. (2016) analyzed the occurence of mycotoxins in samples of refrigerated pizza dough and risk assessment of exposure for the Spanish population. The mycotoxins detected in the analyzed samples were AFB1, AFB2, AFG1, ZON, enniatin A—ENA, enniatin A1—ENA1, enniatin—ENB, enniatin B1—ENB1 and beauvericin—BEA with average concentration of 4.09 mg kg−1, 0.50 mg kg−1, 0.79 mg kg−1, 77.78 mg kg−1, 14.96 mg kg−1, 4.54 mg kg−1, 3.37 mg kg−1, 1.69 mg kg−1 and 22.39 mg kg−1, respectively.
Studies have shown that excessive air humidity, as well as a large number of rainy and/or overcast days, as it normally occurs for much of the year in Southern Brazil, could provide a low light environment condition, which contributes to the occurrence of gibberella in wheat, since Fusarium graminearum is the general agent for the production of DON and it has optimum growth rate at temperatures around 25 °C and with water activity above 0.9 (Pasinato and Cunha, 2009).
Climate conditions in tropical countries, such as Brazil, with heavy rainfall and high temperatures, favor the spread of fungi responsible for the production of mycotoxins in crops during harvesting and post-crop, especially in crops and its derivatives. According to Embrapa (2015), the 2015 wheat harvest season were affected by climate conditions, as well as temperature fluctuations and excessive rainfall associated with the El Niño phenomenon.
The occurrence of DON in wheat flour is an issue of global concern and a relevant topic for regulatory agencies that establish their MTL as through them, crop production protection and food safety for end-consumers can be secured. This is quite possibly the first data survey study regarding the occurrence of DON in wheat flour in the North Region, Rio Grande do Sul state, Brazil, important as it is, aiming at reducing the risks to DON exposure for food safety. Mainly for the fact that DON inhibits protein synthesis and modulates the immune response, resulting in acute toxicity that includes symptoms such as vomiting, nausea and diarrhea in humans (Turner et al., 2012). The chronic exposure to DON is also related to growth impairment, as well as to immunotoxic and hematotoxic effects (Sirot et al., 2013).
ZON is only present on a single sample, representing 2.6% of samples. The concentration found was 26.7 µg kg−1 (City 7—XVL 3), within the MTL established by Brazilian legislation (Brazil, 2017), which is 100 µg kg−1 for ZON in wheat flours and also within the European Union’s (EU) current maximum level of 75 µg kg−1 (European Union, 2006). In the analyzed samples have not been detected the presence of AFB1, AFB2, AFG1 AFG2, DAS, HT-2 toxin, OTA, FB1 and FB2.
In this work, the occurrence of DON in wheat flour was relevant, since 23.1% of all samples presented concentrations above the MTL established by Brazilian legislation. The presence of ZON was detected only in one sample and within the limits of the current legislation. Mycotoxins AFB1, AFB2, AFG1, AFG2, DAS, HT-2 toxin, OTA, FB1 and FB2 were not detected in the analyzed samples. In this way, there is a need for effective controls in terms of temperature and relative humidity for wheat and/or wheat flour storage, aiming reduction of mycotoxin occurrence, securing the protection of crop production and food safety for end-consumers.
Acknowledgements
The authors thank to National Council for Scientific and Technological Development (CNPq), Coordination for the Improvement of Higher Education Personnel (CAPES) and Research Support Foundation of the Rio Grande do Sul state (FAPERGS).
Compliance with ethical standards
Conflict of interest
The authors declare no conflict of interest.
Footnotes
Publisher’s Note
Springer Nature remains neutral with regard to jurisdictional claims in published maps and institutional affiliations.
Contributor Information
Andressa Lanza, Email: andressa-lanza@saude.rs.gov.br.
Rosselei Caiél da Silva, Email: rosselei@uri.edu.br.
Ingrid Duarte dos Santos, Email: ingrid.duarte@ceparc.com.br.
Ionara Regina Pizzutti, Email: ionara.pizzuti@ceparc.com.br.
Karine Cence, Email: kahcence@hotmail.com.
Rogério Luis Cansian, Email: cansian@uricer.edu.br.
Jamile Zeni, Phone: (55)54.3520.9000, Email: jamilezeni@uricer.edu.br.
Eunice Valduga, Email: veunice@uricer.edu.br.
References
- Brazil. Resolution RDC No 7 of February 18th, 2011. Provides for maximum permissible limits—MTL for mycotoxins in food- RDC no 7 of February 18th, 2011. (DOU, 22/02/2011)
- Brazil. Resolution RDC no 138 of February 8th, 2017. Change the MTL for mycotoxins in food—RDC no 7, February 18th, 2011. (DOU, 09/02/2017)
- Cendoya E, Monge MP, Palacios SA, Chiacchiera SM, Torres AM, Farnochi MC, Ramirez ML. Fumonisin occurrence in naturally contaminated wheat grain harvested in Argentina. Food Control. 2014;37:56–61. doi: 10.1016/j.foodcont.2013.09.031. [DOI] [Google Scholar]
- Dos Santos JS, de Oliveira TM, Martins LM, Hashimoto EH, Bassoi MC, Pires JLF, Miranda MZ, Garcia S, Itano EN, Ono SEY, Kawamura O, Hirooka EY. Monitoring and level of deoxynivalenol intake by wheat. Semina. Ciênc. Agrár. 2011;32:1439–1450. doi: 10.5433/1679-0359.2011v32n4p1439. [DOI] [Google Scholar]
- Embrapa. Brazilian Agricultural Research Corporation. Impacts of extreme climatic variability on the 2015 wheat crop in southern Brazil (Passo Fundo). pp. 17 (2015)
- European Commission. Commission Regulation (EC) No 1881/2006 of 19 December 2006 setting maximum levels for certain contaminants in foodstuff. Off. J. EU L. 364: 99, 5–24 (2006)
- Ferraz MM, Farah A, Iamanaka BT, Perrone D, Copettium MV, Marques VX, Vitali AA, Taniwaki MH. Kinetics of ochratoxin destruction during coffee roasting. Food Control. 2010;21:872–877. doi: 10.1016/j.foodcont.2009.12.001. [DOI] [Google Scholar]
- Food and Drug Administration—FDA. Guidance for industry and FDA: advisory levels for deoxynivalenol (DON) in finished wheat products for human consumption and grains and grain by-products used for animal feed. (2010)
- Kirincic S, Skrjanc B, Kos N, Kozolc B. Mycotoxins in cereals and cereal products in Slovenia—official control of foods. Food Control. 2015;50:157–165. doi: 10.1016/j.foodcont.2014.08.034. [DOI] [Google Scholar]
- Lindblad M, Gidlund A, Sulyok M, Börjesson T, Krskab R, Olsen M, Fredlund E. Deoxynivalenol and other selected Fusarium toxins in Swedish wheat—occurrence and correlation to specific Fusarium species. Int. J. Food Microbiol. 2013;167:284–291. doi: 10.1016/j.ijfoodmicro.2013.07.002. [DOI] [PubMed] [Google Scholar]
- Liu Y, Lu Y, Wang L, Chang F, Yang L. Occurrence of deoxynivalenol in wheat, Hebei Province, China. Food Chem. 2016;197:1271–1274. doi: 10.1016/j.foodchem.2015.11.047. [DOI] [PubMed] [Google Scholar]
- Matsumoto M, Nishimura T. Mersenne twister: a 623-dimensionally equidistributed uniform pseudo-random number generator. ACM Trans. Model. Comput. Simul. 1998;8:3–30. doi: 10.1145/272991.272995. [DOI] [Google Scholar]
- Pasinato A, da Cunha GR. Meteorological conditions information for Passo Fundo, RS: September 2009. Passo Fundo: Embrapa Wheat. 5 p. (Embrapa Wheat, Technical Communiqué online, 266). Available in: http://www.cnpt.embrapa.br/biblio/co/p_co266.htm. (2009). Accessed 5 April 2016
- Prückler M, Siebenhandl-ehn S, Apprich S, Holtinger S, Haas C, Schmid E, Kneifel W. Wheat bran-based biorefinery 1: composition of wheat bran and strategies of functionalization. Food Sci. Technol. 2014;56:211–221. [Google Scholar]
- Quiles JM, Saladino F, Mañes J, Fernández-Franzón M, Meca G. Occurrence of mycotoxins in refrigerated pizza dough and risk assessment of exposure for the Spanish population. Food Chem. Toxicol. 2016;94:19–24. doi: 10.1016/j.fct.2016.05.011. [DOI] [PubMed] [Google Scholar]
- Rodrigues I, Naehrer K. A three-year survey on the worldwide occurrence of mycotoxins in feedstuffs and feed. Toxin. (Basel) 2012;4:663–675. doi: 10.3390/toxins4090663. [DOI] [PMC free article] [PubMed] [Google Scholar]
- Rubert J, Soler C, Mañes J. Evaluation of matrix solid-phase dispersion (MSPD) extraction for multi-mycotoxin determination in different flours using LC–MS/MS. Talanta. 2011;85:206–215. doi: 10.1016/j.talanta.2011.03.046. [DOI] [PubMed] [Google Scholar]
- Savi GD, Piacentini KC, Tibola CS, Santos K, Maria GS, Scussel VM. Deoxynivalenol in the wheat milling process and wheat-based products and daily intake estimates for the Southern Brazilian population. Food Control. 2016;62:231–236. doi: 10.1016/j.foodcont.2015.10.029. [DOI] [Google Scholar]
- Scheuer PM, Francisco A, de Miranda MZ, de Limberger VM. Wheat: characteristics and use in bakery. Rev. Bras. Technol. Agroind. 2011;13:211–222. [Google Scholar]
- Sirot V, Fremy JM, Leblanc JC. Dietary exposure to mycotoxins and health risk assessment in the second French total diet study. Food Chem. Toxicol. 2013;52:1–11. doi: 10.1016/j.fct.2012.10.036. [DOI] [PubMed] [Google Scholar]
- Soleimany F, Jinap S, Faridah A, Khatib A. A UPLC–MS/MS for simultaneous determination of aflatoxins, ochratoxin A, zearalenone, DON, fumonisins, T-2 toxin and HT-2 toxin, in cereals. Food Control. 2012;25:647–653. doi: 10.1016/j.foodcont.2011.11.012. [DOI] [Google Scholar]
- Souza DM. Micotoxinas em matrizes de milho e trigo: validação de método analítico por UPLC–MS/MS e monitoramento em diferentes pontos da cadeia produtiva e commercial. Santa Maria: UFSM; 2014. [Google Scholar]
- Tibola CS, Fernandes JMC, Del Ponte EM, Mallmann CA, Dilkin P, Lima MIPM, Pavan W. Technical indications to minimize contamination of wheat by mycotoxins. Research and Development Bulletin, Passo Fundo, RS: Embrapa Wheat. pp. 15–21 (2013)
- Turner PC, Flannery B, Isitt C, Ali M, Pestka J. The role of biomarkers in evaluating human health concerns from fungal contaminants in food. Nutr. Res. Rev. 2012;25:162–179. doi: 10.1017/S095442241200008X. [DOI] [PubMed] [Google Scholar]
- Valbring L, Reichert AM, Souza JGL, Sonsin PA. Concentração de Deoxinivalenol em Farinhas de Trigo. pp. 477–478. In: Proceedings of the XII Latin American Congress on Food Microbiology and Hygiene [= Blucher Food Science Proceedings, v.1, n.1]. Blucher, São Paulo. (2014). ISSN 2359-201X. 10.5151/foodsci-microal-051