

Abstract
The present study compared liquid sourdough technology with baker’s yeast leavening when applied to the production of a semolina-based crispy flatbread. Following in vitro starch digestion, the results revealed the sourdough leavened flatbread to contain a lower percentage of rapidly digestible starch (16%), higher amounts of slowly digestible starch (27%) and inaccessible digestible starch (4.1%) compared with the baker’s yeast leavened flatbread (20, 20, and 2.4%, respectively), making the former nutritionally healthier. The sourdough leavened bread was crispier, stiffer and more solid, as shown by texture analyses, although Raman spectroscopy revealed no differences in the crystallinity status of starch. The descriptive analyses show that the use of sourdough enhances the positive sensory traits, as rated by the consumer panel scores (6.08 vs. 5.56). In summary, the results indicate that the implementation of sourdough technology in the production of flat crispy breads could confer economic advantages to this product.
Electronic supplementary material
The online version of this article (10.1007/s10068-018-0530-y) contains supplementary material, which is available to authorized users.
Keywords: Flatbread, Resistant starch, Semolina, In vitro digestion, Sensory analyses
Introduction
Consumer awareness about the implications of healthy food choices has fueled the food industry to address the demand for foods conferring health benefits that go beyond basic nutritional requirements. As a result, the bakery and pastry market has started to adopt strategies based on the health and/or nutritional claims of specific ingredients (Sirbu and Arghire, 2017). To this regard, researchers have addressed the possibility of enriching breads with functional ingredients in order to enhance their health properties. Sourdough technology is the most ancient technology used to leaven bread, and its use has beneficial effects in terms of sensory quality, nutritional value, digestibility, and the shelf life of the breads obtained in this mode (Chavan and Chavan, 2011). In particular, the use of sourdough as a leavening technology, rather than baker’s yeast, can play a key role in reducing the glycemic index (GI); even in white bread (De Angelis et al., 2007, De Angelis et al., 2009; Scazzina et al., 2009) and gluten-free bread (Novotni et al., 2012). The GI provides a relative ranking of a food’s carbohydrate content, according to how the constituent carbohydrates affect blood glucose concentration (Fardet, 2016). The mechanism by which sourdough reduces the GI is not entirely clear, and different hypotheses have been put forward. Some authors have attributed the effect to organic acids produced by lactic acid bacteria (LAB) present in the sourdough that may slow gastric emptying (Scazzina et al., 2009) and/or cause a reduction in starch bioavailability (Östman et al., 2002). Starch is the main component of semolina and the primary source of carbohydrate in the human diet. From a nutritional point of view, starch can be divided into three fractions: rapidly digestible starch (RDS), slowly digestible starch (SDS), and resistant starch (RS). More in deep, the starch fraction which is resistant to enzymatic digestion because of food structure, is called inaccessible digestible starch (IDS) (Mishra and Monro, 2009; Mishra and Monro, 2012). Then, the sum of RDS, SDS, and IDS indicate the total potentially digestible starch. These fractions can be quantified using in vitro gastro-intestinal digestion and the spectrophotometric measurement of the amount of glucose released at set times (Woolnough et al., 2008). RDS is the fraction of starch digested during the first 20 min of in vitro digestion; SDS is the fraction of starch digested in the time interval between 20 and 120 min; RS is “the sum of the starch and starch-degradation products that, on average, reaches the human large intestine” (Englyst and Hudson, 1996); IDS is defined as digestible starch released by tissue disruption at 120 min digestion (Mishra and Monro, 2009). The rise in blood glucose concentration during the first 120 min following food ingestion is the so-called “glycemic response”, which depends on: 1) how much starch has been digested and converted to glucose within the timeframe; and 2) the rate of glucose absorption in the intestine (Borczak et al., 2011). According to Lehmann and Robin (2007), the consumption of foods containing a high amount of SDS generates a lower post-prandial glucose level. Postprandial glucose, together with related hyperinsulinemia and lipidemia, has been implicated in the development of chronic metabolic diseases, including obesity, type 2 diabetes mellitus (T2DM), and cardiovascular disease (Blaak et al., 2012). For this reason, the European Commission now requires that a foodstuff with a high SDS content has this declared on its packaging and that its positive effect on health is also indicated (EU Regulation 851/2013).
“Carasau” is a traditional and widely commercialized crispy semolina-based flatbread produced in Italy (Fig. 1). It is characterized by its sheet thickness of about 1 mm and very low moisture content and aw values (about 8% and 0.45, respectively), which guarantee an extended shelf life and marketability (Fois et al., 2011). “Carasau” technology resembles that employed in the making of Finnish rye crisp bread “Hapankorppuja” (Qarooni, 1996), except that the latter is leavened with sourdough, while the former is nowadays produced using baker’s yeasts at the industrial level, despite the fact that the use of sourdough holds the potential to confer a number of advantages.
Fig. 1.
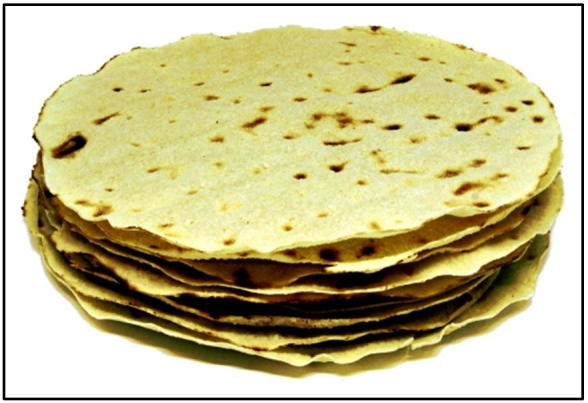
Sheets of “Carasau” bread, a semolina based crispy flatbread produced in Italy
The aim of this paper was to study the effects of sourdough on the functional and sensory properties of this crispy flatbread. No data are present in the literature regarding the use of sourdough to leaven crispy flatbreads and the related changes produced in their physico-chemical and sensory properties or their digestibility. Two different carasau formulations were analyzed: one was made using baker’s yeasts (BY), and the other was produced using liquid sourdough (LS). The breads’ functional aspects were investigated by means of an in vitro starch digestibility test. Texture analyses were carried out to assess structural differences between samples and Raman spectroscopy was used to investigate the physical status of starch. Finally, the impact that sourdough had on the bread’s sensory properties and on consumer acceptance was assessed using descriptive sensory evaluations and an acceptability test, respectively.
Materials and methods
Physico-chemical analyses of semolina and bread
Organic durum wheat semolina was purchased from the Casillo Group mill (Corato, Italy). Moisture and ash content were determined (at 105 °C and 600 °C, respectively) using a Thermal Gravimetric Method using a TGA instrument (Thermostep, Eltra, Germany). Protein content (Nx5.27) was determined by the Dumas method using a Rapid N Cube analyzer (Elementar Analysensysteme GmbH, Langenselbold, Germany). pH, gluten index, and dry gluten were determined according to the AACC 02-52 and 38-12A methods (AACC, 2000). Alveograph assessments were performed on semolina according to the AACC 54-30A (AACC, 2000), adapted to durum wheat (Dubois et al., 2008). The qualitative characteristics of the two batches of organic semolina used in the experimental tests are given in Table 1. Titratable acidity (TTA) was determined using 10 g of sourdough or bread (the latter was grated and sifted through a 20-mesh sieve) in 100 ml of distilled water. After 1 h stirring, the sample was titrated to pH 8.5 with NaOH N/10 using an automatic titrator (Crison Instruments, Carpi, Italy).
Table 1.
Physicochemical characteristics of semolina flour
| Batch 1 | Batch 2 | |
|---|---|---|
| Moisture (%) | 12.20 (± 0.03) | 13.00 (± 0.02) |
| Ash (% d.b.b) | 0.76 (± 0.01) | 0.76 (± 0.02) |
| pH | 6.60 (± 0.00) | 6.70 (± 0.01) |
| TTA (ml NaOH N/10) | 3.20 (± 0.05) | 2.70 (± 0.08) |
| Protein (% d.b.) | 12.00 (± 0.06) | 10.60 (± 0.20) |
| GI (% d.b.) | 74.00 (± 2.04) | 69.00 (± 0.18) |
| Dry gluten (14% w.b.a) | 8.4 (± 0.07) | 8.10 (± 0.15) |
| Alveographic indexes | ||
| W (J × 10−4) | 122 | 103 |
| P/L | 1.0 | 2.8 |
Data are the mean values from three repetitions (± SD)
aWet basis
bDry basis
Liquid sourdough preparation and maintenance
The sourdough starter was prepared according to Fois et al. (2018). Sourdough refreshment was carried out every 24 h using a Fermentolevain FL80 bioreactor (Esmach, Grisignano di Zocco, Italy) by mixing sourdough, semolina and water in a 1:1:1 ratio (dough yield 200). Fermentation was carried out at 26 °C for 3 h. pH and TTA were measured, then the sourdough was cooled to 5 °C. The sourdough was refreshed twice before baking.
The viabilities of LAB and yeasts in the sourdough were checked after each refreshment: 10 g samples were mixed with 90 ml physiological solution, then homogenized for 2 min in a Bagmixer 400 lab homogenizer (Interscience, St Nom la Bretèche, France). Serial dilutions were plated on MRS agar for LAB counts then incubated at 30 °C for 48 h in anaerobiosis using the Anaerogen and Anaerojar System (Oxoid, Rodano, Italy), and on YPD (1% yeast extract, 1% peptone, 2% glucose, pH 5.5) for yeasts counts, then incubated at 28 °C for 48 h. All culture media and reagents were purchased from Oxoid (Rodano, Italy).
Bread-making
Three bread making trials were carried out in an industrial bakery using organic semolina (Casillo Group, Corato, Italy). Two were run using semolina coming from the same batch. For each trial, two different doughs were prepared in a fork kneader: one composing 35% (semolina weight basis) liquid sourdough (LS); and the other containing 1.5% compressed baker’s yeast (BY). For each dough, 25 kg of semolina, sea salt (1.5% w/w) and water (35% w/w) were kneaded in a fork mixer for 30 min. In order for the two doughs to have the same moisture content, the sourdough water content was taken into account in LS bread dough formulation. The initial proofing, conducted in a fermentation chamber (28 °C and 72% relative humidity), lasted 180 min for LS dough and 30 min for BY dough. At the end of the first proofing, the doughs were passed through a mechanical dough sheeter, with a gap of 2 mm, and then shaped into disks of 22 cm in diameter. Dough disks were conveyed onto a conveyor belt within the fermentation chamber where they remained for 1 h. At the end of the second proofing, the dough disks came out of the cells and were conveyed to the electrical tunnel oven for their first baking at 500 °C for 5 s. During this first baking, the bread puffs up due to the rapid vaporization of the moisture such that the original sheet effectively becomes a bi-layer. The two layers of the puffed bread were then manually separated and toasted at 400 °C for 5 s, then cooled at room temperature. The lower pH (4.74 ± 0.22) and higher TTA value (10.2 ± 0.17) of LS bread compared with BY bread (6.15 ± 0.16 and 4.5 ± 0.37) account for the acidifying activity of sourdough. Moisture content was comparable between samples (9% and 8% for LS and BY, respectively).
In vitro starch digestion
Starch digestion was carried out as outlined by Danza et al. (2014), based on the method proposed by Chillo et al. (2011). Five grams of bread, previously minced and passed through a 20-mesh sieve, were added to 50 ml distilled water and 5 ml maleate buffer (0.2 mol/l, pH 6.0, with 0.15 g CaCl2 and 0.1 g sodium azide per liter) in a digestion vessel and incubated using a Innova 40 incubator shaker (Eppendorf, Milan, Italy) at 37 °C for 15 min. Amyloglucosidase (0.1 ml; A 7095) (Sigma Aldrich, Milan, Italy) and pancreatin (1 ml of 2 g pancreatin/100 g maleate buffer; P 7545) (Sigma Aldrich, Milan, Italy) were added in quick succession to the sample to start the digestion. Vessels were incubated at 37 °C and constantly stirred at 150 rpm until the end of analysis. After 0, 20, and 120 min of digestion, 0.5 ml samples were removed and the glucose content analyzed by UV–vis spectrophotometry (as mentioned below). After 120 min, samples were homogenized for 20 s using an Ultra-Turrax T25 digital Homogenizer (Ika, Königswinter, Germany) and digested for a further 60 min; samples were therefore subjected to a total of 180 min digestion from the time of pancreatin addition. The final 0.5 ml aliquot was then removed and the glucose content again analyzed.
Analysis of the digestate
The removed samples (0.5 ml) were pipetted into 15 ml test tubes containing 2.0 ml ethanol, vortexed for 5 s, incubated at 20 °C for 1 h, then centrifuged in a Avanti J-26 XP centrifuge (Beckman-Coulter, Indianapolis, USA) at 2000×g for 2 min. The supernatant (0.05 ml) was removed and pipetted into 15 ml test tubes containing 0.250 ml amyloglucosidase (Megazyme International Ltd, Bray, Ireland)1 ml/100 ml sodium acetate buffer (0.1 mol/l, pH 5.2) for secondary digestion (10 min at 20 °C). DNS reagent (0.750 ml) was then added and the samples heated in boiling water for 15 min, then immediately cooled in cold water (15 °C) for 1 h. After 1 h, 4 ml of cold water (15 °C) were added to each sample, which was mixed and the reducing sugar concentration measured colorimetrically using a UV–vis spectrophotometer; absorbance was read at 530 nm. Three digestion vessels per treatment were measured at each sampling time (0, 20, 120, and 180 min). Glucose standards of 10.0 mg/ml were used. The results were plotted as released glucose per gram of sample for each time point.
Texture analyses
A TA-XT plus Texture Analyser (Stable Micro Systems, Godalming, UK) with a 5 kg plugged load cell was used for force/displacement measurements (Salvador et al., 2009); a P/0.25s ¼” spherical stainless steel probe and a HDP/90 heavy duty platform equipped with a perforated plate were used. The bread sample was placed in the center of the perforated platform where the probe penetrated the sample until rupture. The texture analyser automatically recorded the data and texture parameters were computed from the force/displacement curve, which give information about the crispiness, stiffness, and solidity of the material analyzed.
The test settings were: test speed 1 mm/s, distance 10 mm, trigger force 0.05 N, and threshold force 0.07 N. Exponent software (ver. 6.1.3.0) was used for acquiring and processing texture data.
Raman spectroscopy
Minced and 20-mesh sieved bread was analyzed by Raman spectroscopy to investigate the crystallinity status of the starch content. Raman measurements were performed using a Bruker RAM II FT-Raman module coupled to a Bruker vertex 70v interferometer (Bruker corporation, Billerica, USA). The laser excitation wavelength was 1064 nm and spectra were acquired by averaging 512 interferograms at a resolution of 4 cm−1 in the range 250–3500 cm−1. A spectral range of 460–510 cm−1 was chosen to detect the position of the band that peaked at ~ 480 cm−1 using the procedure developed by Piccinini et al. (2012). OPUS v6 software was used to acquire and process data.
Sensory analyses
Sensory analyses were performed by Descriptive Analysis (Lawless and Heymann, 2010) using 14 trained assessors (International Organization for Standardization, ISO 8585-1, 1994; ISO 8585-2, 1994; ISO 13299, 2016): 7 men and 7 women, aged between 30 and 55 years. Assessors used reference standards in order to be able to gauge different intensities of bread attributes. Sensory attributes, sensory definitions, and reference standards are reported as supplementary material. The two samples were presented to the assessors in a randomized and balanced order (Macfie et al., 1989) and evaluated three times (replicates), corresponding to the three different baking tests. Each replicate was evaluated twice, in two assessment sessions held on the same day (repetitions). To evaluate each descriptor, a score scale was used, in which 0 was the minimum and 9 the maximum. Reference standards were made available for each sensory attribute. For some attributes, a minimum intensity standard was also indicated. Panel assessors always performed the sensory evaluation at the same time of the day and in pre-prandial conditions.
A hedonic test was performed in order to verify consumer acceptability of the products. Eighty consumers were asked to express their overall acceptability, over a 9 point unstructured scale, for two sets of bread samples (LS and BY).
Statistical analyses
To establish the presence of statistical differences between the samples, data were analyzed by analysis of variance (ANOVA) and LSD tests (p < 0.05) using the Statgraphics Centurion software package (version 16.1.11, StatPoint Technologies Inc.). The hedonic scores collected from the consumer test were examined using ANOVA, with consumers (random effect) and products as the main effects. Sensory panel performances in terms of assessor’s repeatability and sample discrimination ability were monitored using the software Panel Check (Nofima Mat, Ås, Norway), according to Tomic et al. (2007).
Results and discussion
Sourdough properties
The microbial counts, carried out on the sourdough at refrigeration temperature, showed the number of LAB to range from 1 × 10⁶ to 5 × 10⁷ cfu/g and the number of yeasts to range from 1 × 10⁷ to 5 × 10⁷ cfu/g; the yeast to bacteria ratio varied from 1:1 to 1:10. The literature on sourdough typically report a prevalence of LAB over yeasts (Minervini et al., 2012; Scheirlinck et al., 2007), but refreshment under aerated conditions, also known as back slopping, as performed here using the bioreactor, promotes yeast development, as reported by Savolainen et al. (2014), accounting for the ratios observed. The mean sourdough pH, measured after 3 h of fermentation in all the bread making trials, was 4.40 ± 0.09.
In vitro starch digestibility and nutritional aspects
The amount of glucose released during in vitro starch digestion, expressed as a percentage for 100 g dry bread, was measured after 20 min (T20), 120 min (T120), and 180 min (T180) fermentation. The zero time value (T0) corresponds to the sugars (mono- and oligo-saccharides) initially present in the samples. These sugars are defined as “free sugar glucose” (FSG). The FSG percentage differed between the two types of bread, being 11.4 ± 0.5% in BY and 9.9 ± 0.7% in LS. A difference was expected, since the total number of microbial cells inoculated into LS bread was far higher than into BY bread. The quantity of sourdough (30% w/w) added to the LS dough was based on achieving a final concentration of 106 cfu/g LAB and 107 cfu/g yeast, whereas yeast was the only microbial group inoculated into BY dough (109 cfu/g in the inoculum, in order to achieve a final concentration of 107 cfu/g of dough). These data are in line with other studies (Maioli et al., 2008).
The amount of glucose released after 20 min of in vitro digestion was different in the two bread types: in BY bread, the mean percentage of glucose released after 20 min was 33.4 ± 1.6%, whereas in LS it reached 27.7 ± 1.9%. This result has important implications from a nutritional point of view. The amount of glucose released within 20 min of food ingestion is defined as “rapidly available glucose” (RAG) (Englyst et al., 1999); it is the sum of FSG plus the glucose released in the first 20 min of digestion (RDS). Differences in RAG between different foods are able to explain most of the variability in their glycemic responses (Englyst et al., 1999). In the model used by the Englyst et al. (1999), the glycemic response is proportional to the RAG value, according to the following formula: glycemic response = KRAG; where K is a constant that varies between individuals. In our case, the RAG value of BY was significantly higher than that of LS, and these data highlight how the leavening technology applied can alter the nutritional characteristics of the carbohydrates naturally contained in a food.
No significant difference in the level of released glucose was measured between the two bread types at T120 (55.6 ± 1.6% and 57.3 ± 1.0% for LS and BY bread, respectively; p ≥ 0.05); but a difference was again observed at T180, being 61.9 ± 0.9% in LS bread and 58.3 ± 1.2% in BY bread.
Figure 2 shows the different starch fractions in LS and BY bread. LS samples have a lower percentage of RDS (16.6 ± 1.8%), and a higher percentage of SDS (27.4 ± 1.7%) than BY bread samples (19.8 ± 1.3% and 20.0 ± 0.67%, respectively). During in vivo digestion, these two starch fractions are both digested in the small intestine, but the SDS fraction is digested more slowly than RDS (Englyst et al., 1999). Usually the starch that is not digested within the first 120 min is referred to as resistant starch (RS). RS is recognized to be healthy because it is not absorbed in the small intestine and passes into the colon where is becomes a substrate for probiotic bacteria. In this study, following 120 min of in vitro digestion, bread samples were homogenized using an Ultra-Turrax in order to obtain complete tissue disruption, in accordance with Danza et al. (2014). The starch digested in the time frame between 120 and 180 min can thus be more properly named “inaccessible digestible starch” (IDS), since it is not actually digestion-resistant starch, but just physically inaccessible to the digestive enzymes and thus cannot be digested; here it was made accessible by homogenization. Therefore it is a “potentially digestible starch” (Mishra and Monro, 2009; Mishra and Monro, 2012), and the sum of RDS, SDS, and IDS here represent the total potentially available starch. LS bread was found to contain nearly twice as much IDS than BY bread (4.1 ± 0.9 vs. 2.4 ± 0.5%, respectively). Östman et al. (2002) reported that the organic acids in sourdough promote the formation of starch-gluten interactions, which make the starch less vulnerable to the digestive amylolytic enzymes, thus reducing its bioavailability and postprandial glucose response. Siljeström et al. (1988) showed that starch from sourdough leavened bread is less susceptible to α-amylase compared with starch from baker’s yeast leavened bread. On the other hand, when samples were pre-treated with pepsin, prior to α-amylase digestion, α-amylase activity was comparable between sourdough and baker’s yeast leavened breads; the authors suggested that a protein matrix in sourdough bread forms a barrier preventing α-amylase activity. They also proposed that this effect is probably of no consequence with regard to in vivo digestibility.
Fig. 2.
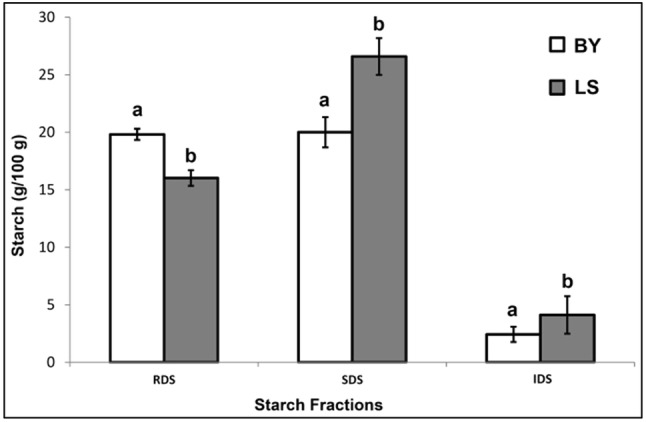
Percentage (g/100 g) of RDS, SDS, and IDS fractions in LS and BY bread samples. Data are mean values (n = 3) on a dry basis. Standard errors are shown as vertical bars
The amount of SDS in “carasau” bread meets the conditions listed in the Commission Regulation (EU) No 851/2013 that authorizes the use of the following health claim on a food product’s label: “Consumption of products high in slowly digestible starch (SDS) raises blood glucose concentration less after a meal compared with products low in SDS”. The Regulation requires that the following three conditions are met: (1) digestive carbohydrates must provide at least 60% of the total energy of the food; (2) 55% of such carbohydrates must be digestible starch, defined by the acronym TDS (total digested starch, equal to the sum of RDS + SDS); (3) the amount of SDS must be at least 40% of total digestible starch. “Carasau” bread satisfies all of these conditions. Any technological intervention, such as sourdough leavening, that implies a enhancement of the SDS fraction is advisable given the health benefits derived from the consumption of foods richer in this starch fraction.
Texture analyses
Representative force–displacement curves for BY and LS samples are shown in Fig. 3.The jagged appearance of the trace is typical of crispy foods, and indicates the occurrence of several fracture events before breaking (Chen et al., 2005; Varela et al., 2006; Vincent, 1998). The curve can be divided into two clearly distinguishable regions. In the first region (R1, Fig. 3), from starting point to the first significant structural breakdown (first peak), the probe mainly deformed the sample, with a nearly linear increase in force over time. The second region (R2, Fig. 3) started with the first significant structural breakdown and ends with a maximum force peak before a force drop. This second region is characterized by the increasing force (gradient) and a variable number of fracture events. The parameters extracted from this curve are: (1) the break force, defined as the “maximum peak force” applied before breakdown; (2) the gradient, defined as the “slope” of the curve from starting point to sample breakdown, which relates to the product’s “stiffness”; (3) the number of force peaks after the first significant fracture event, which relates to sensory “crispness” (Chen et al., 2005; Varela et al., 2006); and (4) the area under the displacement curve, from the first significant peak to the maximum force, which is related to the work involved in sample deformation (Salvador et al., 2009), from the start of sample breaking to final breakdown. The parameters obtained are shown in Table 2. LS and BY bread samples showed no differences in the “breaking force” parameter, whereas significant differences were found in the other textural parameters. A steeper gradient was obtained for LS samples, which were “stiffer” than BY bread samples. A Higher number of force peaks were also recorded in LS samples, which can thus be interpreted as being more “crisp” than BY bread samples. A larger amount of work was necessary to break LS samples compared with BY samples. Taken together, these texture analysis results show that LS bread appears to be stiffer, crispier and more solid than BY bread. These findings were further confirmed by the results of descriptive sensory analyses, as reported below.
Fig. 3.
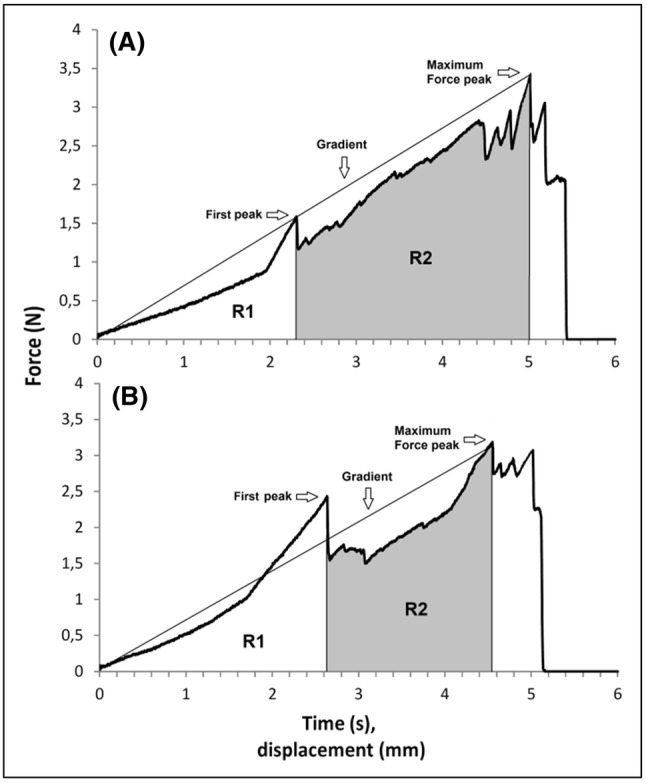
Representative force–displacement curves. a LS bread; b BY bread
Table 2.
Instrumental texture parameters of LS and BY bread samples; data are the mean values from three repetitions
| Sample | Break force (N) | Gradient (N/s) | Number of Force Peaks | Area (R2) |
|---|---|---|---|---|
| BY | 4.91 ± 1.57n.s. | 1.41 ± 0.61a | 3.24 ± 0.81a | 364 ± 32.50a |
| LS | 4.91 ± 1.40n.s. | 2.67 ± 0.68b | 4.48 ± 1.72b | 559 ± 68.43b |
Letters denote the presence of a significant difference (p < 0.05) among samples within a row
BY baker’s yeast bread, LS liquid sourdough bread, n.s. non significant
Raman spectroscopy and type 3 of resistant starch data
A FT Raman spectrum of a semolina-based bread was previously reported by Piccinini et al. (2012), who found that the position of the peak at ~ 480 cm−1 (Raman shift, cm−1) provides information about the crystallinity status of starch. They show that the Raman frequency of the selected band shifts toward higher values after gelatinization (i.e., after baking) and back toward lower values during storage, when retrogradation occurs, indicating the formation of type 3 resistant starch (RS3), i.e. retrograded starch. We recorded the Raman spectra at T0, before the start of retrogradation. No data have been published on the retrogradation of a toasted bread, but a report does exist on the retrogradation phenomenon occurring in the crust of bread (Primo-Martín et al., 2007), which is very low in moisture and effectively toasted, like carasau; the authors observed that retrogradation only commenced after 2 days of storage. Our data show no differences between the BY and LS bread samples (480.89 ± 0.30 and 481.18 ± 0.23 cm−1, Raman shift for BY and LS bread, respectively), indicating that the addition of sourdough did not affect the physical status of starch in this toasted bread assessed just after baking.
Sensory analyses
The results of the sensory analyses are reported in Table 3. Considering the appearance attributes, we can see that the choice of leavening technology used does not affect the “color” descriptor, while it does significantly affect other characteristics. Indeed, LS bread samples showed a higher “resistance to mushing”, which relates to the ability of the samples to keep their structure (evaluated visually) after being held in water; a result of the more “solid” structure” of LS carasau. LS bread also had more extended “roasted areas” after cooking. In this respect, sourdough apparently favors reactions that lead to brown compound formation. It is unlikely that this result is linked to the Maillard reaction, since the lower pH of LS samples should have slowed Maillard reactions down; this is because the amino groups of amino acids are largely protonated at low pH, thus the amount of free amino compound available for participation in the Maillard reaction should be less (Kroh, 1994). The brown areas are more probably related to reactions occurring at higher temperatures, such as caramelization (favored at temperatures > 120 °C and low aW values). Caramelization can be catalyzed under acidic or alkaline conditions (Namiki, 1988). Furthermore, in samples leavened with sourdough, the activity of flour proteases, favored at low pH, leads to the degradation of gluten, and consequently a reduction in the elasticity and firmness of bread dough (Clarke et al., 2004; Thiele et al., 2004). As a result, larger areas of less thick bread can form in LS samples, which then dehydrate and brown quicker, as a consequence of vapor expansion during the cooking phase.
Table 3.
Sensory attributes of LS and BY bread samples
| Attiributes | BY | LS | |
|---|---|---|---|
| Appearance | |||
| Color (main hue intensity) | 2.97 ± 0.12n.s. | 2.84 ± 0.08n.s | |
| Resistance to mushing | 3.30 ± 0.56a | 5.62 ± 0.13b | |
| Roasted areas | 3.05 ± 0.09a | 4.13 ± 0.47b | |
| Odor | |||
| Semolina | 4.00 ± 0.60b | 3.10 ± 0.27a | |
| Baker’s Yeast | 3.31 ± 0.37b | 1.26 ± 0.10a | |
| Sourdough | 1.41 ± 0.30a | 5.30 ± 0.42b | |
| Pop Corn | 3.98 ± 0.34a | 3.37 ± 0.47a | |
| Toasted | 3.34 ± 0.25a | 4.50 ± 0.17b | |
| Cereals | 3.08 ± 0.30n.s. | 2.92 ± 0.04n..s. | |
| Tactile | |||
| Mouth | |||
| Chewiness | 4.05 ± 0.15a | 5.87 ± 0.58b | |
| Hardness | 3.76 ± 0.05a | 5.85 ± 0.56b | |
| Crispness | 6.58 ± 0.08a | 7.61 ± 0.02b | |
| Adhesiveness | 5.22 ± 0.45a | 4.43 ± 0.15a | |
| Ease of dissolution | 5.18 ± 0.03b | 6.72 ± 0.10a | |
| Crystalline | 2.20 ± 0.35a | 4.53 ± 0.67b | |
| By hand | |||
| Roughness | 2.99 ± 0.38a | 3.65 ± 0.19b | |
| Resistance to cracking | 4.18 ± 1.16n.s. | 5.11 ± 0.53n.s. | |
| Taste | |||
| Sourness | 0.96 ± 0.04a | 6.65 ± 0.28b | |
| Bitterness | 1.49 ± 0.07a | 2.61 ± 0.34b | |
| Sweetness | 3.33 ± 0.22b | 1.92 ± 0.25a | |
| Umami | 3.94 ± 0.21a | 5.60 ± 0.35b | |
| Saltiness | 3.00 ± 0.01n.s. | 2.87 ± 0.12n.s. | |
| Consumer acceptability | |||
| Taste score | 5.31 ± 1.09a | 6.14 ± 0.9b | |
| Texture score | 5.46 ± 1,21a | 5.89 ± 0.92b | |
| Acceptability score | 5.56 ± 1.06a | 6.08 ± 0.79b | |
Data are the mean values plus standard deviations (SD) obtained from three distinct evaluations (3 replicates) repeated twice (2 repetitions) by 14 assessors; Letters denote the presence of a significant difference (p < 0.05) among samples within a row; n.s. non significant
Of the olfactory attributes, “sourdough” and “baker’s yeast” are closely related to the type of leavening technology used and, as expected, the results are significantly different for the two breads. It must be pointed out that the greater olfactory complexity of bread produced with the use of sourdough tends to mask the presence of odors, such as “semolina”, coming from the raw materials. The odor “toasted” stands out the most in LS breads, and accounts for the more extensive roasted areas in LS bread, since browning reactions at high temperatures give rise to specific volatile compounds (Kroh, 1994) associated with the “toasted” odor.
The tactile descriptor intensities were also affected by the leavening technology employed. LS bread samples generated higher values for “chew count”, “hardness”, “crispiness”, and “crystalline” and lower values for “ease of dissolution” compared with BY bread samples. The use of the sourdough endowed this crispy bread with a more “solid” and “crystalline” structure, so much so that it became more “resistant to cracking” by hand. This was probably related to a larger amount of retrograded starch as seen in the LS samples. It also endowed LS samples with a more “rough” surface. Moreover, the presence of lactic acid arising from LAB metabolism and the consequent drop in pH may have favored interactions between the starch and gluten during heat treatment (Östman et al., 2002; Siljeström et al., 1988) that could have contributed to the structural differences observed. Breads produced using baker’s yeast have a higher “adhesiveness”, i.e., a greater tendency to stick to the teeth during chewing.
As far as the taste attributes are concerned, with the exception of the descriptor “salty”, all were influenced by the type of leavening technology employed. LS bread was rated less sweet, more sour, and more bitter. BY was rated as having a less marked umami taste. The greater perception of sweetness in BY bread is justified by its higher content of simple sugars compared with LS, as evidenced by the in vitro analysis of bread digestibility. The absence of an acidic taste in BY bread also favors the perception of “sweetness”. The assessment made by the panel lead to the conclusion that the sensory characteristics of carasau bread are strongly influenced by the type of leavening technology used.
The results of the consumer acceptability assessment are also reported in Table 3. The consumers awarded higher “taste”, “texture”, and “acceptability” scores to LS samples. Overall, the results of the sensory tests show that the use of sourdough improved the overall consumer acceptability rating for this crispy flatbread by enhancing the product’s textural and sensory characteristics; a result that has also been reported for other types of bread (Charmaine and Arendt, 2005; Chavan and Chavan, 2011; De Vuyst and Neysens, 2005).
In summary, we can conclude that the leavening technology employed significantly affects starch digestibility in “carasau” crispy flatbread. The use of liquid sourdough causes a reduction in the RDS content and a concomitant increase in SDS; thus the consumption of Carasau bread produced using sourdough under the conditions proposed is likely to generate a lower post-prandial glycemic response compared with Carasau bread produced using with baker’s yeast only. The LS carasau bread produced here also complies with the conditions necessary for use of the health claim contained within Commission Regulation (EU) No 851/2013.
Bread produced with sourdough also showed a higher amount of starch resistant to attack by the enzymes used during in vitro tests. It can therefore be considered a “functional food” since the starch that is not digested by amylolitic enzymes can be considered, in all respects, as “dietary fiber” and has recognized functional properties as it stimulates the intestinal microbiota.
No differences in the cristallinity status of starch were detected between fresh samples of LS and BY bread. As shown by the descriptive analysis and acceptability test results, sourdough has a strong influence on certain attributes that characterize the product, enhancing positive sensory characteristics and improving acceptability. As a concluding remark, sourdough leavening technology is highly advisable and can be easily implemented in bakeries that already produce “Carasau” bread and other semolina crispy flatbreads without breaking the pace of production thanks to the use of modern bioreactors that enable the mechanization of all the operations related to the preparation of the sourdough.
Electronic supplementary material
Below is the link to the electronic supplementary material.
Acknowledgements
The project was funded by the “Regione Autonoma della Sardegna”, POR-FESR 207-2013, Asse VI Competitività”. The authors are grateful to the staff of the bakery “Il Vecchio Forno” for their assistance during the bakery trials. MS is grateful to the panel members for their valuable collaboration during training and sensory testing sessions.
Ethical standards
All procedures followed were in accordance with the ethical standards required by the (institutional) committee responsible for human experimentation and with the Helsinki Declaration of 1975, as revised in 2008.
Informed consent
Informed consent was obtained from all consumers for their inclusion in the study.
Footnotes
Publisher's Note
Springer Nature remains neutral with regard to jurisdictional claims in published maps and institutional affiliations.
Contributor Information
Manuela Sanna, Email: sanna@portocontericerche.it.
Simonetta Fois, Email: fois@portocontericerche.it.
Giovanni Falchi, Email: giovannifalchi@gmail.com.
Marco Campus, Phone: +39 079998419, Email: campus@portocontericerche.it.
Tonina Roggio, Email: roggio@portocontericerche.it.
Pasquale Catzeddu, Email: catzeddu@portocontericerche.it.
References
- AACC. Approved Methods of the American Association of Cereal Chemists. St. Paul, Minnesota (2000)
- Blaak EE, Antoine JM, Benton D, Björck I, Bozzetto L, Brouns F, Diamant M, Dye L, Hulshof T, Holst JJ, Lamport DJ, Laville M, Lawton CL, Meheust A, Nilson A, Normand S, Rivellese AA, Theis S, Torekov SS, Vinoy S. Impact of postprandial glycaemia on health and prevention of disease. Obes. Rev. 2012;13:923–984. doi: 10.1111/j.1467-789X.2012.01011.x. [DOI] [PMC free article] [PubMed] [Google Scholar]
- Borczak B, Sikora E, Sikora M, Van Haesendonck I. The impact of sourdough addition to frozen stored wheat-flour rolls on glycemic response in human volunteers. Starch. 2011;63:801–807. doi: 10.1002/star.201100055. [DOI] [Google Scholar]
- Charmaine IC, Arendt AK. A review of the application of sourdough technology to wheat breads. Adv. Food Nutr. Res. 2005;49:137–161. doi: 10.1016/S1043-4526(05)49004-X. [DOI] [PubMed] [Google Scholar]
- Chavan RS, Chavan SR. Sourdough technology-a traditional way for wholesome foods: a review. Compr Rev Food Sci. Food Saf. 2011;10:170–183. [Google Scholar]
- Chen J, Karlsson C, Povey M. Acoustic envelope detector for crispness assessment of biscuits. J. Texture stud. 2005;36:139–156. doi: 10.1111/j.1745-4603.2005.00008.x. [DOI] [Google Scholar]
- Chillo S, Ranawana DV, Henry CJK. Effect of two barley β-glucan concentrates on in vitro glycaemic impact and cooking quality of spaghetti. LWT Food Sci. Technol. 2011;44:940–948. doi: 10.1016/j.lwt.2010.11.022. [DOI] [Google Scholar]
- Clarke C, Schober T, Dockery P, O’Sullican K, Arendt E. Wheat sourdough fermentation: effects of time and acidification on fundamental rheological properties. Cereal Chem. 2004;81:409–417. doi: 10.1094/CCHEM.2004.81.3.409. [DOI] [Google Scholar]
- Commission Regulation (EU) No 851/2013 of 3 September 2013 authorising certain health claims made on foods, other than those referring to the reduction of disease risk and to children’s development and health and amending Regulation (EU) No 432/2012. http://eurlex.europa.eu/LexUriServ/LexUriServ.do?uri=OJ:L:2013:235:0003:0007:EN:PDF. Accessed Sept. 3, 2013.
- Danza A, Mastromatteo M, Cozzolino F, Lecce L, Lampignano V, Laverse J, Del Nobile MA. Processing and characterization of durum wheat bread enriched with antioxidant from yellow pepper flour”. Food Sci. Technol-LEB. 2014;59:479–485. doi: 10.1016/j.lwt.2014.06.001. [DOI] [Google Scholar]
- De Angelis M, Damiano N, Rizzello CG, Cassone A, Di Cagno R, Gobbetti M. Sourdough fermentation as a tool for the manufacture of low-glycemic index white wheat bread enriched in dietary fibre. Eur. Food Res. Technol. 2009;229:593–601. doi: 10.1007/s00217-009-1085-1. [DOI] [Google Scholar]
- De Angelis M, Rizzello CG, Alfonsi G, Arnault P, Cappelle S, Di Cagno R, Gobbetti M. Use of sourdough lactobacilli and oat fibre to decrease the glycaemic index of white wheat bread. Br. J. Nutr. 2007;98:1196–1205. doi: 10.1017/S0007114507772689. [DOI] [PubMed] [Google Scholar]
- De Vuyst L, Neysens P. The sourdough microflora: biodiversity and metabolic interactions. Trends Food Sci. Tech. 2005;16:43–56. doi: 10.1016/j.tifs.2004.02.012. [DOI] [Google Scholar]
- Dubois M, Dubat A, Launay B. The AlveoConsistograph handbook. 2. St. Paul, MN: American Association of Cereal Chemists; 2008. [Google Scholar]
- Englyst KN, Englyst HN, Hudson GJ, Cole TJ, Cummings JH. Rapidly available glucose in foods: an in vitro measurement that reflects the glycaemic response. Am. J. Clin. Nutr. 1999;69:448–454. doi: 10.1093/ajcn/69.3.448. [DOI] [PubMed] [Google Scholar]
- Englyst KN, Hudson GL. The classification and measurement of dietary carbohydrates. Food Chem. 1996;57:15–21. doi: 10.1016/0308-8146(96)00056-8. [DOI] [Google Scholar]
- Fardet A. Minimally processed foods are more satiating and less hyperglycaemic than ultra-processed foods: a preliminary study with 98 ready-to-eat foods. Food Funct. 2016;7:2338–2346. doi: 10.1039/C6FO00107F. [DOI] [PubMed] [Google Scholar]
- Fois S, Piu PP, Sanna M, Roggio T, Catzeddu P. Starch digestibility and properties of fresh pasta made with semolina-based liquid sourdough. Food Sci Technol-LEB. 2018;89:496–502. doi: 10.1016/j.lwt.2017.11.030. [DOI] [PMC free article] [PubMed] [Google Scholar]
- Fois S, Sanna M, Stara G, Roggio T, Catzeddu P. Rheological properties and baking quality of commercial durum wheat meals used to make flat crispy bread. Eur. Food Res. Technol. 2011;232:713–722. doi: 10.1007/s00217-011-1439-3. [DOI] [Google Scholar]
- ISO, ISO 8585-1 . Assessor for sensory analysis. Part 1. Guide to the Selection, Training and Monitoring of the Selected Assessors. Geneva: International Organisation for Standardization; 1994. [Google Scholar]
- ISO, ISO 8585-2 . Assessor for Sensory Analysis. Part 2. Guide to the Selection, Training and Monitoring of Experts. Geneva: International Organisation for Standardization; 1994. [Google Scholar]
- ISO ISO 13299:2006 . Sensory Analysis. Methodology. General guidance for establishing a sensory profile. Geneva: International Organisation for Standardization; 2016. [Google Scholar]
- Kroh LW. Caramelisation in food and beverages. Food Chem. 1994;51:373–379. doi: 10.1016/0308-8146(94)90188-0. [DOI] [Google Scholar]
- Lawless HT, Heymann H. Descriptive analysis. In: Lawless HT, Heymann H, editors. Sensory evaluation of food. Springer: New York pp; 2010. pp. 227–257. [Google Scholar]
- Lehmann U, Robin F. Slowly digestible starch e its structure and health implications: a review. Trends Food Sci. Technol. 2007;18:346–355. doi: 10.1016/j.tifs.2007.02.009. [DOI] [Google Scholar]
- Macfie H, Bratchell N, Greenhoff K, Vallis L. Designs to balance the effect of order of presentation and first-order carry-over effects in hall tests. J. Sens Stud. 1989;4:129–148. doi: 10.1111/j.1745-459X.1989.tb00463.x. [DOI] [Google Scholar]
- Maioli M, Pes GM, Sanna M, Cherchi S, Dettori M, Manca E, Farris GA. Sourdough-leavened bread improves postprandial glucose and insulin plasma levels in subjects with impaired glucose tolerance. Acta Diabetol. 2008;45:91–96. doi: 10.1007/s00592-008-0029-8. [DOI] [PubMed] [Google Scholar]
- Minervini F, Di Cagno R, Lattanzi A, De Angelis M, Antonielli L, Cardinali G, Cappelle S, Gobbetti M. Lactic acid bacterium and yeast microbiotas of 19 sourdoughs used for traditional/typical Italian breads: interactions between ingredients and microbial species diversity. Appl. Environ. Microbiol. 2012;78:1251–1264. doi: 10.1128/AEM.07721-11. [DOI] [PMC free article] [PubMed] [Google Scholar]
- Mishra S, Monro JA. Digestibility of starch fractions in whole grain rolled oats. J. Cereal Sci. 2009;50:61–66. doi: 10.1016/j.jcs.2009.03.002. [DOI] [Google Scholar]
- Mishra S, Monro JA. Wholeness and primary and secondary food structure effects on in vitro digestion patterns determine nutritionally distinct carbohydrate fractions in cereal foods. Food Chem. 2012;135:1968–1974. doi: 10.1016/j.foodchem.2012.06.083. [DOI] [PubMed] [Google Scholar]
- Namiki M. Chemistry of maillard reactions: recent studies on the browning reaction. Mechanism and the development of antioxidants and mutagens. Adv. Food Res. 1988;32:116–170. doi: 10.1016/s0065-2628(08)60287-6. [DOI] [PubMed] [Google Scholar]
- Novotni D, Cukelj N, Smerdel B, Bituh M, Dujmic F, Curic D. Glycemic index and firming kinetics of partially baked frozen gluten-free bread with sourdough. J. Cereal Sci. 2012;55:120–125. doi: 10.1016/j.jcs.2011.10.008. [DOI] [Google Scholar]
- Östman EM, Nilsson M, Liljeberg Elmståhl HGM, Molin G, Björck IME. On the effect of lactic acid on blood glucose and insulin responses to cereal products: mechanistic studies in healthy subjects and in vitro. J. Cereal Sci. 2002;36:339–346. doi: 10.1006/jcrs.2002.0469. [DOI] [Google Scholar]
- Piccinini M, Fois S, Secchi N, Sanna M, Roggio T, Catzeddu P. The application of NIR FT Raman spectroscopy to monitor starch retrogradation and crumb firmness in semolina bread. Food Anal. Methods. 2012;5:1145–1149. doi: 10.1007/s12161-011-9360-8. [DOI] [Google Scholar]
- Primo-Martín C, van Nieuwenhuijzen NH, Hamer RJ, van Vliet T. Crystallinity changes in wheat starch during the bread-making process: starch crystallinity in the bread crust. J. Cereal Sci. 2007;45:219–226. doi: 10.1016/j.jcs.2006.08.009. [DOI] [Google Scholar]
- Qarooni J. Flat breads. In: Qaaroni J, editor. Flat Bread Technology. New York: Chapman & Hall; 1996. [Google Scholar]
- Salvador A, Varela P, Sanz T, Fiszman SM. Understanding potato chips crispy texture by simultaneous fracture and acoustic measurements, and sensory analysis. Food Sci. Technol.-LEB. 2009;42:763–767. doi: 10.1016/j.lwt.2008.09.016. [DOI] [Google Scholar]
- Savolainen OI, Codan R, Suomi K, Katina K, Juvonen R, Hanhineva K, Poutanen K. The role of oxygen in the liquid fermentation of wheat bran. Food Chem. 2014;153:424–431. doi: 10.1016/j.foodchem.2013.12.062. [DOI] [PubMed] [Google Scholar]
- Scazzina F, Del Rio D, Pellegrini N, Brighenti F. Sourdough bread: starch digestibility and postprandial glycemic response. J. Cereal Sci. 2009;49:419–421. doi: 10.1016/j.jcs.2008.12.008. [DOI] [Google Scholar]
- Scheirlinck I, Van der Meulen R, Van Schoor A, Vancanneyt M, De Vuyst L, Vandamme P, Huys G. Influence of geographical origin and flour type on diversity of lactic acid bacteria in traditional belgian sourdoughs. Appl. Environ. Microbiol. 2007;73:6262–6269. doi: 10.1128/AEM.00894-07. [DOI] [PMC free article] [PubMed] [Google Scholar]
- Siljeström M, Bjorck I, Eliasson AC, Lonner C, Nyman M, Asp NG. Effects of polysaccharides during baking and storage of bread. In vivo and in vitro studies. Cereal Chem. 1988;65:1–8. [Google Scholar]
- Sirbu A, Arghire C. Functional bread: effect of inulin-type products addition on dough rheology and bread quality. J. Cereal Sci. 2017;75:220–227. doi: 10.1016/j.jcs.2017.03.029. [DOI] [Google Scholar]
- Thiele C, Grassl S, Gänzle M. Gluten hydrolysis and depolymerisation during sourdough fermentation. J. Agric. Food Chem. 2004;52:1307–1313. doi: 10.1021/jf034470z. [DOI] [PubMed] [Google Scholar]
- Tomic O, Nilsen A, Martens M, Næs T. Visualization of sensory profiling data for performance monitoring. Food Sci. Technol. LEB. 2007;40:262–269. doi: 10.1016/j.lwt.2005.09.014. [DOI] [Google Scholar]
- Varela P, Chen J, Fiszman SM, Povey M. Crispness assessment of roasted almonds by an integrated approach to texture description: texture, acoustics, sensory and structure. J. Chemom. 2006;20:311–320. doi: 10.1002/cem.1029. [DOI] [Google Scholar]
- Vincent JFV. The quantification of crispness. J. Sci. Food Agric. 1998;78:162–168. doi: 10.1002/(SICI)1097-0010(199810)78:2<162::AID-JSFA97>3.0.CO;2-3. [DOI] [Google Scholar]
- Woolnough JW, Monro JA, Brennan CS, Bird AR. Simulating human carbohydrate digestion in vitro: a review of methods and the need for standardization. Int. J. Food Sci. Tech. 2008;43:2245–2256. doi: 10.1111/j.1365-2621.2008.01862.x. [DOI] [Google Scholar]
Associated Data
This section collects any data citations, data availability statements, or supplementary materials included in this article.