

Abstract
The nomilin and limonin content in citrus fruits of different varieties was determined at fruit growth and maturation stages by HPLC. The results showed that the two limonoids can be separated, identified, and quantified in citrus fruits within 10 min by the developed method. The method exhibited good precision, repeatability, stability, and recovery rate. The content of limonin and nomilin in most citrus fruits presented an increasing trend initially, and then decreased during fruit growth and maturation; a peak was observed at the young fruit or fruit expansion stage. The dropped fruits also contained some amount of limonoids, suggesting their industrial application. The variation and cluster analyses results revealed that the orange varieties contained the highest amount of limonoids at the mature stage. The results of this study will enable better use of citrus limonoids.
Keywords: Citrus, Limonin, Nomilin, Content, HPLC
Introduction
With the improvement in living standards, people’s awareness of nutrition and health care is gradually increasing. Citrus fruits are not only rich in nutrients such as vitamin C, carbohydrates, and minerals, but also rich in secondary metabolites such as flavonoids, limonoids (Braddock and Bryan, 2001), and alkaloids (Jayaprakasha et al., 2011). Plant limonoids are highly oxidized secondary metabolites with polycyclic triterpenoid backbones, found mostly in the tissues of plants belonging to the family Rutaceae and Meliaceae (Hashinaga et al., 2006). Furthermore, limonoids are typical secondary metabolites in citrus fruits, including lemons, pomelos, grapefruits, oranges, and limes (Russo et al., 2016). They are mainly found in citrus seed (Avula et al., 2016), pulp (Wang et al., 2016b), and peel (Hamdan et al., 2011; Nakagawa et al., 2006). Studies on citrus plants have mainly focused on yield of trees, and color or quality of fruits; however, studies on their medicinal value are limited (Zhang et al., 2017). Recent studies have shown that the limonoids in citrus fruits exhibit a wide range of biological activities, including antitumor (Manners, 2007; Ren et al., 2015), anti-inflammatory (Eom et al., 2016), anti-insect (Bilal et al., 2012), antineoplastic (El-Readi et al., 2010; Lam et al., 1989), and other pharmacological activities. Owing to the multiple positive attributes of limonoids, researchers and industries are paying more attention to utilize the limonoids in citrus fruits. Citrus is a large genus that includes several major cultivated species (Xu et al., 2013), but studies on the content of limonoids between species are sparse.
Limonin is the bitterest limonoid, followed by nomilin. During recent decades, growing evidence have shown that the content of limonin and nomilin in Valencia orange decreases gradually after March every year. In addition, the content of limonin and nomilin reaches the highest during September and then decreases gradually in the fruits of pomelo (Sun et al., 2005). Recent studies have also demonstrated that the accumulation of limonoids is affected by plant genotype, environment (Bai et al., 2016; Zhang et al., 2011), tissue, and development stage (Chebrolu et al., 2012).
In recent years, there have been several studies on the content of limonin and nomilin in different citrus varieties at the mature stage (Breksa III et al., 2011), or the variation trend of limonoid content of the same species during fruit growth and maturation stages (Wang et al., 2016a), but studies on the content of limonoid in different citrus varieties during different fruit growth and maturation stages are limited. On one hand, the citrus fruits are thinning every year, and they contain a certain amount of limonin and nomilin. The study on limonoid content of falling fruits and young fruits in different citrus varieties will enable better use of limonoids. On the other hand, it is convenient for industries to choose less bitter citrus fruits for further processing. Moreover, assessing the content of citrus limonoids during different fruit growth and maturation stages not only provides an evidence to investigate the internal connecting link between citrus varieties and limonoids, but also provides a theoretical basis to analyze the enzymes and genes, which play an important role in regulating the limonoid content of fruits. In the present study, we selected several citrus varieties as representatives (such as lemon, pomelos, oranges, and hybrid citrus) to analyze the differences in limonoid content among them. The content of limonin and nomilin was determined by an improved high-performance liquid chromatography (HPLC) at different fruit growth and maturation stages.
Materials and methods
Plant materials
To assess the limonin and nomilin content in citrus, the fruits of eight citrus varieties from the main citrus production area of China—Sichuan citrus mother orchard (Chengdu, Sichuan, China)—were used. Fruits were collected from trees of the same age during 2017 and 2018. Trees were grown using standard cultural practices and under similar management conditions (5 m × 4 m plots). The first fertilizer (urea 0.5 kg per tree) was applied 10 days before germination; the second fertilizer (urea 0.3 kg per tree) was applied 10 days before flower abscission. The third fertilizer (compound fertilizer 1 kg per tree) was applied to make fruits strong in July; the last fertilizer (compound fertilizer 0.6 kg per tree) was applied at the color conversion stage. The compound fertilizer was consisted of urea, calcium superphosphate, and potassium sulfate. Trees were pruned and sprayed with insecticides and fungicides as needed. The fruits were collected from healthy trees at four stages of development, viz., fruit falling, young fruit, fruit expanding, and mature stages. The varieties were as follows: Tarocco No. 8, Navelina Navel, Yellow Tacopon, Orah, Ehime No. 34, lemon, Tarocco No. 4, and Ehime No. 38. The fruits were harvested from three trees per variety, and each tree was considered as a biological replicate. Eight fruits per tree in all four directions from the outer layer of the crown were randomly collected. The size of fruits was medium, and the fruits were free of disease and insect pests. After harvest, the fruits were dried in a bake oven at 50 °C and placed in a desiccator for storage.
Standards and reagents
Limonin and nomilin standards were obtained from Yuanye Company (Shanghai, China); their purity was above 98%. HPLC grade acetonitrile and carbinol (Macklin, Shanghai, China) were used as mobile phase. Petroleum ether and acetone, of analytical grade, were used for limonoid extraction. Ultrapure water was obtained using a Millipore Milli-Q water purification system (Integral-10; Bioscience, Chengdu, China).
Determination of limonin and nomilin content
The content of limonin and nomilin in the fruits was determined according to the method of Chu et al. (2012) and Vikram et al. (2007), respectively, with minor modifications. The sample was first pretreated. The dried fruits were ground to powder and passed through sieves of 40 mesh. The citrus fruit powder (2 g) was defatted with 40 mL of petroleum ether at 20 °C for 12 h. The defatted powder was then filtered using a vacuum filter (SMB-III; Zhengzhou Great Wall Scientific Industrial, Zhengzhou, China) and dried. Extraction was carried out using an ultrasonic extraction device (Elmasonic S 100; Elma Schmidvauer GmbH, Bodensee, Germany) for 30 min with 40 mL of acetone at 20 °C with default settings, and the extract was collected in a 50-mL centrifuge tube. The ultrasonic extraction operation was repeated. The extract was centrifuged at 5000 rpm for 10 min at 20 °C. The supernatant was evaporated using a rotary evaporator (Rotavapor R-210; BUCHI Labortechnik AG, Bern, Switzerland) under vacuum at 35 °C. The dried samples were re-dissolved in 10 mL of acetonitrile (HPLC grade), which were stored in dark. The samples were passed through a 0.22-μm PALL syringe filter (JinTeng, Tianjin, China) for HPLC.
The HPLC analysis was performed using the Agilent Technologies 1260 HPLC system (Agilent Technologies; Santa Clara, CA, USA), and a C18 HPLC column (4.6 mm × 150 mm, 5 μm) was used. The column temperature was 25 °C, and the isocratic elution model was performed with acetonitrile:phosphoric acid buffer (pH 3.5, 0.03 mol/L):methanol in the ratio of 45:44:11 (v/v), with the elution speed of 1.0 mL/min and the injection volume of 10 μL. The detection wavelength was set at 210 nm.
Analysis of calibration curves
Limonin and nomilin standards (0.02 g) were diluted with acetonitrile (HPLC grade), fixed in 10-mL brown flasks, and confected to 2 g/L stock solution. The stock solution was diluted to different concentrations—1, 2, 5, 10, 25, 50, 100, 150, 200, and 300 mg/L—for the HPLC analysis. The probability of exposure of samples to strong light was minimized as much as possible. Calibration curves of limonin and nomilin were obtained by plotting the peak area versus the concentration. The regression equation and the correlation coefficient were calculated.
Assessment of sensitivity and stability
Mixed standard solution of different concentrations was prepared and analyzed under chromatographic conditions. The limit of detection (LOD) and limit of quantitation (LOQ) were calculated based on the chromatogram. The LOD and LOQ were defined as the concentration corresponding to a signal equal to three and ten times the baseline noise signal (S/N), respectively. Sensitivity of the method was assessed by the mean LOD and LOQ.
Stability of the method was assessed by injecting the same sample into the system at 0, 2, 4, 8, 12, 24, 36, 48 and 96 h after preparation of the sample, and the relative standard deviation (RSD) of each sample at 96 h was determined.
Assessment of precision and repeatability
The same mixed standard solution was analyzed six times under the chromatographic conditions, and then the RSD of the standard solution was calculated based on the content of limonoids.
Six samples (2 g per sample) from the same sample were accurately weighed and extracted under the same preparation conditions. After extraction, the content of limonoids in each sample was determined under the chromatographic conditions and the RSD value was calculated.
Evaluation of sample recovery
Six samples with known content of detected substances were accurately weighed for 2 g and a certain amount of mixed standard was added to each sample. The amount added was 1.5 times that of the original sample, and then the recovery rate was analyzed.
Data analysis
The data were statistically analyzed using IBM SPSS Statistics 19.0 and Excel 2016 with a 5% significant level for variation analysis and cluster analysis.
Results and discussion
Chromatography
Citrus resources exist in varied forms, and the content of limonoids in different varieties is significantly different. It has been reported that limonin is the bitterest of limonoids (Bai et al., 2016), followed by nomilin, and therefore, in the present study, a HPLC method was developed to analyze limonin and nomilin content. The chromatograms of standards and citrus samples obtained at 210 nm are shown in Fig. 1(A–C). Based on the peak type and retention time, the two substances were separated well within 10 min. This indicates that this method can simultaneously separate limonin and nomilin. With the extensive application of advanced instruments and the development of detection techniques, researchers have established a variety of methods for the detection of limonoids. The main methods include TLC (Rout and Mishra, 2014), HPLC–UV (Li et al., 2014), UV-spectrophotometry (Yu et al., 2017), radioimmunoassay (RIA), and HPLC–MS (Avula et al., 2016; Chu et al., 2012). With rapid development, HPLC is one of the most widely used detection methods for accurate qualitative and quantitative analyses of secondary metabolites in citrus (Bilal et al., 2012; Ghasemi et al., 2009).
Fig. 1.
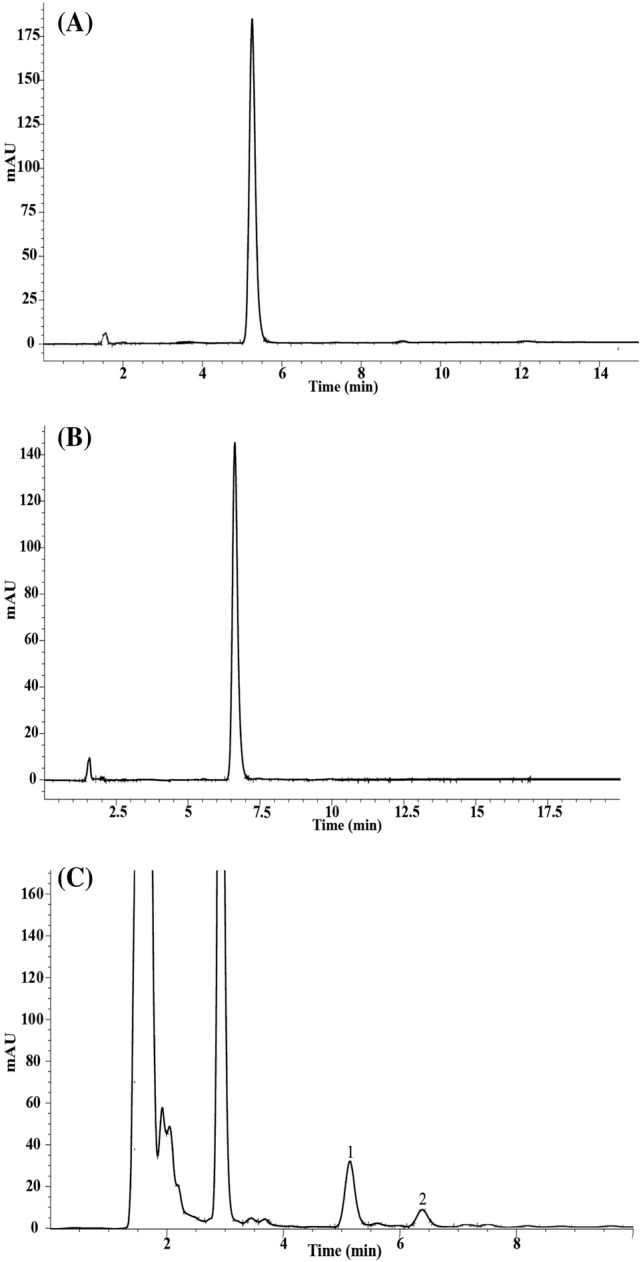
The chromatogram of reference compounds. (A) The chromatogram of limonin standard at 210 nm. (B) The chromatogram of nomilin standard at 210 nm. (C) The chromatogram of citrus samples at 210 nm, peak 1 presented for limonin and peak 2 presented for nomilin
Validation of the developed method
The limonin and nomilin standards were used as reference to draw the standard curves, and then to calculate the sensitivity, stability, precision, repeatability, and recovery rate; the method was validated in terms of all these parameters. The parameters related to standard curves, such as regression equation, correlation coefficient, and linear range are shown in Table 1. The calibration curves of limonin and nomilin showed good linearity (R2 ≥ 0.9994) within the test range, and their content could be accurately determined using the regression equation. The LOD and LOQ values provided the basis for the validation of this method. The RSDs of stability, precision, and repeatability are shown in Table 2. When the same sample was analyzed at 0, 2, 4, 8, 12, 24, 36, 48, 96 h after extracted, the RSD values of limonin and nomilin content were less than 2.94%, indicating that limonin and nomilin in the sample had a good stability within 96 h. It was found that the RSD values of precision and repeatability were not more than 2.85% and 4.32%, respectively, indicating that the method was precise, and it had a good reproducibility. The recovery rates of these two substances were 98.2–106.9%, and the RSD was less than 3.43%, indicating that this method was practical.
Table 1.
Standard curves, the LOD and LOQ of limonin and nomilin contents
| Standards | Regression equation (μg/mL) | Correlation coefficient (R2) | Linear range (μg/mL) | LOD (μg/mL)a | LOQ (μg/mL)b |
|---|---|---|---|---|---|
| Limonin | y = 6.2249x − 3.358 | 0.9995 | 1–400 | 0.25 | 0.80 |
| Nomilin | y = 6.7091x − 0.7429 | 0.9994 | 1–400 | 0.30 | 1.00 |
aLOD is the limit of detection(S/N = 3)
bLOQ is the lowest amount of concentration determined (S/N = 10)
Table 2.
Stability, precision and repeatability of this method
| Analyte | Stability | Precision | Repeatability | |||
|---|---|---|---|---|---|---|
| content (mg/100 g dry weight) | RSD (%) | content (mg/L) | RSD (%) | content (mg/100 g dry weight) | RSDa (%) | |
| Limonin | 28.54 | 1.21 | 5.00 | 2.37 | 2.99 | 4.32 |
| 25.00 | 2.25 | 13.45 | 2.51 | |||
| 100.00 | 1.11 | 88.12 | 3.48 | |||
| Nomilin | 9.46 | 2.94 | 5.00 | 1.20 | 1.50 | 3.19 |
| 25.00 | 2.85 | 4.17 | 2.52 | |||
| 100.00 | 1.60 | 40.02 | 1.49 | |||
aRSD (%) = relative standard deviation
The strengths of the method developed are as follows. This method can save analysis time effectively; limonin and nomilin were separated within 10 min. Furthermore, the method of extraction is simple, and there is no complicated extraction procedure. However, ultrasonic assisted extraction used in this study was more time-consuming than that of Soxhlet extraction (approximately 3 h) and reflux extraction method (approximately 2 h) (Li et al., 2014; Yang et al., 2017).
Analysis of limonin and nomilin content in citrus samples
The relative content of limonin in different citrus samples is listed in Table 3. Significant differences were observed among different citrus varieties. Among the four growth and maturation stages, the content of limonin in citrus fruits ranged from 1.46 mg/100 g in Tarocco No. 4 to 48.91 mg/100 g in Lemon at the fruit falling stage, from 2.40 mg/100 g in Orah to 103.39 mg/100 g in Lemon at the young fruit stage, from 5.26 mg/100 g in Ehime No. 38 to 42.17 mg/100 g in Orah at the fruit expanding stage. The content of limonin was relatively low at the mature stage.
Table 3.
Limonin content of citrus varieties at different fruit growth and maturation stages (mg/100 g dry weight)
| Variety | Fruit falling period | Young fruit period | Fruit expanding period | Mature period |
|---|---|---|---|---|
| Tarocco No. 8 | 8.26 ± 0.73c | 2.89 ± 0.70f | 14.57 ± 2.87d | 1.21 ± 0.45c |
| Navelina Navel | 17.03 ± 0.74b | 26.91 ± 2.79c | 13.40 ± 1.94d | 2.31 ± 0.22a |
| Yellow Tacopon | 2.05 ± 0.37f | 10.10 ± 0.52e | 10.25 ± 2.98e | ND |
| Orah | 3.85 ± 0.21e | 2.40 ± 0.74f | 42.17 ± 6.37a | ND |
| Ehime No. 34 | 2.19 ± 0.37f | 14.20 ± 0.05d | 28.04 ± 11.60b | ND |
| Lemon | 48.91 ± 1.26a | 103.39 ± 24.84a | 23.41 ± 5.84c | 1.02 ± 0.18d |
| Tarocco No. 4 | 1.46 ± 0.41g | 3.95 ± 1.72f | 5.57 ± 1.26f | 1.82 ± 0.79b |
| Ehime No. 38 | 4.15 ± 0.56d | 74.38 ± 0.79b | 5.26 ± 1.58f | ND |
Each value is expressed as mean ± SD (n = 3)
Mean followed by different letters within a row are significantly different (p < 0.05)
ND is not detected
The nomilin content of eight samples is presented in Table 4. The content of nomilin in Yellow Tacopon at the fruit falling and young fruit stages was 20.75 and 34.41 mg/100 g, respectively, which were the highest among all the citrus varieties. Moreover, Orah presented the lowest content of nomilin at the fruit falling and young fruit stages, which were 0.42 and 0.65 mg/100 g, respectively. Orah presented the highest content of nomilin (18.88 mg/100 g), followed by Lemon (17.03 mg/100 g); Tarocco No. 4 showed the lowest content (2.42 mg/100 g) at the fruit expanding stage. At the mature stage, nomilin could not be detected in any citrus sample.
Table 4.
Nomilin content of citrus varieties at different fruit growth and maturation stages (mg/100 g dry weight)
| Variety | Fruit falling period | Young fruit period | Fruit expanding period | Mature period |
|---|---|---|---|---|
| Tarocco No. 8 | 10.63 ± 0.44b | 9.41 ± 2.48 g | 9.27 ± 1.46c | ND |
| Navelina Navel | 5.24 ± 0.33d | 11.42 ± 2.57f | 4.65 ± 0.60d | ND |
| Yellow Tacopon | 20.75 ± 1.17a | 34.41 ± 7.08a | 2.69 ± 0.96e | ND |
| Orah | 0.42 ± 0.10f | 0.65 ± 0.07 h | 18.88 ± 6.69a | ND |
| Ehime No. 34 | 5.34 ± 0.31d | 16.19 ± 1.71d | 9.20 ± 3.87c | ND |
| Lemon | 1.39 ± 0.86e | 21.20 ± 6.72c | 17.03 ± 5.93b | ND |
| Tarocco No. 4 | 8.38 ± 2.79c | 13.10 ± 2.67e | 2.42 ± 0.54e | ND |
| Ehime No. 38 | 1.09 ± 0.22e | 28.13 ± 3.66b | 3.88 ± 0.69d | ND |
Each value is expressed as mean ± SD (n = 3)
Means with different letters within a row are significantly different (p < 0.05)
ND is not detected
The content of limonin was considerably higher than the content of nomilin in the fruits of the same variety at the same time. The highest limonin content of Lemon and Ehime No. 38 was up to 103.39 and 74.38 mg/100 g, respectively. The nomilin content of Orah changed significantly throughout the fruit growth and maturation stages compared with that of other citrus fruits; thus, the varieties Lemon, Ehime No. 38, and Orah are of great value to study bitter substances. The dropped and thinned fruits also contained some amount of limonin and nomilin, and their content differed among varieties; they can also be fully used through recycling and reusing.
The results also showed that the content of limonoids in the fruits of hybrid citrus was the lowest and could not be detected, followed by Lemon at the mature stage; the highest limonoid content was observed in orange varieties at the mature stage. This is consistent with the findings of Breksa III et al. to some extent (Breksa III et al., 2011). Furthermore, it was similar to the variation range of another bitter substance, narirutin (Lin et al., 2010). A previous study has showed that orange varieties presented the highest amount of flavanone glycosides, hesperidin, and narirutin, compared with those of other varieties (Bermejo et al., 2011). Similarly, in the present study, a comparison of limonin and nomilin content in citrus fruits at the mature stage confirmed that the mature fruits of orange varieties were the bitterest.
Analysis of variation trend in limonoid content among citrus samples
In the fruits of Tarocco No. 8 and Orah, the content of limonin presented a decreasing trend initially, increased significantly from the young fruit stage to fruit expanding stage, and then decreased to the lowest level at the mature stage, and the maximum level was observed at the fruit expanding stage. In the fruit of Yellow Tacopon, Ehime No. 34, and Tarocco No. 4, the content of limonin increased until the fruit expanding stage, and then decreased. The content of limonin in the fruit of Navelina Navel, Lemon, and Ehime No. 38 reached the highest at the young fruit stage, and then decreased gradually.
The nomilin content in the fruits of Navelina Navel, Yellow Tacopon, Ehime No. 34, Lemon, Tarocco No. 4, and Ehime No. 38 varieties showed a similar trend at the fruit growth and maturation stages. They presented an upward trend between the fruit falling stage and young fruit stage; the maximum level was observed at the young fruit stage. The nomilin content showed a decreasing trend after the young fruit stage, and it could not be detected in any variety at the mature stage. These trends were slightly different from that of Orah, which showed the highest content of nomilin at the fruit expanding stage, and then decreased gradually. Whereas, Tarocco No. 8 presented a completely different trend; the highest content of nomilin was at the fruit falling stage (10.63 mg/100 g), and then kept decreasing until it could not be detected at the mature stage.
Overall, the results showed that the maximum limonoid content is present at the young fruit or fruit expanding stage in most citrus varieties. Furthermore, the content of limonin and nomilin in Navelina Navel, Yellow Tacopon, Ehime No. 34, Lemon, Tarocco No. 4, and Ehime No. 38 presented an increasing trend initially, and then decreased during fruit growth and maturation stages. This observation is consistent with the findings of a previous study on variation trend in citrus (Daniel et al., 2011). However, in the present study, the content of nomilin in Tarocco No. 8 showed a trend consistent with that observed in a previous study, that is, the content of limonoids decreased gradually after March (Bai et al., 2016; Li et al., 2014). The variation trend and the highest content stage in some citrus varieties rarely exhibited a similar trend with the predecessors. This might be attributed to the environmental factors. Furthermore, regional differences also exist. It might also be because the index of falling fruit period was increased, and the limonoid content of falling fruits was different from that of fruits at other stages.
Clustering analysis
According to the observed index value of limonin content in citrus fruit, the distance class average method was used to cluster with SPSS system software. Finally, a dendrogram was obtained (Fig. 2). According to the clustering analysis, the citrus samples from eight varieties can be divided into four groups. Group I included four materials, which contained all the orange varieties used and a hybrid citrus Yellow Tacopon. This indicated that the limonin content in orange fruits was similar to each other to some extent, and limonoids in the fruit of Yellow Tacopon, which was selected from the sprouts of Tacopon, showed similar pattern with oranges. Group II included the material of Ehime No. 38 with a significant changing trend. Group III included two hybrid citrus varieties. Groups II and III showed that there was no regularity in limonin content among hybrid citrus fruits. Group IV included the material of lemon, which maintained a high content of limonin almost at all stages. In subsequent studies, the number of varieties will be increased to have a better understanding of the relationship between limonoids and species.
Fig. 2.
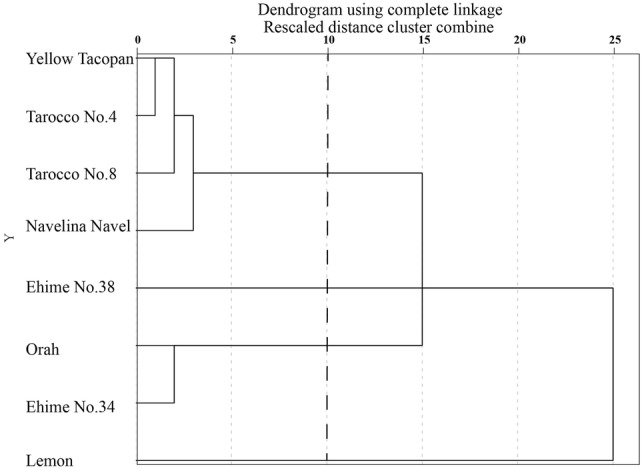
Cluster analysis of limonin
The limonoid content at the mature stage and the cluster analysis results of limonin indicate that the content of limonoids in orange varieties presented a certain variation, which has to be studied in the future. In conclusion, our study provides a theoretical basis to develop citrus limonoids for commercial use, especially for oranges, and to promote comprehensive utilization of limonin in citrus.
Acknowledgements
This work was supported by the Foundation of the Science and Technology Department of Sichuan Province, China (2011NZ0034), the Foundation of Education Department of Sichuan Province, China (2013SZX0054). The authors would like to thank all the members who have helped a lot in the process of experiment.
Compliance with ethical standards
Conflict of interest
The authors declare that they have no competing interest.
References
- Avula B, Sagi S, Wang YH, Wang M, Gafner S, Manthey JA, Khan IA. Liquid chromatography-electrospray Ionization mass spectrometry analysis of limonoids and flavonoids in seeds of grapefruits, other Citrus species, and dietary supplements. Planta Med. 2016;82:1058–1069. doi: 10.1055/s-0042-107598. [DOI] [PubMed] [Google Scholar]
- Bai J, Baldwin EA, McCollum G, Plotto A, Manthey JA, Widmer WW, Luzio G, Cameron R. Changes in volatile and non-volatile flavor chemicals of “Valencia” orange juice over the harvest seasons. Foods. 2016;5(4):1–17. doi: 10.3390/foods5010004. [DOI] [PMC free article] [PubMed] [Google Scholar]
- Bermejo A, Llosa MJ, Cano A. Analysis of bioactive compounds in seven citrus cultivars. Food Sci Technol Int. 2011;17:55–62. doi: 10.1177/1082013210368556. [DOI] [PubMed] [Google Scholar]
- Bilal H, Akram W, Ali-Hassan S. Larvicidal activity of citrus limonoids against aedes albopictus larvae. J Arthropod Borne Dis. 2012;6:104–111. [PMC free article] [PubMed] [Google Scholar]
- Braddock RJ, Bryan CR. Extraction parameters and capillary electrophoresis analysis of limonin glucoside and phlorin in citrus byproducts. J Agric Food Chem. 2001;49:5982–5988. doi: 10.1021/jf010737n. [DOI] [PubMed] [Google Scholar]
- Breksa AP, III, Kahn T, Zukas AA, Hidalgo MB, Yuen ML. Limonoid content of sour orange varieties. J Sci Food Agric. 2011;91:1789–1794. doi: 10.1002/jsfa.4383. [DOI] [PubMed] [Google Scholar]
- Chebrolu KK, Jayaprakasha GK, Jifon J, Patil BS. Production system and storage temperature influence grapefruit vitamin C, limonoids, and carotenoids. J Agric Food Chem. 2012;60:7096–7103. doi: 10.1021/jf301681p. [DOI] [PubMed] [Google Scholar]
- Chu J, Li SL, Yin ZQ, Ye WC, Zhang QW. Simultaneous quantification of coumarins, flavonoids and limonoids in Fructus Citri Sarcodactylis by high performance liquid chromatography coupled with diode array detector. J Pharm Biomed Anal. 2012;66:170–175. doi: 10.1016/j.jpba.2012.03.041. [DOI] [PubMed] [Google Scholar]
- Daniel JJ, Owens DK, McIntosh CA. Secondary product glucosyltransferase and putative glucosyltransferase expression during Citrus paradisi (c.v. Duncan) growth and development. Phytochemistry. 2011;72:1732–1738. doi: 10.1016/j.phytochem.2011.04.024. [DOI] [PubMed] [Google Scholar]
- El-Readi MZ, Hamdan D, Farrag N, El-Shazly A, Wink M. Inhibition of P-glycoprotein activity by limonin and other secondary metabolites from Citrus species in human colon and leukaemia cell lines. Eur J Pharmacol. 2010;626:139–145. doi: 10.1016/j.ejphar.2009.09.040. [DOI] [PubMed] [Google Scholar]
- Eom HJ, Lee D, Lee S, Noh HJ, Hyun JW, Yi PH, Kang KS, Kim KH. Flavonoids and a limonoid from the fruits of Citrus unshiu and their biological activity. J Agric Food Chem. 2016;64:7171–7178. doi: 10.1021/acs.jafc.6b03465. [DOI] [PubMed] [Google Scholar]
- Ghasemi K, Ghasemi Y, Ebrahimzadeh MA. Antioxidant activity, phenol and flavonoid contents of 13 citrus species peels and tissues. Pak J Pharm Sci. 2009;22:277–281. [PubMed] [Google Scholar]
- Hamdan D, El-Readi MZ, Tahrani A, Herrmann F, Kaufmann D, Farrag N, El-Shazly A, Wink M. Chemical composition and biological activity of Citrus jambhiri Lush. Food Chem. 2011;127:394–403. doi: 10.1016/j.foodchem.2010.12.129. [DOI] [PubMed] [Google Scholar]
- Hashinaga F, Fong CH, Hasegawa S. Biosynthesis of limonoids in citrus sudachi. Agric Biol Chem. 2006;54:3019–3020. [Google Scholar]
- Jayaprakasha GK, Dandekar DV, Tichy SE, Patil BS. Simultaneous separation and identification of limonoids from citrus using liquid chromatography-collision-induced dissociation mass spectra. J Sep Sci. 2011;34:2–10. doi: 10.1002/jssc.201000644. [DOI] [PubMed] [Google Scholar]
- Lam LKT, Li Y, Hasegawa S. Effects of citrus limonoids on glutathione S-transferase activity in mice. J Agric Food Chem. 1989;37:878–880. doi: 10.1021/jf00088a010. [DOI] [Google Scholar]
- Li S, Wang Z, Ding F, Sun D, Ma Z, Cheng Y, Xu J. Content changes of bitter compounds in ‘Guoqing No. 1’ Satsuma mandarin (Citrus unshiu Marc.) during fruit development of consecutive 3 seasons. Food Chem. 2014;145:963–969. doi: 10.1016/j.foodchem.2013.09.040. [DOI] [PubMed] [Google Scholar]
- Lin LW, Jiang L, Zheng GD. Study on the contents of flavonoids in Citrus reticulata ‘Chachi’ from various habitats and different collecting periods. Zhong Yao Cai. 2010;33:173–176. [PubMed] [Google Scholar]
- Manners GD. Citrus limonoids: analysis, bioactivity, and biomedical prospects. J Agric Food Chem. 2007;55:8285–8294. doi: 10.1021/jf071797h. [DOI] [PubMed] [Google Scholar]
- Nakagawa H, Takaishi Y, Tanaka N, Tsuchiya K, Shibata H, Higuti T. Chemical constituents from the peels of Citrus sudachi. J Nat Prod. 2006;69:1177–1179. doi: 10.1021/np060217s. [DOI] [PubMed] [Google Scholar]
- Ren W, Xin SK, Han LY, Zuo R, Li Y, Gong MX, Wei XL, Zhou YY, He J, Wang HJ, Si N, Zhao HY, Yang J, Bian BL. Comparative metabolism of four limonoids in human liver microsomes using ultra-high-performance liquid chromatography coupled with high-resolution LTQ-Orbitrap mass spectrometry. Rapid Commun Mass Spectrom. 2015;29:2045–2056. doi: 10.1002/rcm.7365. [DOI] [PubMed] [Google Scholar]
- Rout KK, Mishra SK. Development of a sensitive HPTLC method for quantification of nimbolide in Azadirachta indica and its dosage form. J Chromatogr Sci. 2014;52(9):1089–1094. doi: 10.1093/chromsci/bmt151. [DOI] [PubMed] [Google Scholar]
- Russo M, Arigò A, Calabrò ML, Farnetti S, Mondello L, Dugo P. Bergamot (Citrus bergamia Risso) as a source of nutraceuticals: limonoids and flavonoids. J Funct Foods. 2016;20:10–19. doi: 10.1016/j.jff.2015.10.005. [DOI] [Google Scholar]
- Sun CD, Chen KS, Chen Y, Chen QJ. Contents and antioxidant capacity of limonin and nomilin in different tissues of citrus fruit of four cultivars during fruit growth and maturation. Food Chem. 2005;93(4):599–605. doi: 10.1016/j.foodchem.2004.10.037. [DOI] [Google Scholar]
- Vikram A, Jayaprakasha GK, Patil BS. Simultaneous determination of citrus limonoid aglycones and glucosides by high performance liquid chromatography. Anal Chim Acta. 2007;590:180–186. doi: 10.1016/j.aca.2007.03.029. [DOI] [PubMed] [Google Scholar]
- Wang F, Yu X, Liu X, Shen W, Zhu S, Zhao X. Temporal and spatial variations on accumulation of nomilin and limonin in the pummelos. Plant Physiol Biochem. 2016;106:23–29. doi: 10.1016/j.plaphy.2016.04.039. [DOI] [PubMed] [Google Scholar]
- Wang S, Tu H, Wan J, Chen W, Liu X, Luo J, Xu J, Zhang H. Spatio-temporal distribution and natural variation of metabolites in citrus fruits. Food Chem. 2016;199:8–17. doi: 10.1016/j.foodchem.2015.11.113. [DOI] [PubMed] [Google Scholar]
- Xu Q, Chen LL, Ruan X, Chen D, Zhu A, Chen C, Bertrand D, Jiao WB, Hao BH, Lyon MP, Chen J, Gao S, Xing F, Lan H, Chang JW, Ge X, Lei Y, Hu Q, Miao Y, Wang L, Xiao S, Biswas MK, Zeng W, Guo F, Cao H, Yang X, Xu XW, Cheng YJ, Xu J, Liu JH, Luo OJ, Tang Z, Guo WW, Kuang H, Zhang HY, Roose ML, Nagarajan N, Deng XX, Ruan Y. The draft genome of sweet orange (Citrus sinensis) Nat Genet. 2013;45:59–66. doi: 10.1038/ng.2472. [DOI] [PubMed] [Google Scholar]
- Yang YF, Zhang LZ, Du XP, Zhang SF, Li LJ, Jiang ZD, Wu LM, Ni H, Chen F. Recovery and purification of limonin from pummelo [Citrus grandis] peel using water extraction, ammonium sulfate precipitation and resin adsorption. J Chromatogr B Analyt Technol Biomed Life Sci. 2017;1060:150–157. doi: 10.1016/j.jchromb.2017.05.036. [DOI] [PubMed] [Google Scholar]
- Yu H, Wang C, Deng S, Bi Y. Optimization of ultrasonic-assisted extraction and UPLC-TOF/MS analysis of limonoids from lemon seed. LWT - Food Sci Technol. 2017;84:135–142. doi: 10.1016/j.lwt.2017.05.059. [DOI] [Google Scholar]
- Zhang H, Xie Y, Liu C, Chen S, Hu S, Xie Z, Deng X, Xu J. Comprehensive comparative analysis of volatile compounds in citrus fruits of different species. Food Chem. 2017;230:316–326. doi: 10.1016/j.foodchem.2017.03.040. [DOI] [PubMed] [Google Scholar]
- Zhang X, Breksa AP, III, Mishchuk DO, Slupsky CM. Elevation, rootstock, and soil depth affect the nutritional quality of mandarin oranges. J Agric Food Chem. 2011;59:2672–2679. doi: 10.1021/jf104335z. [DOI] [PubMed] [Google Scholar]