

Abstract
Many neurodegenerative diseases are characterized by amyloid deposition. In Alzheimer's disease (AD), β-amyloid (Aβ) peptides accumulate extracellularly in senile plaques. The AD amyloid cascade hypothesis proposes that Aβ production or reduced clearance leads to toxicity. In contrast, the cholinergic hypothesis argues for a specific pathology of brain cholinergic pathways. However, neither hypothesis in isolation explains the pattern of AD pathogenesis. Evidence suggests that a connection exists between these two scenarios: the synaptic form of human acetylcholinesterase (hAChE-S) associates with plaques in AD brains; among hAChE variants, only hAChE-S enhances Aβ fibrillization in vitro and Aβ deposition and toxicity in vivo. Only hAChE-S contains an amphiphilic C-terminal domain (T40, AChE575–614), with AChE586–599 homologous to Aβ and forming amyloid fibrils, which implicates T40 in AD pathology. We previously showed that the amyloid scavenger, insulin-degrading enzyme (IDE), generates T40-derived amyloidogenic species that, as a peptide mixture, seed Aβ fibrillization. Here, we characterized 11 peptides from a T40–IDE digest for β-sheet conformation, surfactant activity, fibrillization, and seeding capability. We identified residues important for amyloidogenicity and raised polyclonal antibodies against the most amyloidogenic peptide. These new antisera, alongside other specific antibodies, labeled sections from control, hAChE-S, hAPPswe, and hAChE-S/hAPPswe transgenic mice. We observed that hAChE-S β-sheet species co-localized with Aβ in mature plaque cores, surrounded by hAChE-S α-helical species. This observation provides the first in vivo evidence of the conformation of hAChE-S species within plaques. Our results may explain the role of hAChE-S in Aβ deposition and aggregation, as amyloidogenic hAChE-S β-sheet species might seed Aβ aggregation.
Keywords: Alzheimer disease, acetylcholinesterase (AChE), proteolysis, brain, amyloid-beta (AB), beta-sheet conformation, oligomerization domain, seeding, senile plaques, transgenic mice
Introduction
A rising number of pathologies of great public health concern (e.g. Alzheimer's disease (AD)3 and type II diabetes) result from polypeptide misfolding, ordered aggregation, and aggregate deposition, known as amyloids (1). Although amyloids originate from distinct polypeptides and share no sequence homology, they have similar properties (e.g. cross–β-sheet structure) (2, 3). Amyloidogenesis is driven by properties of the sequence backbone and specific side-chain interactions (4–7). AD hallmarks are extracellular deposits of β-amyloid peptides (Aβ) in senile plaques and intracellular deposition of hyperphosphorylated tau in neurofibrillary tangles (NFT) (8). Aβ originates from sequential proteolysis of human amyloid precursor protein (hAPP). Various mutations in hAPP lead to hereditary AD forms (e.g. Swedish mutation (hAPPswe)). The amyloid cascade hypothesis of AD proposes that Aβ is ultimately responsible for pathology during which increased Aβ production or reduced clearance leads to toxicity (1). Although elevated plaque burden is the histological criterion for AD diagnosis, only the level of soluble Aβ found in cerebrospinal fluid correlates with disease severity.
Senile plaques in AD brain also contain “secondary” molecules, among which is the synaptic form of human acetylcholinesterase (hAChE-S). The cholinergic hypothesis sees AD as a specific pathology of brain cholinergic pathways: acetylcholine-mediated neurotransmission is selectively and severely impaired or lost, basal forebrain cholinergic neurons are the most affected, normal hAChE-S hippocampal and cortical fiber networks are severely reduced, and hAChE-S inhibition for 1 year with donepezil in suspected prodromal AD patients decreases the rate of hippocampal atrophy by 45% (9–17). Unfortunately, neither the amyloid cascade nor the cholinergic hypothesis alone explains the full extent of AD pathogenesis. Evidence of a connection includes the following: altered hAChE-S (catalytically, oligomerization and glycosylation) is associated with AD plaques and tangles; hAChE-S enhances Aβ fibrillization in vitro (leading to stable complexes that alter its catalytic activity) and Aβ toxicity ex vivo and in vivo, and mice expressing both hAPPswe and hAChE-S show earlier disease onset than single transgenic mice (18–25). The spread of senile plaque-containing hAChE-S beyond brain areas rich in cholinergic innervation also suggests that hAChE-S role in plaque formation goes beyond cholinergic activity.
Several hAChE variants result from alternative splicing (hAChE-S and hAChE-R, for readthrough) or alternative promoter usage (N-AChE-S and N-AChE-R, with an extended N terminus) (26). In contrast to the synaptic variants, the readthrough variants delay Aβ fibrillization and tau hyperphosphorylation, and inversely affect plaque burden in transgenic mice (hAPPswe–hAChE-R versus hAPPswe–hAChE-S) (21). The two variants only differ in their C-terminal domains, with only hAChE-S containing the amphiphilic 40-residue C-terminal domain (T40, AChE575–614), implicating T40 in AD pathology (27). T40's classic role is to mediate oligomerization to form a variety of hAChE-S isoforms (e.g. soluble and amphiphilic, membrane-bound or anchored to the extracellular matrix). Intact, T40 is nonamyloidogenic, α-helical, and does not promote Aβ assembly (28, 29). T40 has a region, AChE586–599, with shared homology to Aβ, which as a peptide under physiological conditions adopts β-sheet conformation, is amyloidogenic, and promotes Aβ nucleation (28, 30, 31). In vitro, T40-derived amyloid species are generated by insulin-degrading enzyme (IDE), a protease implicated in Aβ processing and genetically linked to AD. IDE–T40 peptides adopt β-structures, are amyloidogenic, and promote Aβ assembly (28). C-terminal T40 proteolysis of hydrophilic monomers and tetramers of bovine AChE-S occurs in vivo (32). Also, naturally occurring soluble monomeric G1 AChE from fetal bovine serum, but not the tetrameric G4 form, lacks the T40 domain (33). These studies suggest that in vivo T40 is vulnerable to proteolysis even in tetramers, and cleaved T40 from G1 AChE can be further digested to generate amyloidogenic species.
Amyloidogenesis is a nucleation-dependent polymerization with an energetically unfavorable lag phase, an elongation phase (nuclei extension by monomer addition), and a plateau phase when fibril extension ends (3). To promote nucleation, initial triggers may be required. For example, during seeding, homologous or heterologous amyloidogenic species provide a conformationally competent template to accelerate initial misfolding and formation of early assembly intermediates, including toxic oligomers (3). In vitro and in vivo seeding occurs in various amyloid systems, including Aβ (34–36). Plaque-associated hAChE-S may promote heterologous seeding of Aβ, which would accelerate toxic oligomer formation and might result in stable Aβ–hAChE-S heterocomplexes (19). This seeding hypothesis may represent a previously undescribed pathological trigger for more severe Aβ pathology during AD, in which Aβ abundance is not the only driving factor. Thus, detailed dissections of the protagonists involved, including their recruitment, formation, and participation in amyloidogenesis, should provide invaluable insights for targeting and controlling diseases involving toxic protein aggregation and deposition.
Here, we investigated the in vivo implication of hAChE-S in AD pathology, using a double transgenic mouse model for hAChE-S/hAPPswe (Tg2576 background, APP695 isoform) (37). In contrast to hAPPswe single transgenic mice, these mice develop more numerous, frequent, and early amyloid plaques (6 months), which contain Aβ1–40, Aβ1–42, markers of activated microglia and reactive astrocytes, and hAChE-S, as do natural AD amyloid deposits (37). The extent of amyloid burden was also tightly correlated with memory impairment, more so than in the hAPPswe single transgenic mice (18). In contrast to transgenic mice with various forms of hAPP, which only address Aβ-related pathology, the presence of the hAChE-S transgene also confirms changes resulting in an imbalance of cholinergic function and neurotransmission. Indeed, overexpression of hAChE-S in transgenic mice triggers a progressive decline in spatial learning and memory, cessation of dendritic branching, reduced number of spines in cortical neurons, and enhanced high-affinity choline uptake, all of these being hallmarks of cholinergic malfunction and characteristics reported in senile dementia (38, 39). Opposite effects were observed in mice transgenic for hAChE-R (40).
This study used synthetic peptides corresponding to products of IDE proteolysis on hAChE-S T40 to fully characterize their potential in terms of β-sheet propensity and conformation, surfactant activity, fibrillization, co-fibrillization, and seeding of Aβ. We established the importance of sequences or residues underlying plaque assembly, and we selected the most amyloidogenic peptide for raising specific antibodies. The new antisera were characterized for specificity and used with other specific antibodies to immunolabel coronal brain sections from 12-month-old WT, hAChE-S single transgenic, hAPPswe single transgenic (Tg2576, APP695 isoform), and hAChE-S/hAPPswe double transgenic mice. Mature plaques in cerebral cortex contained hAChE-S and Aβ, as in AD. Importantly, hAChE-S β-sheet species were detected in plaque cores, surrounded by α-helical forms. Plaque hAChE-S β-sheet species co-localized with fibrillar amyloid material and Aβ. These findings provide the first in vivo evidence of hAChE-S conformation in senile plaques.
Results
We previously established that IDE proteolysis of T40 generates amyloid species seeding Aβ fibrillization (28). Now we have characterized a set of individual synthetic peptides identified from a T40–IDE digest, rather than as a peptide mixture. Two new antisera were generated by immunization with the 'best' amyloidogenic T40–IDE peptide, to use along with other specific antibodies to label brain sections of control mice, hAChE-S, hAPPswe, and hAChE-S/hAPPswe transgenic mice.
Key residues for β-sheet propensity and conformation
The β-sheet formation is one driver of amyloidosis in AD. It is important to assess the propensity of T40–IDE peptides for conversion to non-native (hidden) β-strands. We used the algorithm of Yoon and Welsh (31), who predicted minimal amyloidogenic regions for α-synuclein and Aβ and showed AChE586–599 as an hAChE-S region with high β-strand propensity. Previously, we identified YMVH as the AChE586–599 sequence with the strongest propensity for β-strand conversion, and Trp591, Tyr594, Met595, Val596, and Trp598 as crucial to maintain high β-strand propensity along the entire sequence (28). Applied to T40–IDE peptides, the algorithm revealed that β-strand conversion depends on surrounding sequences and identified two regions, WKAEFHR and SYMVHWK (Fig. 1). Trp591 and Ser592 were predicted as random coils, unlike their configuration in the AChE586–599 context. It was also evident that T40 N terminus (DTLDEAERQ) and C terminus (NQFD) have propensities for both random coil and α-helix, and that His589 has a negative effect on the following RWSS. The two peptides with the strongest predicted propensity for β-strand conversion are AChE590–598 (RWSSYMVHW) and AChE594–598 (YMVHW).
Figure 1.
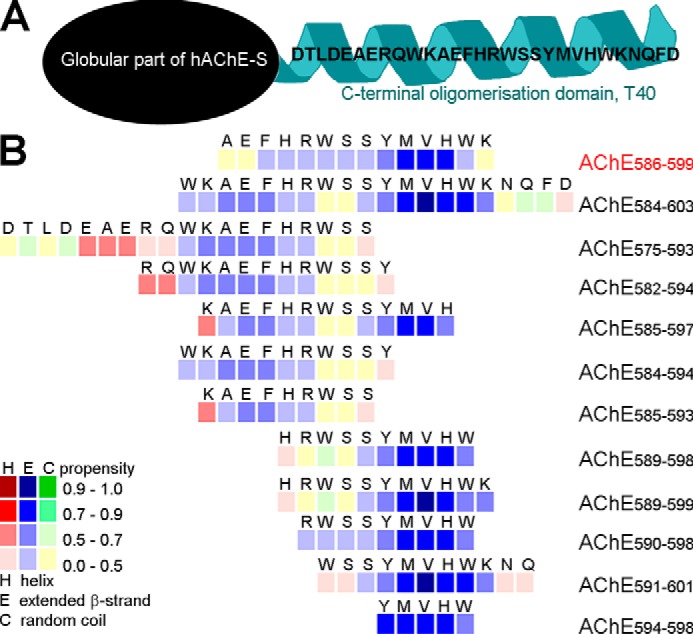
hAChE-S T40 and propensity of the T40–IDE synthetic peptides for conversion to non-native (hidden) β-strand. A, schematic of monomeric hAChE-S showing the exposed C-terminal oligomerization domain, T40, in its native α-helical conformation. B, method developed by Yoon and Welsh (31) was used. Propensities are presented numerically with low values indicating zero to low propensity and high values indicating high propensity to near certainty. Propensity for helices (red squares), β-strands (blue squares), and random coil (green squares) is shown. We have used AChE586–599 as a benchmark, which is shown in red font.
We further analyzed the T40–IDE peptides using three other algorithms, which confirmed the findings from the Yoon and Welsh algorithm (Fig. S1–S3). CamSol, which predicts protein solubility and generic aggregation propensity, identified SYMVHWK as being poorly soluble, followed by KAEFHR, the T40 N and C termini being highly soluble, and His589–Arg590 to have negative effects on the following WSS (Fig. S1) (41). TANGO predicts β-sheet aggregation, percentage occupancy of β-sheet aggregation, β-sheet, and α-helical conformations (42). TANGO identified AEFHR and YMVHW as having β-sheet aggregation propensity; AChE585–597 and AChE590–598 (the immunization peptide used later in the study) as having the two highest aggregation propensities, and His589 along with T40 N terminus as having a negative impact (Fig. S2). WALTZ, which identifies protein motifs that nucleate amyloid fiber formation, recognized RWSSYMV as having amyloid propensity (Fig. S3) (43).
Next, we used far-UV CD to follow conformational changes of T40–IDE peptides before (acidic pH) or during aggregation (neutral pH). In previous studies, AChE586–599 was random coil when nonaggregated but β-sheet on neutralization. Phe588, Trp591, Ser592, Ser593, Tyr594, Met595, Val596, and Trp598 were all important in the conformational transition (28, 30). Fig. 2 and Fig. S4 represent and summarize the conformational changes. At acidic pH, all peptides but AChE582–594 had some random coil conformation (negative ellipticity ∼200 nm or less). All peptides but AChE575–593 (α-helical, double-negative ellipticity minima ∼208 and 220 nm) had partial β-structures, with the majority having a dominant β-sheet conformation (double-negative ellipticity minima at 200 and 215 nm). After 24 h of neutralization, three peptides still showed dominant random coil conformations: AChE584–603, AChE589–599, and AChE594–598. Another AChE575–593 remained dominantly α-helical, and AChE589–598 underwent a conformational change from a dominant random coil to dominantly α-helical. In contrast, AChE590–598 only adopted β-sheet conformation, rather than a mixed β-sheet/random coil. In term of adoption and/or conformational change to β-sheet conformation, these results indicate negative effects of the T40 N and C termini (DTLDEAERQ in AChE575–593, and NQFD in AChE584–603) and the detrimental effect of His589 (AChE589–598/AChE589–599 versus AChE590–598). We also found that 582RQ583 are important for adoption of a partial β-turn rather than a partial random coil conformation (AChE582–594 versus AChE584–594).
Figure 2.

Secondary structure of T40–IDE peptides. Far-UV spectra (250 to 190 nm) before and after pH neutralization (50 mm NaH2PO4, pH 7.2) of 100 μm T40–IDE peptides. At least three independent assays were performed. A, representative spectra of the different structures observed. The blue line indicates 0 m ellipticity. B, conformation at acidic pH and conformational changes after pH neutralization for 100 μm T40–IDE peptides. R. coil, random coil. The dominant secondary structure, if any, is in bold. We have used AChE586–599 as a benchmark, which is shown in red font.
A further question was whether the nondominant β-sheet T40–IDE peptides would adopt a dominant β-sheet conformation at high concentrations or whether membrane-mimicking SDS was present (Fig. 3). For AChE584–594 (WKAEFHRWSSY), the double concentration caused a transition from weak dual random coil/β-sheet to dominant β-sheet (Fig. 3A). With SDS present, AChE584–594 remained a mixed random coil/β-sheet (Fig. 3B). For AChE589–598 (HRWSSYMVHW), which was in β-sheet–β-turn–random coil conformation after a 10-min neutralization, double concentration converted it to a strong dominant β-sheet conformation (Fig. 3A). In the presence of SDS, AChE594–598 (YMVHW) converted from a dominant random coil to a dominant β-sheet (Fig. 3B). These results highlight the importance of local peptide context. Indeed, changing concentrations or the presence of local membranes are likely to influence conformation and in turn amyloidogenesis. Order of β-sheet competence is as follows: AChE590–598 > AChE582–594 > AChE585–593 = AChE584–594 > AChE591–601.
Figure 3.

Secondary structure of T40–IDE peptides. Far-UV spectra (250 to 190 nm) after pH neutralization (50 mm NaH2PO4, pH 7.2) of 100 and 200 μm AChE584–594 and AChE589–598 (A) or 100 μm AChE584–594 and AChE594–598 in the absence or presence of 10 mm SDS (B). CD spectra (left panel) quantification of the signals at 200, 215, and 230 nm (middle panel), and percentage of secondary structures (right panel). At least three independent assays were performed. The blue line indicates 0 m ellipticity. *, p < 0.03 when compared with 100 μm peptide (A) or without SDS (B).
Key fibrillization residues
To study fibrillization kinetics of T40–IDE peptides, we used a classical amyloid dye, ThT, that intercalates in β-sheet amyloid structures, and we assessed changes in its fluorescence emission (44). Shaking was used to accelerate fibrillization and was necessary for some peptides. AChE586–599 was a positive control with well-established fibrillization kinetics (28). AChE586–599 fibrillization showed biphasic behavior: first, rapid assembly (<1 h) followed by a short plateau and decreased ThT signal, and a second slower assembly (>5 h) followed by the same effects (Fig. 4A). This behavior was previously shown to be triggered by assay shaking and thought to arise from susceptibility to breakage by shear forces or increasing surface area and peptide recruitment (28). Also as previously found, the decay of ThT signal after the plateau suggested that AChE586–599 assembly was not stable under these conditions.
Figure 4.

Fibrillization kinetics of T40–IDE peptides. 100 or 200 μm peptide was incubated with 165 μm ThT in PBS, and ThT emission was monitored. At least three independent assays were performed. A, representatives of the changes in ThT fluorescence observed (the right panel is a zoom-in of the time scale to visualize the rapid fibrillization of some peptides). The lag phase of fibrillization (B, left panel) and plateau height (B, right panel) are depicted. *, p < 0.03 when compared with AChE586–599. The inset in the left panel represents a zoom-up of the y axis of the lag phase. The double bar in B left panel indicates the absence of fibrillization (i.e. an indeterminably long lag phase). C, summary of the fibrillization properties for 100 μm of all T40–IDE peptides: ability to fibrillize, duration of lag phase, height of plateau, and stability of the amyloid products (indicated by stability or decay of the ThT fluorescence after plateau). The peptides that do not fibrillize and/or the peptides in which amyloid products are not stable are indicated by gray boxes. The lag phase and plateau height for the AChE peptides are shown as fold ratio of AChE586–599 (e.g. = represents equal value to AChE586–599 and 100 for the lag phase represents 100 times longer than AChE586–599). We have used AChE586–599 as a benchmark, which is shown in red font. D, lag phase of fibrillization (left panel) and plateau height (right panel) of reactions with 200 μm peptides are depicted. *, p < 0.04 when compared with AChE586–599. a.u., arbitrary units.
At 100 μm, only six peptides fibrillized, all (except AChE585–597) with significantly longer nucleation (lag phase), leading to a much lower plateau than AChE586–599 (Fig. 4, A–C). For each, except AChE585–597, the assembly was stable, and plateau ThT signals did not decay. The order of fibrillization competence was as follows: AChE585–597 > AChE590–598 > AChE589–598 > AChE591–601 > AChE584–594 > AChE584–603. At 200 μm, the lag phase of the poorest peptide, AChE584–594, was significantly reduced (∼13.3 to ∼2.6 h), and its plateau height more than doubled (1155 to 2699 a.u.) (Fig. 4D). At 200 μm, AChE589–599 fibrillized but slowly and weakly (lag phase of 16.7 h and plateau height of 333 a.u.) (Fig. 4D).
We then examined the aggregation status of the fibrillizing T40/IDE peptides by EM (Fig. 5). All fibrillizing peptides were clearly aggregated into dense meshworks of fibrils (top panel for each peptide), with individual typical amyloid fibrils clearly identifiable (lower panel for each peptide).
Figure 5.

Morphology of the fibrillizing T40–IDE peptides. 100 μm peptide was incubated with 165 μm ThT in PBS until plateau. Shown are electron micrographs of negatively stained reaction at plateau. The scale bar represents 500 nm.
Most fibrillizing peptides adopted a degree of β-sheet conformation after neutralization. The nonfibrillizing AChE582–594 showed both a β-sheet and β-turn conformation, the latter possibly hindering amyloid cross–β-sheet formation. Similarly, the nonfibrillizing AChE589–599 and AChE594–598 mainly adopted a random coil conformation but also had some β-sheets and β-turns. These results indicate the importance of YMVH as only T40–IDE peptides containing it fibrillized (except AChE584–594).
AChE590–598 and AChE585–597 are seeds for fibrillization of other AChE-derived peptides
AChE585–597 (KAEFHRWSSYMVH) and AChE590–598 (RWSSYMVHW) were the two best in terms of fibrillization. As these two peptides were unlikely to fibrillize by themselves in vivo, we investigated whether the monomers could interact with other T40–IDE peptides and AChE586–599 monomers to enhance fibrillization. Co-fibrillization of T40–IDE peptide monomers with 50 μm AChE590–598 or AChE585–597 monomers triggered fibrillization of T40–IDE peptides that would not fibrillize by themselves at either 50 or 100 μm (AChE575–593, AChE582–594, AChE585–593, AChE589–599, and AChE594–598), or at 50 μm (AChE584–594) (Fig. 6). In contrast to AChE585–597, AChE590–598 also shortened the lag phase and increased the plateau height of AChE586–599.
Figure 6.
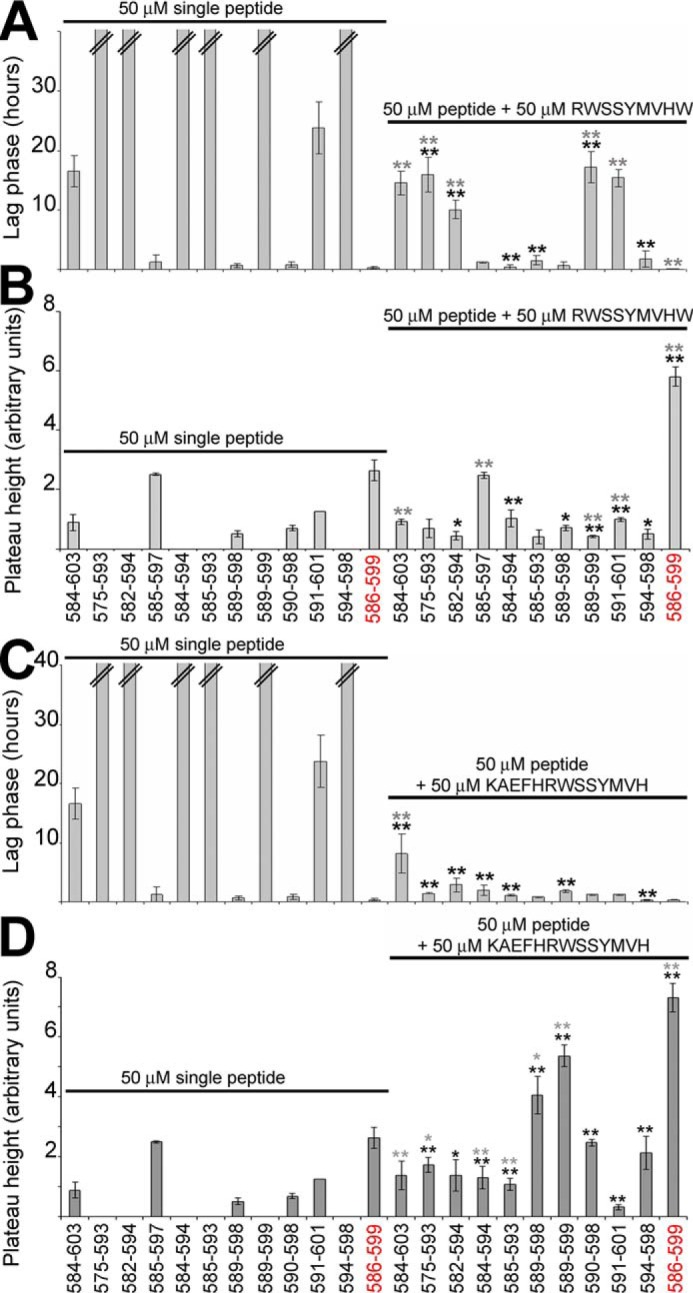
Effect of AChE590–598 or AChE585–597 on T40–IDE peptides and AChE586–599 fibrillization. 50 μm T40–IDE peptide monomers were incubated with 165 μm ThT in PBS, with or without 50 μm AChE590–598 (A and B) or AChE585–597 monomers (C and D). At least three independent assays were performed. Changes in ThT fluorescence were monitored with the lag phase of fibrillization (A and C) and the plateau height (B and D) depicted. The black * or ** refers to p values when compared with 50 μm T40–IDE peptide alone, and the gray * or ** refers to p values when compared with 50 μm AChE590–598 or AChE585–597 alone. * (black or gray) is for p < 0.05, and ** (black or gray) is for p < 0.03. The double bar in A and C indicates the absence of fibrillization (i.e. an indeterminably long lag phase). We have used AChE586–599 as a benchmark, which is shown in red font.
Key residues for surface activity
Many amyloids are amphiphilic and surface-active, allowing efficient adsorption to hydrophobic–hydrophilic interfaces (HHI) (45–52). HHIs act as fibrillization catalysts due to a concentrating effect and promotion of peptide chain alignments that favor β-sheet formation. This is important because in vivo HHIs, cellular membranes (phospholipid bilayers with a hydrophilic outer layer and a hydrophobic core), are structurally and functionally damaged by amyloids (1, 8). Because surface activity plays a major role in amyloid toxicity, it was important to assess surface activity of the T40–IDE peptides. We used a previously described technique based on an off-axial light beam to measure the meniscus lensing effect (47). Normalizing the apparent optical density at the offset using optical density measured on the central axis (ΔOD) gave values that correlated strongly and inversely with surface tension (R >0.97) (47, 53).
AChE586–599 surfactant activity was previously found highly pH-dependent, with little surface activity at acidic pH, likely due to histidine protonation (47). Hence, we began testing surface activity of the T40–IDE peptides by measuring differential absorbance (ΔOD) at acidic and neutral pH (Fig. 7, A and C). AChE584–603, AChE575–593, and AChE585–593 had weaker surface activity (smaller ΔOD) than AChE586–599, and AChE594–598 surface activity was similar to that of AChE586–599. All other peptides were more surface-active than AChE586–599 (higher ΔOD) after 2 min at neutral pH.
Figure 7.

Surface activity of the T40–IDE peptides. The surface activity of 50 μm T40–IDE peptides was measured before and after neutralization (1 m NaH2PO4, pH 7.2). At least three independent assays were performed. A, representative surfactant activity of the T40–IDE peptides and AChE586–599 2 min after neutralization. ΔOD = (ODoffset − ODcentral)neutral pH 2 min − (ODoffset − ODcentral)acidic pH. *, p < 0.023 when compared with AChE586–599. B, temporal pattern of the surface activity for the T40–IDE peptides after neutralization. OD = ODoffset − ODcentral. *, p < 0.034 when compared with the same peptide after 2 min at neutral pH. C, summary of the surfactant properties for the T40–IDE peptides: surface activity dependent on pH (depicted by subtracting the value at acidic pH to the value at neutral pH after 2 min) and stability of the surface activity (indicated by stability or decay of the OD signal). The peptides with unstable surfactant activity are indicated by gray boxes. * indicates peptides in which the activity remains stable over most of the time course, except two time points. The activity for the T40–IDE peptides is shown as fold ratio of AChE586–599 activity (e.g. 1 represents equal value to AChE586–599). We have used AChE586–599 as a benchmark, which is shown in red font.
Assessing temporal patterns of surfactant activity after neutralization, most peptides were not stably surface-active (Fig. 7, B and C), and their activity dropped readily. This suggests that they quickly adsorbed at the air–water interface after neutralization, but subsequent partial decreases in surface activity may reflect conformational changes at the air–water interface to reduce effects on surface energy. In contrast, surface activities of AChE586–599, AChE584–603, AChE590–598, and AChE591–601 were stable, suggesting these peptides remained associated with the air–water interface all along. Orders of competent surface activity were as follows: AChE590–598 > AChE591–601 = AChE582–594 > AChE585–597 > AChE584–594 = AChE589–599 > AChE589–598 > AChE594–598.
T40–IDE peptides act as heterologous seeds to promote Aβ fibrillization
We examined the ability of the T40–IDE peptides to promote Aβ fibrillization. We used 2 μm peptide seeds, not monomers, to assess heterologous seeding of 15 μm Aβ. These conditions were identical to Jean et al. (28) and Diamant et al. (29), for direct comparison with their previous studies on hAChE effects on Aβ fibrillogenesis.
Seed concentration is the initial monomer concentration used to prepare them. By themselves they did not contribute to ThT signals in test wells, as they did not generate signals over background (data not shown). Moreover, seed-ThT values (no Aβ) were subtracted from all test assays with Aβ. Without seeds, Aβ showed a plateau height of ∼1095 a.u. after an ∼43.4-h lag and an elongation rate of ∼ 89.7 a.u./h (Fig. 8 and Fig. S5). The positive control, 2 μm AChE586–599 seeds, reduced Aβ lag phase 1.4-fold and its plateau height 1.2-fold (Fig. 8, A and C). Similar seeding activity for AChE586–599 seeds was previously observed (28). With the exception of AChE584–603 seeds, all other T40–IDE seeds reduced Aβ lag phase significantly, with AChE589–599 being most effective. The seeds of AChE584–603, AChE585–597, AChE584–594, AChE585–593, AChE590–598, and AChE594–598 accelerated Aβ elongation rate (from 1.1- to 1.3-fold), with AChE584–603 seeds being the most effective (Fig. 8B). All peptide seeds, except those of AChE584–603, increased Aβ plateau height (from 1.1- to 1.2-fold), with AChE585–593 being the most effective (Fig. 8C).
Figure 8.
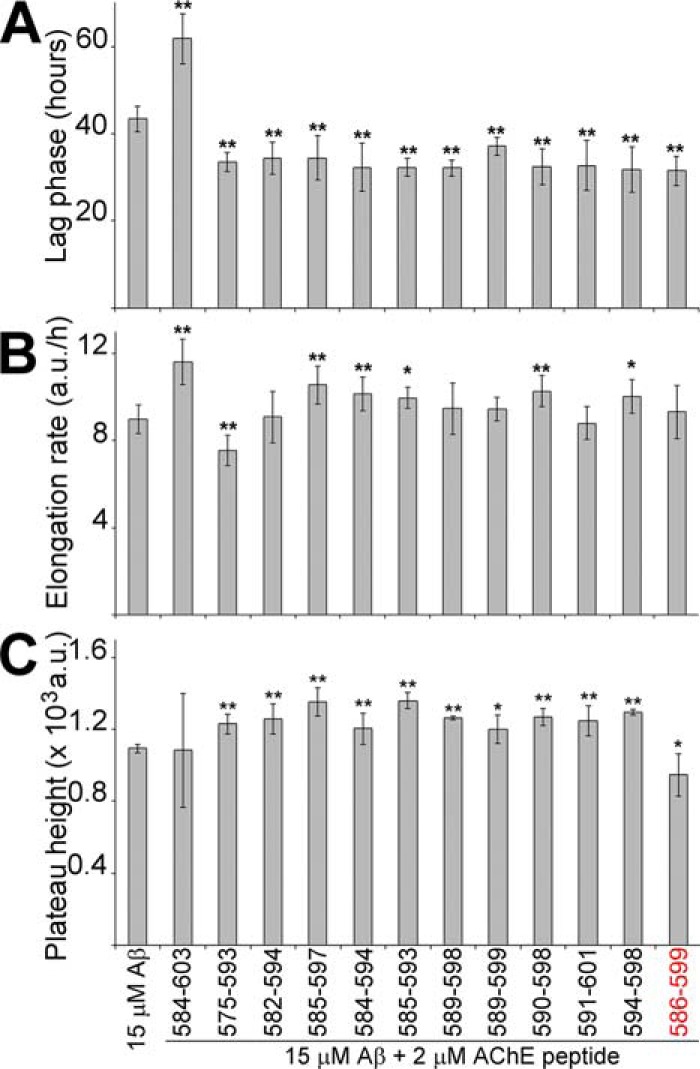
T40–IDE peptide seeds promote Aβ fibrillization. 15 μm Aβ was incubated with 165 μm ThT in PBS, with or without 2 μm T40–IDE peptide seeds, and ThT emission was monitored. At least three independent assays were performed. The lag phase of fibrillization (A), elongation rate (B), and plateau height (C) are depicted. *, p < 0.05, and **, p < 0.03, when compared with Aβ without seeds. a.u., arbitrary units. We have used AChE586–599 as a benchmark, which is shown in red font.
Specificity of new antisera against AChE590–598
After characterizing T40–IDE peptides, RWSSYMVHW (AChE590–598) emerged as the most amyloidogenic. It had the strongest propensity for conversion to β-strand, the strongest surface activity, the best at adopting β-sheet conformation, was second best at fibrillizing, and fair at Aβ seeding. Therefore, two rabbit polyclonal antibodies, 3313 and 3314, were produced using C-Ahx–AChE590–598 acid coupled at the N terminus to KLH as an antigen. Specificity of these antibodies was tested by immunoblot using T40–IDE peptides (monomers or seeds), T40, hAChE-S, and Aβ (monomers and fibrils) as antigens and were compared with that of Mab 105A, specific to AChE586–599 in a β-sheet conformation (Fig. 9). Importantly, neither Mab 105A nor polyclonal 3313 and 3314 cross-reacted with Aβ monomers or fibrils, despite using an amount of Aβ fibrils far above that found in vivo (Fig. 9) (54–56). The extremely low reactivity against Aβ fibrils seen in the immunoblots with 3313 and 3314 was a nonspecific cross-reactivity by the polyclonal secondary antibodies anti-rabbit (probably due to the inherent stickiness of fibrils) (Fig. 9B, inset).
Figure 9.

Specificity of Mab 105A (A) and polyclonal antibodies 3313 (B) and 3314 (C). T40–IDE peptide or peptide seeds, AChE, Aβ monomers (mon.), Aβ fibrils (fibr.), and T40 were blotted onto a nitrocellulose membrane. Blocking was performed with 0.4% fish skin gelatin before incubation with mouse Mab 105A, or rabbit polyclonal antibody 3313 or 3314, followed by anti-mouse or anti-rabbit IgG conjugated to HRP. Products were visualized by enhanced chemiluminescence. The additional inset in B shows the reactivity of the polyclonal secondary antibodies anti-rabbit (no first antibodies were added) against Aβ fibrils under the same conditions.
For 105A, its previously published specificity, established by scanning alanine mutant recognition, for AChE586–599 was confirmed in two ways (30). First, 105A epitope was mapped by using 105A as a bait to select, from a large random peptide phage library, clones expressing short seven-residue peptides bearing its epitope (supporting Experimental procedures). With this technique, the previously mapped epitope specificity of 105A was confirmed to be AxFHR (Fig. S6). Second, the recognition of AChE586–599 was the strongest by slot-blot (Fig. 9). 105A also recognized AChE584–603 monomers and hAChE-S, but the signal was much fainter. Importantly, α-helical T40 was not recognized, confirming 105A specificity for β-sheet conformations. Polyclonal 3313 reacted strongly against monomers of the immunization peptide and of AChE584–603. Significant reactivity was also detected for seeds of the immunization peptide and of AChE585–597 and T40. Low-level reactivity was observed for AChE585–597/AChE589–598 monomers, seeds of AChE584–603/AChE585–597/AChE584–594, and hAChE-S. Polyclonal 3314 reacted strongly against AChE584–603 monomers and AChE585–597 seeds. Significant reactivity was also detected for seeds of AChE584–603/AChE589–598/AChE590–598, AChE586–599, and hAChE-S. Low-level reactivity was observed for monomers of AChE575–593/AChE585–597, seeds of AChE584–594/AChE586–599/immunization peptide, and T40. The specificity of 3313 and 3314 is explained by the fact that most T40–IDE peptides either adopted a β-sheet conformation or fibrillized. Exceptions were fibrillizing AChE591–601 that is not recognized and nonfibrillizing and random coil AChE575–593 that is weakly recognized by 3314. To summarize, 3313 and 3314 share some similar specificities for peptides that fibrillize, although the recognition level for individual peptides vary. However, 3313 and 3314 specificities differ from 105A. The strong target all three antibodies share is for AChE584–603 monomers, which contains both the 105A epitope (FHR) and the full sequence of immunization peptide AChE590–598 for 3313 and 3314 (30).
Distribution of Aβ, hAChE-S, hAChE-S-related species, and ThS-positive plaques
We next performed immunolabeling of coronal sections of brain from 12-month-old control, hAChE-S, or hAPPswe single transgenic mice (Tg2576, APP695 isoform), and hAChE-S/hAPPswe double transgenic mice to probe for presence of hAChE-S–derived peptides. To visualize hAChE-S, we used mouse Mab HR2 anti-cerebellar hAChE-S and rabbit polyclonal KD69 anti-α helical T40 (which recognizes globular intact hAChE-S but also α-helical T40 in isolation) (30). To visualize Aβ species, we used mouse-specific Mab Bam10 anti-Aβ (first 12 residues). To detect β-sheet amyloid species, ThS was used. To detect hAChE-S species in a β-sheet conformation, we used specific mouse Mab 105A anti-AChE586–599 (30). To detect hAChE-S species derived from cleavage of T40, we used our two new rabbit polyclonal antibodies 3313 and 3314.
ThS and all antibodies were negative on sections from WT mice (Fig. 10A). The only reactivity in sections from hAChE-S mice was with HR2 and KD69 recognizing globular hAChE-S, as expected because such mice do not develop amyloid plaques (Fig. 10B). In sections of hAPPswe mice, numerous mature plaques could be identified by single antibody labeling (Fig. 11A, left column). Some of these plaques clearly contained Aβ species (labeled with Bam10), but also AChE-S (labeled with HR2) and AChE-S in β-sheet conformation (labeled with 105A, black arrowheads). Some plaques labeled only with anti-AChE-S antibodies, either anti-intact or anti-AChE-S domains (examples marked by blue arrowheads). There was clearly some peroxidase activity on sections incubated with KD69, 3313, and 3314. The brown color was darker and localized in more specific areas than the controls (no first antibody, only biotinylated secondary antibody, avidin-peroxidase, and DAB). But no plaques were obvious. Similarly, numerous mature plaques were identified by single antibody labeling in sections of hAPPswe/hAChE mice (Fig. 11A, right column). Several Bam10-positive plaques were clearly bigger than in hAPPswe mice. ThS confirmed their amyloid nature (Fig. 11B). Labeling with avidin fluorescein reduced nonspecific background but clearly raised the specific signal above background in 3313 and 3314. Each antibody highlighted mature plaques in the same brain areas detected by peroxidase/DAB staining.
Figure 10.

Reactivity of the antibodies in brains of age-matched control and hAChE-S single transgenic mice. A, absence of reactivity of ThS and the antibodies against Aβ, hAChE-S, and AChE peptides in the brain of age-matched control mice. B, in the brain of hAChE-S single transgenic mice, the only reactivity detected is that of the antibodies recognizing globular hAChE-S. Frozen brain sections, from one animal (12 μm), were labeled with the Elite ABC M.O.M. kit or Vectastain Elite ABC rabbit IgG kit using a biotinylated anti-mouse or anti-rabbit secondary antibody and FITC-conjugated avidin (Vector Laboratories). The scale bar represents 10 μm. Shown is one of the z slices from a z stack.
Figure 11.

Localization and recognition of mature plaques in the brain of hAPPswe single transgenic (A, left column) and hAChE-S/hAPPswe double transgenic mice (A, right column, and B). A, frozen brain sections (12 μm) from single and double transgenic mice were single-labeled with the Elite ABC M.O.M. kit or Vectastain Elite ABC rabbit IgG kit using a biotinylated anti-mouse or anti-rabbit secondary antibody, followed by avidin-conjugated peroxidase and then the peroxidase substrate (DAB, Vector Laboratories). The scale bar represents 200 μm (in the top left brain section). Black arrowheads indicate examples of mature plaques labeled with both anti-Aβ and anti-intact or anti-domains of hAChE-S, and the blue arrowheads indicate examples of mature plaques labeled only with anti-intact or anti-domains of hAChE-S. The insets show z projections of the same mature plaque (identified by a black circle in the full brain section) labeled with each of the following antibodies: HR2, Bam10, and 105A, and the scale bar represents 50 μm. One representative whole brain section per condition was collected as a montage of automatically tiled images. B, frozen brain sections (12 μm) from double hAChE-S/hAPPswe transgenic mice were single-labeled with the Elite ABC M.O.M. kit or Vectastain Elite ABC rabbit IgG kit using a biotinylated anti-mouse or anti-rabbit secondary antibody and FITC-conjugated avidin (Vector Laboratories). Shown are fluorescent labeling of whole brain sections (left, one representative whole brain section per condition was collected as a montage of automatically tiled images) and z projections of mature plaques (fluorescent labeling and merged phase, right). C, mouse brain map at the rostral level, indicating the main brain regions with their sub-areas. D, shown are quantitations of the area occupied overall by the fluorescent labeling from a specific antibody/reagent in the whole brain section of hAPPswe/hAChE double transgenic (i.e. the whole brain section shown in B) (top graph), the overall intensity of the fluorescent labeling in the whole brain section of hAPPswe/hAChE double transgenic (middle graph), and the fold ratio when compared with ThS of each fluorescent labeling in term of area occupied and intensity (bottom graph).
In single and double transgenic brain sections, plaques were mainly detected in the cerebral and olfactory cortices and a few in the olfactory bulb (e.g. ThS, Bam10, and 3314) (Fig. 11, A–C). In the cerebral cortex section studied (rostral level), all sub-areas (motor, orbital, and prelimbic) showed plaques, with stronger fluorescence in the motor sub-area with some reagent/antibodies (e.g. ThS, KD69, Bam10, and 3314). In the olfactory cortex (anterior olfactory nucleus), plaques were detected in all sub-areas. In the olfactory bulb (main and accessory), the plaques appeared more restricted to the granular layer.
When the area occupied by each fluorescent labeling, in the whole brain section of hAPPswe/hAChE double transgenic, was quantitated, it became evident that each individual antibody labeled only a small portion of the area labeled with ThS (Fig. 11D, top and bottom graphs). Indeed, KD69 labeling occupied an area only ∼9.9% that of ThS, Bam10 labeling 13.3%, 105A labeling 1.3%, 3313 labeling 2.8%, and 3314 labeling 25.4%. The same relationship was found when the overall intensity of the fluorescent labeling by each antibody was measured, with KD69 labeling intensity only ∼8.9% that of ThS, Bam10 labeling 25%, 105A labeling 3.8%, 3313 labeling 3.8%, and 3314 labeling 20.3% (Fig. 11D, middle and bottom graphs). These results clearly suggest that Aβ and hAChE-S related species only represent a fraction of the overall amyloid burden.
hAChE-S related species in a β-sheet conformation are located in plaques and colocalize with Aβ
We subsequently addressed by double-fluorescent labeling whether amyloid-positive plaques contained hAChE-S of various kinds, including intact, truncated, α-helical, or β-sheet. In the cerebral cortex of hAPPswe mice, mature amyloid plaques could be detected, which labeled with anti-Aβ Bam10 and ThS (Fig. 12). The Aβ species showed some degree of colocalization with mouse AChE-S (HR2) (68.6% of Bam10 labeling overlapping with that of HR2, and 10.2% of HR2 labeling overlapping with that of Bam10) and mouse AChE-S species with α-helical T40 (KD69) (61.8% of Bam10 labeling overlapping with that of KD69, and 36.2% of KD69 labeling overlapping with that of Bam10), with mouse AChE-S surrounding the Aβ species (Fig. 12A). Human AChE T40 and mouse equivalent differ by only one amino acid conservative substitution, Asp609 in human to Glu609 in mouse. Therefore, K69 should recognize both human and mouse T40 sequences, as observed. Moreover, the entire hAChE-S and mouse AChE-S amino acid sequences share 88.4% identity, with 71 substitutions among which 43 are conservative, 10 are semi-conservative, and 18 are nonconservative. Moreover, HR2 was also seen to cross-react with mouse AChE-S by immunofluorescence in mouse Neuro-2 neuroblastoma cells (GeneTex and Abcam). Thus, it is not surprising that KD69 and HR2 recognize mouse AChE-S. 105A and 3313/3314 also labeled plaques (Figs. 12B and 13). 105 epitope (Phe588–His589–Arg590) and 3313/3314 immunizing peptide AChE590–598 are identical between human and mouse. Because the Ide gene is conserved between human and mouse, it would be highly likely that mouse T40–IDE peptides would be generated from mouse AChE-S. 105A labeling of mouse AChE-S β-sheet species was found at the core of mature plaques, colocalizing with Aβ (10.4% of Bam10 labeling overlapping with that of 105A, and 68.3% of 105A labeling overlapping with that of Bam10) and β-sheet amyloid species (32.4% of ThS labeling overlapping with that of 105A, and 77.2% of 105A labeling overlapping with that of ThS), and surrounded by α-helical species of mouse AChE-S (16.3% of HR2 labeling overlapping with that of 105A, and 67.4% of 105A labeling overlapping with that of HR2; 7.7% of KD69 labeling overlapping with that of 105A, and 51.4% of 105A labeling overlapping with that of KD69) (Fig. 12B). Both 3313 and 3314 antisera labeled mouse AChE-S in mature plaques containing an amyloid mass (ThS) and Aβ species (Bam10) (Fig. 13). Indeed, 69 and 31.4% of ThS labeling overlapped with that of 3313 and 3314, respectively; 68.2 and 87.4% of 3313 and 3314 labeling, respectively, overlapped with that of ThS; 55.8 and 81.8% of Bam10 labeling overlapped with that of 3313 and 3314, respectively, and 27 and 23.8% of 3313 and 3314 labeling, respectively, overlapped with that of Bam10. Moreover, 3313 and 3314 labeling colocalized but also surrounded that of mouse AChE-S β-sheet species (65.2 and 61% of 105A labeling overlapped with that of 3313 and 3314 respectively, and 4.9 and 8.2% of 3313 and 3314 labeling, respectively, overlapped with that of 105A).
Figure 12.

Localization of hAChE-S, T40 (A) and β-sheet derived hAChE peptides (B) in the brain of hAPPswe single transgenic mice. Frozen brain sections (12 μm) from double transgenic mice were double-labeled with the Elite ABC M.O.M. kit or Vectastain Elite ABC rabbit IgG kit using a biotinylated anti-mouse or anti-rabbit secondary antibody and FITC or Texas red–conjugated avidin (Vector Laboratories). The scale bar represents 10 μm. Shown is one of the z slices from a z stack. The right panels show quantitation of the percentage of overlap between the two fluorophores within the plaques (e.g. HR2 labeling overlapping with KD69 labeling), with plaques examined from at least two different sections per condition (with the order of the antibody/reagents having been switched for the staining). The brains from two different mice were examined. Each value is derived from one individual plaque. Also indicated is the mean, and error bars are S.E.
Figure 13.

Localization of AChE-derived peptides, as recognized by antisera 3313 (A) and 3314 (B), in the brain of hAPPswe single transgenic mice. Frozen brain sections (12 μm) from single transgenic mice were double-labeled with the Elite ABC M.O.M. kit or Vectastain Elite ABC rabbit IgG kit using a biotinylated anti-mouse or anti-rabbit secondary antibody and FITC or Texas red–conjugated avidin (Vector Laboratories). The scale bar represents 10 μm. Shown is one of the z slices from a z stack. The right panels show quantitation of the percentage of overlap between the two fluorophores within the plaques (e.g. ThS labeling overlapping with 3313 labeling), with plaques examined from at least two different sections per conditions (with the order of the antibody/reagents having been switched for the staining). The brains from two different mice were examined. Each value is derived from one individual plaque. Also indicated is the mean, and error bars are S.E.
Mature plaques in the cerebral cortex of hAChE-S/hAPPswe mice contained hAChE-S (KD69 and HR2) and Aβ species (Bam10) (Fig. 14A). The Aβ species showed some degree of colocalization with hAChE-S (73.4% of Bam10 labeling overlapping with that of HR2 and 20.3% of HR2 labeling overlapping with that of Bam10; 65.4% of Bam10 labeling overlapping with that of KD69 and 35.8% of KD69 labeling overlapping with that of Bam10), and both hAChE-S (HR2 and KD69) and hAChE-S species with α-helical T40 (KD69) surrounded the Aβ species. This labeling pattern is reminiscent of that observed in AD with hAChE-S being associated with senile plaques (24). Importantly, hAChE-S β-sheet species (105A) were detected in mature plaques, representing only a proportion of the hAChE-S present (14.7% of HR2 labeling overlapping with that of 105A, and 73.1% of 105A labeling overlapping with that of HR2), and surrounded by α-helical forms (6.5% of KD69 labeling overlapping with that of 105A, and 40.2% of 105A labeling overlapping with that of KD69) (Fig. 14B). The plaque hAChE-S β-sheet staining partly co-localized with β-sheet amyloid species (12.1% of ThS labeling overlapping with that of 105A and 47.9% of 105A labeling overlapping with that of ThS) and Aβ species (5.5% of Bam10 labeling overlapping with that of 105A, and 38.6% of 105A labeling overlapping with that of Bam10). In each case, the plaque hAChE-S β-sheet species tended to be centrally located within the mass of amyloids. 3313- and 3314-labeled hAChE-S species associated with fibrillar amyloids (38.7 and 42% of ThS labeling overlapped with that of 3313 and 3314, respectively, and 75 and 79.6% of 3313 and 3314 labeling, respectively, overlapped with that of ThS), Aβ species (49.1 and 86.2% of Bam10 labeling overlapped with that of 3313 and 3314, respectively, and 17.3 and 13.2% of 3313 and 3314 labeling, respectively, overlapped with that of Bam10), and β-sheets hAChE-S species (50.6 and 32.8% of 105A labeling overlapped with that of 3313 and 3314, respectively, and 10.1 and 6.7% of 3313 and 3314 labeling, respectively, overlapped with that of 105A) (Fig. 15). The patterns of colocalization appeared whenever plaques were detected. The species detected by both 3313 and 3314 appeared to represent only a proportion of the fibrillar amyloids (compare, for example, ThS versus 3313 or 3314; see above) and to be centrally localized within the amyloid burden. In contrast, when compared with Aβ species (Bam10) or hAChE-S β-sheet species (105A), the hAChE-S species labeled with 3313 not only colocalized with the Aβ and hAChE-S β-sheet species but extended to the surrounding areas as if encapsulating those in their center. Interestingly, the pattern with 3314 was different. Some colocalization was observed with Aβ and hAChE-S β-sheet species, but 3314 also labeled hAChE-S species in discrete and distinct areas from these (Fig. 15B, arrowheads). Moreover, the labeling of both 3313 and 3314 overlapped to some degree with that of HR2 (globular part of AChE-S) and that of KD69 (α-helical T40) (Fig. S7). This suggests that 3313 and 3314 also recognize, to some level, AChE-S in an in vivo context. These experiments provide the first in vivo evidence of the conformation of hAChE-S–related species located in senile mature plaques and colocalizing with Aβ species and fibrillar amyloids.
Figure 14.

Localization of hAChE-S, T40 (A), and β-sheet derived hAChE peptides (B) in the brain of hAChE-S/hAPPswe double transgenic mice. Frozen brain sections (12 μm) from double transgenic mice were double-labeled with the Elite ABC M.O.M. kit or Vectastain Elite ABC rabbit IgG kit using a biotinylated anti-mouse or anti-rabbit secondary antibody and FITC or Texas red–conjugated avidin (Vector Laboratories). The scale bar represents 10 μm. Shown is one of the z slices from a z stack, with the inset showing a z projection. The right panels show quantitation of the percentage of overlap between the two fluorophores within the plaques (e.g. HR2 labeling overlapping with Bam10 labeling), with plaques examined from at least two different sections per conditions (with the order of the antibody/reagents have been switched for the staining). The brains from two different mice were examined. Each value is derived from one individual plaque. Also indicated is the mean, and error bars are S.E.
Figure 15.

Localization of AChE-derived peptides, as recognized by antisera 3313 (A) and 3314 (B), in the brain of hAChE-S/hAPPswe double transgenic mice. Frozen brain sections (12 μm) from double transgenic mice were double-labeled with the Elite ABC M.O.M. kit or Vectastain Elite ABC rabbit IgG kit using a biotinylated anti-mouse or anti-rabbit secondary antibody and FITC or Texas red–conjugated avidin (Vector Laboratories). The scale bar represents 10 μm. Shown is one of the z slices from a z stack, with the insets showing z projections. B, arrowheads indicate hAChE-S species in discrete and distinct areas from those associated with fibrillar amyloids. The right panels show quantitation of the percentage of overlap between the two fluorophores within the plaques (e.g. ThS labeling overlapping with 3313 labeling), with plaques examined from at least two different sections per conditions (with the order of the antibody/reagents having been switched for the staining). The brains from two different mice were examined. Each value is derived from one individual plaque. Also indicated is the mean, and error bars are S.E.
Discussion
We previously showed that IDE-dependent cleavage of hAChE-S nonamyloidogenic and α-helical oligomerization domain, T40, generates new peptide species (28). As a mixture, they form β-sheets, are surface-active, assemble into amyloid protofibrils, and seed Aβ aggregation. In monomeric G1 AChE-S, T40 remains exposed and susceptible to proteolysis, even in bovine AChE-S tetramers (32). Despite clues pointing at T40, the exact nature of the hAChE-S domain involved remains uncertain (18–21). Thus, identifying IDE-derived amyloidogenic hAChE-S species should provide targets to characterize and identify brain fibrillogenic hAChE-S species.
Eleven hAChE-S peptides from IDE-dependent cleavage of T40 were assessed singly rather than mixtures, as amyloidogenic species. Two T40 regions had exceptionally strong β-sheet propensity, WKAEFHR and SYMVHWK. The two peptides with strongest propensity contained the latter region, AChE590–598 (RWSSYMVHW) and AChE594–598 (YMVHW). In terms of conformation, we identified negative effects of the T40 N terminus. At the lowest concentration, after neutralization, only AChE590–598 (RWSSYMVHW) adopted a dominant β-sheet conformation. At higher concentrations or in the presence of SDS as a membrane-mimicking agent, other peptides also adopted a β-sheet conformation (e.g. AChE589–598, HRWSSYMVHW). These results imply that the in vivo environment, in which these peptides are found (e.g. vicinity of cellular membranes), drastically influences their amyloidogenic behavior. AChE590–598 (RWSSYMVHW) was the most surface-active peptide, a property involved in amyloid toxicity. Only six peptides could fibrillize by themselves, most of them able to adopt a degree of β-sheet conformation and containing YMVH. Individually, AChE585–597 (KAEFHRWSSYMVH) and AChE590–598 (RWSSYMVHW), the best two fibrillizing peptides, allowed fibrillization of T40–IDE peptides that did not fibrillize alone. Importantly, most individual peptide seeds, except AChE584–603, significantly reduced Aβ lag phase, with AChE590–598 (RWSSYMVHW) among the most effective. We identified RWSSYMVHW (AChE590–598) as the most amyloidogenic peptide and generated two new polyclonal antibodies against it, 3313 and 3314. These recognized peptides that fibrillize or adopt a β-sheet conformation, although recognition levels varied. They also had a different specificity to Mab 105A, except for recognizing AChE584–603 (WKAEFHRWSSYMVHWKNQFD). Having created and characterized specific new reagents against hAChE-S T40-derived species of diverse properties, we probed for hAChE-S–derived peptides or hAChE-S with a still attached but proteolytically digested T40 in brains of 12-month-old controls, hAChE-S or hAPPswe single transgenic mice (Tg2576, APP695 isoform), and hAChE-S/hAPPswe double transgenic mice.
In hAChE-S mice, the transgene had been shown to provide greater AChE-S activity in cerebral cortex, doubling the total AChE-S activity but triggering no plaque formation (37). Therefore, it was unsurprising that only antibodies against globular hAChE-S (HR2) and T40 (KD69) achieved labeling.
By 8–9 months, hAPPswe mice began developing classic amyloid plaques in cerebral cortex, as we saw with ThS and anti-Aβ Bam10 in 12-month-old mice (37, 57). The plaques were also rich with HR2 and KD69 labeling. Aβ treatment of cultured mouse neuroblastoma and mouse primary neuronal cultures triggers elevated levels of mouse AChE-S expression and activity (58). Despite an overall decrease of hAChE-S activity in human AD patient brains, it rises in amyloid plaques and NFT at very early stages of amyloid deposition (15, 59). Also, various hAPP transgenic mice showed selective elevation of mouse AChE activity in brain areas linked to severe AD pathology, in particular cores of amyloid plaques in the neocortex, as we saw with Mab 105A anti-AChE586–599 (60–63). Some hAPP mouse models also have higher levels of G1 monomeric mouse AChE-S (62). Moreover, in pathologically relevant cortical extracts of Tg2576 mice, Aβ deposition began as early as 4 months before overt pathology began, and the activity of abnormal glycosylated G1 forms of mouse AChE was rising (63, 64). These Aβ-triggered elevations of mouse AChE-S, potentially proteolytically susceptible monomeric G1 forms, combined with high amino acid homology in hAChE-S and its mouse equivalent, explain plaque labeling by HR2, KD69, 105A, 3313, and 3314 in the Tg2576 mice but only in the context of human Aβ plaque deposition. We saw no labeling in WT mice with mouse APP and AChE-S that never develop plaques (65). hAChE-S is also elevated in human brain tissue immediately adjacent to amyloid plaques (66). Therefore, local neurons reacting to increased levels of soluble Aβ, Aβ deposition, and amyloid burden, in general, could drive AChE-S expression. In turn, proteolytic impact of highly expressed AChE-S could generate amyloidogenic β-sheet species and create a vicious circle of further Aβ seeding or deposition.
In hAPPswe and hAPPswe/hAChE mice, amyloid plaques were detected in brain areas relevant for AD. Indeed, in the cerebral cortex, the motor, orbital, and prelimbic sub-areas all labeled with plaques, as observed in human AD. These cortical sub-areas are also among the most heavily affected by Aβ burden in another mouse model of AD (b6.Cg-Tg(APPswe/PSEN1De9)85Dbo/j, chimeric mouse/human APPswe, and human presenilin-1 gene lacking exon 9) (67). In the orbitofrontal cortex of ∼16-month-old Tg2576 transgenic mice, Aβ deposition was modest (68). Likewise, the motor cortex in 12-month-old double transgenic mice tested with all our antibodies/reagents showed the heaviest amyloid burden, with fewer plaques in the orbital area (68). In the olfactory bulb and cortex of Tg2576 transgenic mice, nonfibrillar Aβ deposition and plaque appearance occur earlier than in any other brain areas (6 months), with deposition in the olfactory bulb as one of the earliest pathological changes (68–70). ThS stained mainly the olfactory bulb granule layer, and Aβ deposition occurred across other layers as the mice aged, correlating with progressive olfactory impairments, resembling those in human AD. In the olfactory cortex and bulb of our double transgenic mice, the observed plaque repartition (anterior olfactory nucleus and granular layer of the bulb) was similar to that described in Tg2576 and b6.Cg-Tg mouse models (67). These areas had among the heaviest amyloid burden. Senile plaques and NFT are commonly found in human olfactory cortex and bulb, and also in brain regions receiving input from it (69, 71). In human dementia, the anterior olfactory nucleus has reduced neuron density, shows NFTs, with number and densities paralleling dementia severity, and contains mature senile plaques when dementia is severe. Thus, in our AD mouse model, amyloid species, Aβ, and AChE-S species accumulate in plaques in various and distinct brain regions that parallel those in other AD mouse models and more importantly in human AD (72, 73).
Mature plaques in the cerebral cortex of our double transgenic mice contained hAChE-S, hAChE-S species, β-sheet amyloid species, and Aβ. Both intact hAChE-S (HR2 and KD69) and hAChE-S species with α-helical T40 (KD69) surrounded the β-sheet amyloid (ThS) and Aβ (Bam10). In contrast, hAChE-S species (3313 and 3314) and hAChE-S species with a β-sheet conformation (105A) colocalized with β-sheet amyloid (ThS) and Aβ species (Bam10) at a more central location within the amyloid burden. In human AD brains, histochemistry for cholinesterase activity showed that both the central core of plaques and its surrounding rim stained strongly and consistently, which also labeled with ThS and Mab 4G8 anti-Aβ (59). hAChE activity was also found associated with mature amyloid plaques, both at the neuritic core and periphery, by EM of human AD brains (74). Our findings are in perfect agreement with previous reports.
Although linked to AD pathology, and in contrast to APP and Aβ, hAChE-S has been neglected in terms of understanding its role and physiology during AD. Prior research mostly focused on inhibiting cholinesterase activity for short-term symptomatic relief. Clearly, the relationships among cholinergic dysfunction, cognitive deficit, and pathological structures remain poorly understood. To our knowledge, our study is the first to investigate conformations adopted by hAChE-S within plaques and the presence of hAChE-S–related species. Our experiments provide the first in vivo evidence that many Aβ-containing amyloid plaques become associated with hAChE-S in α-helical conformation and related species in β-sheet conformation. The β-sheet species may be the result of proteolytic cleavage generating either T40-derived isolated amyloidogenic peptides and/or shortened and amyloidogenic T40 not released from the hAChE-S globular part. We also show that some individual species generated by proteolytic digestion of hAChE-S T40 domain adopt a β-sheet conformation, are surface active, highly amyloidogenic, and able to seed Aβ. This sets the stage for further studies on pathologically relevant Aβ-hAChE-S interactions (e.g. seeding) in hAChE/hAPPswe mice. Using double transgenic mice for such purposes has previously proven valid and successful (75). As in prion disease, the spread of AD pathology may be due to template-directed misfolding by progressive seeding of amyloid aggregation, which can spread into adjacent and interconnected neurons (76). This is supported by the following evidence: in mice that do not normally develop AD pathology, induced Aβ deposition occurs de novo in brain areas (e.g. cortex) far from the original hippocampal injection site of brain extracts from AD patients; induction of senile plaques in the brains of primates by intracerebral injection of human AD brain homogenates; and seeded Aβ aggregation in an APP transgenic mouse model by intracerebral infusion of AD brain extracts (77–79). In AD, amyloid propagation and dissemination to neighboring neurons or brain areas is conceivable for Aβ as it is naturally present in the extracellular space and can diffuse widely without needing to cross membranes. In mammals, globular hAChE-S is mostly a G1 soluble monomer and a G4 tetrameric membrane-bound form (66, 80). As AD progresses, there is selective reduction or loss of G4 tetramers and a rise in G1 monomers in cerebral cortex and cerebrospinal fluid (66, 81, 82). Furthermore, in cerebral cortex of severely affected AD patients with heavy Aβ loads, G4 hAChE-S activity falls ∼50%, and G1 forms rise (66). Rising G1 activity also correlates positively with density of cortical amyloid deposits. In bovines, AChE T40 is vulnerable to proteolysis even in tetramers and is naturally cleaved or truncated in fetal bovine serum G1 AChE (32, 33). Hence, in AD, it is plausible that increased hAChE-S G1 forms that would be extracellular, soluble, and with a proteolytically susceptible T40 could lead to the generation of hAChE-S–derived amyloidogenic species able to seed Aβ aggregation. To date, therapies for diseases like AD do not modify the pathological process but only offer temporary symptomatic alleviation. Template-directed misfolding by seeding of Aβ by hAChE-S, but also cellular dissemination of amyloidogenic species, could offer novel therapeutic strategies to delay propagation by stabilizing native protein conformations.
Experimental procedures
Synthetic peptides, antibodies, and mouse brains
Lyophilized T40–IDE-derived peptides and synthetic human Aβ1–40 (EZBiolab, Carmel, IN) were purchased already purified by reverse-phase HPLC with a C18 column. Before use, the T40–IDE peptides were resuspended at 2 mg/ml in water, and Aβ was resuspended in DMSO at 1.6 mm. Aβ was then sonicated and centrifuged for 1 h at 15,000 × g at 4 °C (to remove any pre-aggregated species). DMSO was used to maintain Aβ in a monomeric pool lacking any β-sheet secondary structures (83).
Specific mouse Mab 105A anti-AChE586–599 in a β-sheet conformation and rabbit polyclonal KD69 anti-α helical T40 were previously described (30). Two rabbit polyclonal antibodies anti-AChE590–598, named 3313 and 3314, were produced by Cambridge Research Biochemicals (Billingham, Cleveland, UK) using C-Ahx–AChE590–598-acid coupled at the N terminus to KLH as an antigen, via standard immunization procedures. Other antibodies used were mouse Mab HR2 anti-cerebellar hAChE-S and Mab Bam10 anti-Aβ (first 12 residues). Brains from 12-month-old WT control, hAChE-S single transgenic, hAPPswe single transgenic (Tg2576, APP695 isoform), and hAChE-S/hAPPswe double transgenic mice were from the Brimijoin lab (18).
Circular dichroism (CD)
Far-UV spectra (250 to 190 nm) before and after pH neutralization (50 mm NaH2PO4, pH 7.2 final) of 100 or 200 μm T40–IDE peptides in absence or presence of 10 mm SDS. The mean spectra of multiple scans (speed, 50 nm min−1, response time 4 s) were collected at 20 °C in a quartz cuvette (1-mm path length) using a Jasco J-720 spectropolarimeter. The spectra were blank subtracted and normalized to molar ellipticity. At least three independent assays were performed. Statistical analysis was by two-sample t test. To determine the percentage of secondary structures, the CD spectra were analyzed with CONTINLL from the CDPro package (84).
Fibrillization experiments
100 or 200 μm T40–IDE peptides were incubated with 165 μm ThT in PBS in a 100-μl reaction volume. ThT fluorescence (excitation 450 nm and emission 480 nm) was measured daily in 96-well plates (black wall, clear bottom, Greiner Bio-One, Stonehouse, Gloucestershire, UK), at 37 °C every 6.7 min with 5-min orbital shaking after every measurement and on a BMG Polarstar plate reader (BMG Labtech, Aylesbury, Buckinghamshire, UK) using a bottom–bottom configuration (optical fiber system detecting emission signal from the bottom of the well). Values in control wells (ThT/buffer) were subtracted from those of test wells (ThT/peptide). Kinetic parameters were calculated as follows: elongation rate was calculated from slope at the sigmoidal curve inflection point; plateau height was calculated by averaging the highest curve values (minimum of five); and the lag phase was calculated from the intercept on the time axis of the line tangent to the inflection point. Three or more independent assays were performed and analyzed each with two-sample t-tests.
Co-fibrillization
50 μm T40–IDE peptides were incubated with 50 μm AChE590–598 or AChE585–597, or 15 μm Aβ was incubated with 15 μm T40–IDE peptides, and the fibrillization experiments were carried as described above.
Heterologous seeding
200 μm T40–IDE peptides in PBS were fibrillized for 2 h at room temperature with continuous shaking to generate seeds, and 15 μm Aβ1–40 (DMSO stock) was incubated with 165 μm ThT in PBS (100 μl reaction volume), with or without 2 μm T40–IDE peptide seeds. ThT fluorescence was measured as described under “Fibrillization experiments,” but readings were taken every 21 min, with 5 min shaking after each read. Control wells contained ThT, buffers, and 2 μm seeds when required. Values in control wells (ThT/buffer with or without seeds) were subtracted from those in test wells (Aβ with or without seeds), ensuring that the seeds did not affect ThT fluorescence.
Transmission EM
100 μm T40–IDE peptides were harvested when the plateau phase was reached (as measured by ThT fluorescence emission). The solutions were adsorbed onto Formvar-coated 400 mesh copper grids, air-dried, washed with distilled water, negatively stained with 2% aqueous uranyl acetate, and viewed with a Tecnai electron microscope (Philips).
Surface activity measurement
Analyses were performed as described previously (47). Stock solutions of T40–IDE peptides were diluted to 50 μm in 200 mm sodium acetate, pH 2 (100 μl final volume), and dispensed in a 96-well plate (black wall, clear bottom; Greiner Bio-One). Surface activity was measured at 37 °C, before and after neutralization with 20 μl of 1 m NaH2PO4, pH 7.2, at 450 nm on a BMG Polarstar plate reader at the central and offset positions. ΔOD = (ODoffset − ODcentral)neutral pH 2 min − (ODoffset − ODcentral)neutral pH. Three or more independent assays were performed and analyzed by two-sample t test.
Immunoblot
To generate seeds, T40–IDE peptides were fibrillized (see above). Aβ fibrils were generated by incubating 199 μm Αβ in PBS and leaving it for 1 week at 37 °C under shaking conditions. 2 μg of T40–IDE peptide or peptide seeds, T40, Aβ, Aβ fibrils, and 1 μg of hAChE-S were blotted onto nitrocellulose membrane. This was blocked with 0.4% fish skin gelatin in PBS, 0.5% Tween 20, and incubated with rabbit polyclonal antibody 3313 or 3314, or mouse Mab 105A, followed by anti-rabbit or anti-mouse IgG conjugated to HRP. Products were visualized by enhanced chemiluminescence.
Immunolabeling and confocal microscopy
Deep-frozen mouse brain material from control, single, and double transgenic mice was derived at the Mayo Clinic (Mayo Clinic study conducted under approval of IACUC study protocol A67914-15-R18).
Mouse brains embedded in Optimal cutting temperature compound generated 12-μm coronal sections kept frozen at −20 °C until used. Sections were fixed in 4% paraformaldehyde on ice for 30 min and permeabilized with 0.4% Triton X-100 for 30 min at room temperature. ABC mouse-on-mouse (M.O.M.) or Vectastain Elite ABC rabbit IgG kits were used, following the manufacturer's instructions (Vector Laboratories, Burlingame, CA). To block nonspecific binding of components, avidin and biotin (Vector kit) were applied consecutively for 15 min at room temperature. With mouse primary antibody, endogenous mouse Ig sections were treated with Vector M.O.M. IgG blocking reagent for 1 h at room temperature before protein blocking with M.O.M. diluent for 5 min at room temperature. With rabbit primary antibodies, sections were treated with Vectastain blocking serum and labeled with one antibody or two. Single-labeled sections were incubated with primary antibody (30 min), M.O.M. anti-mouse, or Vectastain anti-rabbit biotinylated antisera (10 min), followed by avidin conjugated to peroxidase (5 min) and DAB as chromagen (2 min, Vector Laboratories), or avidin-FITC conjugate, or Texas red (5 min). Double-labeled sections were incubated with first antibody as above. Then, to prevent interactions between first and second labeling sets, Vector avidin and biotin were applied consecutively for 15 min at room temperature. Then, sections were treated 1 h with M.O.M. IgG blocking diluent or Vectastain normal blocking serum, incubated with a second primary antibody (30 min), M.O.M. anti-mouse or Vectastain anti-rabbit biotinylated antisera (10 min), and avidin conjugated to FITC or to Texas red (5 min). Finally, section nuclei were counterstained with Harris hematoxylin (10 s) before mounting in Mowiol (4 °C overnight). When required, sections were stained with 1% ThS in water for 5 min at room temperature before mounting. All imaging used an LSM 510 META microscope (Carl Zeiss, Inc.) on an Axio Imager Z1 with a 40 × 0.75 objective or a 63 × 1.4 oil immersion lens. Laser lines were 488 and 543 nm to excite FITC and Texas red, respectively. Fluorescence was measured with the following filters: bp 505–530 and bp 625–743. The z stacks were collected with a 16-μm interval between slices. Plaques were examined from at least two different sections per conditions per animal (with the order of the antibody/reagents having been switched for the staining). For the control animals, WT, and hAChE-S single transgenic, the brain of one animal was examined. For hAPPswe single transgenic and hAChE-S/hAPPswe double transgenic, the brain of two animals were examined. Tiling functions of the confocal microscope collected a series of images spanning the whole brain section, with one representative section per condition collected. Images were analyzed with Image Browser software (Carl Zeiss, Inc.).
Colocalization (fluorescence overlap) was measured using the FIJI plugin JACoP (85). Labeling area and intensity were measured in FIJI using a Huang threshold, region of interest manager, and a set measurement analysis.
Author contributions
L. J., S. B., and D. J. V. conceptualization; L. J. data curation; L. J. formal analysis; L. J. investigation; L. J. and S. B. methodology; L. J. writing-original draft; L. J., S. B., and D. J. V. writing-review and editing; S. B. and D. J. V. resources; D. J. V. supervision; D. J. V. funding acquisition.
Supplementary Material
Acknowledgments
We thank Richard Stillion and Mubeen Goolam (Sir William Dunn School of Pathology, University of Oxford) for assistance and help with the preparation and sectioning of the mouse brains. We are also grateful to Howard Womersley for epitope mapping of the 105A monoclonal by phage display.
The authors declare that they have no conflicts of interest with the contents of this article.
This article contains Figs. S1–S7 and supporting Experimental procedures.
- AD
- Alzheimer's disease
- AChE
- acetylcholinesterase
- Aβ
- amyloid-β peptide
- APP
- amyloid precursor protein
- a.u.
- arbitrary unit
- hAChE-S
- synaptic form of the human acetylcholinesterase
- HHI
- hydrophobic–hydrophilic interface
- HRP
- horseradish peroxidase
- IDE
- insulin-degrading enzyme
- KLH
- keyhole limpet hemocyanin
- Mab
- monoclonal antibody
- ThS
- thioflavin S
- ThT
- thioflavin T
- DAB
- 3,3′-diaminobenzidine
- NFT
- neurofibrillary tangle
- h
- human.
References
- 1. Stefani M., and Dobson C. M. (2003) Protein aggregation and aggregate toxicity: new insights into protein folding, misfolding diseases and biological evolution. J. Mol. Med. 81, 678–699 10.1007/s00109-003-0464-5 [DOI] [PubMed] [Google Scholar]
- 2. Chiti F., and Dobson C. M. (2006) Protein misfolding, functional amyloid, and human disease. Annu. Rev. Biochem. 75, 333–366 10.1146/annurev.biochem.75.101304.123901 [DOI] [PubMed] [Google Scholar]
- 3. Harper J. D., and Lansbury P. T. Jr. (1997) Models of amyloid seeding in Alzheimer's disease and scrapie: mechanistic truths and physiological consequences of the time-dependent solubility of amyloid proteins. Annu. Rev. Biochem. 66, 385–407 10.1146/annurev.biochem.66.1.385 [DOI] [PubMed] [Google Scholar]
- 4. Klimov D. K., and Thirumalai D. (2003) Dissecting the assembly of Aβ16–22 amyloid peptides into antiparallel β sheets. Structure 11, 295–307 10.1016/S0969-2126(03)00031-5 [DOI] [PubMed] [Google Scholar]
- 5. West M. W., Wang W., Patterson J., Mancias J. D., Beasley J. R., and Hecht M. H. (1999) De novo amyloid proteins from designed combinatorial libraries. Proc. Natl. Acad. Sci. U.S.A. 96, 11211–11216 10.1073/pnas.96.20.11211 [DOI] [PMC free article] [PubMed] [Google Scholar]
- 6. Zanuy D., Haspel N., Tsai H. H., Ma B., Gunasekaran K., Wolfson H. J., and Nussinov R. (2004) Side chain interactions determine the amyloid organization: a single layer β-sheet molecular structure of the calcitonin peptide segment 15–19. Phys. Biol. 1, 89–99 10.1088/1478-3967/1/2/005 [DOI] [PubMed] [Google Scholar]
- 7. Smith C. K., and Regan L. (1995) Guidelines for protein design: the energetics of β-sheet side chain interactions. Science 270, 980–982 10.1126/science.270.5238.980 [DOI] [PubMed] [Google Scholar]
- 8. Haass C., and Selkoe D. J. (2007) Soluble protein oligomers in neurodegeneration: lessons from the Alzheimer's amyloid β-peptide. Nat. Rev. Mol. Cell Biol. 8, 101–112 10.1038/nrm2101 [DOI] [PubMed] [Google Scholar]
- 9. Kolisnyk B., Al-Onaizi M., Soreq L., Barbash S., Bekenstein U., Haberman N., Hanin G., Kish M. T., Souza da Silva J., Fahnestock M., Ule J., Soreq H., Prado V. F., and Prado M. A. M. (2017) Cholinergic surveillance over hippocampal RNA metabolism and Alzheimer's-like pathology. Cereb. Cortex 27, 3553–3567 [DOI] [PubMed] [Google Scholar]
- 10. Shaked I., Meerson A., Wolf Y., Avni R., Greenberg D., Gilboa-Geffen A., and Soreq H. (2009) MicroRNA-132 potentiates cholinergic anti-inflammatory signaling by targeting acetylcholinesterase. Immunity 31, 965–973 10.1016/j.immuni.2009.09.019 [DOI] [PubMed] [Google Scholar]
- 11. Francis P. T., Palmer A. M., Snape M., and Wilcock G. K. (1999) The cholinergic hypothesis of Alzheimer's disease: a review of progress. J. Neurol. Neurosurg. Psychiatry 66, 137–147 10.1136/jnnp.66.2.137 [DOI] [PMC free article] [PubMed] [Google Scholar]
- 12. Madhusudan A., Sidler C., and Knuesel I. (2009) Accumulation of reelin-positive plaques is accompanied by a decline in basal forebrain projection neurons during normal aging. Eur. J. Neurosci. 30, 1064–1076 10.1111/j.1460-9568.2009.06884.x [DOI] [PubMed] [Google Scholar]
- 13. Auld D. S., Kornecook T. J., Bastianetto S., and Quirion R. (2002) Alzheimer's disease and the basal forebrain cholinergic system: relations to β-amyloid peptides, cognition, and treatment strategies. Prog. Neurobiol. 68, 209–245 10.1016/S0301-0082(02)00079-5 [DOI] [PubMed] [Google Scholar]
- 14. Coyle J. T., Price D. L., and DeLong M. R. (1983) Alzheimers' disease–a disorder of cortical cholinergic innervation. Science 219, 1184–1190 10.1126/science.6338589 [DOI] [PubMed] [Google Scholar]
- 15. Ulrich J., Meier-Rruge W., Probst A., Meier E., and Ipsen S. (1990) Senile plaques staining for acetylcholinesterase and A4-protein–a comparative study in the hippocampus and entorhinal cortex. Acta Neuropathol. 80, 624–628 10.1007/BF00307630 [DOI] [PubMed] [Google Scholar]
- 16. Dubois B., Chupin M., Hampel H., Lista S., Cavedo E., Croisile B., Louis Tisserand G., Touchon J., Bonafe A., Ousset P. J., Ait Ameur A., Rouaud O., Ricolfi F., Vighetto A., Pasquier F., et al. (2015) Donepezil decreases annual rate of hippocampal atrophy in suspected prodromal Alzheimer's disease. Alzheimers Dement. 11, 1041–1049 10.1016/j.jalz.2014.10.003 [DOI] [PubMed] [Google Scholar]
- 17. Pavlov V. A., Parrish W. R., Rosas-Ballina M., Ochani M., Puerta M., Ochani K., Chavan S., Al-Abed Y., and Tracey K. J. (2009) Brain acetylcholinesterase activity controls systemic cytokine levels through the cholinergic anti-inflammatory pathway. Brain Behav. Immun. 23, 41–45 10.1016/j.bbi.2008.06.011 [DOI] [PMC free article] [PubMed] [Google Scholar]
- 18. Rees T. M., Berson A., Sklan E. H., Younkin L., Younkin S., Brimijoin S., and Soreq H. (2005) Memory deficits correlating with acetylcholinesterase splice shift and amyloid burden in doubly transgenic mice. Curr. Alzheimer Res. 2, 291–300 10.2174/1567205054367847 [DOI] [PubMed] [Google Scholar]
- 19. Alvarez A., Alarcón R., Opazo C., Campos E. O., Muñoz F. J., Calderón F. H., Dajas F., Gentry M. K., Doctor B. P., De Mello F. G., and Inestrosa N. C. (1998) Stable complexes involving acetylcholinesterase and amyloid-β peptide change the biochemical properties of the enzyme and increase the neurotoxicity of Alzheimer's fibrils. J. Neurosci. 18, 3213–3223 10.1523/JNEUROSCI.18-09-03213.1998 [DOI] [PMC free article] [PubMed] [Google Scholar]
- 20. Inestrosa N. C., Alvarez A., Pérez C. A., Moreno R. D., Vicente M., Linker C., Casanueva O. I., Soto C., and Garrido J. (1996) Acetylcholinesterase accelerates assembly of amyloid-β-peptides into Alzheimer's fibrils: possible role of the peripheral site of the enzyme. Neuron 16, 881–891 10.1016/S0896-6273(00)80108-7 [DOI] [PubMed] [Google Scholar]
- 21. Berson A., Knobloch M., Hanan M., Diamant S., Sharoni M., Schuppli D., Geyer B. C., Ravid R., Mor T. S., Nitsch R. M., and Soreq H. (2008) Changes in readthrough acetylcholinesterase expression modulate amyloid-β pathology. Brain 131, 109–119 [DOI] [PubMed] [Google Scholar]
- 22. Alvarez A., Opazo C., Alarcón R., Garrido J., and Inestrosa N. C. (1997) Acetylcholinesterase promotes the aggregation of amyloid–β-peptide fragments by forming a complex with the growing fibrils. J. Mol. Biol. 272, 348–361 10.1006/jmbi.1997.1245 [DOI] [PubMed] [Google Scholar]
- 23. Sáez-Valero J., Sberna G., McLean C. A., and Small D. H. (1999) Molecular isoform distribution and glycosylation of acetylcholinesterase are altered in brain and cerebrospinal fluid of patients with Alzheimer's disease. J. Neurochem. 72, 1600–1608 [DOI] [PubMed] [Google Scholar]
- 24. Wright C. I., Geula C., and Mesulam M. M. (1993) Neurological cholinesterases in the normal brain and in Alzheimer's disease: relationship to plaques, tangles, and patterns of selective vulnerability. Ann. Neurol. 34, 373–384 10.1002/ana.410340312 [DOI] [PubMed] [Google Scholar]
- 25. Geula C., and Mesulam M. (1989) Special properties of cholinesterases in the cerebral cortex of Alzheimer's disease. Brain Res. 498, 185–189 10.1016/0006-8993(89)90419-8 [DOI] [PubMed] [Google Scholar]
- 26. Berson A., and Soreq H. (2010) It all starts at the ends: multifaceted involvement of C-and N-terminally modified cholinesterases in Alzheimer's disease. Rambam Maimonides Med. J. 1, e0014 [DOI] [PMC free article] [PubMed] [Google Scholar]
- 27. Farchi N., Ofek K., Podoly E., Dong H., Xiang Y. Y., Diamant S., Livnah O., Li J., Hochner B., Lu W. Y., and Soreq H. (2007) Peripheral site acetylcholinesterase blockade induces RACK1-associated neuronal remodeling. Neurodegener. Dis. 4, 171–184 10.1159/000101842 [DOI] [PubMed] [Google Scholar]
- 28. Jean L., Thomas B., Tahiri-Alaoui A., Shaw M., and Vaux D. J. (2007) Heterologous amyloid seeding: revisiting the role of acetylcholinesterase in Alzheimer's disease. PLoS ONE 2, e652 10.1371/journal.pone.0000652 [DOI] [PMC free article] [PubMed] [Google Scholar]
- 29. Diamant S., Podoly E., Friedler A., Ligumsky H., Livnah O., and Soreq H. (2006) Butyrylcholinesterase attenuates amyloid fibril formation in vitro. Proc. Natl. Acad. Sci. U.S.A. 103, 8628–8633 10.1073/pnas.0602922103 [DOI] [PMC free article] [PubMed] [Google Scholar]
- 30. Cottingham M. G., Voskuil J. L., and Vaux D. J. (2003) The intact human acetylcholinesterase C-terminal oligomerization domain is α-helical in situ and in isolation, but a shorter fragment forms β-sheet–rich amyloid fibrils and protofibrillar oligomers. Biochemistry 42, 10863–10873 10.1021/bi034768i [DOI] [PubMed] [Google Scholar]
- 31. Yoon S., and Welsh W. J. (2004) Detecting hidden sequence propensity for amyloid fibril formation. Protein Sci. 13, 2149–2160 10.1110/ps.04790604 [DOI] [PMC free article] [PubMed] [Google Scholar]
- 32. Liao J., Boschetti N., Mortensen V., Jensen S. P., Koch C., Nørgaard-Pedersen B., and Brodbeck U. (1994) Characterization of salt-soluble forms of acetylcholinesterase from bovine brain. J. Neurochem. 63, 1446–1453 [DOI] [PubMed] [Google Scholar]
- 33. Saxena A., Hur R. S., Luo C., and Doctor B. P. (2003) Natural monomeric form of fetal bovine serum acetylcholinesterase lacks the C-terminal tetramerization domain. Biochemistry 42, 15292–15299 10.1021/bi030150x [DOI] [PubMed] [Google Scholar]
- 34. Prusiner S. B. (1996) Molecular biology and pathogenesis of prion diseases. Trends Biochem. Sci. 21, 482–487 10.1016/S0968-0004(96)10063-3 [DOI] [PubMed] [Google Scholar]
- 35. Meyer-Luehmann M., Coomaraswamy J., Bolmont T., Kaeser S., Schaefer C., Kilger E., Neuenschwander A., Abramowski D., Frey P., Jaton A. L., Vigouret J. M., Paganetti P., Walsh D. M., Mathews P. M., Ghiso J., et al. (2006) Exogenous induction of cerebral β-amyloidogenesis is governed by agent and host. Science 313, 1781–1784 10.1126/science.1131864 [DOI] [PubMed] [Google Scholar]
- 36. Padrick S. B., and Miranker A. D. (2002) Islet amyloid: phase partitioning and secondary nucleation are central to the mechanism of fibrillogenesis. Biochemistry 41, 4694–4703 10.1021/bi0160462 [DOI] [PubMed] [Google Scholar]
- 37. Rees T., Hammond P. I., Soreq H., Younkin S., and Brimijoin S. (2003) Acetylcholinesterase promotes β-amyloid plaques in cerebral cortex. Neurobiol. Aging 24, 777–787 10.1016/S0197-4580(02)00230-0 [DOI] [PubMed] [Google Scholar]
- 38. Beeri R., Andres C., Lev-Lehman E., Timberg R., Huberman T., Shani M., and Soreq H. (1995) Transgenic expression of human acetylcholinesterase induces progressive cognitive deterioration in mice. Curr. Biol. 5, 1063–1071 10.1016/S0960-9822(95)00211-9 [DOI] [PubMed] [Google Scholar]
- 39. Beeri R., Le Novère N., Mervis R., Huberman T., Grauer E., Changeux J. P., and Soreq H. (1997) Enhanced hemicholinium binding and attenuated dendrite branching in cognitively impaired acetylcholinesterase-transgenic mice. J. Neurochem. 69, 2441–2451 [DOI] [PubMed] [Google Scholar]
- 40. Sternfeld M., Shoham S., Klein O., Flores-Flores C., Evron T., Idelson G. H., Kitsberg D., Patrick J. W., and Soreq H. (2000) Excess “read-through” acetylcholinesterase attenuates but the “synaptic” variant intensifies neurodeterioration correlates. Proc. Natl. Acad. Sci. U.S.A. 97, 8647–8652 10.1073/pnas.140004597 [DOI] [PMC free article] [PubMed] [Google Scholar]
- 41. Sormanni P., Aprile F. A., and Vendruscolo M. (2015) The CamSol method of rational design of protein mutants with enhanced solubility. J. Mol. Biol. 427, 478–490 10.1016/j.jmb.2014.09.026 [DOI] [PubMed] [Google Scholar]
- 42. Fernandez-Escamilla A. M., Rousseau F., Schymkowitz J., and Serrano L. (2004) Prediction of sequence-dependent and mutational effects on the aggregation of peptides and proteins. Nat. Biotechnol. 22, 1302–1306 10.1038/nbt1012 [DOI] [PubMed] [Google Scholar]
- 43. Maurer-Stroh S., Debulpaep M., Kuemmerer N., Lopez de la Paz M., Martins I. C., Reumers J., Morris K. L., Copland A., Serpell L., Serrano L., Schymkowitz J. W., and Rousseau F. (2010) Exploring the sequence determinants of amyloid structure using position-specific scoring matrices. Nat. Methods 7, 237–242 10.1038/nmeth.1432 [DOI] [PubMed] [Google Scholar]
- 44. LeVine H., 3rd. (1993) Thioflavine T interaction with synthetic Alzheimer's disease β-amyloid peptides: detection of amyloid aggregation in solution. Protein Sci. 2, 404–410 [DOI] [PMC free article] [PubMed] [Google Scholar]
- 45. Lopes D. H., Meister A., Gohlke A., Hauser A., Blume A., and Winter R. (2007) Mechanism of islet amyloid polypeptide fibrillation at lipid interfaces studied by infrared reflection absorption spectroscopy. Biophys. J. 93, 3132–3141 10.1529/biophysj.107.110635 [DOI] [PMC free article] [PubMed] [Google Scholar]
- 46. Soreghan B., Kosmoski J., and Glabe C. (1994) Surfactant properties of Alzheimer's Aβ peptides and the mechanism of amyloid aggregation. J. Biol. Chem. 269, 28551–28554 [PubMed] [Google Scholar]
- 47. Cottingham M. G., Bain C. D., and Vaux D. J. (2004) Rapid method for measurement of surface tension in multiwell plates. Lab. Invest. 84, 523–529 10.1038/labinvest.3700054 [DOI] [PubMed] [Google Scholar]
- 48. Chi E. Y., Frey S. L., Winans A., Lam K. L., Kjaer K., Majewski J., and Lee K. Y. (2010) Amyloid-β fibrillogenesis seeded by interface-induced peptide misfolding and self-assembly. Biophys. J. 98, 2299–2308 10.1016/j.bpj.2010.01.056 [DOI] [PMC free article] [PubMed] [Google Scholar]
- 49. Jean L., Lee C. F., Lee C., Shaw M., and Vaux D. J. (2010) Competing discrete interfacial effects are critical for amyloidogenesis. FASEB J. 24, 309–317 10.1096/fj.09-137653 [DOI] [PubMed] [Google Scholar]
- 50. Jiang D., Dinh K. L., Ruthenburg T. C., Zhang Y., Su L., Land D. P., and Zhou F. (2009) A kinetic model for β-amyloid adsorption at the air/solution interface and its implication to the β-amyloid aggregation process. J. Phys. Chem. B 113, 3160–3168 10.1021/jp8085792 [DOI] [PMC free article] [PubMed] [Google Scholar]
- 51. Morris V. K., Ren Q., Macindoe I., Kwan A. H., Byrne N., and Sunde M. (2011) Recruitment of class I hydrophobins to the air:water interface initiates a multi-step process of functional amyloid formation. J. Biol. Chem. 286, 15955–15963 10.1074/jbc.M110.214197 [DOI] [PMC free article] [PubMed] [Google Scholar]
- 52. Morinaga A., Hasegawa K., Nomura R., Ookoshi T., Ozawa D., Goto Y., Yamada M., and Naiki H. (2010) Critical role of interfaces and agitation on the nucleation of Aβ amyloid fibrils at low concentrations of Aβ monomers. Biochim. Biophys. Acta 1804, 986–995 10.1016/j.bbapap.2010.01.012 [DOI] [PubMed] [Google Scholar]
- 53. Jean L., Lee C. F., and Vaux D. J. (2012) Enrichment of amyloidogenesis at an air–water interface. Biophys. J. 102, 1154–1162 10.1016/j.bpj.2012.01.041 [DOI] [PMC free article] [PubMed] [Google Scholar]
- 54. Wang J., Dickson D. W., Trojanowski J. Q., and Lee V. M. (1999) The levels of soluble versus insoluble brain Aβ distinguish Alzheimer's disease from normal and pathologic aging. Exp. Neurol 158, 328–337 10.1006/exnr.1999.7085 [DOI] [PubMed] [Google Scholar]
- 55. Esparza T. J., Wildburger N. C., Jiang H., Gangolli M., Cairns N. J., Bateman R. J., and Brody D. L. (2016) Soluble amyloid-β aggregates from human Alzheimer's disease brains. Sci. Rep. 6, 38187 10.1038/srep38187 [DOI] [PMC free article] [PubMed] [Google Scholar]
- 56. Collins-Praino L. E., Francis Y. I., Griffith E. Y., Wiegman A. F., Urbach J., Lawton A., Honig L. S., Cortes E., Vonsattel J. P., Canoll P. D., Goldman J. E., and Brickman A. M. (2014) Soluble amyloid β levels are elevated in the white matter of Alzheimer's patients, independent of cortical plaque severity. Acta Neuropathol. Commun. 2, 83 10.1186/s40478-014-0083-0 [DOI] [PMC free article] [PubMed] [Google Scholar]
- 57. Hsiao K., Chapman P., Nilsen S., Eckman C., Harigaya Y., Younkin S., Yang F., and Cole G. (1996) Correlative memory deficits, Aβ elevation, and amyloid plaques in transgenic mice. Science 274, 99–102 10.1126/science.274.5284.99 [DOI] [PubMed] [Google Scholar]
- 58. Hu W., Gray N. W., and Brimijoin S. (2003) Amyloid-β increases acetylcholinesterase expression in neuroblastoma cells by reducing enzyme degradation. J. Neurochem. 86, 470–478 [DOI] [PubMed] [Google Scholar]
- 59. Morán M. A., Mufson E. J., and Gómez-Ramos P. (1993) Colocalization of cholinesterases with β amyloid protein in aged and Alzheimer's brains. Acta Neuropathol. 85, 362–369 10.1007/BF00334445 [DOI] [PubMed] [Google Scholar]
- 60. Bronfman F. C., Moechars D., and Van Leuven F. (2000) Acetylcholinesterase-positive fiber deafferentiation and cell shrinkage in the septohippocampal pathway of aged amyloid precursor protein London mutant transgenic mice. Neurobiol. Dis. 7, 152–168 10.1006/nbdi.2000.0283 [DOI] [PubMed] [Google Scholar]
- 61. Dumont M., Lalonde R., Ghersi-Egea J. F., Fukuchi K., and Strazielle C. (2006) Regional acetylcholinesterase activity and its correlation with behavioral performances in 15-month old transgenic mice expressing the human C99 fragment of APP. J. Neural Transm. 113, 1225–1241 10.1007/s00702-005-0373-6 [DOI] [PubMed] [Google Scholar]
- 62. Sberna G., Sáez-Valero J., Li Q. X., Czech C., Beyreuther K., Masters C. L., McLean C. A., and Small D. H. (1998) Acetylcholinesterase is increased in the brains of transgenic mice expressing the C-terminal fragment (CT100) of the β-amyloid protein precursor of Alzheimer's disease. J. Neurochem. 71, 723–731 [DOI] [PubMed] [Google Scholar]
- 63. Apelt J., Kumar A., and Schliebs R. (2002) Impairment of cholinergic neurotransmission in adult and aged transgenic Tg2576 mouse brain expressing the Swedish mutation of human β-amyloid precursor protein. Brain Res. 953, 17–30 10.1016/S0006-8993(02)03262-6 [DOI] [PubMed] [Google Scholar]
- 64. Fodero L. R., Sáez-Valero J., McLean C. A., Martins R. N., Beyreuther K., Masters C. L., Robertson T. A., and Small D. H. (2002) Altered glycosylation of acetylcholinesterase in APP (SW) Tg2576 transgenic mice occurs prior to amyloid plaque deposition. J. Neurochem. 81, 441–448 10.1046/j.1471-4159.2002.00902.x [DOI] [PubMed] [Google Scholar]
- 65. Sáez-Valero J., Fodero L. R., White A. R., Barrow C. J., and Small D. H. (2003) Acetylcholinesterase is increased in mouse neuronal and astrocyte cultures after treatment with β-amyloid peptides. Brain Res. 965, 283–286 10.1016/S0006-8993(02)04159-8 [DOI] [PubMed] [Google Scholar]
- 66. Arendt T., Brückner M. K., Lange M., and Bigl V. (1992) Changes in acetylcholinesterase and butyrylcholinesterase in Alzheimer's disease resemble embryonic development–a study of molecular forms. Neurochem. Int. 21, 381–396 10.1016/0197-0186(92)90189-X [DOI] [PubMed] [Google Scholar]
- 67. Darvesh S., Cash M. K., Reid G. A., Martin E., Mitnitski A., and Geula C. (2012) Butyrylcholinesterase is associated with β-amyloid plaques in the transgenic APPSWE/PSEN1dE9 mouse model of Alzheimer disease. J. Neuropathol. Exp. Neurol. 71, 2–14 10.1097/NEN.0b013e31823cc7a6 [DOI] [PMC free article] [PubMed] [Google Scholar]
- 68. Wesson D. W., Levy E., Nixon R. A., and Wilson D. A. (2010) Olfactory dysfunction correlates with amyloid-β burden in an Alzheimer's disease mouse model. J. Neurosci. 30, 505–514 10.1523/JNEUROSCI.4622-09.2010 [DOI] [PMC free article] [PubMed] [Google Scholar]
- 69. Franks K. H., Chuah M. I., King A. E., and Vickers J. C. (2015) Connectivity of pathology: the olfactory system as a model for network-driven mechanisms of Alzheimer's disease pathogenesis. Front. Aging Neurosci. 7, 234 [DOI] [PMC free article] [PubMed] [Google Scholar]
- 70. Lewis J., Dickson D. W., Lin W. L., Chisholm L., Corral A., Jones G., Yen S. H., Sahara N., Skipper L., Yager D., Eckman C., Hardy J., Hutton M., and McGowan E. (2001) Enhanced neurofibrillary degeneration in transgenic mice expressing mutant tau and APP. Science 293, 1487–1491 10.1126/science.1058189 [DOI] [PubMed] [Google Scholar]
- 71. Kovács T. (2004) Mechanisms of olfactory dysfunction in aging and neurodegenerative disorders. Ageing Res. Rev. 3, 215–232 10.1016/j.arr.2003.10.003 [DOI] [PubMed] [Google Scholar]
- 72. Christen-Zaech S., Kraftsik R., Pillevuit O., Kiraly M., Martins R., Khalili K., and Miklossy J. (2003) Early olfactory involvement in Alzheimer's disease. Can. J. Neurol. Sci. 30, 20–25 10.1017/S0317167100002389 [DOI] [PubMed] [Google Scholar]
- 73. Price J. L., Davis P. B., Morris J. C., and White D. L. (1991) The distribution of tangles, plaques and related immunohistochemical markers in healthy aging and Alzheimer's disease. Neurobiol. Aging 12, 295–312 10.1016/0197-4580(91)90006-6 [DOI] [PubMed] [Google Scholar]
- 74. Carson K. A., Geula C., and Mesulam M. M. (1991) Electron microscopic localization of cholinesterase activity in Alzheimer brain tissue. Brain Res. 540, 204–208 10.1016/0006-8993(91)90508-S [DOI] [PubMed] [Google Scholar]
- 75. Holtzman D. M., Bales K. R., Tenkova T., Fagan A. M., Parsadanian M., Sartorius L. J., Mackey B., Olney J., McKeel D., Wozniak D., and Paul S. M. (2000) Apolipoprotein E isoform-dependent amyloid deposition and neuritic degeneration in a mouse model of Alzheimer's disease. Proc. Natl. Acad. Sci. U.S.A. 97, 2892–2897 10.1073/pnas.050004797 [DOI] [PMC free article] [PubMed] [Google Scholar]
- 76. Brettschneider J., Del Tredici K., Lee V. M., and Trojanowski J. Q. (2015) Spreading of pathology in neurodegenerative diseases: a focus on human studies. Nat. Rev. Neurosci. 16, 109–120 10.1038/nrn3887 [DOI] [PMC free article] [PubMed] [Google Scholar]
- 77. Morales R., Duran-Aniotz C., Castilla J., Estrada L. D., and Soto C. (2012) De novo induction of amyloid-β deposition in vivo. Mol. Psychiatry 17, 1347–1353 10.1038/mp.2011.120 [DOI] [PubMed] [Google Scholar]
- 78. Kane M. D., Lipinski W. J., Callahan M. J., Bian F., Durham R. A., Schwarz R. D., Roher A. E., and Walker L. C. (2000) Evidence for seeding of β-amyloid by intracerebral infusion of Alzheimer brain extracts in β-amyloid precursor protein-transgenic mice. J. Neurosci. 20, 3606–3611 10.1523/JNEUROSCI.20-10-03606.2000 [DOI] [PMC free article] [PubMed] [Google Scholar]
- 79. Baker H. F., Ridley R. M., Duchen L. W., Crow T. J., and Bruton C. J. (1993) Evidence for the experimental transmission of cerebral β-amyloidosis to primates. Int. J. Exp. Pathol. 74, 441–454 [PMC free article] [PubMed] [Google Scholar]
- 80. Fishman E. B., Siek G. C., MacCallum R. D., Bird E. D., Volicer L., and Marquis J. K. (1986) Distribution of the molecular forms of acetylcholinesterase in human brain: alterations in dementia of the Alzheimer type. Ann. Neurol. 19, 246–252 10.1002/ana.410190305 [DOI] [PubMed] [Google Scholar]
- 81. Atack J. R., Perry E. K., Bonham J. R., Perry R. H., Tomlinson B. E., Blessed G., and Fairbairn A. (1983) Molecular forms of acetylcholinesterase in senile dementia of Alzheimer type: selective loss of the intermediate (10S) form. Neurosci. Lett. 40, 199–204 10.1016/0304-3940(83)90302-6 [DOI] [PubMed] [Google Scholar]
- 82. Schegg K. M., Harrington L. S., Neilsen S., Zweig R. M., and Peacock J. H. (1992) Soluble and membrane-bound forms of brain acetylcholinesterase in Alzheimer's disease. Neurobiol. Aging 13, 697–704 10.1016/0197-4580(92)90092-C [DOI] [PubMed] [Google Scholar]
- 83. Shen C. L., and Murphy R. M. (1995) Solvent effects on self-assembly of β-amyloid peptide. Biophys. J. 69, 640–651 10.1016/S0006-3495(95)79940-4 [DOI] [PMC free article] [PubMed] [Google Scholar]
- 84. Sreerama N., and Woody R. W. (2000) Estimation of protein secondary structure from circular dichroism spectra: comparison of CONTIN, SELCON, and CDSSTR methods with an expanded reference set. Anal. Biochem. 287, 252–260 10.1006/abio.2000.4880 [DOI] [PubMed] [Google Scholar]
- 85. Bolte S., and Cordelières F. P. (2006) A guided tour into subcellular colocalization analysis in light microscopy. J. Microsc. 224, 213–232 10.1111/j.1365-2818.2006.01706.x [DOI] [PubMed] [Google Scholar]
Associated Data
This section collects any data citations, data availability statements, or supplementary materials included in this article.