Supplemental digital content is available in the text.
Key Words: optimization in CT, pediatric head and body CT, automatic tube current modulation, automatic tube voltage selection, image quality
Abstract
Objectives
The aim of this study was to investigate the effects of a modern automatic tube current modulation (ATCM) and automatic tube voltage selection (ATVS) system on radiation dose and image quality in pediatric head, and torso computed tomography (CT) examinations for various clinical indications.
Materials and Methods
Four physical anthropomorphic phantoms that represent the average individual as neonate, 1-year-old, 5-year-old, and 10-year-old child were used. Standard head, thorax, and abdomen/pelvis acquisitions were performed with (1) fixed tube current, (2) ATCM, and (3) ATVS. Acquisitions were performed at various radiation dose levels to generate images at different levels of quality. Reference volume CT dose index (CTDIvol), reference image noise, and reference contrast-to-noise ratios were determined. The potential dose reductions with ATCM and ATVS were assessed.
Results
The percent reduction of CTDIvol with ATCM ranged from 8% to 24% for head, 16% to 39% for thorax, and 25% to 41% for abdomen/pelvis. The percent reduction of CTDIvol with ATVS varied on the clinical indication. In CT angiography, ATVS resulted to the highest dose reduction, which was up to 70% for head, 77% for thorax, and 34% for abdomen/pelvis. In noncontrast examinations, ATVS increased dose by up to 21% for head, whereas reduced dose by up to 34% for thorax and 48% for abdomen/pelvis.
Conclusions
In pediatric CT, the use of ATCM significantly reduces radiation dose and maintains image noise. The additional use of ATVS reduces further the radiation dose for thorax and abdomen/pelvis, and maintains contrast-to-noise ratio for the specified clinical diagnostic task.
Computed tomography (CT) imaging at 70 to 100 kVp enables a significant reduction of patient radiation dose and a substantial increase of image contrast compared with standard 120 kVp examination protocols, particularly in CT angiographic studies and in individuals with a small body habitus, such as pediatric patients.1–7 However, it is well known that low kVp is not widely used in pediatric CT.8 Scanning at a low kVp inherently increases image noise, and to compensate for this increase, the tube current (mA) needs to be adjusted accordingly. To determine the optimal combination between kVp and mA for a specific patient size and diagnostic procedure is a difficult task.9
Computed tomography manufacturers have developed automatic exposure control (AEC) systems that enable automatic tube current modulation (ATCM). Automatic exposure control systems tailor the mA on the basis of each patient's body habitus and aim to generate images of diagnostic quality at the minimum possible radiation dose.5,10–13 Recently, CT vendors have evolved AEC systems by integrating ATCM with automatic tube voltage selection (ATVS) algorithms that allow for automatic selection of kVp and mA settings that deliver images of a specified contrast-to-noise ratio (CNR) at different clinical diagnostic tasks. Recent studies performed in adult patients have reported that ATVS systems can substantially reduce radiation dose across most body regions and types of examinations.14–18 No published data exist on the effect of ATVS on radiation dose and image quality in pediatric CT examinations.
The purpose of this study was to investigate the effect of a modern ATCM- and ATVS-based AEC system on radiation dose and image quality in pediatric head, thorax, and abdomen/pelvis CT examinations at various clinical diagnostic tasks.
MATERIALS AND METHODS
Anthropomorphic Phantoms
Four physical anthropomorphic phantoms (ATOM Phantoms; CIRS, Norfolk, VA) that represent the average pediatric individual as neonate, 1-year-old, 5-year-old, and 10-year-old were used (Fig. 1). The phantoms are manufactured by radiologically tissue-equivalent material, and their composition includes artificial skeleton, brain, lung, and soft tissue formulated for accurate simulation of x-ray examinations.
FIGURE 1.
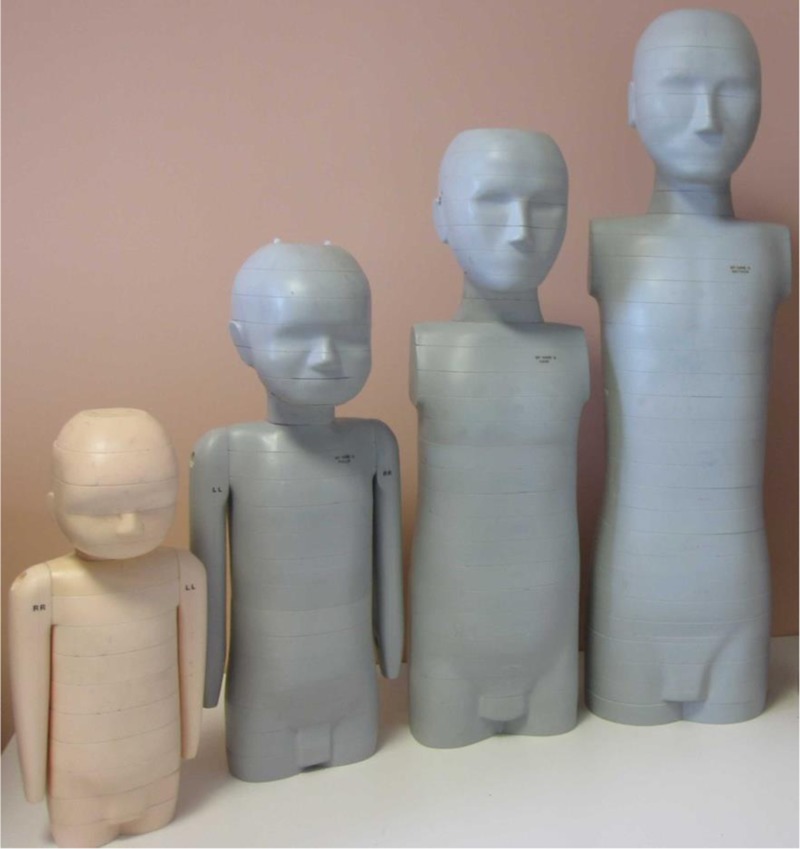
Shown from left to right are the neonate, 1-year-old, 5-year-old, and 10-year-old phantoms. Height and weight values are 51 cm and 3.5 kg for neonate, 75 cm and 10 kg for 1-year-old, 110 cm and 19 kg for 5-year-old, 140 cm and 32 kg for 10-year-old. The skeleton of each phantom is formulated with bone-equivalent materials based on the appropriate bone composition typical of each age.
Automatic Tube Voltage Selection: CT System and Method
Computed tomography acquisitions were performed on a modern 64-detector CT scanner (Revolution GSI; GE Medical Systems, Wisconsin). This scanner is equipped with a state-of-the-art ATVS system (kV Assist, GE Medical Systems). This system constitutes an automatic attenuation-based kVp selection algorithm that provides the lowest radiation dose among 80, 100, 120, and 140 kVp by taking into account the x-ray attenuation of each patient's body and the diagnostic task of the examination. The algorithm operates in combination with the ATCM system (Auto mA, Smart mA, GE Medical Systems), which modulates the mA along z-axis and in x-y plane on the attenuation profiles obtained from patient's anterior-posterior and lateral scout views. The algorithm first determines the anticipated CNR for the anatomy of interest using the exposure parameters prescribed by the reference examination protocol (REP).19 The algorithm then automatically selects the kVp, mA settings that result to similar CNR at the lowest CTDIvol. Automatic kVp selection is based on 2 operator-defined parameters: (a) the Noise Index (NI) and (b) the clinical mode. The NI is an mA modulation-related parameter, which allows the operator to determine the amount of noise that will be present in the reconstructed images.20 The clinical mode allows the operator to define the required image contrast on the anatomy of interest, based on the diagnostic task of the examination. Four different clinical mode options are available, which correspond to different levels of image contrast and different levels dose compared with REP (Table 1).
TABLE 1.
The Four Clinical Mode Options

CT Examination Protocols
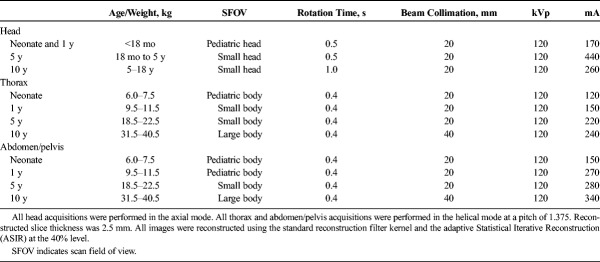
Head, thorax, and abdomen/pelvis acquisitions were performed (Fig. 2). Phantoms were accurately aligned with the gantry isocenter, while in the supine position. Each phantom was scanned using protocols A, B, and C. In protocol A, the scanning parameters recommended by the REPs for pediatric patients were used (Table 2).19 By default, these protocols are performed with ATCM and ATVS deactivated. Moreover, by default, these protocols are designed to generate images using the standard filtered back projection (FBP) algorithm. To exploit the potential of iterative reconstruction in generating images at a lower noise compared with FBP, the adaptive statistical iterative reconstruction (ASIR) algorithm was activated in all examination protocols. The scanner reported CTDIvol value at each REP was then downscaled using the “inverse square route of image noise” relationship  , so that images generated with ASIR and FBP were at the same noise level.
FIGURE 2.
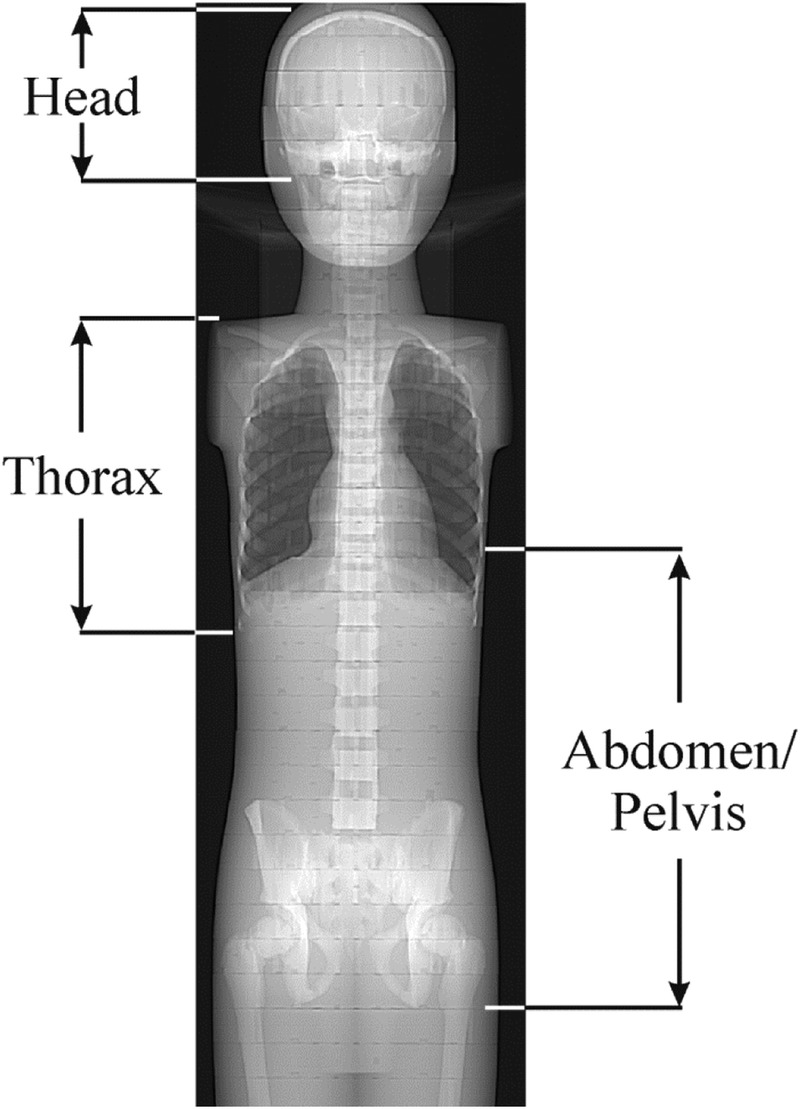
The boundaries of the examined anatomical regions on an anterior-posterior scout view of the 10-year-old phantom.
TABLE 2.
Protocol A: Reference Examination Protocols With Acquisition and Reconstruction Parameters for Head, Thorax, and Abdomen/Pelvis Pediatric Routine CT Examinations
In protocol B, ATCM was activated. To investigate the effect of ATCM on radiation dose and image noise, consecutive acquisitions were performed with the NI ranging from 3 to 8 for head and 9 to 15 for thorax and abdomen/pelvis. In protocol C, ATVS was additionally activated. To investigate the effect of clinical mode on radiation dose and image contrast, acquisitions were performed at all clinical modes. Besides, at each clinical mode, consecutive acquisitions were performed with the NI ranging from 3 to 8 for head and 9 to 15 for thorax and abdomen/pelvis.
Three cylindrical plastic vials (diameter, 10 mm; volume, 5 mL) containing iodine contrast (Iopamiro 370; Bracco Imaging, Italy) diluted with pure water at 2.5, 5, and 10 mg I/mL were prepared. These vials along with one vial containing pure water were accommodated at the posterior surface of each phantom at the level of the eyes for head, heart for thorax, and middle abdomen for abdomen/pelvis (Fig. 3).
FIGURE 3.
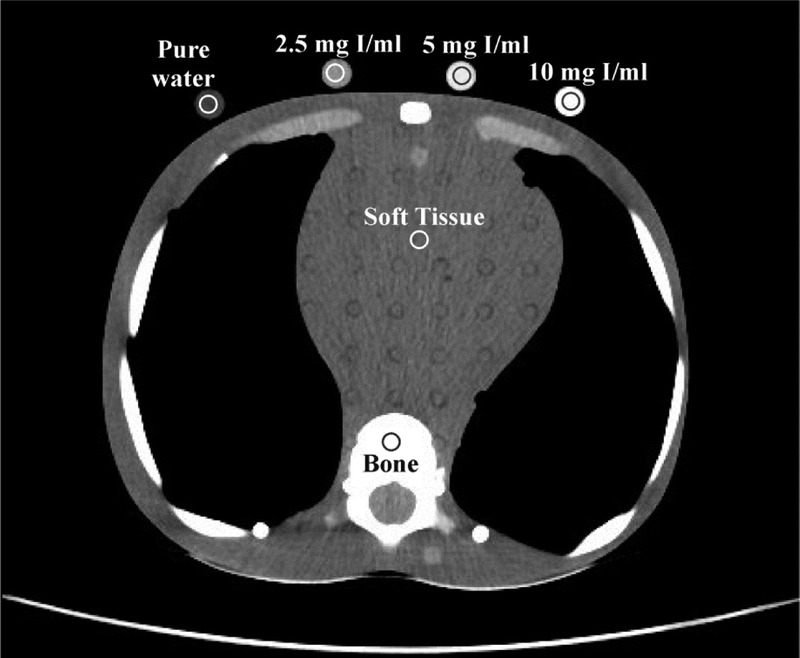
An axial slice depicting thorax of the 10-year-old phantom. Shown are the ROIs drawn over soft tissue, bone, and iodinated and pure water vials at the axial plane depicting the middle heart level. All but bone ROIS were 70 mm2 in size. Bone ROIs were 20 mm2 in size. Protocol acquisition parameters for slice shown; clinical mode: CTA, 100 kVp, NI: 11.7, slice thickness 2.5 mm, CTDIvol 2.67 mGy.
Quantitative Image Quality Assessment
Circular regions of interest (ROIs) were manually drawn on uniform brain-equivalent areas for head, and soft tissue-equivalent areas for torso. Regions of interest were also drawn on bone-equivalent areas (Fig. 3). Regions of interest were drawn at the axial level superior to eyes for head, the middle heart level for thorax, and the middle abdomen level for abdomen/pelvis. The mean Hounsfield unit (HU) value obtained from each ROI was recorded. Image noise was measured as the standard deviation (SD) of the mean HU. Mean HU and SD were recorded from acquisitions performed with protocols A, B at all NIs, and C at all clinical modes and NIs. To reduce measurement error, each parameter was measured 3 times on 3 consecutive image slices.
The CNR of iodine (CNRI) was calculated as: CNRI = (HUI − HUST)/SDST, where HUI is the mean HU measured in 3 iodinated vials, HUST is the mean HU in brain or soft tissue equivalent areas, and SDST is corresponding image noise. The CNR of bone (CNRB) was calculated as: CNRB = (HUB − HUST)/SDST, where HUB is the mean HU in bone equivalent areas. The CNR of soft tissue (CNRST) was calculated as: CNRST = (HUST − HUw)/SDw, where HUw is the mean HU in the pure water vial, and SDw is the corresponding image noise. Quantitative image analysis was performed using the ImageJ image analysis software (1.52d; National Institutes of Health, Maryland).
Protocol B: The Effect of ATCM on Reference NI, Reference CNR, and Reference Radiation Dose
To investigate the effect of user-defined NI on image noise, NI versus image noise linear fits were generated. The fitting parameters were used to estimate the NI that generates images at a noise equal to images obtained with protocol A. This NI is designated hereafter as ATCM-reference NI ( ).
).
CNRI, CNRB, and CNRST were calculated at all NIs. Polynomial fits of CNRI, CNRB, and CNRST versus NI were generated. The fitting parameters were used to estimate the CNRI, CNRB, and CNRST values for the  determined previously. These values are designated hereafter as
  , and
, and  , respectively.
To calculate the percent radiation dose difference between protocols A and B (%DAB), the following equation was applied:
Formula.

where ACTDIvol is the CTDIvol value prescribed by protocol A, and  is the CTDIvol prescribed by protocol B at
  .
.
Protocol C: The Effect of ATVS on Reference NI and Reference Radiation Dose
CNRI versus NI in CTA, CNRB versus NI in BONE, CNRI versus NI in C+, and CNRST versus NI in C− were calculated at all NIs. Polynomial fits of NI versus CNRI, CNRB, and CNRST were generated. The fitting parameters were used to estimate the NI for the ,
,  , and
, and  values described previously. These NIs are designated hereafter as ATVS-reference NI for “CTA” (
 ), “Bone” (
 ), “C+” (
 ), and “C−” (
 ).
).
At each clinical mode, polynomial fits of CTDIvol versus NI were generated. The fitting parameters were used to estimate the CTDIvol at the ATVS-reference NI values described previously.
To calculate the percent dose difference between protocols A and C (%DAC), the following equation was applied:
Formula.

where CCTDIvol is the CTDIvol prescribed by protocol C at the ith clinical mode, and kVp,
  values that generate images of a similar CNR to images with protocol A.
Statistical Analysis
Noise Index was linearly correlated to image noise. Association between CNR and NI and between CTDIvol and NI was determined using polynomial fitting. Correlation coefficients and P values were used to evaluate goodness of fit. All statistical computations were processed using MedCalc software package (Med-Calc Software, Ostend, Belgium).
RESULTS
Protocol A
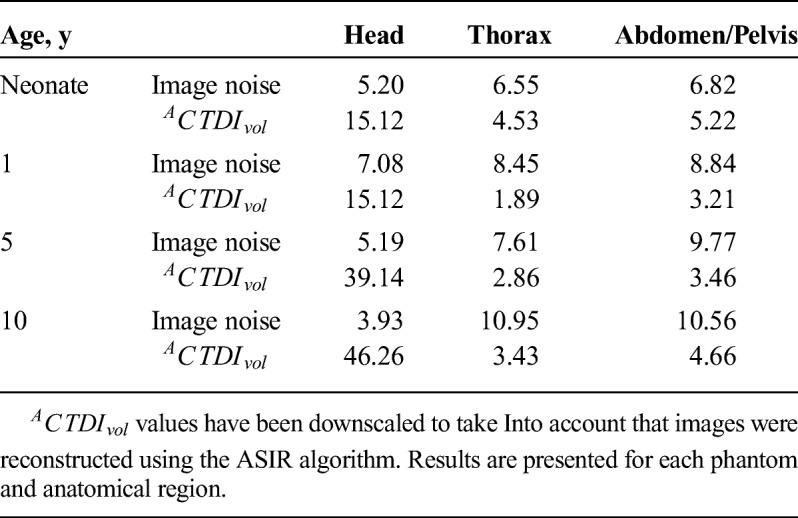
Measured image noise in acquisitions with protocol A ranged across phantoms from 3.93 to 7.08 for head, 6.55 to 10.95 for thorax, and 6.82 to 10.56 for abdomen/pelvis. ACTDIvol ranged from 15.12 mGy to 46.26 mGy for head, 1.89 mGy to 4.53 mGy for thorax, and 3.21 mGy to 5.22 mGy for abdomen/pelvis (Table 3).
TABLE 3.
Measured Mean Image Noise and Corresponding ACTDIvol for Reference Examination Protocol (Protocol A)
Protocol B
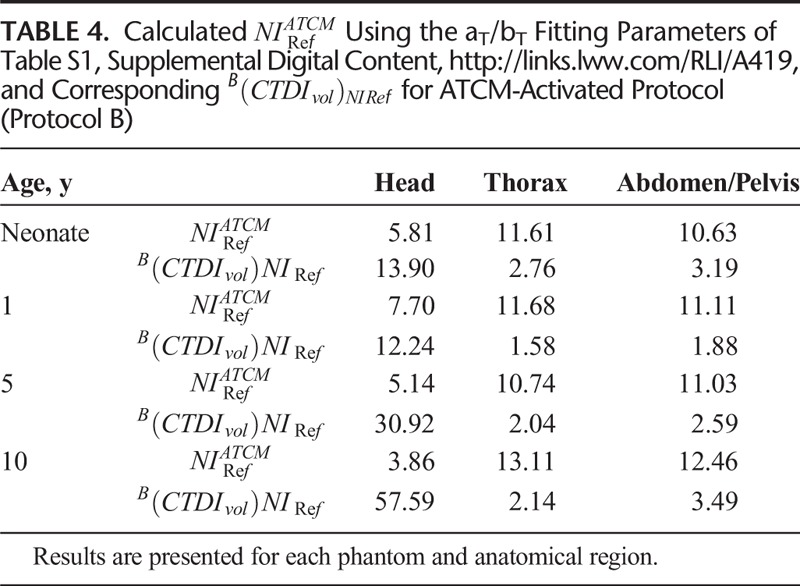
Measured image noise correlated strongly with NI across all phantoms and anatomical regions (Fig. 4, Table S1, Supplemental Digital Content, http://links.lww.com/RLI/A419). However, image noise tended to be lower than NI. This trend was more pronounced for thorax and abdomen. Typically, at NI equal to 15, image noise was 8.98 for thorax and 11.31 for abdomen/pelvis for neonate. Calculated  values in protocol B that generate images of similar noise to images in protocol A ranged from 3.86 to 5.81 for head, 10.74 to 13.11 for thorax, and 10.63 to 12.46 for abdomen/pelvis (Table 4). B(CTDIvol)NIRef recorded from acquisitions performed at
  , ranged from 12.24 mGy to 57.59 for head, 1.58 mGy to 2.76 mGy for thorax, and 1.88 mGy to 3.49 mGy for abdomen/pelvis (Table 4).
FIGURE 4.
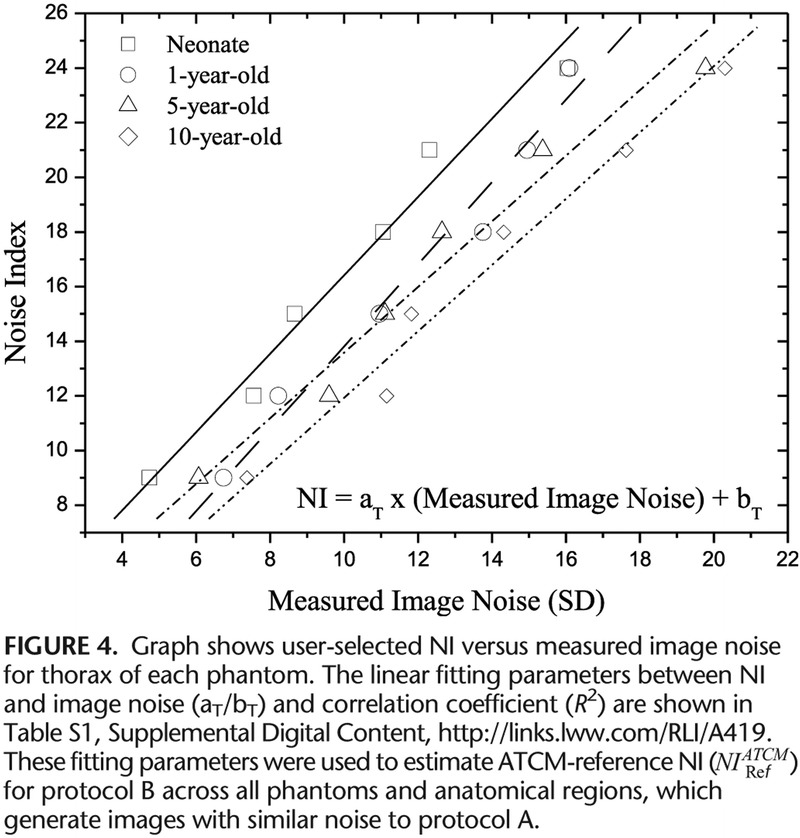
Graph shows user-selected NI versus measured image noise for thorax of each phantom.
TABLE 4.
CNRI, CNRB, and CNRST correlated strongly and decreased with NI (Fig. 5, Table S2, Supplemental Digital Content, http://links.lww.com/RLI/A419).  , and
, and  , estimated using the aS, bS fitting parameters of Table S2, Supplemental Digital Content, http://links.lww.com/RLI/A419, are reported in Table 5.
FIGURE 5.
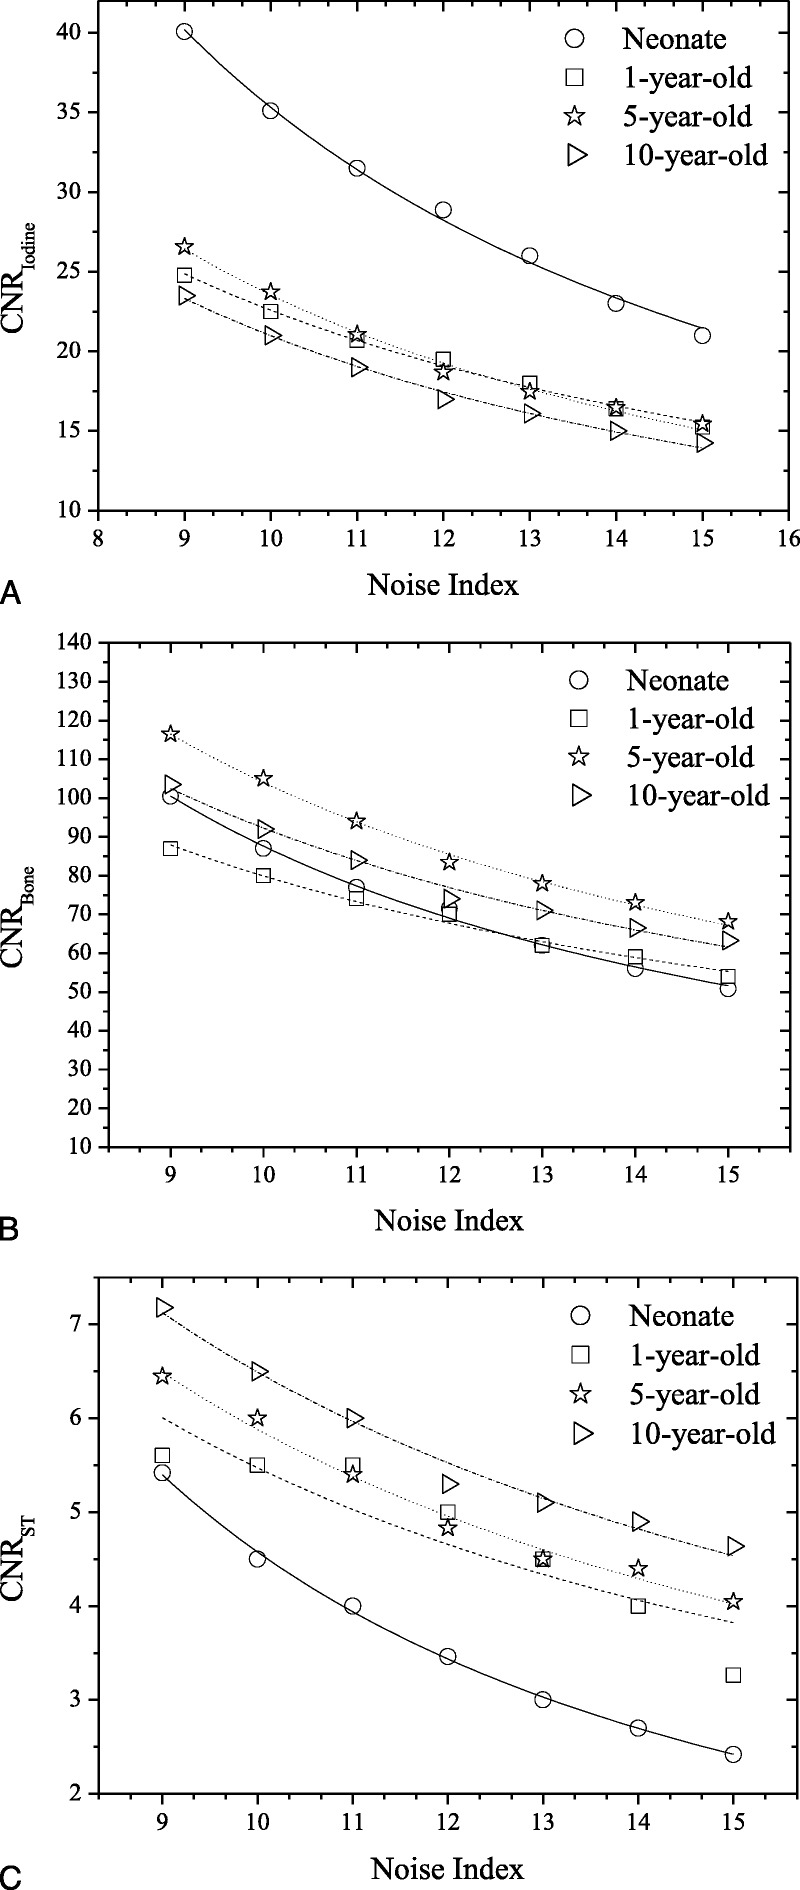
Protocol B: Graphs show CNRI versus NI (A), CNRB versus NI (B), and CNRST versus NI (C) across phantoms for thorax anatomical region. Association between CNR and Noise Index was determined using polynomial fitting as CNR = aS × NIbs. αS/bS, R2 fitting parameters for all phantoms and anatomical regions are tabulated in Table S2, Supplemental Digital Content, http://links.lww.com/RLI/A419.
TABLE 5.
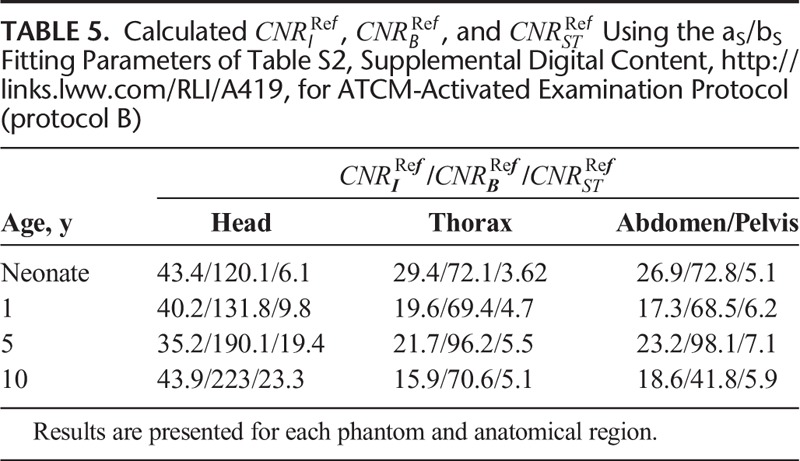
Percent dose difference (%DAB) between protocols A and B, across all phantoms and anatomical regions, are reported in Table 6.
TABLE 6.
Percent Dose Difference (%DAB) Between Reference Examination Protocol (Protocol A) and ATCM-Activated Acquisitions (Protocol B) for Each Phantom and Anatomical Region

Protocol C
User-selected NI in protocol C correlated strongly and decreased with CNRI, CNRB, and CNRST at all clinical modes, and across all phantoms and anatomical regions (Fig. 6 and Table S3, Supplemental Digital Content, http://links.lww.com/RLI/A419). Calculated  ,
,  , and
, and  values that generate images of similar contrast to corresponding acquisitions of protocol B, are reported in Table 7. These values were calculated using the aK, bK, fitting parameters of Table S3, Supplemental Digital Content, http://links.lww.com/RLI/A419, and the
  , and
, and  values of Table 5.
FIGURE 6.
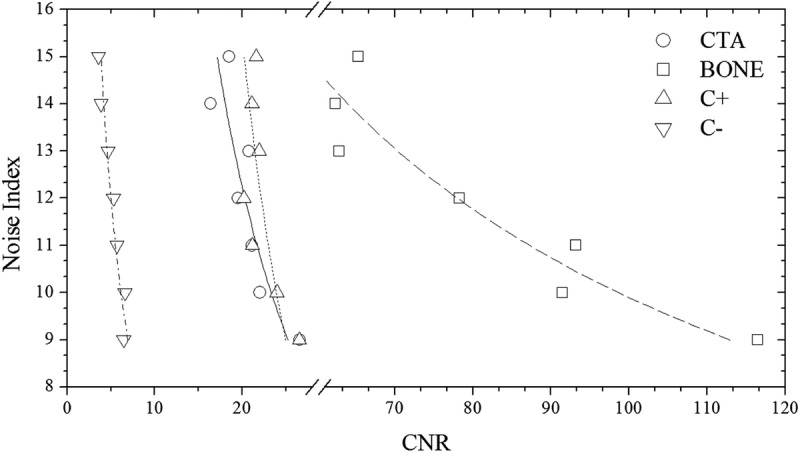
Protocol C: Graph shows user selected NI versus CNRI for CTA, CNRB for BONE, CNRI for C+, and CNRST for C− clinical mode in thorax ATVS-activated acquisitions of the 5-year-old phantom. Association between NI and CNR was determined using polynomial fitting as NI = aK × CNR−bK. αK/bK, R2 fitting parameters for all phantoms, and anatomical regions are tabulated in Table S3, Supplemental Digital Content, http://links.lww.com/RLI/A419.
TABLE 7.

The ATVS-recommended kVp at each clinical mode varied on the user-selected NI. The ATVS-recommended kVp at the  ,
,  , and
, and  values of Table 7 are reported in Table 8. In neonate, 80 kVp was recommended at all clinical modes and anatomical regions. In 1-year-old, 80 kVp was recommended most often, whereas 100 kVp was recommended in C+ and C− of head and abdomen/pelvis. In 5-year-old, 100 kVp was recommended most often, whereas 120 kVp was recommended in C+ and C− of head. In 10-year-old, 100 kVp was recommended in CTA, BONE, and C+ of thorax and abdomen/pelvis, and 120 kVp was recommended at all clinical modes of head and C− of thorax and abdomen/pelvis.
TABLE 8.

CTDIvol in protocol C correlated strongly and decreased with NI at all clinical modes, and across all phantoms and anatomical regions (Fig. 7 and Table S4, Supplemental Digital Content, http://links.lww.com/RLI/A419). These aM, bM fitting parameters were used to calculate the  at the ATVS-reference NI (Table 9). In CTA, calculated
  ranged from 7.86 to 33.54 mGy for head, 0.61 to 1.26 mGy for thorax, and 0.87 to 2.67 mGy for abdomen/pelvis. In BONE, calculated
  ranged from 11.79 to 52.27 for head, 0.88 to 1.69 mGy for thorax, and 0.69 to 2.21 mGy for abdomen/pelvis. In C+, calculated
  ranged from 10.66 to 33.07 mGy for head, 0.54 to 1.47 mGy for thorax, and 0.85 to 2.57 mGy for abdomen/pelvis. In C−, calculated
  ranged from 15.87 to 55.97 mGy for head, 1.57 to 3.71 mGy for thorax, and 1.67 to 3.86 mGy for abdomen/pelvis.
FIGURE 7.
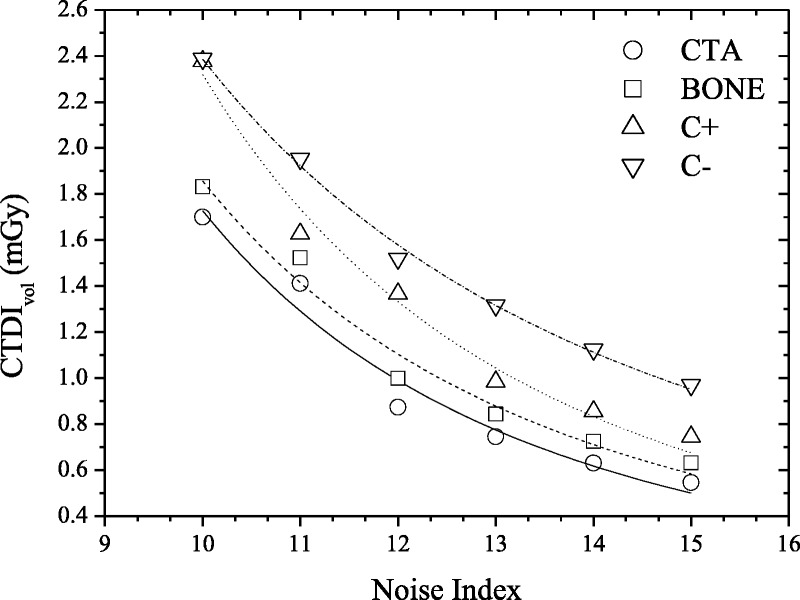
Protocol C: Graph shows CTDIvol versus user-selected Noise Index for CTA, BONE, C+, and C− clinical mode in thorax ATVS-activated acquisitions of the 5-year-old phantom. Association between CTDIvol and Noise Index was determined using polynomial fitting as NI = aM × CNR−bM. αM/bM, R2 fitting parameters for all phantoms, and anatomical regions are tabulated in Table S4, Supplemental Digital Content, http://links.lww.com/RLI/A419.
TABLE 9.

Percent dose difference (%DAC) between protocols A and C, across all phantoms and anatomical regions, are reported in Table 10.
TABLE 10.
Percent Dose Difference (%DAC) Between Reference Examination Protocol (Protocol A) and ATVS-Activated Acquisitions (Protocol C) for Each Phantom and Anatomical Region

DISCUSSION
This work presents data on radiation dose when modern ATCM and ATVS systems are activated in routine head and torso pediatric CT examinations. Our results on activation of ATCM demonstrate a dose reduction of up to 24% for head, 39% for thorax, and 41% for abdomen/pelvis compared with the REPs. Furthermore, our results on the additional activation of ATVS demonstrate a dose reduction, which varied on the clinical diagnostic task. CTA resulted to the highest dose reduction, which was up to 70% for head, 77% for thorax, and 76% for abdomen/pelvis compared with the REPs. This is owing to the increased iodine contrast at lower kVp. The increased contrast allows for higher noise levels to be tolerated, which in turn enable a substantial dose reduction. BONE resulted to a dose reduction, which was up to 22% for head, 66% for thorax, and 85% for abdomen/pelvis. C+ resulted to a dose reduction of up to 46% for head, 71% for thorax, and 79% abdomen/pelvis. In contrast-enhanced soft tissue examinations, such as chest or portal venous phase abdominal CT, detection and characterization of tissue lesions require a lower noise level compared with CTA studies. C− resulted to a dose increase of up to 21% for head and a dose reduction of up to 34% for thorax and 48% for abdomen/pelvis. In noncontrast examinations, the tolerated image noise might be even less compared with contrast-enhanced studies. Thus, the kVp and NI settings recommended by the ATVS system for thorax and abdomen/pelvis result to a lower dose reduction compared with contrast-enhanced studies. It is not known, however, why dose was increased in head acquisitions. Possible explanation might be that increased modulated mA values are required in that clinical mode to counterbalance the low inherent  in the brain. This merits further clinical investigation into whether ATVS might be applicable to pediatric noncontrast head CT examinations.
Several studies have demonstrated the advantages of using ATVS in body CT examinations of adult patients. Spearman et al15 on a multicenter study have shown that ATVS reduces radiation exposure by up to 56% in temporal bone CT and that dose reduction is profound in CT angiographic studies. Layritz et al17 have shown that the use of ATVS in coronary CTA reduces radiation dose by 39%, and Lee et al21 have reported that the use of ATCM and ATVS in contrast-enhanced liver CT of adults reduce radiation dose by up to 31%. In a study performed by Siegel et al22 on the effect of ATVS on radiation dose in pediatric contrast-enhanced thoracoabdominal CT, a dose reduction of 27% has been reported. Furthermore, Siegel et al23 have used 3 small-sized semianthropomorphic phantoms to investigate the effect of ATVS on radiation dose in pediatric abdominal CTA examinations. Radiation dose was reduced by 31%, 36%, and 44% for the small, medium, and large phantoms, respectively. The above studies have been reporting results using an ATVS system available from a single only vendor (Siemens Healthcare). To our knowledge, scarce data are available on the use of ATVS used by other CT vendors. Li et al14 have recently shown that ATVS in contrast-enhanced adult chest CT examinations results to a dose reduction of 31% without affecting image quality. Another important approach to reduce pediatric radiation dose is tin filtering. Weis et al24 have suggested that the use of additional tin filtering at 100 kVp significantly reduces radiation dose compared with 70 kVp and therefore should be preferred in non–contrast-enhanced pediatric chest CT, particularly when the main focus is evaluation of lung parenchyma.
A major contribution of this work is that we have determined the  values in ATCM-activated acquisitions that produce images of comparable noise to the images derived from the REPs (Table 4). To our knowledge, there is no published data on the effect of ATCM, which is based on the NI concept, on radiation dose, and image quality in pediatric CT. In NI-based ATCM, a higher NI will generate images of more noise, and CT acquisition will be performed at a lower mA, whereas a lower NI will generate images of less noise, and CT acquisition will be performed at a higher mA compared with the REP. Computed tomography operators may use the
  values of Table 4 to generate images at a comparable noise and at a substantially reduced dose compared with the corresponding REP (Table 6).
One further major contribution of this work is that we have determined the  in ATVS-activated acquisitions that produce images of comparable CNR to the images derived from the REPs (Table 7).
  values are proposed for each clinical imaging diagnostic task. When CT operators are asked to activate ATVS for a specific diagnostic task, they should input a
  value. To our knowledge, there is no published data on what NI values should operators use in ATVS-activated acquisitions of pediatric CT. Moreover, there is no published data on the effect of
  on radiation dose and image quality for different clinical diagnostic tasks. Computed tomography operators may use the
  (Table 7) to generate images at a comparable CNR and at substantially reduced dose compared with the REP (Table 10).
One limitation of this study was that we did not verify our results in the clinical practice. However, it is not feasible to perform repetitive exposures to the same patient because of ethical issues. Moreover, a large number of patients are required to cover ages from newborns to adolescents to make interindividual comparisons. The physical anthropomorphic phantoms used herein facilitate the investigation of the effect of acquisition parameters on image quality and radiation dose in the same subject without considering ethical issues. Moreover, image quality was assessed only on the basis of objective quality measures. A subjective evaluation of the image quality from experienced radiologists would add useful input on the verification of the proposed  and
and  values. Scanning at 70 kVp has also been shown to reduce pediatric radiation dose compared with 80 kVp.25 However, the technology of the scanner used herein did not allow acquisition at this tube potential. The results presented herein refer to a single vendor and 4 clinical diagnostic tasks. It would be very interesting to apply the methodology presented in this study on scanners developed by other CT manufacturers and on more clinical diagnostic settings.
In conclusion, we have shown that the use of ATCM in pediatric head and torso CT reduces radiation dose without impairing image noise. The use of ATVS for a specified clinical diagnostic task reduces further radiation dose without impairing CNR. We suggest that ATCM should be activated in all pediatric examinations. Moreover, ATVS should be activated in all but head noncontrast examinations. The current results highlight the importance of using the ATCM and ATVS tools in the clinical routine for dose optimization in pediatric CT.
Supplementary Material
Footnotes
Conflicts of interest and sources of funding: This project has received funding from the Euratom research and training program 2014–2018 under grant agreement No. 755523 (MEDIRAD). The funding source had no role in study design, in the collection, analysis, and interpretation of data, nor in the writing or submission of the report.
Supplemental digital contents are available for this article. Direct URL citations appear in the printed text and are provided in the HTML and PDF versions of this article on the journal’s Web site (www.investigativeradiology.com).
REFERENCES
- 1.Schindera ST, Nelson RC, Mukundan S, Jr., et al. Hypervascular liver tumors: low tube voltage, high tube current multi-detector row CT for enhanced detection-phantom study. Radiology. 2008;246:125–132. [DOI] [PubMed] [Google Scholar]
- 2.Siegel MJ, Schmidt B, Bradley D, et al. Radiation dose and image quality in pediatric CT: effect of technical factors and phantom size and shape. Radiology. 2004;233:515–522. [DOI] [PubMed] [Google Scholar]
- 3.Yu L, Bruesewitz MR, Thomas KB, et al. Optimal tube potential for radiation dose reduction in pediatric CT: principles, clinical implementations, and pitfalls. Radiographics. 2011;31:835–848. [DOI] [PubMed] [Google Scholar]
- 4.Funama Y, Awai K, Nakayama Y, et al. Radiation dose reduction without degradation of low-contrast detectability at abdominal multisection CT with a low-tube voltage technique: phantom study. Radiology. 2005;237:905–910. [DOI] [PubMed] [Google Scholar]
- 5.Papadakis AE, Perisinakis K, Raissaki M, et al. Effect of x-ray tube parameters and iodine concentration on image quality and radiation dose in cerebral pediatric and adult CT angiography: a phantom study. Invest Radiol. 2013;48:192–199. [DOI] [PubMed] [Google Scholar]
- 6.Kim H, Goo JM, Kang CK, et al. Comparison of iodine density measurement among dual-energy computed tomography scanners from 3 vendors. Invest Radiol. 2018;53:321–327. [DOI] [PubMed] [Google Scholar]
- 7.Faggioni L, Gabelloni M. Iodine concentration and optimization in computed tomography angiography: current issues. Invest Radiol. 2016;51:816–822. [DOI] [PubMed] [Google Scholar]
- 8.Arch ME, Frush DP. Pediatric body MDCT: a 5-year follow-up survey of scanning parameters used by pediatric radiologists. Am J Roentgenol. 2008;191:611–617. [DOI] [PubMed] [Google Scholar]
- 9.Yu L, Li H, Fletcher JG, et al. Automatic selection of tube potential for radiation dose reduction in CT: a general strategy. Med Phys. 2010;37:234–243. [DOI] [PubMed] [Google Scholar]
- 10.Kalra MK, Maher MM, Toth TL, et al. Comparison of Z-axis automatic tube current modulation technique with fixed tube current CT scanning of abdomen and pelvis. Radiology. 2004;232:347–353. [DOI] [PubMed] [Google Scholar]
- 11.Papadakis AE, Perisinakis K, Oikonomou I, et al. Automatic exposure control in pediatric and adult computed tomography examinations can we estimate organ and effective dose from mean mAs reduction? Invest Radiol. 2011;46:654–662. [DOI] [PubMed] [Google Scholar]
- 12.van Straten M, Deak P, Shrimpton PC, et al. The effect of angular and longitudinal tube current modulations on the estimation of organ and effective doses in x-ray computed tomography. Med Phys. 2009;36:4881–4889. [DOI] [PubMed] [Google Scholar]
- 13.Papadakis AE, Perisinakis K, Damilakis J. Automatic exposure control in CT: the effect of patient size, anatomical region and prescribed modulation strength on tube current and image quality. Eur Radiol. 2014;24:2520–2531. [DOI] [PubMed] [Google Scholar]
- 14.Li M, Feng S, Wu N, et al. Scout-based automated tube potential selection technique (kV Assist) in enhanced chest computed tomography: effects on radiation exposure and image quality. J Comput Assist Tomogr. 2017;41:442–445. [DOI] [PubMed] [Google Scholar]
- 15.Spearman J, Schoepf U, Rottenkolber M, et al. Effect of automated attenuation-based tube voltage selection on radiation dose at CT: an observational study on a global scale. Radiology. 2016;279:167–174. [DOI] [PubMed] [Google Scholar]
- 16.Winklehner A, Goetti R, Baumueller S, et al. Automated attenuation-based tube potential selection for thoracoabdominal computed tomography angiography: improved dose effectiveness. Invest Radiol. 2011;46:767–773. [DOI] [PubMed] [Google Scholar]
- 17.Layritz C, Muschiol G, Flohr T, et al. Automated attenuation-based selection of tube voltage and tube current for coronary CT angiography: reduction of radiation exposure versus a BMI-based strategy with an expert investigator. J Cardiovasc Comput Tomogr. 2013;7:303v310. [DOI] [PubMed] [Google Scholar]
- 18.Gonzalez-Guindalini FD, Ferreira Botelho MP, Töre HG, et al. MDCT of chest, abdomen, and pelvis using attenuation-based automated tube voltage selection in combination with iterative reconstruction: an intrapatient study of radiation dose and image quality. Am J Roentgenol. 2013;201:1075–1082. [DOI] [PubMed] [Google Scholar]
- 19.Reference protocol guide 5507116-1EN. Revision: 1. In: GE Healthcare. 2014.
- 20.Technical reference manual, 5507106-1, General Electric Company. 2014.
- 21.Lee KH, Lee JM, Moon SK, et al. Attenuation-based automatic tube voltage selection and tube current modulation for dose reduction at contrast-enhanced liver CT. Radiology. 2012;265:437–447. [DOI] [PubMed] [Google Scholar]
- 22.Siegel MJ, Hildebolt C, Bradley D. Effects of automated kilovoltage selection technology on contrast-enhanced pediatric CT and CT angiography. Radiology. 2013;268:538–547. [DOI] [PubMed] [Google Scholar]
- 23.Siegel MJ, Ramirez-Giraldo JC, Hildebolt C, et al. Automated low-kilovoltage selection in pediatric computed tomography angiography: phantom study evaluating effects on radiation dose and image quality. Invest Radiol. 2013;48:584–589. [DOI] [PubMed] [Google Scholar]
- 24.Weis M, Henzler T, Nance JW, Jr., et al. Radiation dose comparison between 70 kVp and 100 kVp with spectral beam shaping for non-contrast-enhanced pediatric chest computed tomography: a prospective randomized controlled study. Invest Radiol. 2017;52:155–162. [DOI] [PubMed] [Google Scholar]
- 25.Hagelstein C, Henzler T, Haubenreisser H, et al. Ultra-high pitch chest computed tomography at 70 kVp tube voltage in an anthropomorphic pediatric phantom and non-sedated pediatric patients: initial experience with 3rd generation dual-source CT. Z Med Phys. 2016;26:349–361. [DOI] [PubMed] [Google Scholar]
Associated Data
This section collects any data citations, data availability statements, or supplementary materials included in this article.


