Abstract
The development of neural circuits relies on axon projections establishing diverse, yet well-defined, connections between areas of the nervous system. Each projection is formed by growth cones (GCs), subcellular specializations at the tips of growing axons, encompassing sets of molecules that control projection-specific growth, guidance, and target selection1. To investigate the set of molecules within native GCs forming specific connections, we developed GC Sorting and Subcellular RNA-Proteome Mapping, an approach that identifies and quantifies local transcriptomes and proteomes from labeled GCs of single projections in vivo. Using this approach on the developing callosal projection of the mouse cerebral cortex, we mapped molecular enrichments in trans-hemispheric GCs relative to their parent cell bodies, producing paired subcellular proteomes and transcriptomes from single neuron subtypes directly from the brain. These data provide generalizable proof-of-principle for this approach, and reveal novel GC molecular specializations, including accumulations of the growth-regulating kinase mTOR2, together withmRNAs containing mTOR-dependent motifs3,4. These findings illuminate therelationships of RNA and protein subcellular distributions in developing projectionneurons, and provide a new systems-level approach for discovery of subtype- and stage-specific molecular substrates of circuit wiring, miswiring, and potential for regeneration.
Neurons are cells with exceptional structure, characterized by large intracellular distances punctuated with molecular specializations dedicated to local functions. Key subcellular specializations in the establishment of nascent circuitry are growth cones (GCs) at the tips of extending axons 1. While the in vivo molecular diversity of neuron subtypes is now well appreciated5, the in vivo projection-specific molecular diversity of GCs remains unknown and experimentally inaccessible with current approaches. To enable quantitative and systems level subcellular readouts from distinct subtype-specific GCs in the brain, we developed a new experimental approach of GC sorting and what we term “subcellular RNA-proteome mapping”.
To purify GC subtypes from the brain, we fluorescently label neuron populations in vivo, from which we isolate total GCs by subcellular fractionation6,7 (Fig 1a). Isolated GCs display intact membranes, are enriched in GC marker proteins, and retain encapsulated sequencing-quality RNA (Extended Data Fig. 1). To specifically purify fluorescently labeled GC subtypes from bulk isolated GCs of the brain, we modified and optimized a fluorescence-activated cell sorter with custom optics and fluidics to directly sort and collect fluorescent GCs (see Methods).
Figure 1. GC sorting.
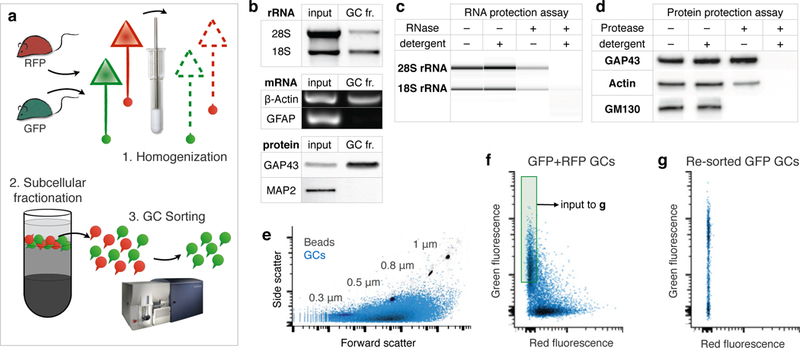
a, Schematic of two-color sorting to separate GFP GCs from RFP GCs. 1. Brains from a GFP mouse and an RFP mouse were homogenized together. 2. Subcellular fractionation of the homogenate yields a GC fraction, containing the red and green GCs in a suspension of diluted cytosol. 3. This suspension of mixed GCs was sorted on a customized small-particle fluorescence flow cytometer to collect pure green GCs from the mix. b, Analysis of GC fraction (GC fr.) RNA and protein marker enrichment versus the starting homogenate (input). Top: native gel electrophoresis shows de-enriched presence of large (28S) and small (18S) ribosomal subunit rRNA in GC fraction. Middle: RT-PCR detects β-Actin mRNA (ubiquitous) but not GFAP mRNA (progenitor and glial marker) from GC fraction. Bottom: Western blot detects enrichment of GAP43 (GC protein marker) and depletion of MAP2 (somato-dendritic protein marker) in GC fraction. c-d, GC protection assays with non membrane permeable degrading enzymes (RNAse in c and protease in d) to test GC integrity and GC-specific membrane encapsulation of RNA and proteins in isolated GCs (see schematic Extended Data Figure 1a). Treatment with enzyme plus detergent, but neither alone, completely abolishes RNA and protein signal from GC fractions. Signals persisting in treatments with enzyme alone (lanes 3) correspond to RNA and protein encapsulated (protected) by GC membrane, and correspond to the specific molecular content of isolated GCs. Treatment with protease alone has no effect on signal from GAP43, a known GC marker, confirming GC-specificity. Conversely, signal from GM130, a Golgi matrix protein known to be excluded from GCs, is abolished with protease treatment alone, indicating no non-specific encapsulation in GCs. Reduced presence of both actin and rRNA in samples treated with enzyme alone is consistent with their ubiquitous presence in both GCs and elsewhere in the homogenate. e, Small particle sorter plot of forward- and side-scatter of GC sample (blue) overlaid on plot of size-standard beads (grey) for size comparison. Isolated GCs are submicron particles with a size range centered on 0.5 µm. f, FACS plot of the mixed GFP and RFP GC suspension (as schematized in a), showing separation of GCs into two monochrome red and green populations. Collection gate used to isolate pure green GCs is indicated by the shaded green square. g, Collected green GCs from f were re-sorted and reveal specific purification of only GFP GCs, demonstrating that exceptionally pure labeled GCs can be isolated as individual “singlet” GCs from a heterogenous sample using GC sorting directly from brain.
To monitor and verify our ability to purify individual fluorescent GCs, we used mouse lines expressing a variant of red fluorescent protein (RFP) or green fluorescent protein (GFP). GFP- and RFP-labeled brains were fractionated together, so that isolated GCs were either red or green, but never both. We loaded isolated GCs into the modified sorter, calibrated gating based on size-standard beads, and determined the optimal conditions for separation of individual single-color GCs. To verify collection, we gated on fluorescence to collect green and exclude red GCs. By re-analyzing the collected sample, we determined that we indeed isolated pure green GCs (Fig. 1), establishing the conditions and feasibility for use of this approach to isolate pure subpopulations of labeled circuit-specific GCs from the brain.
We present here the first application of circuit-specific GC sorting on the trans-hemispheric projection formed by callosal projection neurons8,5. We specifically labeled upper-layer cortical neurons by in utero electroporation9 in one hemisphere with plasmid expressing GFP. Three days after birth (P3), we purified trans-hemispheric GCs using GC sorting on the contralateral hemisphere, where only growing callosal axons already across the midline are fluorescent. Protein was extracted from sorted GCs, and analyzed by mass spectrometry (mass-spec) to reveal the GC sub-proteome |P|GC of growing trans-hemispheric axons (Fig. 2 and Supplementary Table 1).
Figure 2. GC sub-proteome of cerebral cortex callosal projection neurons.
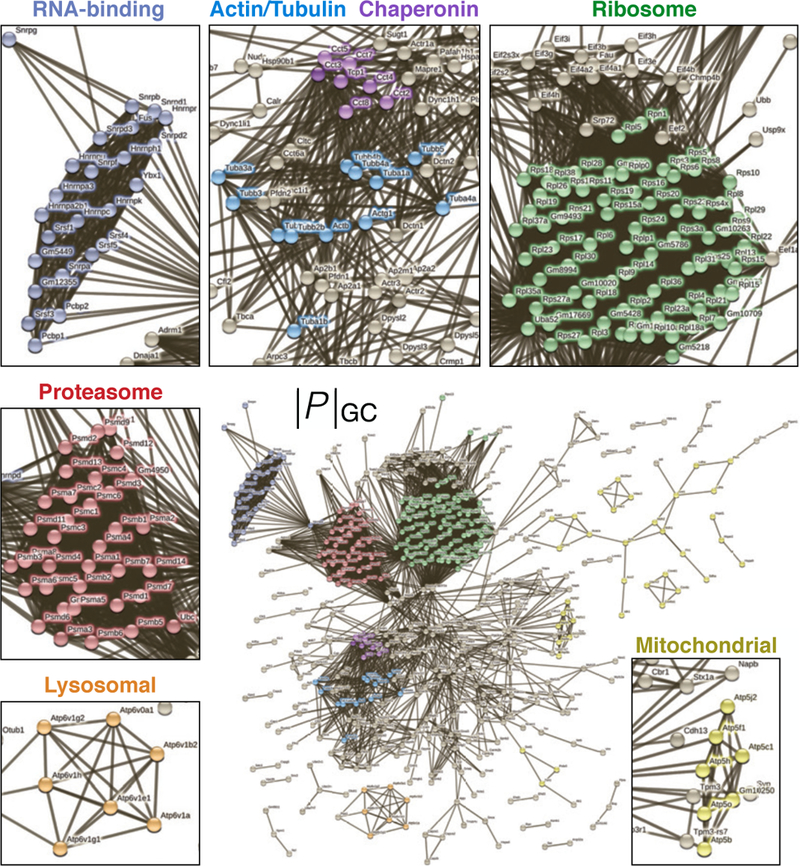
The sub-proteome |P|GC of proteins detected by mass-spec in purified cortical callosal GCs from P3 mouse brains electroporated with membrane-GFP at E15, visualized in a protein-interaction network according to the STRING database. Links indicate known interactions. Colors highlight identifiable protein complexes, as indicated in insets.
As anticipated, a large constituent of |P|GC comprises a nexus of cytoskeletal, membrane, and signaling proteins, typically associated with GC functions in axon guidance1.Confirming readout specificity, GFP itself –the marker for selection– was also detected by mass-spec in sorted GCs. Beyond these, |P|GC displays a rich range of prominent functional complexes dedicated to anabolism and growth, as well as catabolism and turnover. Strikingly, |P|GC includes a distinct set of RNA-binding proteins with known dual roles in nuclear spliceosomes as well as cytosolic ribonucleoprotein particles, raising the possibility of novel RNA-binding complexes regulating GC-localized RNA. The chaperonin complex, specialized in folding of nascent actin and tubulin polypeptides into functional proteins10, is also robustly present in |P|GC. Together, these findings support local GC synthesis and turnover of proteins in vivo, including cytoskeletal elements, as suggested by in vitro studies11,12
As a first biological investigation using the new ability to acquire stage- and circuit-specific subcellular molecular data from the brain, we asked to what extent does the local transcriptome match the local proteome in developing neuron projections in vivo.Pioneering studies detected mRNA transcripts in distal processes of cultured neurons13,11,14,15, giving rise to the idea of local translation producing local sub-proteomes in different parts of the neuron16. To examine this in vivo, and determine to what extent this happens across gene groups, we combined newly developed subtype-specific GC sorting with subtype-specific neuron cell body sorting17,18,19. Performing these approaches in parallel, we obtained paired, quantitative, internally normalized sub-transcriptome and sub-proteome measurements from diametric GC and cell body (soma)compartments from the developing trans-hemispheric projection of upper layer cortical neurons in vivo.
We labeled layer II/III neurons of mouse sensorimotor cortex with membrane-RFP (mem-RFP) and nuclear-GFP (nuc-GFP) by in utero electroporation. At P3, electroporated hemispheres were triturated into a soma suspension, and sorted for green fluorescence to collect labeled neuron somata. Contralateral hemispheres were fractionated to extract GCs, and GC-sorted for red fluorescence to collect corresponding trans-hemispheric axon GCs. We extracted RNA and protein from sorted GCs and their parent somata, and performed RNA-seq and mass-spec to obtain paired measurements from the sub-transcriptomes |R|GC and |R|soma, and the sub-proteomes |P|GC and |P|soma (Fig. 3). This workflow yielded a high-confidence dataset of 955 genes with quantified GC-to-soma ratios ΛR for RNAs and ΛP for proteins. These values enabled us to map genes based on paired subcellular mRNA and corresponding protein distributions within the developing projection. This revealed pronounced divergence across gene groups, with distinct clusters emerging based on paired distributions (Extended Data Fig. 2–6, Supplementary tables 2–7, and Supplementary Discussion).
Figure 3. Projection-specific sub-transcriptomes and sub-proteomes of GCs and their parent somata.
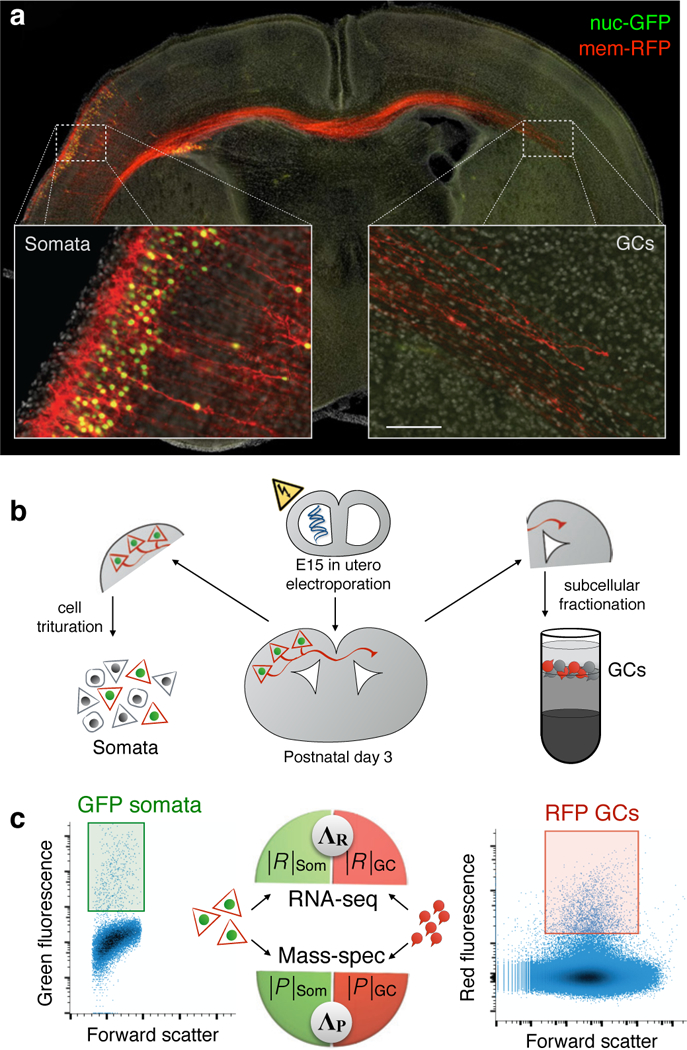
a, Selective labeling of upper layer callosal projection neurons with nuclear-GFP (green) and membrane-RFP (red) by in utero electroporation. Nascent callosal projection at postnatal day 3 displays ipsilateral somata with green nuclei, and trans-hemispheric axons with red GCs; scale bar is 600 µm for main panel, 100 μm for insets. b, Schematic of subcellular RNA-proteome mapping workflow: neuron labeling by in utero electroporation at E15; postnatal day 3 harvesting; cell dissociation of ipsilateral hemispheres for sorting of GFP+ cell bodies; contralateral hemispheres undergo subcellular fractionation to isolate GC fraction for RFP+ GC sorting. c, FACS plots with gates for GFP+ somata and RFP+ GC used to collect trans-hemispheric GCs and their parent cell bodies; RNA and protein extracted from sorted GC and soma samples were analyzed by RNA-seq and mass-spec to yield paired measurements of sub-transcriptomes |R|GC and |R|soma, and sub-proteomes |P|GC and |P|soma, respectively. GC-to-soma ratios of mRNA (ΛR) and protein (ΛP) from corresponding paired sub-transcriptome and sub-proteome measurements were calculated for each gene. ΛR and ΛP correlate and map sub-proteomes and sub-transcriptomes within single neuronal projections directly from brain.
A striking pattern in the clustering of ΛR values emerged from RNA mapping. While the majority of transcripts are depleted from GCs, we identified that transcripts containing a non-canonical sequence, known as the 5’ terminal oligopyrimidine (TOP) motif3, display dramatic and consistent GC enrichment. Of the 83 TOP transcripts detected, most displayed trends of GC enrichment, with about half enriched with statistical significance, while no TOP transcripts were significantly depleted from GCs (Fig. 4). These results were further validated using qPCR of select TOP and non-TOP reference transcripts, while TOP transcripts were directly visualized in GCs using single-molecule RNA in situ hybridization (Fig. 4c and Extended Data Fig. 7). Collectively, TOP transcripts account for ~80% of all significantly GC-enriched transcripts in the mapping dataset (Supplementary Table 4).
Figure 4. Subcellular transcriptome distribution follows mTOR dependence.
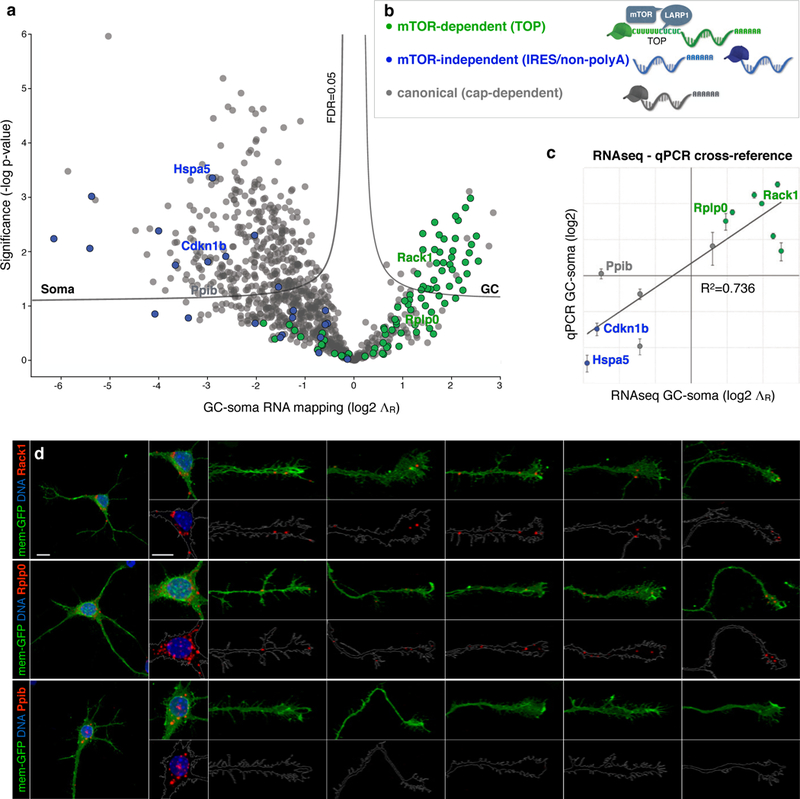
a, Volcano plot of GC-soma RNA mapping, ΛR (log2) values are plotted for each transcript versus statistical significance (-log P-value). Significance thresholds indicate Benjamini-Hochberg False Discovery Rate (FDR) of 0.05. Transcripts are colored by mRNA class as indicated in b. Example transcripts from each class are labeled and further verified in c and d. Full transcript values are listed in Supplementary Table 4. b, legend and schematics of mRNA classes based on known mTOR dependence: mRNAs containing a TOP motif are mTOR-dependent (green), schema indicates direct binding to LARP1 and mTOR; mRNAs containing Internal Ribosome Entry Sites (IRES) or lacking poly-A tails are mTOR-independent (blue); canonical mRNAs that undergo cap-dependent translation (grey) display moderate responses to mTOR. c, Verification of RNA-seq mapping values (x-axis) with qPCR measurements (y-axis). Error bars show SEM, n=3. The two data sets cross-validate with correlation coefficient R2=0.736. d, Single-molecule RNA chromogenic in situ hybridization (ISH, red) of two TOP transcripts: Rack1 (non-ribosomal TOP) and Rplp0 (ribosomal TOP), compared to a control transcript Ppib (soma-mapped canonical) in callosal projection neurons. Neurons were labeled with mem-GFP (green) via in utero electroporation at E15, cultured at P0, fixed and hybridized at DIV3. DNA in nuclei stained with DAPI (blue). Soma and GC closeups shown in insets as overlays of transcript (red) with mem-GFP (green) in upper rows, or with traced GC outlines in lower rows. Five example GCs are shown per sample to capture the representative range. Scale bars indicate 10 µm.
Fewer than 100 genes produce transcripts with bona fide TOP motifs20. However, they collectively produce 5 to 20 percent of a cell’s total proteome21,22. TOP transcripts encode the proteins of the translation machinery itself, most notably the protein subunits of ribosomes and translation initiation factors3. As such, their expression is tightly coupled to cellular growth. The TOP motif itself functions as the ON/OFF switch for translation, and is under direct control of mTOR3,23,24, a hub kinase that integrates growth-factor signaling with availability of nutrients, energy, and oxygen25. While 99.8% of all transcripts respond to mTOR signaling with only modest (~20%) changes in translation, TOP translation is fully mTOR-dependent in an all-or-none manner. In contrast, there is a small group of non-canonical transcripts that contain internal ribosome entry sites, or lack polyA tails, making their translation entirely mTOR-independent24. Interestingly, this group is the diametric opposite of the TOP group in our dataset, comprising the most extreme outliers of soma enrichment (Fig. 4a–b). These data reveal striking subcellular polarization of the transcriptome within growing projection neurons based on mTOR dependence for translation.
Given the degree of TOP mRNA enrichment in GCs, together with their strict dependence on mTOR for expression, we investigated whether developing projection neurons localize endogenous mTOR to their axon GCs, as previously suggested by overexpression26. Indeed, we identify mTOR, and the mTOR-binding proteins LARP1 and Raptor, to be specifically enriched in GCs at levels comparable to the cardinal GC marker GAP43. LARP1 directly binds and regulates the TOP motif27,4, while Raptor is a key subunit of mTOR complex1 (mTORC1)23. We directly visualized these proteins in callosal projection neuron GCs, and observed that mTOR, LARP1, and mTORC1 components specifically accumulate in dense local foci in the “palms” and “cuffs” of axon GCs (Fig. 5, and Extended Data Fig. 8–9). This pattern is distinct from the granular immunolabeling throughout the neuron of mTORC2 marker Rictor and lysosome marker Lamp1. These data collectively indicate the existence of distinct subcellular foci of mTORC1, LARP1, and their target TOP mRNAs in GCs of developing axon projections.
Figure 5. Dense foci of mTOR complex 1 in GCs.
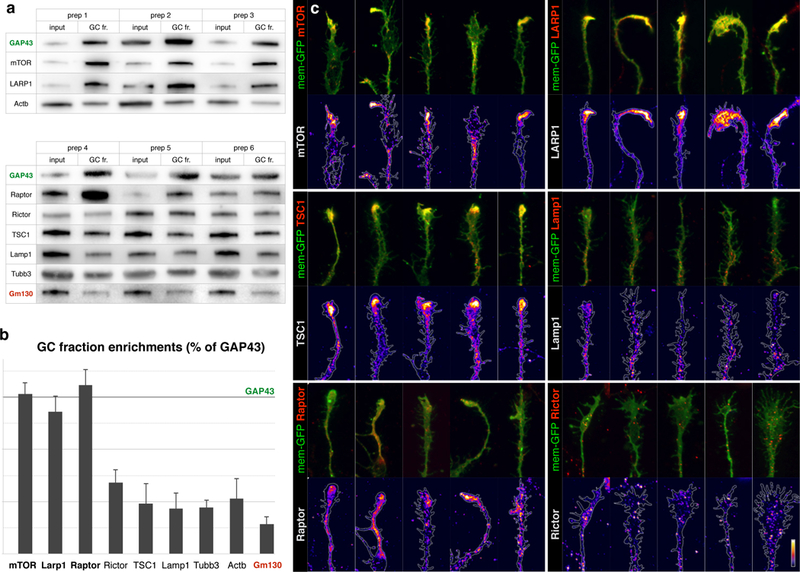
a, Biochemical analysis of GC enrichment of mTOR pathway proteins and controls, shown in triplicate western blots of homogenate (input) and GC fraction (GC fr.) pairs, derived from six independent preps. GC marker GAP43 is positive control for enrichment, Golgi marker Gm130 is negative control. b, Quantification of GC enrichment blots in a expressed as ratios of GC fr. signal over input signal, normalized to the corresponding GAP43 ratio (marked by horizontal line). Error bars indicate SEM, n≥3 litters. TSC1, Rictor, and Lamp1 are present in GCs comparable to actin and tubulin, while mTOR, LARP1, and Raptor display high GC enrichment comparable to GC marker GAP43. c, Closeups of GCs from callosal projection neurons immunostained for endogenous mTOR pathway proteins (red in overlays, heat mapped in underlying panels). Five example GCs are shown per sample to capture the representative range. Neurons were labeled via in utero electroporation at E15 with membrane-GFP (green in overlays, outlined in underlying panels), cultured at P0, fixed and stained at DIV 3. mTOR, LARP1, TSC1, and Raptor (mTORC1 marker) appear in dense local foci within GCs. Rictor (mTORC2 marker) and Lamp1 (lysosome marker) appear in fine granules distinct from GC foci. Bar (lower right) indicates heat-map color range, as well as 10 µm scale.
The presence of local mTOR foci in callosal projection neuron axon GCs prompted us to examine whether mTOR signaling is necessary for the formation of the trans-hemispheric projection itself during development. We investigated this in vivo using two genetic strategies. In one approach, we electroporated callosal projection neurons with a dominant-negative subunit of PI3 kinase28 (PI3K-DN), a critical growth-factor signaling pathway that activates mTOR. Compared to matched GFP-only controls, PI3K-DN causes pronounced perturbation in neuron migration, as reported previously29, as well as striking loss of callosal axon extension. In a parallel approach, we acutely knocked out mTOR by Cre electroporation in floxed-mTOR mice (mTOR-KO). mTOR-KO does not significantly affect migration, but rather, specifically prevents extension of axons across the corpus callosum (Fig. 6 and Extended Data Fig. 10), collectively confirming that mTOR signaling is necessary for trans-hemispheric axon growth.
Figure 6. mTOR signaling is required for the extension of trans-hemispheric axons.
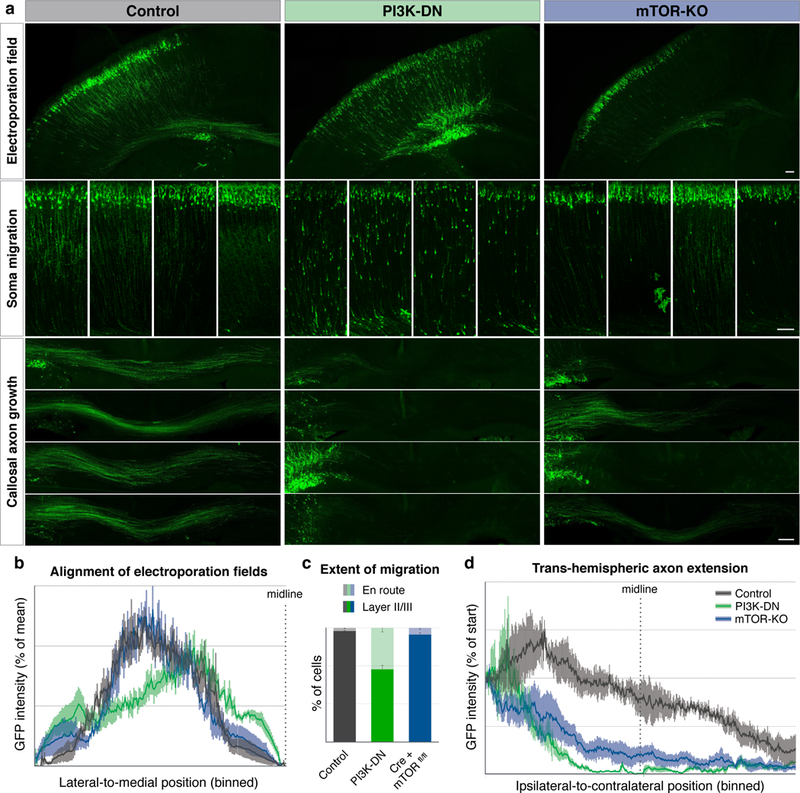
a, Electroporation of callosal projection neurons with GFP and genetic payloads at E15, fixation and analysis at P3. Control electroporations (left column, grey in quantifications) show soma migration into upper layers (middle row insets, examples from four brains), and callosal projections well into the contralateral cortex (bottom insets, examples from four brains). Electroporation with dominant negative PI3 kinase expression construct (PI3K-DN, middle column, green in quantifications) results in hindered migration of somata, and failure of callosal axon growth. Electroporation of Cre expression construct in mice with homozygous floxed-mTOR alleles for conditional mTOR gene deletion (right column, Cre + mTORfl/fl, blue in quantifications) resultes specifically in failure of callosal axon growth. Scale bars indicate 100 µm. b, Quantification of the location of the electroporation field shows comparable mediolateral electroporation positions across all samples. Plotted are histograms of binned GFP intensities along the tangential axis of the ipsilateral cortex ending at the midline. c, Quantification of extent of migration, with percentage of somata in layers II/III (dark colors) vs. somata still en route in deeper layers (light colors). Inhibiting PI3K signaling (green) interferes with migration, while acute mTOR deletion (blue) does not significantly affect migration. d, Quantification of callosal axon extension showing that PI3K inhibition (green) as well as knockout of mTOR (blue) disrupt the formation of axon projection across the corpus callosum. Plotted are binned GFP intensity histograms within the corpus callosum from ipsilateral, through the midline (indicated dotted line) to contralateral side. All error bars show SEM, n=4 mice.
Taken together, these findings place mRNAs of the translation machinery, along with their obligate regulator, mTOR, at the leading edge of growing long-range axon projections. Without mTOR signaling, these projections fail to form. We propose a developmental interpretation for these observations, in which the supply of cellular translation machinery is coupled to axon extension through local signaling. This subcellular organization might likely be a transient feature of the axon-extension phase of projection neuron development, physically positioning mTOR at sites of most intense cellular growth. It is intriguing to speculate that mTOR foci in GCs might enable sensing of target-derived growth signals locally to globally coordinate transitions of a neuron’s developmental program driven by target-derived signals. It will be interesting to examine this non-standard developmental model directly, along with its implications for axon growth, and possibly regeneration30 (see Supplementary Discussion). Finally, this new line of experimentation employing subtype-specific GC sorting and quantitative subcellular RNA-proteome mapping provides a generalizable approach that enables molecular investigations comparing subtype- and stage-specific GCs, GCs from mutant, regenerative, non-regenerative, or reprogrammed neurons to discover molecular specificities behind circuit development, miswiring, and possibly regeneration.
Supplementary Discussion
One major advance enabled by this new GC sorting and “subcellular RNA-proteome mapping” approach is the identification of a subcellular RNA-proteome map from this large (several mm-long) and highly polarized neuron subtype directly from the brain. Mapping ΛR to ΛP along the macroscopic subcellular GC-soma axis of the trans-hemispheric projection reveals how components of distinct subcellular transcriptomes distribute in somata and GCs compared to their respective distinct subcellular proteomes. This paired readout provides quantitative insight into several interesting features of projection neuron biology.
Our data show that, for any given gene, mRNA mapping is not predictive of corresponding protein mapping, since the correlation coefficient of ΛR to ΛP across the dataset is near zero (0.014). However, much more specific patterns emerge in subsets of genes and higher-order gene group clusters (Supplementary Table 6 and 7), suggesting that mRNA localization can serve varying biological purposes beyond simply supplying the local proteome –e.g. isolating and polarizing translational control for select proteins and pathways. Clusters of gene groups emerge in 2D maps of mRNA-to-protein subcellular distributions (Extended Data Fig. 5–6). Among these are anticipated features, such as adhesion molecules mapping mRNA toward somata and protein mapping toward GCs; adhesion molecule mRNAs are translated on rough endoplasmic reticulum in somata for translocation into the secretory pathway and subsequent anterograde protein trafficking down the axon31. In this same “Banterograde cluster” we also identify less anticipated groups, such as proteasomes and chaperonins, indicating that these multi-subunit complexes might be produced in somata, and subsequently concentrate in GCs.
The most striking outlier to emerge from the subcellular RNA-proteome map is the “BTOP cluster”, encoding mostly ribosomal protein subunits and translation initiation factors. This cluster is unique in displaying a pattern of mRNA concentrated in GCs, and protein distributing in the middle of the GC-soma axis (green histograms in Extended Data Fig.6). This localization of ribosomal proteins in both GCs and somata is consistent with ribosomal proteins assembling into functional ribosomes in the nucleus32, as well as ribosomes participating in translation in both GC and soma compartments. Localization of ribosomal mRNAs in GCs, however, indicates less canonical biology, and begs interpretation.
We mined the data extensively for correlations of individual ribosomal subunit ΛR values with known properties of those subunits, e.g. distance from the ribosomal surface, evolutionary conservation, methylation, acetylation, or hydroxylation. We find no correlations with known properties to support specialized functions for this localization, such as local replacement of select subunits, or refurbishment of existing GC ribosomes. We thus propose a developmental interpretation, in which the supply of ribosomes is regulated to mirror the increasing size of the neuron by spatially coupling axon growth and TOP mRNA translation through mTOR at GCs. We propose that this subcellular organization might likely be a transient feature of the axon-extension phase of projection neuron development, physically positioning mTOR33 as the central growth regulator at sites of the most intense cellular growth. In addition to coordinating the supply of ribosomes in a growing neuron, it is intriguing to speculate that mTOR pathway foci in GCs might enable sensing of target-derived growth signals locally to optimally tune and coordinate the responsiveness of GCs as they traverse distinct microenvironments, as well as to coordinate transitions of the overall neuron’s developmental program in a target-derived, stage-specific manner.
This model has interesting implications possibly toward regeneration in the adult central nervous system. Previous studies have identified mTOR and the PI3 kinase pathway as critical targets to stimulate regrowth of damaged axons in the adult CNS34,35. Since mTOR previously has been thought to reside largely in cell bodies of mature neurons, unidentified long-range signals have been postulated to link mTOR manipulations and the induction of regenerative growth in GCs30. Our results indicate that, during development, mTOR and axon growth become directly coupled both functionally and spatially at GCs. It is thus possible that reverting mTOR to this developmental GC-specific state and localization might be important in optimally enabling regenerative growth in the adult CNS.
Methods
Animals
Animal experimental protocols were approved by the Harvard University Institutional Animal Care and Use Committee, and complied with all relevant ethical regulations regarding animal research. Experiments using wild-type mice were performed on outbred strain CD1 mouse pups of both sexes (Charles River Laboratories). Mice ubiquitously expressing GFP (Fig. 1) are from the transgenic strain B6 ACTb-EGFP (JAX stock #003291) expressing GFP under the CAG promoter36. Mice ubiquitously expressing RFP (Fig. 1) correspond to a knockin strain ubiquitously expressing the RFP variant tdTomato, under the CAG promoter from the ROSA26 locus. We created this strain by breeding Ai9 strain37 (JAX stock #007909) females with Vasa-Cre strain (JAX stock #006954) males expressing Cre in embryonic germ cells38 (leading to the removal of a floxed-stop cassette from the original conditional tdTomato knockin allele) and cross-breeding the red progeny. Both GFP and RFP mouse lines were back bred into the FVB background (JAX strain FVB/NJ) by selecting for fluorescence for over 7 generations. For conditional mTOR knockout experiments (Fig. 6 and Extended Data Fig. 10), we used mTOR-floxed mice (JAX stock #011009) homozygous for mTOR alleles harboring loxP sites flanking exons 1–5 of the mTOR gene39. No statistical methods were used to predetermine sample size. All animals analyzed were P3 or younger, thus no sex determination was attempted. Analyses are thought to include animals of both sexes at approximately equal proportions.
DNA constructs
The following plasmid DNA expression constructs were used for in utero electroporations: membrane-GFP (used in Fig. 2, 4, and 5; as well as Extended Data Fig. 7, 8, and 9) is a GFP-GPI fusion construct kindly provided by Anna-Katerina Hadjantonakis40 (Memorial Sloan Kettering); membrane-RFP and nuclear-GFP (used in Fig. 3) corresponds to a 2A bi-cistronic gene encoding myristoylated-tdTomato and Histone2B-GFP from plasmid pCAG-TAG (Addgene plasmid # 26771), generously provided by Shankar Srinivas4 (Oxford). Expression plasmid pCAG-GFP41 (gift from Connie Cepko, Addgene plasmid # 11150) was used for GFP control electroporations (used in Fig. 6 and Extended Data Fig. 10). PI3K-DN plasmid was produced using the following cloning procedures: 1) PCR amplification of the open reading frame of phosphoinositide-3-kinase regulatory subunit 1 (Pik3r1, accession number: NM_001077495) from mouse brain cDNA 2) site-directed mutagenesis using QuikChange (Agilent) to delete 36 internal residues (Q478-K513) corresponding to the catalytic subunit binding-site, thus producing the dominant-negative construct PI3K-DN, as previously reported28; 3) PI3K-DN was subcloned into pCAG-GFP in-frame with GFP, downstream of a 2A element to create a bicistronic expression vector producing GFP and PI3K-DN. Plasmid expressing Cre and GFP for electroporations into mTOR floxed animals was produced equivalently by subcloning Cre downstream of GFP-2A in pCAG-GFP.
In utero electroporation
Electroporations were performed in utero on embryonic day 15, as previously described42, resulting in specific expression of plasmid DNA in cortical layer II/III neurons, including inter-hemispheric projection neurons (upper layer callosal projection neurons). Dense DNA solution was injected into one lateral ventricle using a pulled glass micropipette. Five current pulses of 35 V were applied, targeting nascent sensorimotor areas of the cortical plate. After term birth, electroporated mouse pups were screened for unilateral cortical fluorescence using a fluorescence stereoscope.
GC fractionation
GC fractions were obtained using modifications of methods originally described by Pfenninger and colleagues6,7. Briefly, forebrains of postnatal day 3 mouse pups were rapidly chilled and homogenized in 0.32 M sucrose buffer supplemented with 4mM HEPES, HALT protease and phosphatase inhibitors (Thermo), and 1U/mL RNAse inhibitors (Promega), with 13 strokes at 900 rpm in a glass-Teflon potter. Postnuclear (input) homogenates were obtained as supernatants after centrifugation at 1,700 g for 15 min. Inputs were layered onto 0.83 M sucrose and a 2.5 M sucrose cushion, and spun cooled in a fixed vertical rotor (VTi50, Beckman) at 250,000 g for 50 min. The GC fraction was extracted from the 0.32 M – 0.83 M interface.
GC protection assays
To investigate the integrity of GCs in GC fractions, and the specific encapsulation of GC protein and RNA by continuous GC membrane, we applied two parallel hydrolytic enzyme “protection assay” approaches. We performed protection assays with ribonuclease (RNase One, Promega) to test for GC RNA protection, and with protease (trypsin) to test for GC protein protection. Test samples were incubated with either 0.025% trypsin or 30 U/mL RNase at 4° C for 90 min with constant rotation. In parallel with test samples, positive control samples contained 0.3% Triton X-100 detergent in addition to enzyme to disrupt GC membrane integrity and allow RNase or protease access to RNA and protein both outside and inside GCs (Extended Data Fig. 1). Negative control samples contained detergent but no hydrolytic enzyme. Enzyme concentrations, conditions, and durations were titrated for complete degradation of all protein and RNA in the Triton X-100-containing control samples, with minimal loss in negative control samples.
RNA and proteins remaining after treatment and incubation were measured using capillary electrophoresis (2100 Bioanalyzer, Agilent) or standard western blot, respectively (Extended Data Fig. 1). RNA and protein signal that survived treatment in test samples represent molecules protected inside intact GCs.
GC-soma sorting and collection
GC sorting.
To isolate labeled GCs, we took a subcellular fluorescence-based sorting approach, similar in concept to the previously developed FASS approach for synaptosomes43. We customized a Special Order Research Program (SORP) FACSAriaII (BD Instruments) fluorescence-activated sorter for small particle detection. Forward- and side-scatter were detected using a photomultiplier tube (PMT) and a 300 MW 488 nm laser with reduced beam height (6±3 µm) and custom lens assembly with noise-reducing filter and pico-motor focus. Scatter measurements were based on signal peak height and plotted in log mode. Prior to loading GCs, bleach followed by filtered water was run through the fluidics for at least 20 min. GCs were loaded onto a cooled sample platform and sorted through a cuvette flow cell with a 70 µm nozzle running at 70 PSI with PBS as sheath fluid fed through a 0.1 µm filter. Bulk GC fractions in sucrose were diluted 3- to 6-fold in PBS immediately prior to loading into the sorter. Comparing the forward- and side-scatter profile of particles in the GC fraction to sub-micron polystyrene size-standard beads (BD), the majority of GCs ranged from 0.3 to 0.8 µm diameter (Fig. 1b), consistent with previous electron microscopic analysis of a heterogeneous bulk GC fraction6. Appropriate bead sizes were used to calibrate drop delays and collection parameters.
Soma sorting.
We isolated fluorescent somata of layer II/III inter-hemispheric projection neurons from electroporated hemispheres using established approaches17,44,19. The electroporated areas of the cortical plate were micro-dissected to remove meninges and the ventricular zone (VZ) under a fluorescence stereoscope (Nikon). The micro-dissected pieces of cortex containing fluorescent postmitotic neuron cell bodies were dissociated for sorting as previously described17,44,18,45,46. We used a different customized SORP FACSAriaII equipped with a 100 MW 488 nm laser with large beam height, and an 85 µm nozzle at 45 psi, to collect GFP-labeled neuronal somata (Fig. 3c).
Sorted GC–soma collection for downstream RNA-seq and mass-spec.
We collected GCs directly into guanidinium-based buffer RLT (Qiagen) containing 2-mercaptoethanol. For each biological replicate, we used an average of 6 electroporated brains, from which we collected on average 2,000,000 fluorescent GCs, and 200,000 fluorescent parent cell bodies. Collection run times averaged 12h for GCs, and 1.5h for somata. In addition to electroporation, we tested and successfully sorted fluorescent GCs using alternative methods of fluorescent labeling, including conditional mouse lines, and lipophilic dyes. We extracted both RNA and protein from each sorted sample using a commercial column-based kit according to the manufacturer’s protocol (AllPrep DNA/RNA/Protein kit, Qiagen). Total GC and total soma RNA samples were eluted into 14 µl H2O, and frozen until use for cDNA library preparation and RNA-seq. Total protein from GC and soma samples was precipitated, and pellets were frozen until processing for mass-spec.
Mass spectrometry (mass-spec)
Protein samples were subjected to on-pellet processing and LC-MS/MS on an LTQ Orbitrap Elite (Thermo Fischer) supplied by a NanoAcquity UPLC pump (Waters) for label-free quantitative mass-spec. Sample order was randomized between replicate experiments. Specifically, protein pellets were resuspended in 8M urea, reduced at 56 °C with TCEP, alkylated with iodoacetamide, and digested for 4h with trypsin. Remaining pellets were sonicated in 80% acetonitrile, and digested in trypsin overnight. Tryptic peptides were separated on a 100 µm microcapillary trapping column packed with 5 cm C18 Reprosil resin of 5 µm particles with 100 Å pores, followed by a 20 cm analytical column of Reprosil resin of 1.8 µm particles with 200 Å pores (Dr. Maisch GmbH). Separation was achieved with a 5–27% acetonitrile gradient in 0.1% formic acid over 90 min at 200 nl/min. Peptides were ionized by electrospray with 1.8 kV on a custom-made electrode junction sprayed from fused silica pico tips (New Objective). The LTQ Orbitrap Elite was operated in data-dependent mode. Mass spectrometry survey scan was performed in the 395 –1,800 m/z range at a resolution of 6 × 10⁴, followed by selection of the twenty most intense ions (TOP20) for collision induced dissociation (CID)-MS2 analysis in the ion trap, using a precursor isolation window width of 2 m/z, an AGC setting of 10,000, and maximum ion accumulation of 200 ms. Singly charged ion species were not subjected to CID fragmentation. Normalized collision energy was set to 35 V and an activation time of 10 ms. Ions in a 10 ppm m/z window around ions selected for MS2 were excluded from further selection for fragmentation for 60 s. The same TOP20 ions were subjected to high collision energy dissociation (HCD)-MS2 analysis in the Orbitrap. The fragment ion isolation width was set to 0.7 m/z, AGC was set to 50,000, the maximum ion time was 200 ms, normalized collision energy was set to 27 V and 1 ms activation time for each HCD-MS2 scan. We analyzed output data using MaxQuant and Perseus software (see RNA-Proteome mapping data analysis).
RNA sequencing (RNA-seq)
cDNA libraries from sorted GC and soma samples were prepared from equal masses of RNA using random hexamer primers depleted of rRNA sequences (Ovation Single Cell RNA-Seq System, Nugen). Sample order was randomized between replicate experiments. We prepared libraries according to the manufacturer’s protocol, using six amplification cycles to avoid over-amplification and signal saturation. GC and soma libraries were barcoded and sequenced together on an Illumina Hiseq 2500 sequencer, generating 100-bp paired-end reads. RNA-seq reads were processed using bcbio-nextgen v0.9.5, aligning to GRCm38 with the STAR aligner47 and quantifying counts per gene with Sailfish48 using the Ensembl annotation. We examined a variety of QC metrics to detect poorly performing samples, using a combination of Qualimap49 and FastqQC (Babraham Bioinformatics).
RNA-proteome mapping data analysis
Replicates and QC.
When the amount of material permitted, we subdivided RNA and protein from a single biological replicate to perform technical replicate RNA-seq and mass-spec runs (duplicates or triplicates, depending on available material). Technical replicates included loading partial amounts (halves or thirds) in order to assess quantitative linearity of output measurements. Technical replicates confirmed low variance between instrument runs and quantitative linearity of readouts. Readouts from technical replicates were merged into a combined dataset as a single biological replicate in subsequent statistical analyses.
Biological replicates were subjected to principal component analysis, and cross-correlation analysis. We did not further consider replicates that did not pass QC or were consistent outliers, displayed low complexity, or exhibited identifiable library artifacts. Of the 6 biological replicates performed for each compartment, 5 GC RNA-seq, 5 soma RNA-seq, 4 GC mass-spec, and 6 soma mass-spec replicates passed QC (Extended Data Fig. 2). These readouts were considered further for quantification and subcellular RNA-proteome mapping. Individual values of each biological replicate for each gene can be accessed on the Harvard Dataverse repository.
Label-free quantitative mass-spec analysis.
Mass-spec readouts were analyzed using the MaxQuant software package following the MaxLFQ method for label-free quantitative (LFQ) proteomics50. Mass spectra were assigned to corresponding peptides and proteins with a 7 ppm peptide tolerance, and peptide-to-spectrum-match (PSM) false-discovery-rate (FDR) of 0.05, and protein matching with a minimum of one unique peptide and FDR of 0.01 using the Andromeda search engine against version 83 of the Ensembl annotation. Proteins that were detected in the same compartment in at least 2 biological replicates were considered bona fide constituents of the sub-proteomes |P|GC and |P|soma (Supplementary Tables 2–3).
For quantification of GC-to-soma ratios ΛP, LFQ intensities for the proteins in |P|GC and |P|soma were extracted from MaxQuant to the Perseus Platform51 for matrix processing and statistical analysis. Raw LFQ values were normalized across biological replicates of the same compartment using quartile alignment and width adjustment of distributions, so that distribution peaks align at 1. Values were log2 transformed, and imputation was used to assign baseline non-zero values to represent lack of detection. Imputed values were randomly assigned from a distribution simulating baseline detection noise with a distribution peak downshifted by 2 standard deviations and a width of 0.25 standard deviations of the distribution of detected values. This provided non-zero values for ratiometric determination of ΛP (GC mean normalized LFQ intensity over soma mean normalized LFQ intensity, Supplementary Table 2). Volcano plots of GC-soma represent ΛP values on the x-axis, and two-tailed t-test values across biological replicates on the y-axis. Significance thresholds were set to a 0.05 permutation-based false discovery rate (FDR).
RNA-seq quantitative analysis and proteome matching.
RNA-seq data were internally filtered for transcripts that were detected in at least 3 of the 5 GC or 3 of the 5 soma replicate datasets to produce bona fide sub-transcriptomes |R|GC and |R|soma. Sailfish48 Transcripts Per Million (TPM) counts for each gene were matched to the proteome dataset through Ensembl gene IDs, yielding 955 genes with complete RNA-proteome mapping data (Supplementary Table 4). Sailfish raw counts were analyzed with Perseus similar to LFQ protein data. Values were quartile aligned with peaks at 1, log2 transformed, and missing values were imputed from the noise, as above. Ratiometric determination of GC enrichment ΛR (GC mean normalized TPM counts over soma mean normalized TPM counts), and GC-soma mapping volcano plots were performed as with proteins above.
Gene annotation.
RNA and protein sequences were aligned and paired using version 83 of the Ensembl annotation. Uniprot and RefSeq entries were matched to Ensembl gene ID using the Synergizer service52. Gene Ontology annotation was assigned based on the UniProt database. Ad hoc gene groups corresponding to cell compartments were annotated based on the COMPARTMENTS subcellular localization database53. Protein interactions were annotated based on version 10.0 of the STRING database54.
RNA-protein annotation enrichment.
1D and 2D annotation enrichment analysis was performed as described55 using the combined dataset of RNA-seq and mass-spec biological replicates as input. Annotations considered were Gene Ontology (GO) terms from three categories (GO-Molecular Process, GO-Biological Function, and GO-Cellular Component), as well as gene groups as listed in Supplementary Table 7. Significance was determined using a two-sided Benjamini-Hochberg corrected FDR of 0.02 (Supplementary Tables 3, 5, and 6).
RNA analyses
Native RNA gel electrophoresis.
We loaded purified GC and input homogenate RNA with GelRed, and ran them on a native 1% agarose gel in TBE (89 mM Tris-HCl pH 7.8, 89 mM borate, 2 mM EDTA) alongside single-strand RNA ladder (NEB).
RNA capillary electrophoresis.
We performed analysis of RNA on an Agilent 2100 Bioanalyzer following the manufacturer’s protocol. For mRNA-specific profiles, we used oligo (dT)25 beads to purify polyA-containing transcripts prior to analysis.
RT-PCR.
We used equal masses of RNA from purified GC and input to make GC and input cDNA libraries, following manufacturer’s instructions (SuperScript III, ThermoFisher). We performed PCR on GC and input cDNA sample templates, amplifying β-actin and glial fibrillary acidic protein (GFAP) for 32 cycles with primer pairs according to PrimerBank56. We imaged amplicon bands using standard agarose electrophoresis.
qPCR analysis.
cDNA synthesis was performed on RNA purified from sorted GC and soma using SuperScript IV (ThermoFisher). qPCR analysis was performed on a BioRad CFX96 using the TaqMan Gene Expression Assay (Applied Biosystems, ThermoFisher) according to the manufacturer’s protocol. The following TaqMan probes were used: Rplp0 (#4453320; Mm00725448_s1), Rpl18a (#4448892; Mm04205642_gH), Rpsa (#4448892; Mm00726662_s1), Rps24 (#4448892; Mm01623058_s1), Rack1 (Gnb2l1) (#4448892; Mm01291968_g1), Eef1b2 (#4448892; Mm00516995_m1), Eef1g (#4448892; Mm02342826_g1), Cdkn1b (#4453320; Mm00438168_m1), Hspa5 (#4453320; Mm00517691_m1), Ppib (#4453320; Mm00478295_m1), Tubb2b (#4448892; Mm00849948_g1), Actb (#4453320; Mm02619580_g1), Gap43 (#4448892; Mm00500404_m1). Relative abundance in each sample was normalized by the mean expression of all transcripts tested, and enrichment is reported as the mean of GC/soma ratios across 3 biological replicates from independent litters. Sample order was randomized between replicate experiments. Agreement between RNAseq and qPCR enrichment was assayed by calculating R2, the square of Pearson’s r, from log2-transformed normalized expression ratios.
Neuron culture
We cultured neurons from newborn mouse pup cortices that had been electroporated in utero at embryonic day 15 to label layer II/III inter-hemispheric projection neurons. We cultured neurons isolated from electroporated areas of cortex on poly-D-lysine-coated glass overslips for 2–3 days, as previously described56.
Single molecule in situ hybridization
Single molecule in situ hybridization was performed using the RNAscope® 2.5 HD RED kit according to the manufacturer’s instructions (Advanced Cell Diagnostics, Hayward, CA). Briefly, primary cortical neurons cultured on glass coverslips for 2–3 days (described above) were fixed in 4% paraformaldehyde for 30min at room temperature, followed by a series of ethanol dehydration and rehydration steps, pretreated first with hydrogen peroxide for 10min, then with Protease III (1:50) for 10 min. After the pretreatment steps, coverslips were incubated with individual probes for 2 hours and the standard RNAscope protocol was followed. Incubation time of amplification step 5 and color reaction were optimized for each probe per the recommendations of the manufacturer. After rinses, coverslips were immunostained for GFP using the standard procedure (described above). RNAscope probes targeting Rplp0 (#315411, Entrez Gene #: NM_007475.5), Rack1 (#443621, Entrez Gene #: NM_008143.3), Ppib (#313911, Entrez Gene #: NM_011149.2) and negative control DapB (#310043) were used. Images were acquired on a Zeiss LSM 880 confocal microscope using a 63x objective. Outlines were created using Trace Contour filter on Adobe Photoshop CC 2017.
Western blot
We performed western blots using standard tris-glycine SDS-PAGE protocols. We determined total protein using the fluorometric Qubit® protein assay (Thermo Fisher), and loaded equal amounts of total protein from input and GC fractions. We electroblotted resolved proteins onto PVDF using semi-dry transfer. We followed standard western blot protocols, and incubated blots with primary antibodies diluted in 3% BSA in TBS with 0.2% Triton X-100, or in “Can Get Signal” buffer (Toyobo). We used the following antibodies for immunoblotting:
mouse-anti-beta-actin, #A5441, Sigma (WB 1:2000)
mouse-anti-GAP43, #MAB347, Chemicon (WB 1:2000)
mouse-anti-GM130, #610823, BD Biosciences (WB 1:3000)
mouse-anti-Lamp1, #1D4B, Developmental Studies Hybridoma Bank* (WB 1:500) rabbit-anti-Larp1, #PA5–62398, ThermoFisher (WB 1:1000)
mouse-anti-MAP2, #M1406, Sigma (WB 1:1000)
rabbit-anti-mTOR, #2983, Cell Signaling Technology (WB 1:1000)
rabbit-anti-mTOR, #A300–504A, Bethyl Labs (WB 1:500)
rabbit-anti-Raptor, #42–4000, ThermoFisher (WB 1:1000)
rabbit-anti-Rictor, #2140, Cell Signaling Technology (WB 1:1000)
rabbit-anti-TSC1, #PA5–20131, ThermoFisher (WB 1:1000)
mouse-anti-tubulin, #MMS-435P, Covance (WB 1:2000)
Isotype-specific secondary antibodies used for ECL imaging were HRP-conjugated and cross-adsorbed (Life Technologies; Abcam). Immunoreactive bands were visualized through detection of chemiluminescence by SuperSignal West Pico PLUS (ThermoFisher) using a CCD camera imager (FluoroChemM, Protein Simple). To measure GC fraction enrichment, we quantified band intensities by densitometry, after applying despeckle filters using ImageJ software (NIH). Within each biological replicate, we normalized enrichment ratios (GC/input) for each protein of interest to the enrichment of GAP43 (the cardinal GC marker used to assess the degree of enrichment in each GC prep) and calculated mean and standard error using these normalized values. We used densitometry values of four biological replicates to calculate means and standard deviations of GC/input ratios. We normalized expressed ratios to GAP43 ratios, and we calculated statistical significance using one-way ANOVA and post-hoc analysis using Student’s t-tests.
Immunolabeling and imaging
For imaging, we fixed cultured cells after 3 days in vitro in 2% paraformaldehyde, while brains were prepared by intracardial perfusion with 4% paraformaldehyde, and cut on a vibrating microtome (Leica) into 80 µm coronal sections. Immunolabeling of both coverslips and brain sections was performed in 3% bovine serum albumin and 0.2% Triton X-100. We used the following antibodies for immunolabeling:
chicken-anti-GFP, #A10262, Invitrogen (ICC 1:500)
mouse-anti-Lamp1, #1D4B, Developmental Studies Hybridoma Bank* (ICC 1:100)
rabbit-anti-Larp1, #PA5–62398, ThermoFisher (ICC 1:200)
rabbit-anti-mTOR, #2983, Cell Signaling Technology (ICC 1:400)
rabbit-anti-mTOR, #A300–503A, Bethyl Labs (ICC 1:400)
rabbit-anti-Raptor, #42–4000, ThermoFisher (ICC 1:200)
mouse-anti-Raptor, #ab169506, Abcam (ICC 1:200)
rabbit-anti-RFP, #600–401-379, Rockland (ICC 1:500)
rabbit-anti-Rictor, #2140, Cell Signaling Technology (ICC 1:200)
rabbit-anti-TSC1, #PA5–20131, ThermoFisher (ICC 1:500)
Isotype-specific secondary antibodies used for fluorescence imaging were Alexa fluor-conjugated and cross-absorbed (Life Technologies). We acquired images on an epifluorescence microscope (Nikon 90i) with automated stage controller. Whole brain section images were generated using EDF z-stack projections and mosaic image stitching through the NIS Elements software (Nikon).
*The anti-Lamp1 monoclonal antibody developed by August, J.T. at Pharmacology & Molecular Sciences, Johns Hopkins School of Medicine was obtained from the Developmental Studies Hybridoma Bank, created by the NICHD of the NIH and maintained at The University of Iowa, Department of Biology, Iowa City, IA 52242.
In vivo PI3K-DN and mTOR cKO analysis
To analyze electroporation position, migration, and callosal axon extension in electroporated brains (Fig. 6 and Extended Data Fig 10), four different brains from three independent litters were used for each experimental group. Animals for control and test electroporations were assigned at random, within the appropriate cohorts of experimental strains. Brain sections were immunostained against GFP, and imaged using an epifluorescence microscope (Nikon 90i). Images were used for quantifications as detailed below. Where counting was manual, obviously discernible phenotypes prevented effective blinding, thus a strict standardized process for measurement was used across samples. For quantification of migration, four different brains per condition were used, with minimum four sections per brain, with two non-overlapping rectangular areas (medial and lateral to midline, covering the entire cortical column) per brain section (average ~155 GFP+ cells/section, median ~156 GFP+ cells/section). Each area was divided into 10 horizontal parallel bins, and the number of GFP+ cells was manually quantified. The percentage of GFP+ cells occupying the top 3 bins versus the percentage occupying the lower 7 bins was plotted (Fig. 6a and Extended Data Fig 10c). For quantification of alignment of electroporation areas and the extent of trans-hemispheric axon growth, four different brains per condition were used, with one section per brain (corresponding to sensorimotor area) used. Fiji was used for generation of bins in selected regions of interest and downstream automated intensity measurements44. For electroporation area measurements, a rectangular box covering the entire neocortical gray matter of the electroporated hemisphere (white matter cropped out before the measurement) was selected, binned into 200 parallel bins for intensity measurements, the background subtracted, and each bin normalized to the total intensity of the section. For callosal axon growth, rectangular boxes covering the entire callosum, centered to the midline, were selected, GFP+ cell bodies were manually removed, and the field divided into 400-bins for intensity measurements. After background intensity removal, the intensity of each bin was normalized to the average intensity of the first five bins of the same section.
Supplementary References
31. Ye, B., Zhang, Y. W., Jan, L. Y. & Jan, Y. N. The secretory pathway and neuron polarization. J Neurosci 26, 10631–10632 (2006).
32. Henras, A. K. et al. The post-transcriptional steps of eukaryotic ribosome biogenesis. Cell Mol Life Sci 65, 2334–2359 (2008).
33. Betz, C. & Hall, M. N. Where is mTOR and what is it doing there? J Cell Biol 203, 563–574 (2013).
34. Liu, K. et al. PTEN deletion enhances the regenerative ability of adult corticospinal neurons. Nat Neurosci 13, 1075–1081 (2010).
35. Park, K. K. et al. Promoting axon regeneration in the adult CNS by modulation of the PTEN/mTOR pathway. Science 322, 963–966 (2008).
36. Okabe, M., Ikawa, M., Kominami, K., Nakanishi, T. & Nishimune, Y. “Green mice ” as a source of ubiquitous green cells. FEBS Lett 407, 313–319 (1997).
37. Madisen, L. et al. A robust and high-throughput Cre reporting and characterization system for the whole mouse brain. Nat Neurosci 13, 133–140 (2010).
38. Gallardo, T., Shirley, L., John, G. B. & Castrillon, D. H. Generation of a germ cell-specific mouse transgenic Cre line, Vasa-Cre. Genesis 45, 413–417 (2007).
39. Risson, V. et al. Muscle inactivation of mTOR causes metabolic and dystrophin defects leading to severe myopathy. J Cell Biol 187, 859–874 (2009).
40. Rhee, J. M. et al. In vivo imaging and differential localization of lipid-modified GFP-variant fusions in embryonic stem cells and mice. Genesis 44, 202–218 (2006).
41. Matsuda, T. & Cepko, C. L. Electroporation and RNA interference in the rodent retina in vivo and in vitro. Proc Natl Acad Sci U S A 101, 16–22 (2004).
42. Saito, T. & Nakatsuji, N. Efficient gene transfer into the embryonic mouse brain using in vivo electroporation. Dev Biol 240, 237–246 (2001).
43. Biesemann, C. et al. Proteomic screening of glutamatergic mouse brain synaptosomes isolated by fluorescence activated sorting. EMBO J 33, 157–170 (2014).
44. Catapano, L. A., Arlotta, P., Cage, T. A. & Macklis, J. D. Stage-specific and opposing roles of BDNF, NT-3 and bFGF in differentiation of purified callosal projection neurons toward cellular repair of complex circuitry. Eur J Neurosci 19, 2421–2434 (2004).
45. Molyneaux, B. J. et al. Novel subtype-specific genes identify distinct subpopulations of callosal projection neurons. J Neurosci 29, 12343–12354 (2009).
46. Galazo, M. J., Emsley, J. G. & Macklis, J. D. Corticothalamic Projection Neuron Development beyond Subtype Specification: Fog2 and Intersectional Controls Regulate Intraclass Neuronal Diversity. Neuron 91, 90–106 (2016).
47. Dobin, A. et al. STAR: ultrafast universal RNA-seq aligner. Bioinformatics 29, 15–21 (2013).
48. Patro, R., Mount, S. M. & Kingsford, C. Sailfish enables alignment-free isoform quantification from RNA-seq reads using lightweight algorithms. Nat Biotechnol 32, 462–464 (2014).
49. Okonechnikov, K., Conesa, A. & García-Alcalde, F. Qualimap 2: advanced multi-sample quality control for high-throughput sequencing data. Bioinformatics 32, 292– 294 (2016).
50. Cox, J. et al. Accurate proteome-wide label-free quantification by delayed normalization and maximal peptide ratio extraction, termed MaxLFQ. Mol Cell Proteomics 13, 2513–2526 (2014).
51. Tyanova, S. et al. The Perseus computational platform for comprehensive analysis of (prote)omics data. Nat Methods 13, 731–740 (2016).
52. Berriz, G. F. & Roth, F. P. The Synergizer service for translating gene, protein and other biological identifiers. Bioinformatics 24, 2272–2273 (2008).
53. Binder, J. X. et al. COMPARTMENTS: unification and visualization of protein subcellular localization evidence. Database (Oxford) 2014, bau012 (2014).
54. Szklarczyk, D. et al. STRING v10: protein-protein interaction networks, integrated over the tree of life. Nucleic Acids Res 43, D447–52 (2015).
55. Cox, J. & Mann, M. 1D and 2D annotation enrichment: a statistical method integrating quantitative proteomics with complementary high-throughput data. BMC Bioinformatics 13 Suppl 16, S12 (2012).
56. Spandidos, A., Wang, X., Wang, H. & Seed, B. PrimerBank: a resource of human and mouse PCR primer pairs for gene expression detection and quantification. Nucleic Acids Res 38, D792–9 (2010).
57. Schindelin, J. et al. Fiji: an open-source platform for biological-image analysis. Nat Methods 9, 676–682 (2012).
Extended Data
Extended Data Figure 1. GC protection assays.
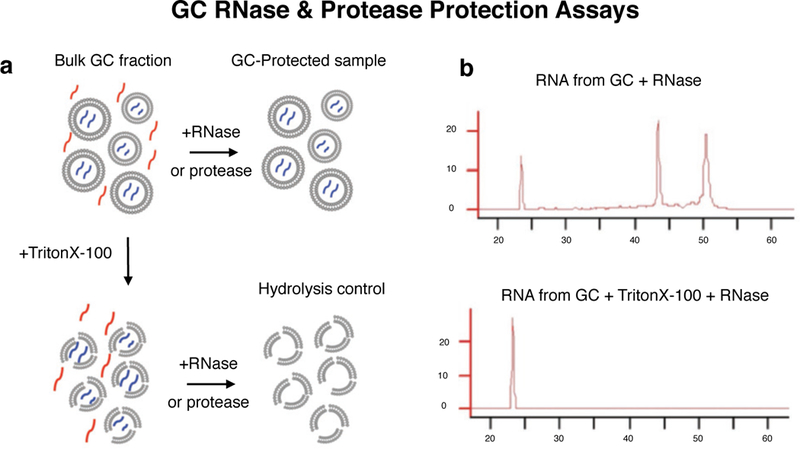
a, GC protection assay schematic: bulk GC fraction after subcellular fractionation is a suspension of GC particles enclosing GC-specific molecules (blue) within a medium that contains dilute soluble cytosolic molecules (red) from the homogenization process. Treatment with RNase or protease leads to hydrolysis of RNA and protein in the suspension medium that are not protected within GC particles, leaving only the GC-protected molecules (blue) in the sample. Addition of detergent (Triton X-100) prior to treatment results in hydrolysis of both cytosolic as well as GC-specific molecules due to ruptures in the encapsulating GC plasma membrane, providing a positive control for the efficiency of enzymes. The difference in RNA or protein signal between GC-protected and Hydrolysis control samples corresponds to the GC-specific signal. b, Bioanalyzer profiles show GC-protected RNA compared to detergent-treated control, with characteristic peaks corresponding to 28S and 18S rRNA, and a spectrum of low intensity signal characteristic of mRNA.
Extended Data Figure 2. Quality control (QC) filtering of mass-spec measurements from sorted somata and GCs.
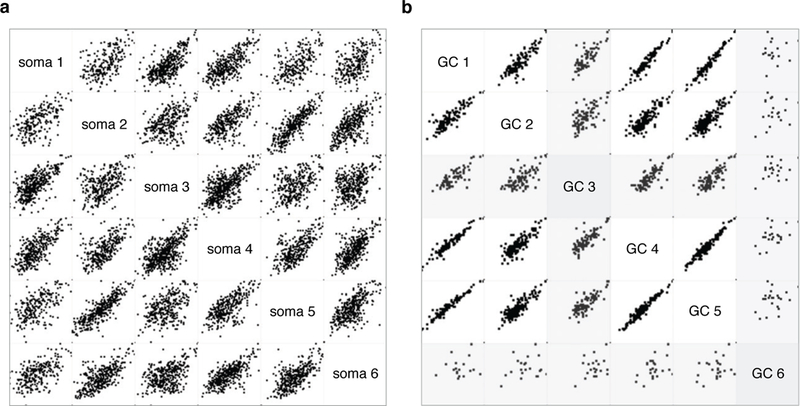
a-b, Multi-scatter plot of mass-spec signal intensity (LFQ log 2) for each detected soma (a) and GC (b) protein in pairwise comparisons across six biological replicates. QC minimum stringency criteria were set based on average correlation coefficients across the biological replicates. Soma samples displayed higher complexity than GC samples, which was reflected in the minimum acceptable correlation coefficients on 0.5 for somata (a) and 0.8 for GCs (b). All six soma replicates and four of six GC replicates met QC criteria. Outlier GC samples (GC 3 and GC 6) are shaded grey (b).
Extended Data Figure 3. Sorted GC-soma protein mass-spec intensities.
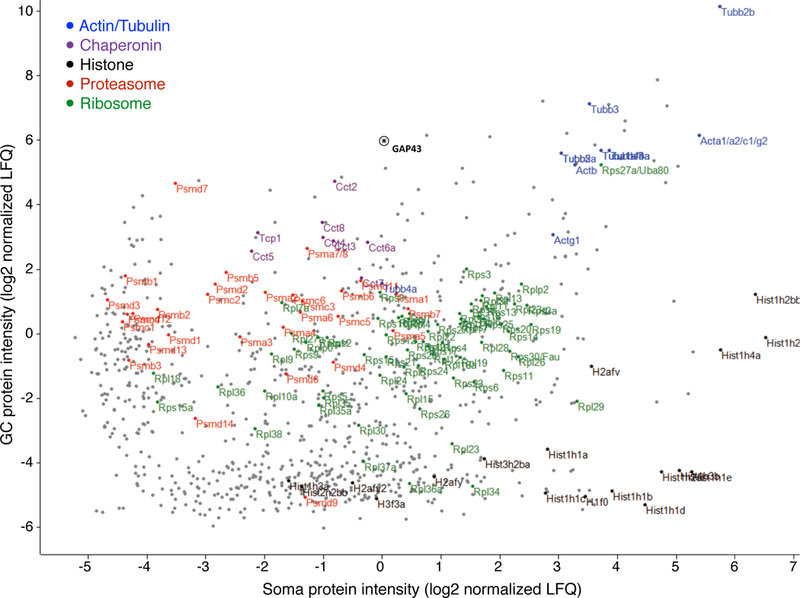
Scatter plot of paired protein intensities from trans-hemispheric sorted GC and sorted parent somata. Units represent log2 peak-normalized intensities as measured by MaxLFQ. Gene groups are highlighted as indicated in the key. The GC marker GAP43 is indicated by an asterisk.
Extended Data Figure 4. Gene Ontology mapping between GCs and Somata.
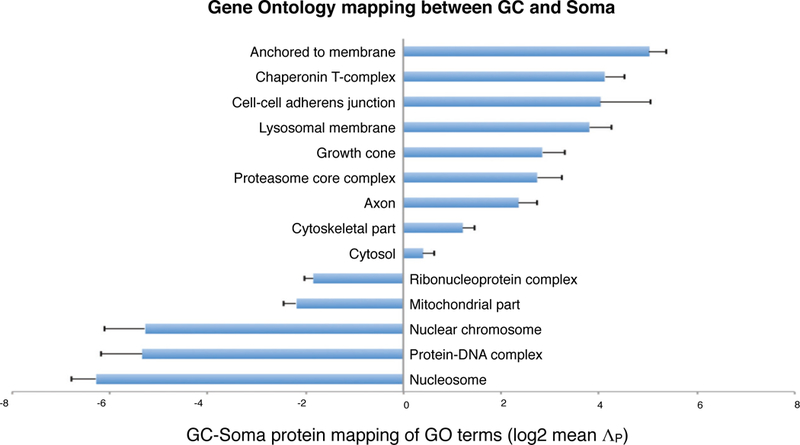
Mean ΛP values (log2) of genes under GO-Cellular Component terms. Error bars show SEM.
Extended Data Figure 5. Sorted GC-soma protein polarization.
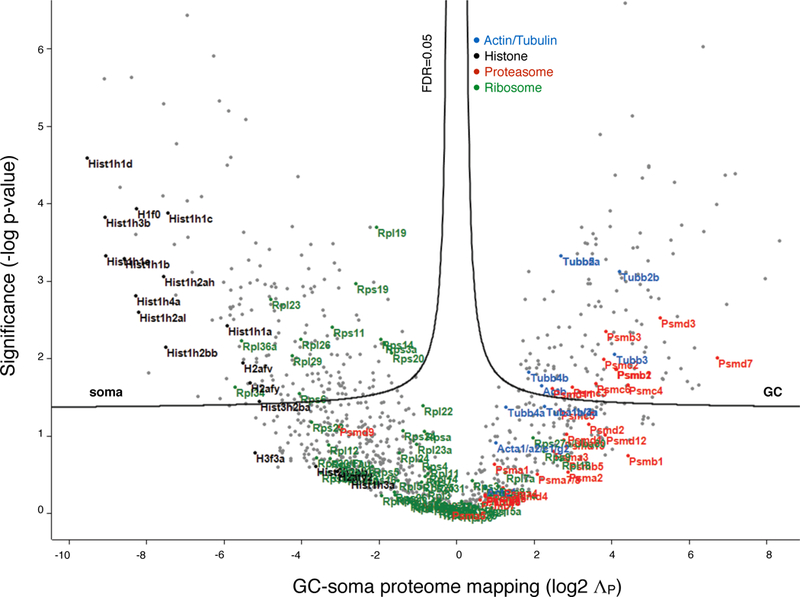
Volcano plot of GC-soma proteome mapping, with ΛP (log2) for each gene product plotted against significance (−log P-value). FDR of 0.05 indicates statistical thresholds for soma- and GC-specific mapping. Highlighted gene groups indicated in key. The proteome of sensorimotor cortex inter-hemispheric projection neurons distributes between cellular compartments with varying polarization that clusters with gene group, including GC-rich clusters (e.g. proteasome), soma-rich clusters (e.g. histones), and groups with moderate levels present in both GCs and somata with moderate enrichments for one or the other compartment (e.g. ribosomes, and actins / tubulins).
Extended Data Figure 6. GC-specific mTOR localization.
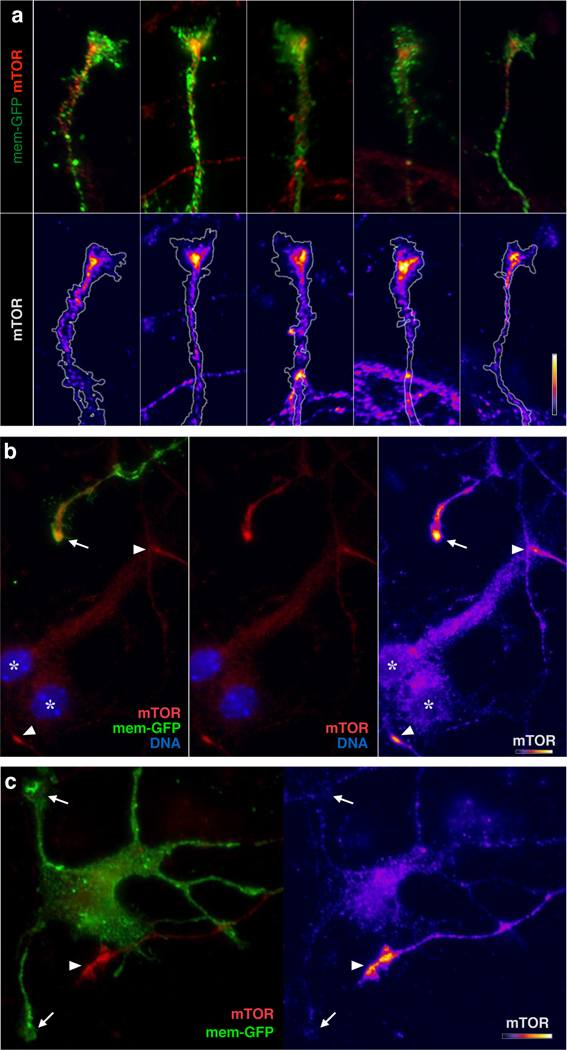
a, High magnification views of representative GCs from callosal projection neurons immunolabeled for mTOR, equivalent to Fig 6a mTOR panel, but with a distinct mTOR antibody to independently confirm dense focal mTOR in GCs. Overlay images, top; heat maps of the same GCs below. b, Example of TOR labeling (red in two left panels; heat map in right panel) in 3-day cultured neurons. A GFP-labeled axon from an electroplated trans-hemispheric neuron displays dense focal mTOR in its GC (arrow) compared to adjacent cell bodies (asterisks; DNA in blue indicates nuclei). Two other unlabeled GCs in the field can be recognized by virtue of their dense focal mTOR labeling alone (arrowheads). c, Example of dendritic GCs (arrows) lacking mTOR, juxtaposed to an unlabeled GC (arrowhead) with prominent mTOR focus. Bars in each of a, b, c (lower right of each panel) indicate mTOR intensity heat-map color range, as well as 10 µm scale.
Extended Data Figure 7. Sorted GC mRNA-to-protein distribution.
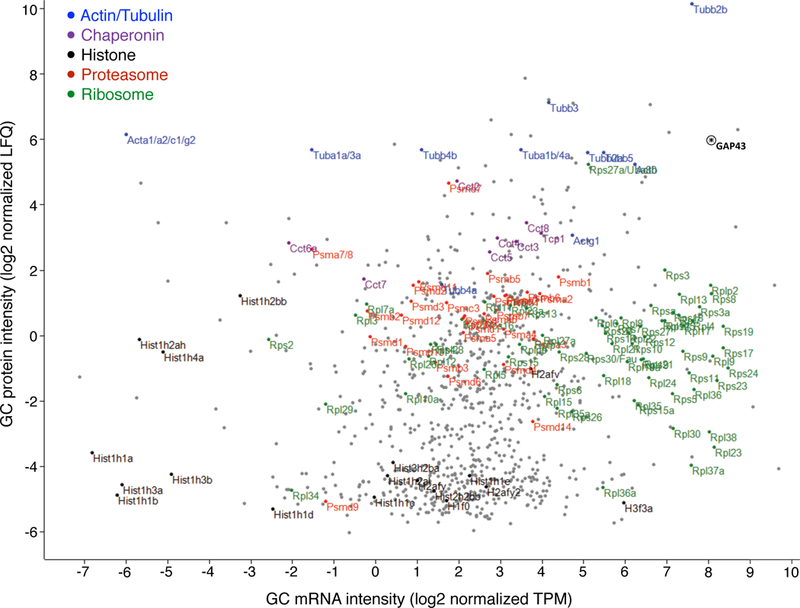
Scatter plot pairing mRNA and corresponding protein relative abundance in trans-hemispheric sorted GCs. Units represent log2 peak-normalized intensities as measured by Sailfish TPM (mRNA) and MaxLFQ (protein). Gene groups are highlighted as indicated in the key. The GC marker GAP43 is indicated by an asterisk. Trans-hemispheric GCs contain mRNA of select high-abundance GC proteins, as well as of most ribosomal protein mRNAs, while ribosomal proteins remain at GCs at moderate levels.
Extended Data Fig. 8. Dense foci of mTOR in GCs.
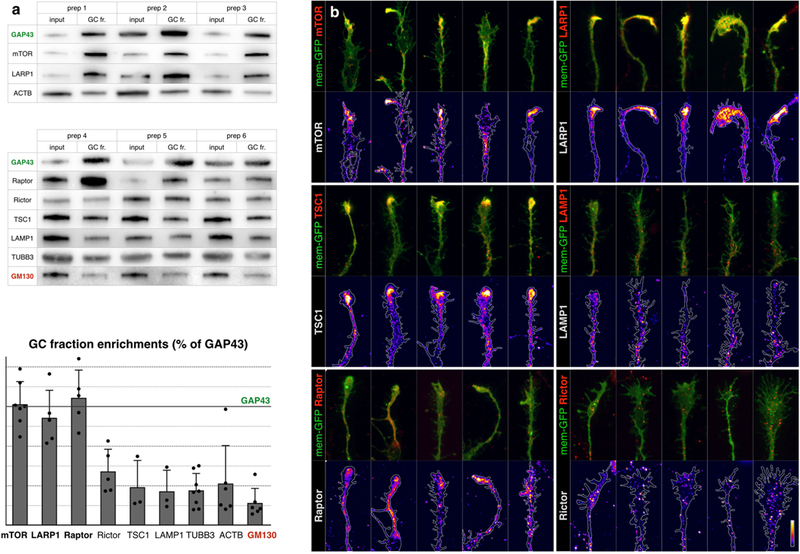
a, Data relate to Fig. 5. Biochemical analysis of GC enrichment of mTOR pathway proteins and controls, shown in triplicate western blots of homogenate (input) and GC fraction pairs, derived from six independent preps. GAP43 is positive control for enrichment; GM130 is a negative control. Quantification as in Fig. 5. b, Close-ups of GCs from callosal projection neurons immunelabelled for endogenous mTOR pathway proteins (red in overlays, heat-mapped in underlying panels). Five example GCs are shown per sample to capture the representative range. Neurons were labelled via in utero electroporation at E15 with membrane-GFP (green in overlays, outlined in underlying panels), cultured at P0, fixed and stained at DIV2–DIV3. mTOR, LARP1, TSC1 and raptor (mTORC1 marker) appear in dense local foci within GCs. RICTOR (mTORC2 marker) and LAMP1 (lysosome marker) appear in fine granules distinct from GC foci. Bar (bottom right) indicates heat-map colour range, as well as 10-μm scale. 83 GCs imaged for mTOR, 47 for LARP1, 42 for LAMP1, 49 for TSC1, 26 for raptor, and 30 for RICTOR, from a minimum of n = 3 biological replicates from independent in utero electroporations.
Extended Data Fig. 9. GC-specific mTOR localization.
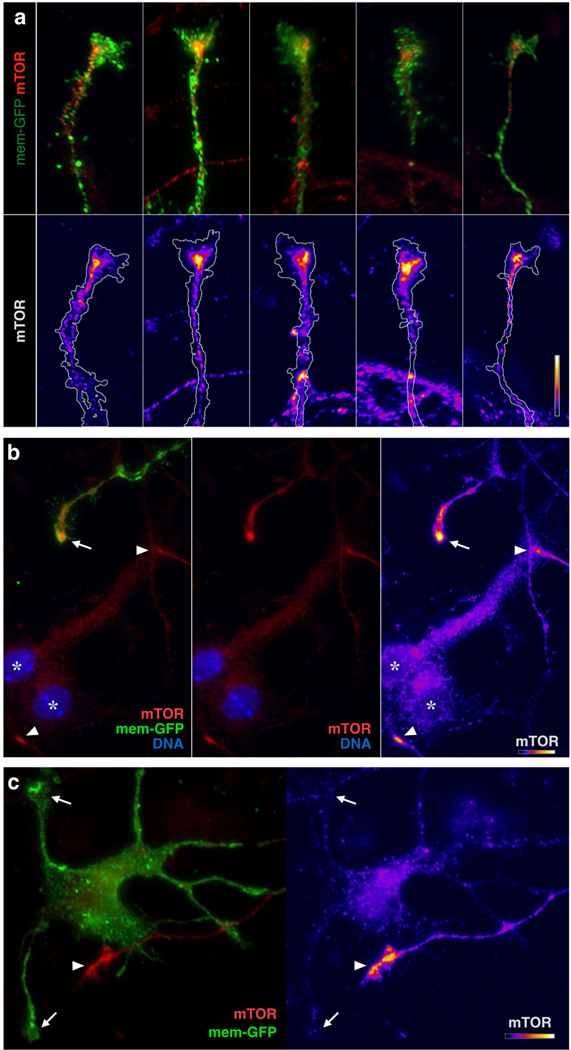
a, High-magnification views of representative GCs from callosal projection neurons immunolabelled for mTOR, equivalent to Fig. 5c and Extended Data Fig. 8b mTOR panels, but with a distinct mTOR antibody to independently confirm dense focal mTOR in GCs. Top, overlay images; bottom, heat maps of the same GCs. b, Example of mTOR labelling (red in two left panels; heat map in right panel) in 3-day-cultured neurons. A GFP-labelled axon from an electroporated inter-hemispheric neuron displays dense focal mTOR in its GC (arrow) compared to adjacent cell bodies (asterisks; DNA in blue indicates nuclei). Two other unlabelled GCs in the field can be recognized by virtue of their dense focal mTOR labelling alone (arrowheads). c, Example of dendritic GCs (arrows) lacking mTOR, juxtaposed to an unlabelled GC (arrowhead) with prominent mTOR focus. Bars in a–c (bottom right of each) indicate mTOR intensity heat-map colour range, as well as 10-µm scale. GCs imaged from n = 2 biological replicates from independent in utero electroporations.
Extended Data Fig. 10. mTOR signalling is required for the extension of trans-hemispheric axons.
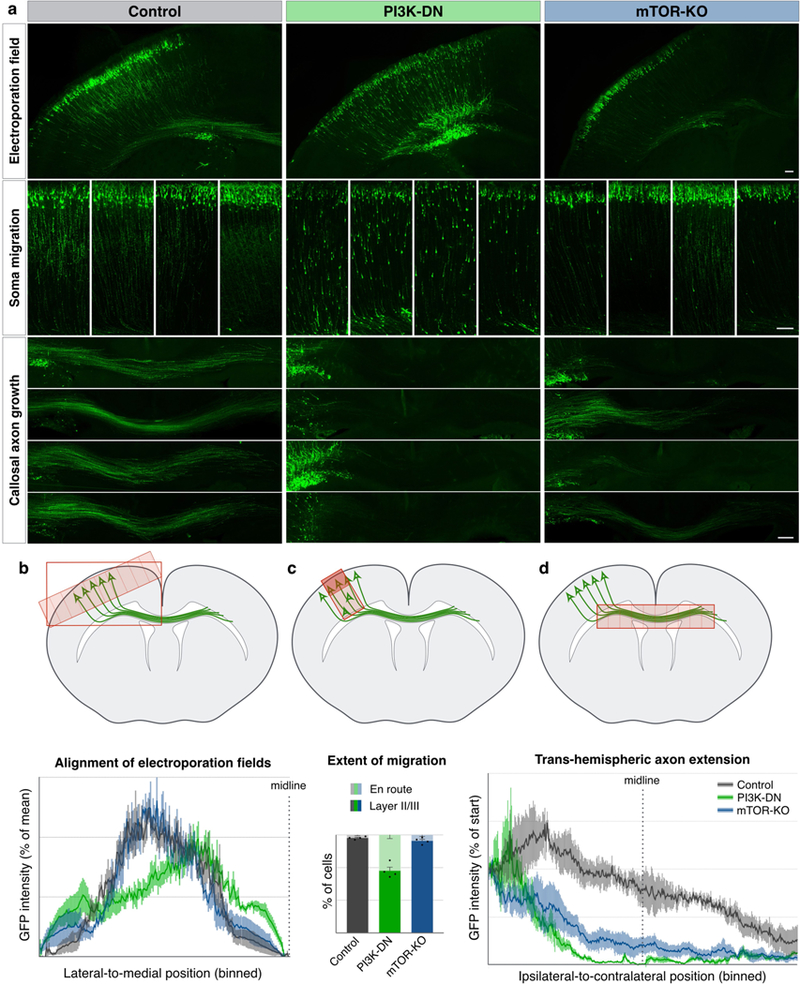
a, Data relate to Fig. 6. Electroporation of callosal projection neurons with GFP and genetic payloads at E15, fixation and analysis at P3. Control electroporations (left column, grey in quantifications) show soma migration into upper layers (middle row insets, examples from four brains), and callosal projections well into the contralateral cortex (bottom insets, examples from four brains). Electroporation with PI3K-DN (middle column, green in quantifications) hinders migration of somata, with failure of callosal axon growth. Electroporation of Cre in mice with homozygous floxed-mTOR alleles for conditional mTOR gene knockout (mTOR-KO, right column, blue in quantifications) results specifically in failure of callosal axon growth. Scale bars, 100 µm. b, Quantification of the location of the electroporation field shows comparable mediolateral electroporation positions across all samples. Plotted are histograms of binned GFP intensities along the tangential axis of the ipsilateral cortex ending at the midline, as schematized above. c, Quantification of extent of migration, with percentage of somata in layers II/III (dark colours in graph) versus somata still en route in deeper layers (light colours in graph), as schematized above. Inhibition of PI3K signalling (green) interferes with migration, whereas acute mTOR deletion (blue) does not significantly affect migration. d, Quantification of callosal axon extension, showing that PI3K inhibition (green) as well as knockout of mTOR (blue) disrupt the formation of axon projection across the corpus callosum. Plotted are binned GFP intensity histograms within the corpus callosum from ipsilateral, through the midline (indicated by dotted line), to the contralateral side, as schematized above. Data are mean ± s.e.m. from n = 4 mice from different litters for each condition.
Supplementary Material
Supplementary Table 1: Inter-hemispheric GC sub-proteome. List of proteins that are detected by mass-spec from sorted inter-hemispheric GCs. Columns correspond to gene names, protein names, theoretical protein molecular weight, and ENSEMBL gene ID.
Supplementary Table 2: GC-soma proteome mapping. List of protein GC-soma ratios ΛP. Columns correspond to gene names, ΛP values (log2), specific enrichment based on significance threshold set to 0.05 permutation-based false discovery rate (FDR), two-tailed t-test P-values (-log), protein names, and gene group. n=6 biological replicates from 3–6 litters each.
Supplementary Table 3: Protein GC-soma annotation enrichment. List of significantly enriched Gene Ontology (GO) terms based on ΛP values. Columns correspond to term type (GO-Biological Function, GO-Cellular Component, and GO-Molecular Function), term name, number of genes, rank distribution score57, two-tailed t-test P-value, significance based on Benjamini-Hochberg corrected FDR, and mean ΛP value.
Supplementary Table 4: GC-soma RNA mapping. List of mRNA GC-soma ratios ΛR. Columns correspond to gene names, ΛR values (log2), specific enrichment based on significance threshold set to 0.05 permutation-based FDR, two-tailed t-test P-values (- log), gene names, and gene group. n=6 biological replicates from 3–6 litters each.
Supplementary Table 5: mRNA GC-soma annotation enrichment. List of significantly enriched Gene Ontology (GO) terms based on ΛR values. Columns correspond to term type (GO-Biological Function, GO-Cellular Component, and GO-Molecular Function), term name, number of genes, rank distribution score55, two-tailed t-test P-value, significance threshold of 0.02 Benjamini-Hochberg corrected FDR, and mean ΛR value.
Supplementary Table 6: 2D RNA-proteome GC-soma annotation enrichment. List of significantly enriched Gene Ontology (GO) and gene group terms based on paired ΛP and ΛR values. Columns correspond to term type (GO-Biological Function, GO-Cellular Component, GO-Molecular Function, and gene group), term name, number of genes, two-tailed t-test P-value, significance threshold of 0.02 Benjamini-Hochberg corrected FDR, mean ΛR, and mean ΛP values.
Supplementary Table 7: Gene groups. List of gene names and ENSEMBL gene IDs that constitute the annotated gene groups in Fig. 2, Fig. 3, Extended Data Fig.5, and Supplementary Table 6.
Figure 7. Subcellular RNA-proteome mapping.
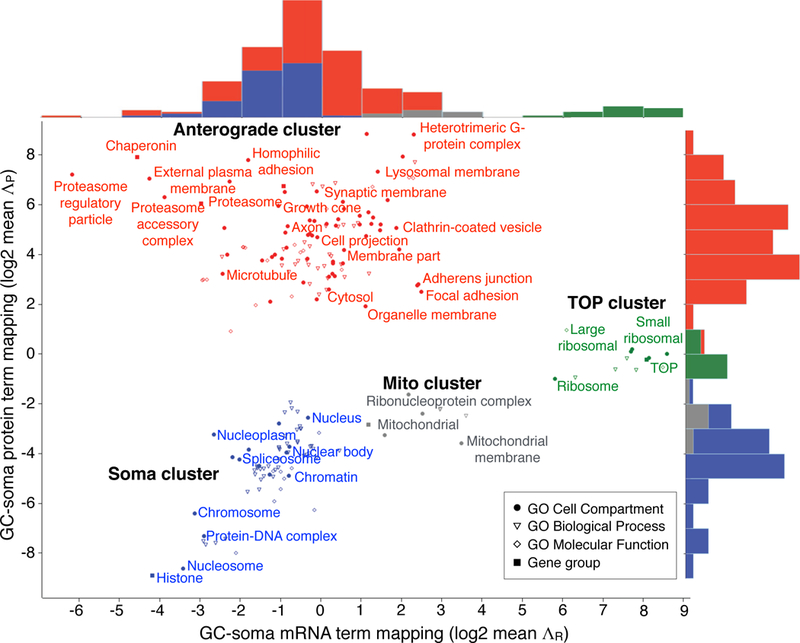
2D RNA-proteome mapping of statistically significant enrichments in Gene Ontology (GO) terms and gene groups defined in Supplementary Table 7. Labels are displayed for non-redundant GO Cell Compartment terms and gene group. Top histograms show x-axis RNA distributions of mean ΛR (log2), right-side histograms show y-axis protein distributions of mean ΛP (log2) of genes within each group. Four clusters emerge: the Soma cluster (blue) contains groups of genes with both mRNA and protein enriched in the soma; the Anterograde cluster (red) contains groups of genes with mRNA mapping to soma and protein to GC; the Mito cluster (grey) contains mitochondrial genes with intermediate distributions; and the TOP cluster (green) exclusively contains TOP transcripts (including ribosomal protein genes), with mRNAs mapping to the GC and proteins to both GC and soma.
Acknowledgements
We thank Anna-Katerina Hadjantonakis (Sloan Kettering) and Shankar Srinivas (Oxford) for reagents; Ben Noble and Ioana Florea for technical support; Joyce LaVecchio, Girijesh Buruzula, and Silvia Ionescu of HSCRB-HSCI Flow Cytometry Core; William Lane, John Neveu, and Bogdan Budnik of the Harvard FAS CSB Mass Spectrometry and Proteomics Resource Lab; Liming Liang (PGSG, Harvard Chan School of Public Health) for statistical advice; Nils Brose (Max Planck), Christoph Biesemann (Max Planck), Etienne Herzog (Bordeaux), Leon Reijmers (Tufts), and John Rinn (Harvard) for insightful discussions. This work was supported by grants to J.D.M. from the Paul G. Allen Frontiers Group, Brain Research Foundation Scientific Innovations Award program; NIH Pioneer Award DP1 NS106665, Emily and Robert Pearlstein Fund, and the Max and Anne Wien Professorship; with additional infrastructure support from NIH grants NS045523, NS075672, NS049553, and NS041590. A.P. was partially supported by a European Molecular Biology Organization Long Term Fellowship and a Human Frontier Science Program Long Term Fellowship. A.M. was partially supported by NIH Training Grant T32 AG000222. Work by R.K. and the Harvard Chan Bioinformatics Core was supported by funds from the Harvard NeuroDiscovery Center and Harvard Stem Cell Institute. J.D.M. is an Allen Distinguished Investigator of the Paul G. Allen Frontiers Group.
Footnotes
Author Information The authors declare no active competing financial interests. A US patent application is pending on growth cone sorting technology and implications.
References
- 1.Lowery LA & Van Vactor D The trip of the tip: understanding the growth cone machinery. Nat Rev Mol Cell Biol 10, 332–343 (2009). [DOI] [PMC free article] [PubMed] [Google Scholar]
- 2.Saxton RA & Sabatini DM mTOR Signaling in Growth, Metabolism, and Disease. Cell 168, 960–976 (2017). [DOI] [PMC free article] [PubMed] [Google Scholar]
- 3.Meyuhas O, Avni D & Shama S in Translational Control 30, 363–388 (Cold Spring Harbor Laboratory Press, 1996). [Google Scholar]
- 4.Fonseca BD et al. La-related Protein 1 (LARP1) Represses Terminal Oligopyrimidine (TOP) mRNA Translation Downstream of mTOR Complex 1 (mTORC1). J Biol Chem 290, 15996–16020 (2015). [DOI] [PMC free article] [PubMed] [Google Scholar]
- 5.Greig LC, Woodworth MB, Galazo MJ, Padmanabhan H & Macklis JD Molecular logic of neocortical projection neuron specification, development and diversity. Nat Rev Neurosci 14, 755–769 (2013). [DOI] [PMC free article] [PubMed] [Google Scholar]
- 6.Pfenninger KH, Ellis L, Johnson MP, Friedman LB & Somlo S Nerve growth cones isolated from fetal rat brain: subcellular fractionation and characterization. Cell 35, 573–584 (1983). [DOI] [PubMed] [Google Scholar]
- 7.Lohse K et al. Axonal origin and purity of growth cones isolated from fetal rat brain. Brain Res Dev Brain Res 96, 83–96 (1996). [DOI] [PubMed] [Google Scholar]
- 8.Fame RM, MacDonald JL & Macklis JD Development, specification, and diversity of callosal projection neurons. Trends Neurosci 34, 41–50 (2011). [DOI] [PMC free article] [PubMed] [Google Scholar]
- 9.Greig LC, Woodworth MB, Greppi C & Macklis JD Ctip1 controls acquisition of sensory area identity and establishment of sensory input fields in the developing neocortex. Neuron 90, 261–277 (2016). [DOI] [PMC free article] [PubMed] [Google Scholar]
- 10.Llorca O et al. Eukaryotic type II chaperonin CCT interacts with actin through specific subunits. Nature 402, 693–696 (1999). [DOI] [PubMed] [Google Scholar]
- 11.Moccia R et al. An unbiased cDNA library prepared from isolated Aplysia sensory neuron processes is enriched for cytoskeletal and translational mRNAs. J Neurosci 23, 9409–9417 (2003). [DOI] [PMC free article] [PubMed] [Google Scholar]
- 12.Leung K-M et al. Asymmetrical beta-actin mRNA translation in growth cones mediates attractive turning to netrin-1. Nat Neurosci 9, 1247–1256 (2006). [DOI] [PMC free article] [PubMed] [Google Scholar]
- 13.Crino PB & Eberwine J Molecular characterization of the dendritic growth cone: regulated mRNA transport and local protein synthesis. Neuron 17, 1173–1187 (1996). [DOI] [PubMed] [Google Scholar]
- 14.Taylor AM et al. Axonal mRNA in uninjured and regenerating cortical mammalian axons. J Neurosci 29, 4697–4707 (2009). [DOI] [PMC free article] [PubMed] [Google Scholar]
- 15.Zivraj KH et al. Subcellular profiling reveals distinct and developmentally regulated repertoire of growth cone mRNAs. J Neurosci 30, 15464–15478 (2010). [DOI] [PMC free article] [PubMed] [Google Scholar]
- 16.Jung H, Yoon BC & Holt CE Axonal mRNA localization and local protein synthesis in nervous system assembly, maintenance and repair. Nat Rev Neurosci 13, 308–324 (2012). [DOI] [PMC free article] [PubMed] [Google Scholar]
- 17.Catapano LA, Arnold MW, Perez FA & Macklis JD Specific neurotrophic factors support the survival of cortical projection neurons at distinct stages of development. J Neurosci 21, 8863–8872 (2001). [DOI] [PMC free article] [PubMed] [Google Scholar]
- 18.Arlotta P et al. Neuronal subtype-specific genes that control corticospinal motor neuron development in vivo. Neuron 45, 207–221 (2005). [DOI] [PubMed] [Google Scholar]
- 19.Ozdinler PH & Macklis JD IGF-I specifically enhances axon outgrowth of corticospinal motor neurons. Nat Neurosci 9, 1371–1381 (2006). [DOI] [PubMed] [Google Scholar]
- 20.Meyuhas O & Kahan T The race to decipher the top secrets of TOP mRNAs. Biochim Biophys Acta 1849, 801–811 (2015). [DOI] [PubMed] [Google Scholar]
- 21.Geiger T, Wehner A, Schaab C, Cox J & Mann M Comparative proteomic analysis of eleven common cell lines reveals ubiquitous but varying expression of most proteins. Mol Cell Proteomics 11, M111.014050 (2012). [DOI] [PMC free article] [PubMed] [Google Scholar]
- 22.Liebermeister W et al. Visual account of protein investment in cellular functions. Proc Natl Acad Sci U S A 111, 8488–8493 (2014). [DOI] [PMC free article] [PubMed] [Google Scholar]
- 23.Tang H et al. Amino acid-induced translation of TOP mRNAs is fully dependent on phosphatidylinositol 3-kinase-mediated signaling, is partially inhibited by rapamycin, and is independent of S6K1 and rpS6 phosphorylation. Mol Cell Biol 21, 8671–8683 (2001). [DOI] [PMC free article] [PubMed] [Google Scholar]
- 24.Thoreen CC et al. A unifying model for mTORC1-mediated regulation of mRNA translation. Nature 485, 109–113 (2012). [DOI] [PMC free article] [PubMed] [Google Scholar]
- 25.Laplante M & Sabatini DM mTOR signaling in growth control and disease. Cell 149, 274–293 (2012). [DOI] [PMC free article] [PubMed] [Google Scholar]
- 26.Kye MJ et al. SMN regulates axonal local translation via miR-183/mTOR pathway. Hum Mol Genet 23, 6318–6331 (2014). [DOI] [PMC free article] [PubMed] [Google Scholar]
- 27.Tcherkezian J et al. Proteomic analysis of cap-dependent translation identifies LARP1 as a key regulator of 5’TOP mRNA translation. Genes Dev 28, 357–371 (2014). [DOI] [PMC free article] [PubMed] [Google Scholar]
- 28.Dhand R et al. PI 3-kinase: structural and functional analysis of intersubunit interactions. EMBO J 13, 511–521 (1994). [DOI] [PMC free article] [PubMed] [Google Scholar]
- 29.Itoh Y et al. PDK1-Akt pathway regulates radial neuronal migration and microtubules in the developing mouse neocortex. Proc Natl Acad Sci U S A 113, E2955–64 (2016). [DOI] [PMC free article] [PubMed] [Google Scholar]
- 30.Lu Y, Belin S & He Z Signaling regulations of neuronal regenerative ability. Curr Opin Neurobiol 27, 135–142 (2014). [DOI] [PMC free article] [PubMed] [Google Scholar]
Associated Data
This section collects any data citations, data availability statements, or supplementary materials included in this article.
Supplementary Materials
Supplementary Table 1: Inter-hemispheric GC sub-proteome. List of proteins that are detected by mass-spec from sorted inter-hemispheric GCs. Columns correspond to gene names, protein names, theoretical protein molecular weight, and ENSEMBL gene ID.
Supplementary Table 2: GC-soma proteome mapping. List of protein GC-soma ratios ΛP. Columns correspond to gene names, ΛP values (log2), specific enrichment based on significance threshold set to 0.05 permutation-based false discovery rate (FDR), two-tailed t-test P-values (-log), protein names, and gene group. n=6 biological replicates from 3–6 litters each.
Supplementary Table 3: Protein GC-soma annotation enrichment. List of significantly enriched Gene Ontology (GO) terms based on ΛP values. Columns correspond to term type (GO-Biological Function, GO-Cellular Component, and GO-Molecular Function), term name, number of genes, rank distribution score57, two-tailed t-test P-value, significance based on Benjamini-Hochberg corrected FDR, and mean ΛP value.
Supplementary Table 4: GC-soma RNA mapping. List of mRNA GC-soma ratios ΛR. Columns correspond to gene names, ΛR values (log2), specific enrichment based on significance threshold set to 0.05 permutation-based FDR, two-tailed t-test P-values (- log), gene names, and gene group. n=6 biological replicates from 3–6 litters each.
Supplementary Table 5: mRNA GC-soma annotation enrichment. List of significantly enriched Gene Ontology (GO) terms based on ΛR values. Columns correspond to term type (GO-Biological Function, GO-Cellular Component, and GO-Molecular Function), term name, number of genes, rank distribution score55, two-tailed t-test P-value, significance threshold of 0.02 Benjamini-Hochberg corrected FDR, and mean ΛR value.
Supplementary Table 6: 2D RNA-proteome GC-soma annotation enrichment. List of significantly enriched Gene Ontology (GO) and gene group terms based on paired ΛP and ΛR values. Columns correspond to term type (GO-Biological Function, GO-Cellular Component, GO-Molecular Function, and gene group), term name, number of genes, two-tailed t-test P-value, significance threshold of 0.02 Benjamini-Hochberg corrected FDR, mean ΛR, and mean ΛP values.
Supplementary Table 7: Gene groups. List of gene names and ENSEMBL gene IDs that constitute the annotated gene groups in Fig. 2, Fig. 3, Extended Data Fig.5, and Supplementary Table 6.


